
Abstract
Real-time quantitative polymerase chain reaction (qPCR) testing for Mycobacterium avium subspecies paratuberculosis (MAP) in fecal samples is a rapid alternative to culture on Herrold egg yolk medium (HEYM), the traditional antemortem reference test for MAP. Although the sensitivity and specificity of these 2 tests have been estimated based on dichotomized test results, the correlation between real-time qPCR threshold cycle (Ct) values and colony-forming units (CFU) on HEYM for fresh and thawed samples has not been evaluated. The objectives of the present study were to estimate the correlation and association between Ct and CFU in fresh and thawed pooled fecal and environmental samples. Results of HEYM culture of 1,997 pooled fecal samples from cows in 14 herds, and 802 environmental samples from 109 dairies nationwide were negatively (inversely) correlated with their respective real-time qPCR results. The Spearman's rank correlation between Ct and CFU was good (–0.66) in fresh and thawed pooled fecal samples, and excellent (–0.76) and good (–0.61) in fresh and thawed environmental samples, respectively. The correlation varied from good (–0.53) to excellent (–0.90) depending on the number of samples in a fecal pool. Truncated regression models indicated a significant negative association between Ct and CFU in fecal pools and environmental samples. The use of real-time qPCR instead of HEYM can yield rapid, quantitative estimates of MAP load and allow for incorporation of real-time qPCR results of pooled and environmental samples in testing strategies to identify dairy cow groups with the highest MAP shedding.
Keywords
Introduction
Diagnostic testing for Mycobacterium avium subspecies paratuberculosis (MAP), the etiologic agent for Johne's disease, remains one of the linchpins for management and successful control of this infectious disease, which is present on more than 68% of U.S. dairy farms (U.S. Department of Agriculture [USDA], Animal and Plant Health Inspection Service, Veterinary Services: 2008, Johne's disease on U.S. dairies, 1991–2007. Available at http://www.aphis.usda.gov/vs/ceah/ncahs/nahms/dairy/dairy07/Dairy07_is_Johnes.pdf. Accessed April 16, 2010). Environmental sampling of fecal slurry and wastewater lagoon is a commonly used diagnostic strategy for herd classification of MAP infection (USDA, Animal and Plant Health Inspection Service, Veterinary Services: 2006, Uniform program standards for the voluntary bovine Johne's disease control program. Available at http://www.aphis.usda.gov/animal_health/animal_diseases/johnes/downloads/johnes-umr.pdf. Accessed May 27, 2010) and can be used to rank cow pens by MAP bioburden for subsequent testing of cow groups that contribute the most MAP to the dairy environment. 2 Culture on Herrold egg yolk medium (HEYM) has long been considered the antemortem gold standard test for MAP because it is 100% specific and more sensitive than either milk or serum enzyme-linked immunosorbent assay testing. 3 The turnaround time of 16 weeks for HEYM culture results for MAP adds to the challenge of incorporating this information in Johne's disease control programs. 4 With the introduction of real-time polymerase chain reaction (PCR) targeting the single copy hspX gene 5 into many diagnostic laboratories in the United States (USDA, Animal and Plant Health Inspection Service, Veterinary Services: 2008, APHIS-approved laboratories, Johne's disease, organism-based methods. Available at http://www.aphis.usda.gov/animal_health/lab_info_services/downloads/ApprovedLabs_Johnes_organism.pdf. Accessed April 16, 2010), quantitative estimates of MAP load in a fecal sample may be available within 48 hr. In a prior study, the sensitivity and specificity of real-time PCR were comparable to culture on solid and in liquid media. 1 In addition, the rapid turnaround time for real-time PCR test results combined with the use of pooled individual cow fecal or environmental samples may allow for classification of cow groups into risk categories as an initial step in a diagnostic strategy to detect cows shedding large numbers of MAP organisms in feces. 2,13,14 Although the correlation and association between real-time PCR and HEYM culture results for fresh environmental samples collected from free-stall dairies using a standardized sampling protocol was excellent, 2 the correlation in test results of environmental samples collected from other dairy housing systems and using nonstandardized sampling methods has not been estimated. Furthermore, individual and pooled fecal samples from large dairies are often stored at −70°C and thawed prior to testing because the number of samples exceeds laboratory single-batch testing capacity, and the correlation between HEYM and real-time quantitative (q)PCR results for fresh and thawed pooled fecal samples has not been evaluated. The objective of the current study was to estimate the correlation and association between MAP colony-forming unit (CFU) counts on HEYM and threshold cycle (Ct) values of a USDA-licensed real-time qPCR test in pooled individual cow fecal samples and environmental samples for both fresh and thawed samples.
Materials and methods
Sample collection
Pooled fecal samples. Individual cow fecal samples were collected from a single California dairy herd (3,577 cows), 10 Pennsylvania dairy herds (mean: 238 cows, range: 61–762 cows) enrolled in the National Johne's Disease Demonstration herd project in the Commonwealth of Pennsylvania, and 3 dairy herds from Pennsylvania, Vermont, and New York (110, 140, and 330 cows, respectively) enrolled in the USDA–Regional Dairy Quality Management Alliance (RDQMA) Project. 11 The California herd had a MAP prevalence of 4% based on routine testing of fecal samples of dry cows by liquid culture, a the 10 Pennsylvania herds had a mean MAP prevalence of 4% (range: 1–9%), and the 3 RDQMA herds had a MAP prevalence of 3%, 1%, and 3%, respectively, based on HEYM fecal culture. Fecal samples were used to create pools of 5, 50, 100, and a single whole-herd pool except for samples from the California herd, which were grouped into pools of 10.
Each fecal sample was collected per rectum (using a new plastic disposable sleeve) from individual adult cows and placed in a 50-ml prelabeled container. Samples were shipped overnight on ice in Styrofoam boxes to the Johne's Research Laboratory (JRL) at the University of Pennsylvania (Kennett Square, Pennsylvania) except for samples from the 10 Pennsylvania demonstration herds, which were first shipped to the Pennsylvania Animal Diagnostic Laboratory System (Harrisburg, Pennsylvania) before transfer to the JRL. At the JRL, samples were stored in a −70°C freezer for later testing unless scheduled to be tested fresh. Frozen samples were thawed at room temperature on the day they were to be processed for culture and real-time qPCR testing.
Environmental samples. Environmental samples were collected from the 10 demonstration herds and the 3 RDQMA herds from which pooled fecal samples were collected. In addition, 6 environmental samples from each of 96 dairies systematically selected from the 524 dairies (approximately every fifth dairy was selected) that participated in the 2007 USDA National Animal Health Monitoring System's (NAHMS) dairy study, phase II, were shipped from the National Veterinary Services Laboratory (Ames, Iowa) to the JRL (USDA, Animal and Plant Health Inspection Service, Veterinary Services: 2008, Johne's Disease on U.S. Dairies, 1991–2007). 10 In each herd, the 6 environmental samples were collected using a nonstandardized sampling protocol from a variety of adult cattle locations on the dairies including common pens, holding pens, cow traffic alleys, manure storage areas, lagoon, and manure-handling machinery such as gutter cleaners and manure spreaders. Furthermore, the 6 samples from each of the NAHMS herds were combined to create 96 pooled environmental samples. Environmental and pooled environmental samples were tested fresh except for samples from the 10 demonstration herds, which were stored in a −70°C freezer and thawed at room temperature before testing.
Sample preparation and testing
Culture method. Two grams of each individual cow's fecal sample was placed into 35 ml of sterile water in a conical tube. After rocking for 30 min and settling for another 30 min, 5 ml of supernatant were transferred to be part of a pool of n samples (n being 10 individual cow fecal samples for the California herd or 5, 50, 100, and whole herd for the remaining herds). The supernatant was transferred into a 50-ml sterile plastic tube for pools of 5 and 10 samples, or in a sterile glass bottle for pools of 50, 100, and whole-herd samples. Tubes were mixed using a mechanical shaker, and the bottles were mixed with a magnetic stir bar. Mixtures were then allowed to settle for 30 min. After settling, 20 ml of the pooled supernatant was dispensed into a 50-ml sterile conical tube for real-time qPCR testing, and 5 ml was dispensed into a single tube of half-strength brain heart infusion broth solution with hexadecylpyridinium chloride solution and processed for culture on each of 4 tubes of mycobactin-containing HEYM as previously described. 4 Trained and experienced JRL technicians counted the number of CFU in non-contaminated tubes every 2 weeks through 16 weeks of incubation. Tube readings were reported as integer values up to 75 CFU because of counting limitations. Tubes with >75 CFU were reported as 75–99, 100–149, 150–199, 200–249, 250–299, or ≥300 CFU. For each sample, the mean CFU of the noncontaminated tubes was calculated and used in the analysis. For CFU reported as a range, the lower limit was used in calculating the mean. Environmental samples and pooled environmental samples from each herd were processed and cultured similarly.
Real-time qPCR methods. In brief, the pooled supernatant (20 ml) allocated for real-time qPCR was centrifuged at 2,500 × g for 10 min and decanted, leaving approximately 1–2 ml of fluid along with the pellet. The pellet was resuspended and transferred to a bead beater tube and mixed using the bead beater b for 5 min to lyse the cells. The DNA was then extracted according to instructions from a USDA-licensed commercial kit, c and real-time qPCR performed d on each DNA sample, as previously described, 2 within 16 hr of extraction. Each DNA sample was analyzed for the MAP-specific sequence of the hspX gene.
Statistical analyses
Descriptive statistics. Samples from a total of 110 herds were tested, including repeat collections from the demonstration and the RDQMA herds (13 herds). Only samples taken from the same herd at least 12 months apart (13 herds) were included to minimize any potential correlation in results of sequential samples. The probability of collecting pooled or pen environmental samples at least a year apart that included fecal matter from the same cows was considered minimal given the continuous movement of cows between pens and herd turnover. Descriptive statistics and the Spearman's rank correlation coefficient between CFU and Ct were calculated for pooled fecal samples and environmental samples by fresh and thawed status.
The criteria for interpreting the Spearman's rank correlation, which ranges from −1 to +1 were as follows: greater than the absolute value of 0.75 as excellent, less than the absolute value of 0.40 as poor, and for absolute values between 0.40 and 0.75 as fair to good correlation. 7 For pools of 5, 50, 100, and the whole-herd samples, realtime qPCR results were plotted against HEYM culture results for both fresh and thawed samples and locally weighted scatterplot smoothing (LOWESS) was used to fit lines to the data. 6
Truncated linear regression. In the present study, the lowest real-time qPCR result, indicating the highest concentration of MAP in a sample, was 22 Ct. The Ct values within the range designated as test-negative by the real-time qPCR manufacturer (42–50 Ct) were truncated at 42 Ct and, hence, modeled using truncated linear regression. The predictor, CFU on HEYM, was categorized as 0–10, 11–50, 51–100, or >100. Separate models were run for fresh and thawed samples and for each of fecal pooled, environmental, and pooled environmental samples. The outcome (Ct) was distributed truncated normal; hence, a minimum of 50 observations was required for any model to justify use of asymptotic theory. 9 Asymptotic theory allows for interpretation of model results of an outcome that is not normally distributed because, as the number of observations increases, deviation from the assumed normal distribution approaches zero. In all models, standard errors were based on robust variance estimators to account for clustering of results within herds. All analyses were performed using a statistical software package. e
Results
Descriptive statistics
Correlations and descriptive statistics for CFU and Ct by fresh and thawed pooled fecal and environmental samples are presented in Table 1. The correlation in pooled fecal samples ranged from good (–0.53 and −0.55 in fresh and thawed, respectively) to excellent (–0.90 in both fresh and thawed). The overall correlation between CFU and Ct for pooled fecal samples was good and approximately equal in fresh and thawed samples (–0.66). In contrast, the overall correlation between CFU and Ct for environmental samples was excellent in fresh samples (–0.76) compared with good in thawed samples (–0.61). Figure 1 presents plots of real-time qPCR results against HEYM culture results for pools of 5, 50, 100, and the whole-herd samples and their LOWESS fitted lines for both fresh and thawed samples.
Truncated linear regression
Tables 2 and 3 present results of the models for both pooled fecal samples and environmental samples, respectively, and show a negative association between Ct and CFU. In each model, the predicted Ct for the reference group of 0–10 CFU was estimated by the model intercept since HEYM CFU was the only predictor. Compared with the reference group (0–10 CFU), the predicted Ct decreased as the CFU increased from one category to another. In both pooled and environmental samples, the decrease in predicted Ct was lowest when comparing the 11–50 CFU category with the reference, and the greatest when comparing the >100 CFU category with the reference. Furthermore, the decrease in Ct corresponding to an increase in CFU was greater in thawed than in fresh pools of 5 individual cow fecal samples (Table 2).
Descriptive statistics for colony-forming units (CFU) and threshold cycle (Ct) values of samples tested for Mycobacterium avium subsp. paratuberculosis (MAP) using culture on Herrold egg yolk medium and real-time quantitative polymerase chain reaction, respectively, of pooled individual cow fecal samples, environmental samples, and pooled environmental samples by fresh and thawed status at testing.
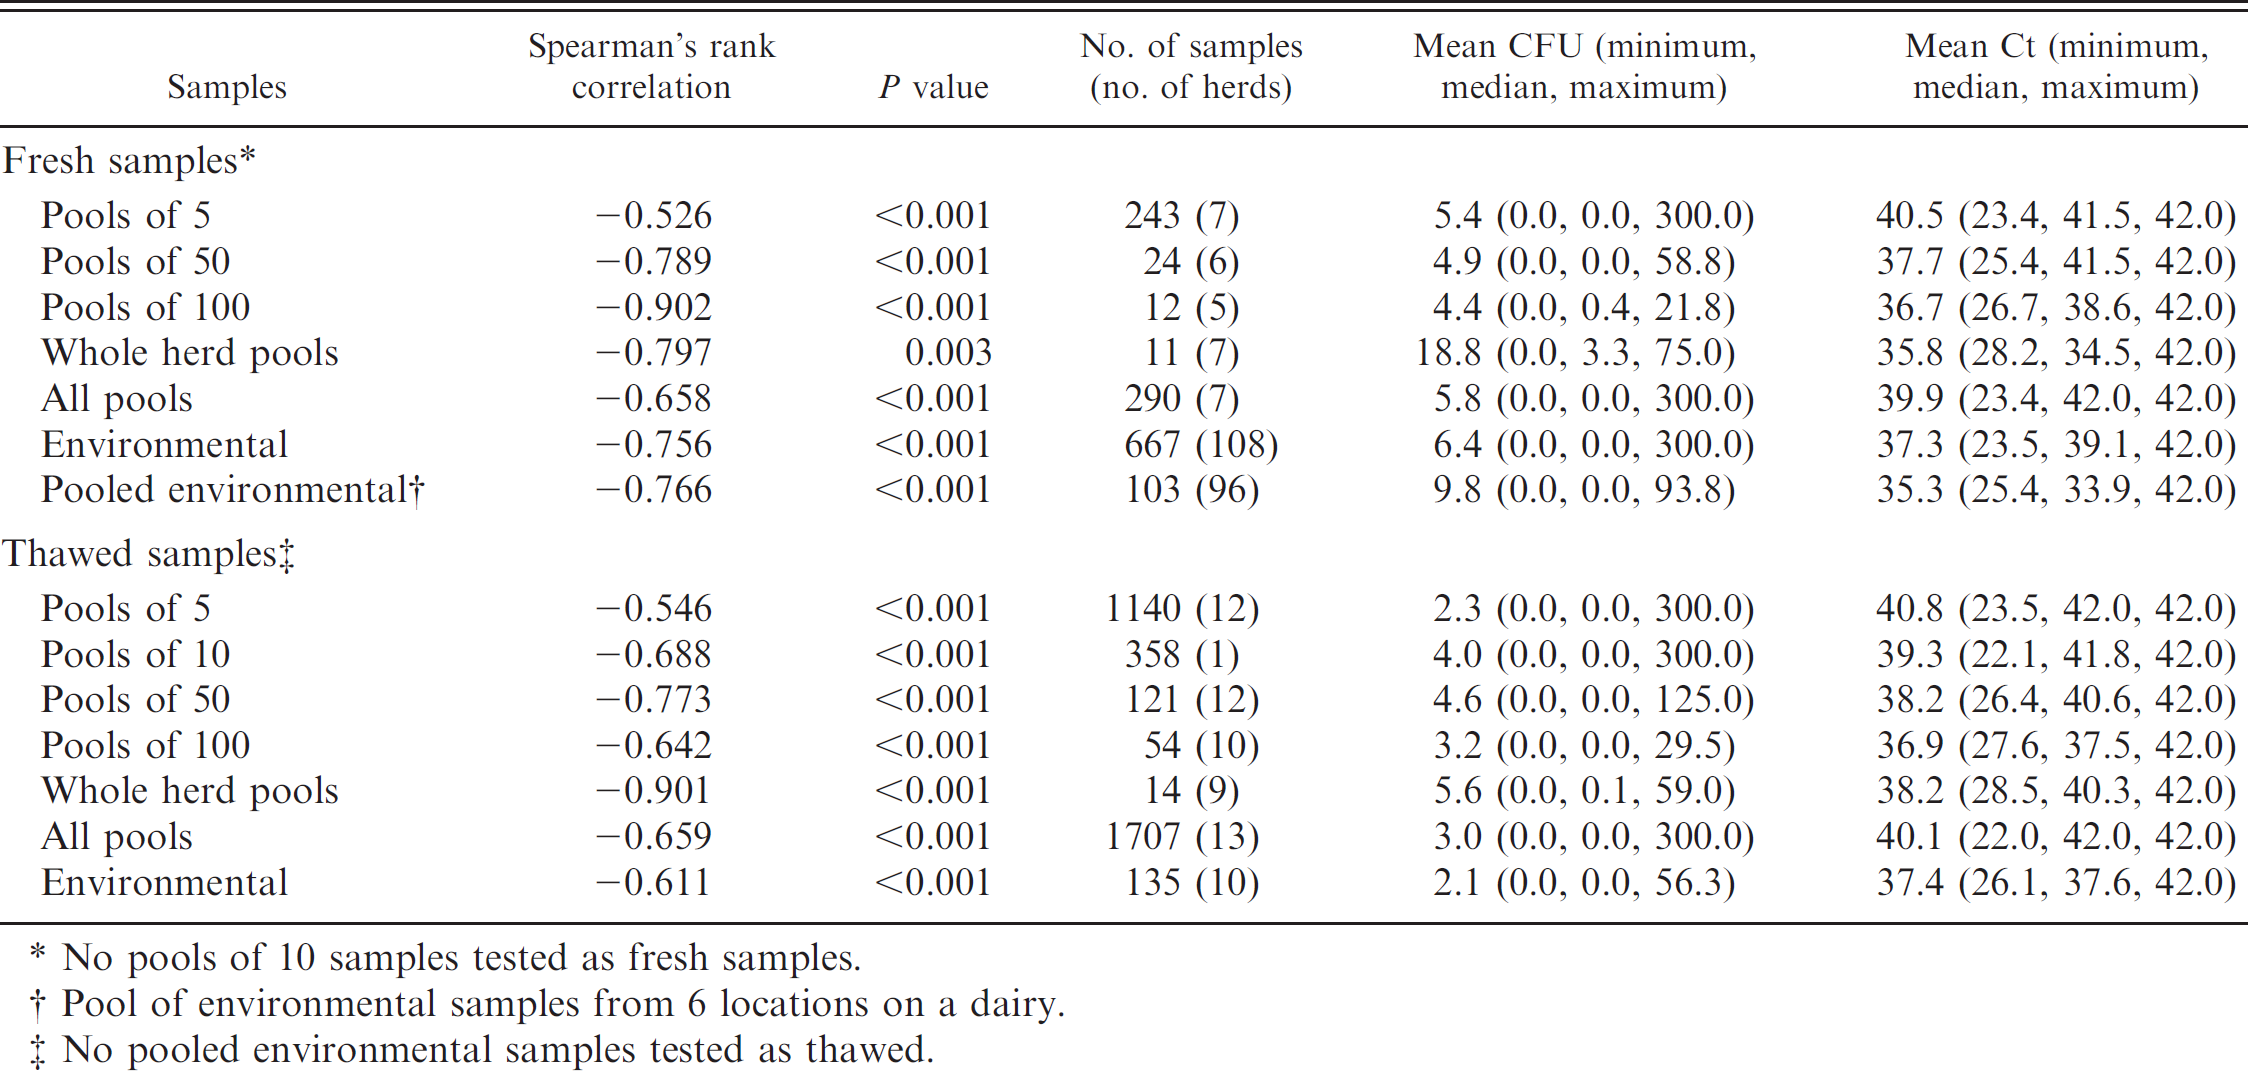
No pools of 10 samples tested as fresh samples.
Pool of environmental samples from 6 locations on a dairy.
No pooled environmental samples tested as thawed.
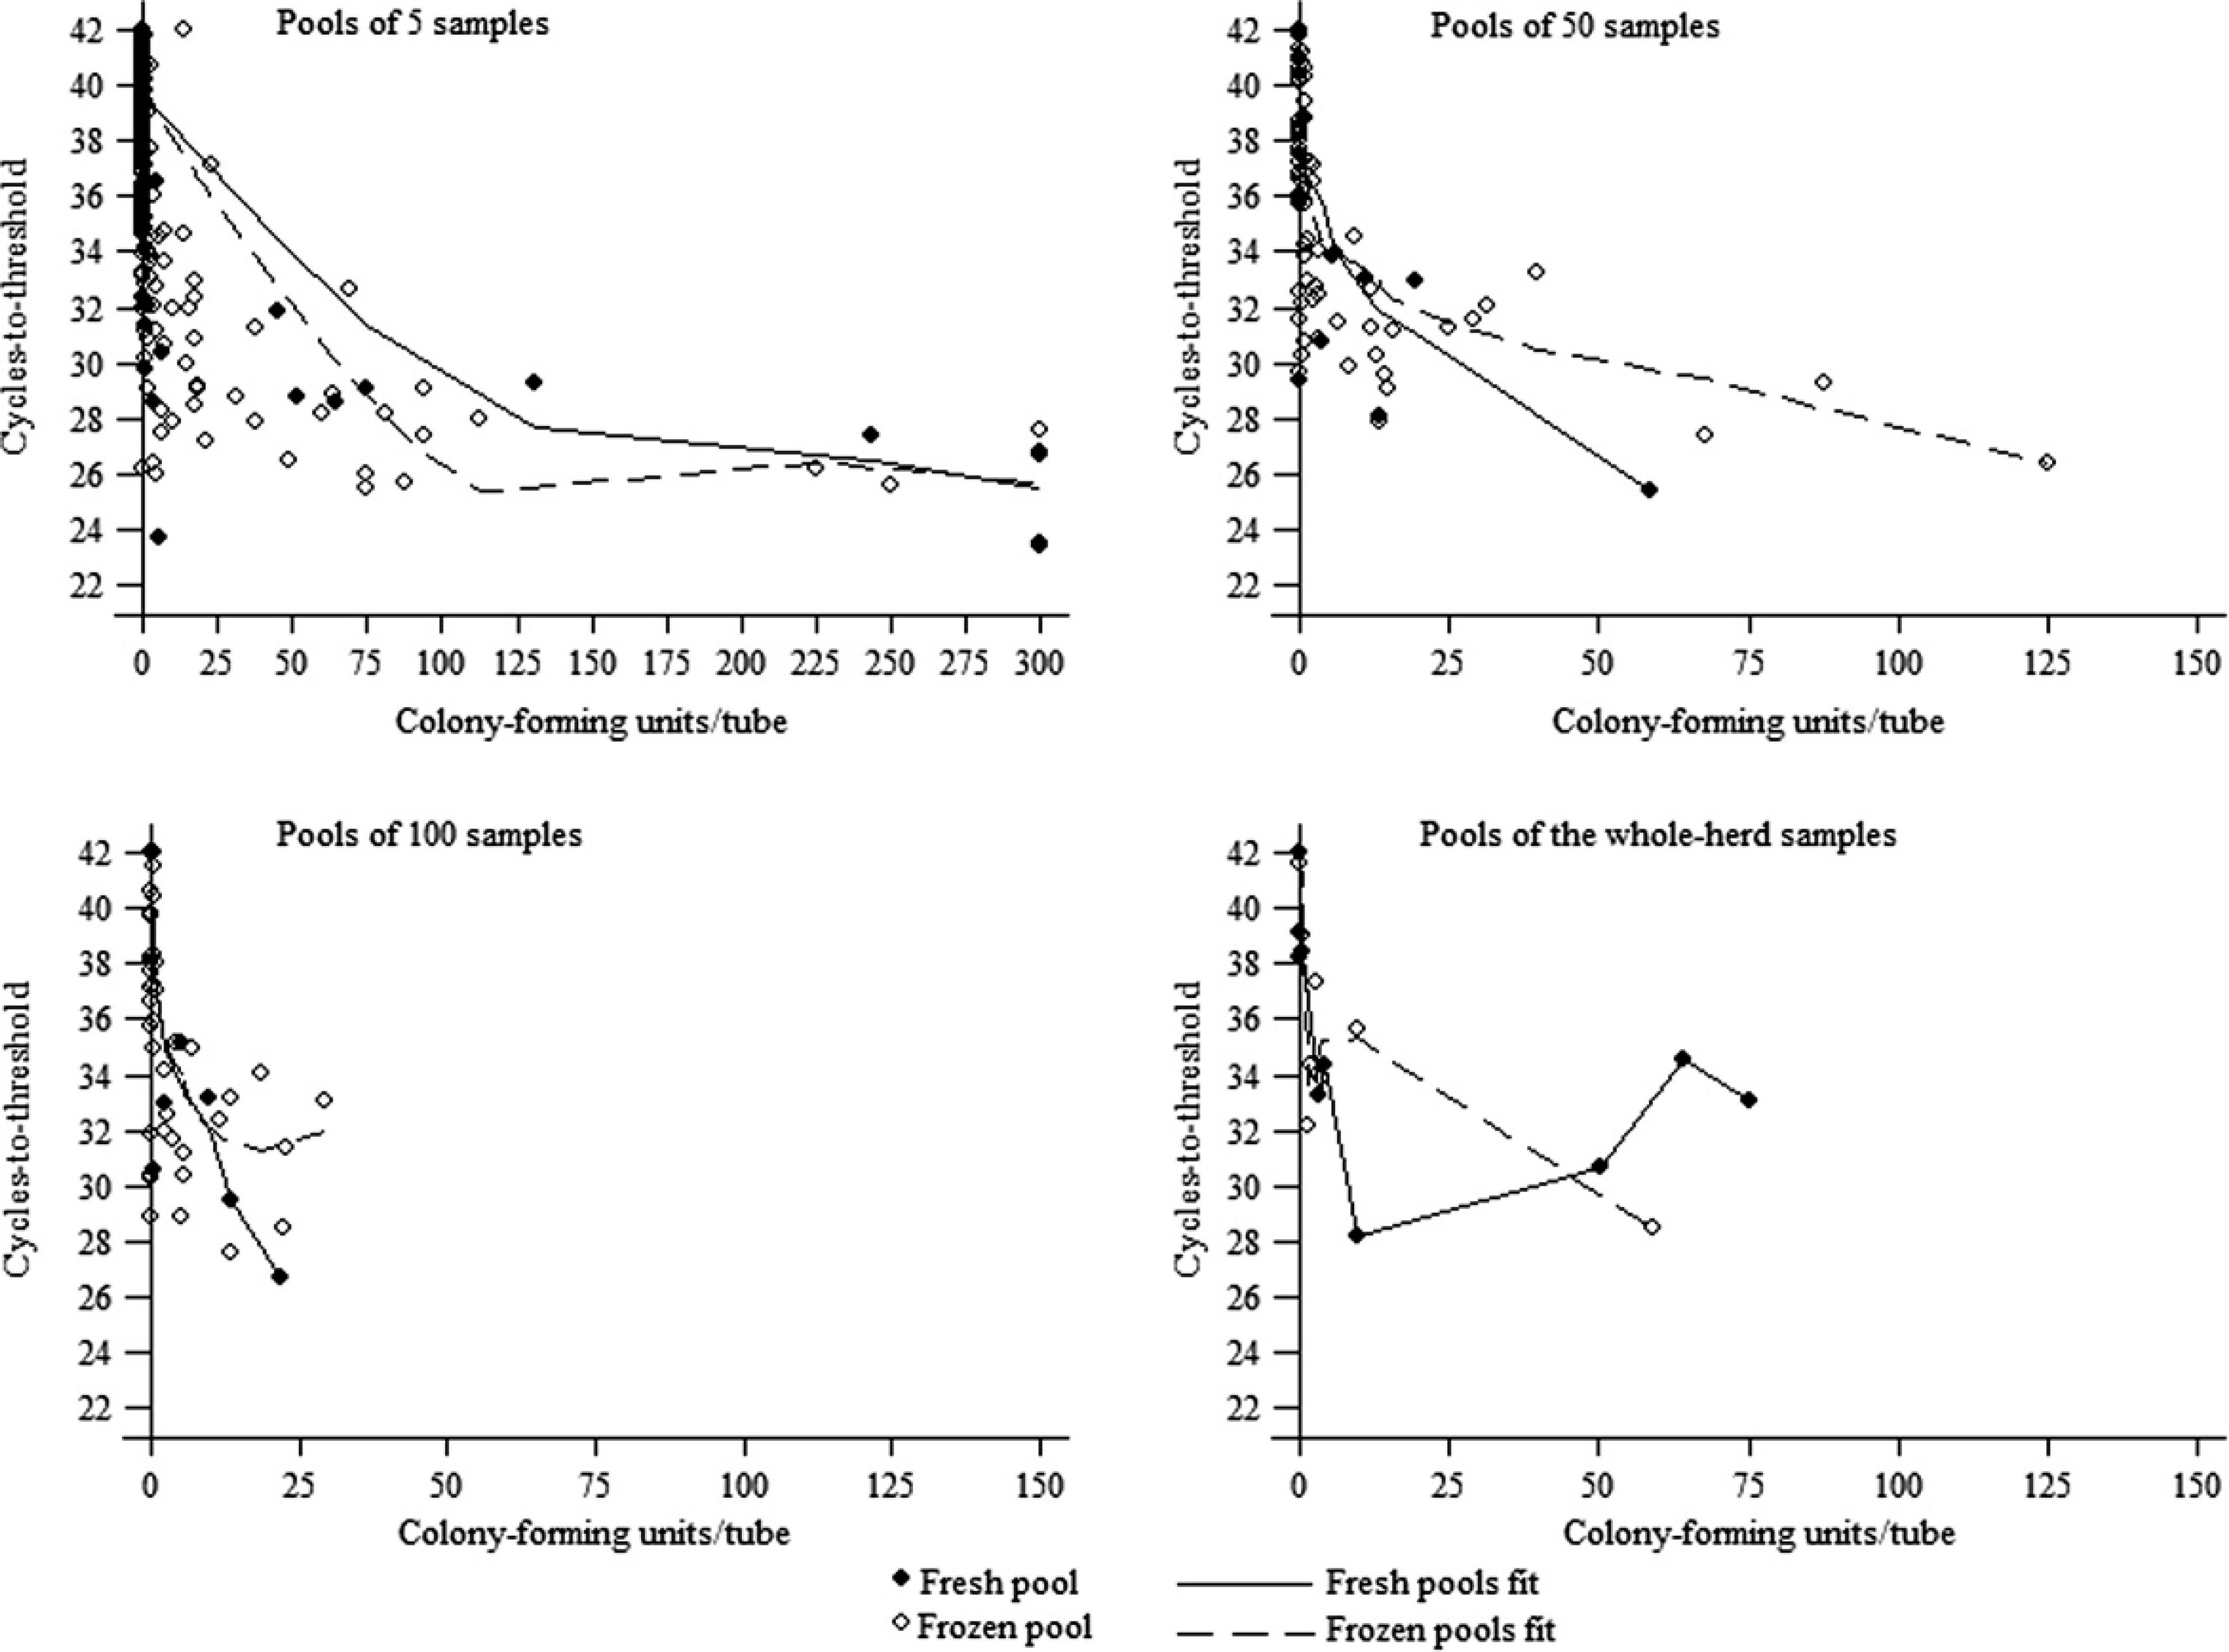
Plots of real-time quantitative polymerase chain reaction results (threshold cycle values) against Herrold egg yolk medium culture results (colony-forming units/tube) of Mycobacterium avium subsp. paratuberculosis in pooled fecal samples of 5, 50, 100, and whole-herd samples, and their locally weighted scatterplot smoothing fitted lines by fresh and thawed status.
Truncated linear regression coefficients (β) for the association between the number of colony-forming units (CFU) of Mycobacterium avium subsp. paratuberculosis (MAP) on Herrold egg yolk medium (HEYM) and threshold cycle (Ct) of real-time quantitative polymerase chain reaction for pooled individual cow fecal samples from 14 dairy herds. Separate models were run for fresh and thawed samples and by pool size. *
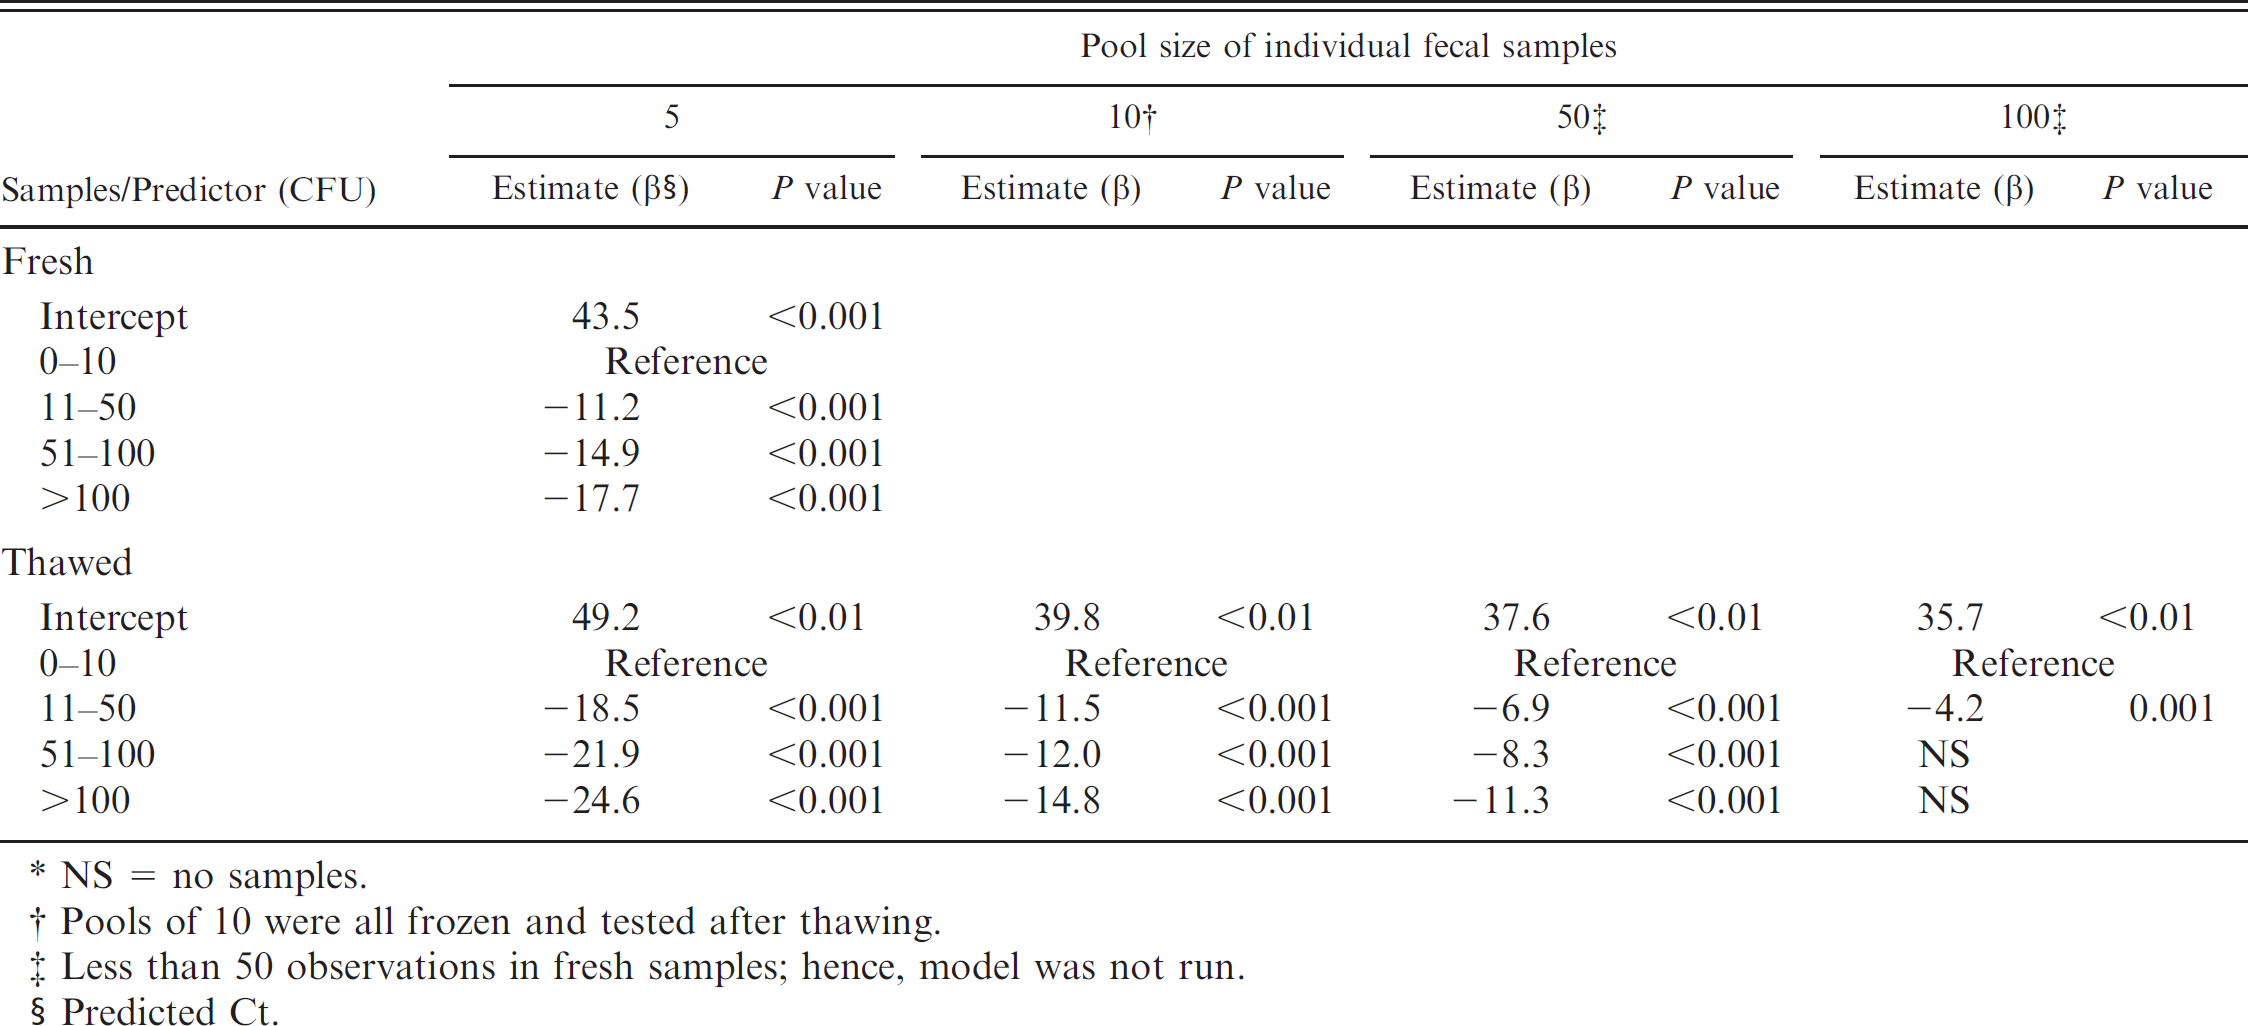
NS = no samples.
Pools of 10 were all frozen and tested after thawing.
Less than 50 observations in fresh samples; hence, model was not run.
Predicted Ct.
Truncated linear regression coefficients (β) for the association between the number of colony-forming units (CFU) of Mycobacterium avium subsp. paratuberculosis (MAP) on Herrold egg yolk medium (HEYM) and threshold cycle (Ct) of real-time quantitative polymerase chain reaction for environmental samples from 113 herds and pooled environmental samples for 96 herds. Separate models were run for fresh and thawed samples and by individual locations or pooled samples from each herd. *
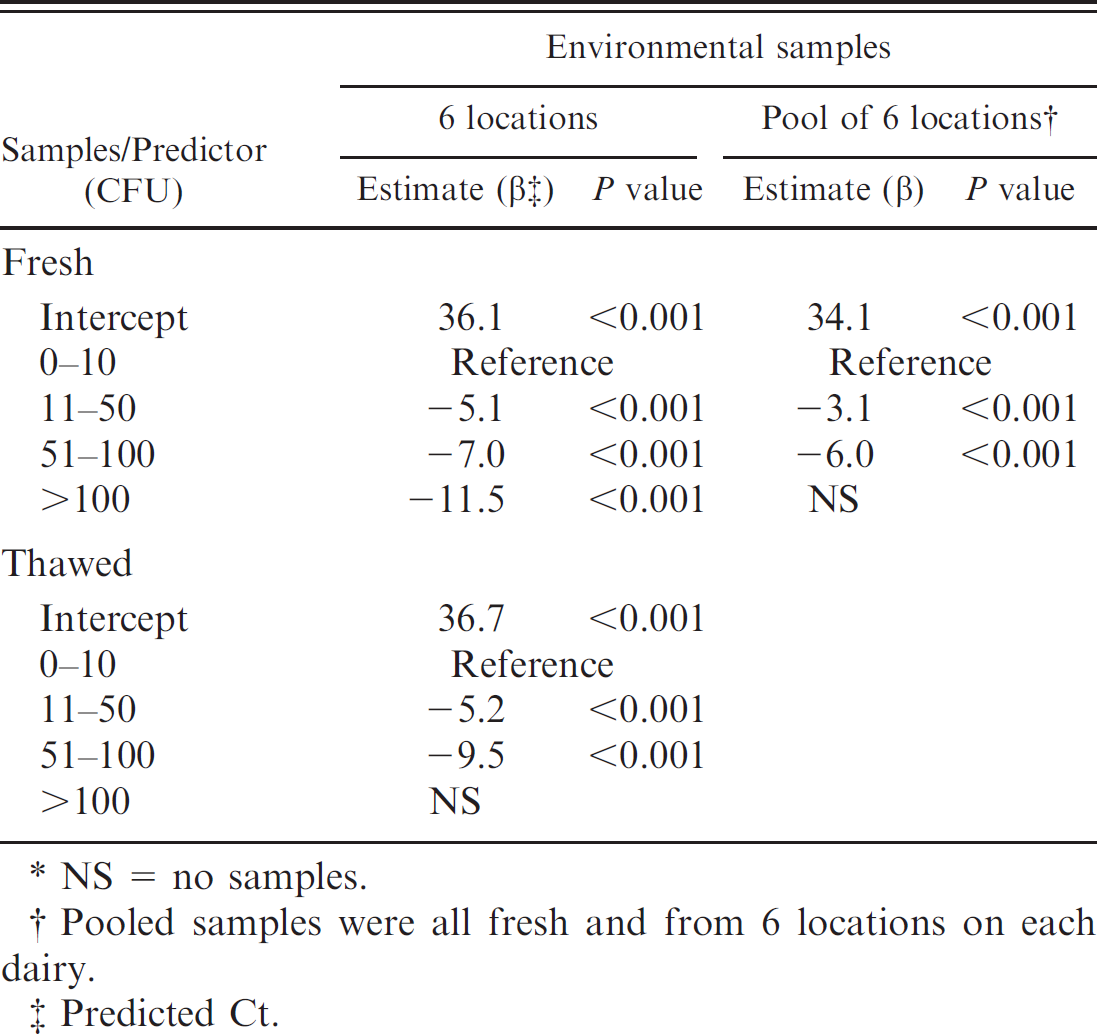
NS = no samples.
Pooled samples were all fresh and from 6 locations on each dairy.
Predicted Ct.
Discussion
Results of the current study showed that the correlation between quantitative MAP results from real-time qPCR (Ct) and culture on HEYM (CFU) was good (–0.66) in both fresh and thawed pooled fecal samples, and excellent (–0.76) and good (–0.61) in fresh and thawed environmental samples, respectively. The negative correlation estimates are the result of the inverse association between viable MAP DNA as measured by CFU on HEYM culture, and the Ct of real-time qPCR. As the DNA content of a sample increased, CFU increased, and less PCR cycles were required to threshold. Although the overall correlations between the 2 assays for fresh and thawed pooled fecal samples were estimated from different sets of samples, CFU results ranged across the entire spectrum of possible MAP concentrations on HEYM (0–300 CFU). The correlation between HEYM culture and real-time qPCR results in both fresh and thawed samples was lowest in pools of 5 compared with pools of 50, 100, and the whole-herd pools. Although this finding may seem counterintuitive, it may be explained by the greater variability of CFU results in pools of 5 compared to variability in pools of 50, 100, and the whole herd, which is also evident in the horizontal axes (culture results, CFU/tube) for the different pools shown in Figure 1. Pools of 5 had a wider range (0–300 CFU) than pools of 50, 100, and the whole herd (range: 0–75 and 0–125 CFU in fresh and thawed, respectively) despite being pools from the same samples. One possible explanation for greater variability in CFU results as the number of samples in a pool increases is the dilution effect due to a larger number of MAP-negative fecal samples. However, this may not be the case in pooled samples from high prevalence herds. In addition, the presence of 1 or more samples from individual cows that shed more than 10,000 CFU/g of feces, commonly known as super-shedders, 2 may further contribute to such difference in the correlation of both assays between different size pools. Furthermore, estimates of the correlation between HEYM and real-time qPCR results in fresh pools of greater than 5 samples and thawed whole-herd pools were based on a maximum of 12 pools and, hence, should be interpreted with caution given the limited sample size.
Estimates of the effect of change in CFU on Ct from the truncated linear regression indicated a significant negative association between CFU and Ct in fecal pools of all sizes and in both individual and pooled environmental samples (Tables 2, 3; respectively). A pool of 5 fresh individual cow fecal samples with 11–50 CFU tested approximately 11 Ct lower than another with 0–10 CFU. In comparison, a pool of thawed samples with 11–50 CFU tested approximately 19 Ct lower than that with 0–10 CFU. A greater change in coefficients indicated a steeper slope for the regression line of Ct on CFU in thawed samples than in fresh samples at the 0–51 CFU range (as depicted in Figure 1) and may be explained by the decrease in viable MAP concentration in thawed compared with fresh samples but a minimal loss of MAP DNA due to freezing and thawing. 8,12 The study's pools of 5 fresh and frozen individual fecal samples contained comparable MAP DNA concentrations (mean in fresh and thawed samples were 40.5 Ct and 40.8 Ct, respectively), but there was more than double the viable MAP concentration in pools of fresh (mean: 5.4 CFU) than thawed samples (mean: 2.3 CFU). The latter difference might be attributable to loss of viability associated with freezing and thawing. However, the association between CFU and Ct at the lower end of the MAP concentration was limited by the truncation of CFU results to 0 and, hence, 42 Ct. Furthermore, the difference in regression coefficients estimated for fresh and thawed pooled fecal samples may apply to pools of 5 samples only, because models were not run for fresh pools of 10, 50, and 100 (due to small number of observations).
Historically, the utility of routine HEYM test results was severely limited because of the lengthy turnaround time for final culture results, whereas real-time qPCR testing can be readily incorporated into testing strategies for the detection of MAP fecal shedding given its rapid turnaround time for test results. The good to excellent correlation between CFU and Ct in pooled and environmental samples, and the rapid turnaround time for real-time PCR results, may justify its use as a diagnostic strategy to rank such aggregate samples of cows by MAP concentration. Subsequently, smaller pools or finally individual cow samples in fecal pools with the highest MAP concentration may be tested to identify super-shedders in a herd. Although the sensitivity of such a strategy is not known, the reduction in cost of testing by a factor of the number of samples in an aggregate may justify a decrease in the overall sensitivity to detect super-shedders given that the most cost-effective approach may not be the most sensitive.
In conclusion, the present study showed that results of using a commercially available real-time qPCR to quantify MAP bioburden in fresh and thawed aggregate samples such as pooled fecal and environmental samples were strongly correlated to quantitative results of culture on HEYM. Therefore, real-time qPCR results may be a useful alternative to culture on HEYM in pooled fecal samples and environmental samples given their significant association and the rapid turnaround time for real-time qPCR.
Acknowledgements
The authors thank Terry Fyock and Sue McAdams at the JRL for technical assistance, the farm owners and veterinarians that participated in the study, and Tetracore for provision of test kits. This project was supported in part by the USDA–Agricultural Research Service (Agreements 58-1265-3-155, 58-1265-3-156, 58-1265-3-158, and 58-1265-4-020) for the Regional Dairy Quality Management Alliance; USDA–CSREES–NRI award 2007-35204-18391; USDA:NIFA award 2007-35204-18391; and the Austin Eugene Lyon's Fellowship (SA), Graduate Studies, University of California, Davis.
Footnotes
a.
ESP® Culture System II and ESP® para-JEM® kit; Trek Diagnostic Systems Inc., Sun Prairie, WI.
b.
Mini BeadBeater 8, Bio Spec Products Inc., Bartlesville, OK.
c.
d.
SmartCycler®, Cepheid Inc., Sunnyvale, CA.
e.
STATA Intercooled v. 11.0, StataCorp LP, College Station, TX.