
Abstract
The objective of the present study was to develop a quantitative polymerase chain reaction (qPCR) assay using SYBR Green for quantification of Lawsonia intracellularis in cell culture and pig fecal samples. Specific primers were designed and tested using the aspartate ammonia-lyase (aspA) gene as a target. Serial 10-fold dilutions of cell culture samples and several sets of spiked feces were used for qPCR optimization. The lower limit of the linear range of the assay in cell culture was 5.1 × 10² L. intracellularis/ml. A concentration of between 2.55 × 10⁴ and 2.55 × 10³ L. intracellularis/g was the lower limit of the linear range when testing community DNA from spiked fecal samples. From both cell culture and fecal samples, L. intracellularis could be detected but not accurately quantified at levels approximately 1 log below the linear range. No cross-reactivity of qPCR was found when the assay was tested using the DNA extracted from 16 species of enteric bacteria commonly found in pig feces or closely related to L. intracellularis. The new qPCR assay might prove to be a sensitive, specific, precise, and accurate method for the detection and quantification of L. intracellularis in field samples.
Keywords
Lawsonia intracellularis (order Desulfovibrionales, family Desulfovibrionaceae), a Gram-negative and obligately intracellular bacterium, is the causative agent of proliferative enteropathy (PE) in swine and other animal species. 9 The bacterium is mainly transmitted among pigs via a fecal–oral route. Bacteria shed in feces have been shown 1 to maintain infectivity outside of the host for 2 weeks.
Little is known about the dynamics of L. intracellularis fecal excretion postinfection. This is due, in part, to a lack of assays for the accurate quantification of L. intracellularis in samples. Estimates of L. intracellularis loads have been obtained using a cumbersome immunostaining assay with an antibody specific for L. intracellularis applied on serial dilutions of the sample. 2,3,4,16,18 The major disadvantages of this assay are that it is time-consuming, the enumeration results are subjective, and there can be a decreased diagnostic specificity compared to polymerase chain reaction (PCR). Several conventional PCR assays have been developed, validated, and used to detect the presence of L. intracellularis DNA in a variety of samples. 6,7,8,11,12 Conventional PCR can only be used for semiquantitative measurements because of the limitations of PCR product endpoint analysis.
Real-time quantitative PCR (qPCR) has been widely used for the quantification of bacteria in samples. Recently, at least 2 real-time PCR assays for L. intracellularis have been developed for the detection, but not the quantification, of L. intracellularis in fecal samples. 10,14 Another recent study 13 developed a qPCR assay for the quantitative measurement of L. intracellularis in pig fecal samples. All of these assays are probe-based, which can be highly specific but expensive. A quantitative assay based on SYBR Green detection can potentially detect the target gene at lower copy numbers than can probe-based assays. Therefore, the purpose of the current study was to develop a new SYBR Green qPCR assay targeting a different gene than previous qPCR assays for the detection and quantification of L. intracellularis in cell culture and pig feces.
Primers for the qPCR assay were designed for the aspA (aspartate ammonia-lyase) gene as a target using the Primer 3 (version 0.4.0) program (http://frodo.wi.mit.edu). 15 Based on the complete genome sequence data of L. intracellularis strain PHE/MN1-00 (http://www.ncbi.nlm.nih.gov/sites/entrez), there is only 1 copy of the L. intracellularis aspA gene located on the chromosome. Therefore, it is assumed that a single copy of aspA represents 1 L. intracellularis organism. This gene is currently used as a target in a conventional PCR assay for the diagnosis of L. intracellularis infection at the University of Minnesota (St. Paul, Minnesota) and is also used as an amplification target in a nonquantitative realtime PCR L. intracellularis detection assay. 14 The use of this gene also allows researchers to build on the results of previous conventional PCR-based studies 6,8 that targeted the same gene. The primer set selected for the new assay described herein had a highly specific product with no primer–dimer formation and had a qPCR efficiency close to 100%, with an R 2 close to 1 when tested with the standard DNA (see below). These primers amplified between nucleotide positions 911 and 1072 of the L. intracellularis aspA gene, generated an expected product of 162 base pairs (bp), and had the following sequences: forward: 5′-GCTGTGGATTGGGAGAAATC-3′; reverse: 5′-CAAGTTGACCAGCCTCTGC-3′.
Hypothetical primer specificity was primarily confirmed by comparison with sequence data of other known organisms using the Basic Local Alignment Search Tool (BLAST; http://blast.ncbi.nlm.nih.gov/Blast.cgi). To test the specificity and cross-reactivity of the selected primers, the qPCR assay was conducted with 16 pure cultures of the following bacterial strains: hemolytic Escherichia coli American Type Culture Collection (ATCC) 35218, E. coli ATCC 25922, Salmonella Typhimurium ATCC 14028, S. typhimurium (field isolate), Shigella flexneri ATCC 12022, Campylobacter coli, Campylobacter jejuni, Campylobacter upsaliensis, Clostridium perfringens, Brachyspira hyodysenteriae, Brachyspira pilosicoli, Brachyspira innocens, Bacteroides fragilis, Yersinia enterocolitica ATCC 9610, Bilophila wadsworthia, and Desulfovibrio desulfuricans. Furthermore, DNA from 20 L. intracellularis–negative control fecal samples obtained from a previous challenge study was also run to confirm the specificity of the selected primers. All 16 reference strain bacteria and 20 individual L. intracellularis–negative control pig fecal DNA samples gave no qPCR product.
The qPCR assay was conducted in a final reaction volume of 25 μl using 12.5 μl of SYBR Green master mix, a 5 μl of template DNA, and primers at 600 nM, ROX (5-carboxy-X-rhodamine) reference dye a at 30 nM and was supplemented with bovine serum albumin b at a final concentration of 400 ng/μl. No-template controls were added to each run. Additionally, serial 10-fold dilutions of standard L. intracellularis DNA (described below) were added in every run to generate the standard curves. All spiked samples, negative controls, and standard L. intracellularis DNA were tested in triplicate qPCR wells in the same run. The qPCR amplification and quantification were performed using a commercial real-time PCR system. a The cycling parameters were 95°C for 10 min and 40 cycles of 95°C for 30 sec, 60°C for 1 min, and 72°C for 30 sec, followed by a dissociation curve with temperatures from 60°C to 95°C. The fluorescence data were collected at the end of each elongation step and were collected continuously during the 60–95°C dissociation analysis. Data from each run were analyzed using MxPro-Mx3000P software version 3.00. a
Lawsonia intracellularis strain PHE/MN1-00 was used in the optimization of the qPCR assay. This strain was grown and harvested into phosphate buffered saline (PBS) from 200 T-175 flasks, as described previously. 3,17 Final concentration of the bacterial suspension was quantified using a direct count method. 3 To assure internal consistency, the same bacterial suspension was used for creating the DNA standard, for creating dilutions of the suspension prior to DNA extraction, and for spiking the feces.
To extract DNA from cultured cells, 2 × 10⁹ L. intracellularis cells were pelleted, and the DNA was extracted using a commercial kit c according to the manufacturer's instructions. DNA was eluted in 2 × 200 μl, and the eluates were pooled. Aliquots of this standard DNA (5.0 × 10⁶ cell equivalents per μl) were stored frozen at —20°C.
The standard DNA was serially diluted 10-fold in ultrapure water to generate a cell-equivalents standard curve. This dilution series was present on each qPCR plate to allow for comparisons among plates. Because it was necessary to dilute the DNA serially 10-fold 8 times (1/108) to assure negative qPCR results, it was presumed that this extraction protocol for generating the standard curve was providing at least 50% DNA yield. Figure 1A shows amplification plots of the serial 10-fold dilutions of standard DNA, yielding close to 100% amplification efficiency (range: 93.4–101.9) and a strong linear correlation (R 2 range: 0.999–1) between threshold cycle (Ct) values and the initial copy number of L. intracellularis. The assay gave occasional positive wells at the 2.5 × 100 L. intracellularis/well concentration (not shown in Fig. 1A), thus providing a limit of detection as low as several copies per well. The dissociation curve profile of the aspA amplicon showed only a single melting temperature peak at 79°C (Fig. 1B). The amplicon was verified by sequencing to be 100% identical to the aspA gene of L. intracellularis. The second highest match was 77% identity to the fumarate lyase gene of Clostridium beijerinckii NCIMB 8052. Nontemplate controls yielded no Ct in every qPCR run.
The performance of the assay was assessed in cell culture and in spiked fecal samples. The limit of detection of the assay was defined as the lowest concentration that returned at least 1 positive well on the qPCR assay. The linear range of the assay was defined as the working range, where qPCR-estimated concentrations of organisms in the sample were proportional to the spiked concentrations of the organisms in the sample. The apparent recovery rate of extraction from the samples was assessed by first using the standard curve to convert the Ct to L. intracellularis/well, as determined by qPCR, then back-calculating with volumes and dilutions to determine L. intracellularis/ml for cell culture or L. intracellularis/g for the spiked fecal samples. Finally, recovery rate was calculated as the quotient of recovered copies and spiked copies. 13
A 10-fold dilution series of L. intracellularis was created in sterile PBS, with final concentrations ranging from 5.1 × 10⁸ to 5.1 × 101 L. intracellularis/ml. Two independent DNA extractions were performed on 1-ml aliquots of each dilution with a commercial kit, c according to the manufacturer's instructions, with only the first 200-μl elution of DNA collected and used for qPCR analysis. All of the amplicon dissociation curves from the DNA extracted from cell culture samples containing 5.1 × 10⁸ to 5.1 × 101 L. intracellularis/ml showed the same single specific peak at 79°C (Fig. 1B). The detection limit was 5.1 × 101 L. intracellularis/ml. The recovered copy number was linear and predictive within the range of 5.1 × 10⁸ to 5.1 × 10² L. intracellularis/ml (Fig. 2A), with an apparent recovery rate of 55% based on the relationship between the recovered and spiked copy numbers.
Dilution series were also created in spiked swine feces. Fecal samples from 5 individual pigs obtained from 4 PE-negative herds, each representing a different age group, were initially screened to be L. intracellularis–negative using a conventional PCR test. 8 Twenty milliliters of each L. intracellularis dilution was added to 20 g of L. intracellularis–negative feces and mixed thoroughly. Fecal sample 1 was spiked with bacterial concentrations of 5.1 × 10⁸ to 5.1 × 101 L. intracellularis/ml, giving final spiked concentrations of 2.55 × 10⁸ to 2.55 × 101 L. intracellularis/g. Fecal samples 2–5 were spiked with L. intracellularis concentrations of 1.37 × 10⁵, 1.37 × 10⁴, and 1.37 × 10³ L. intracellularis/ml to create additional low-load samples with final concentrations of 6.85 × 10⁴, 6.85 × 10³, and 6.85 × 10² L. intracellularis/g of feces, respectively. These additional samples enabled an assessment of variability due to intersample differences such as PCR inhibitors. DNA was extracted in triplicate with the QIAamp® DNA Stool Mini Kit, c according to the manufacturer's instructions.
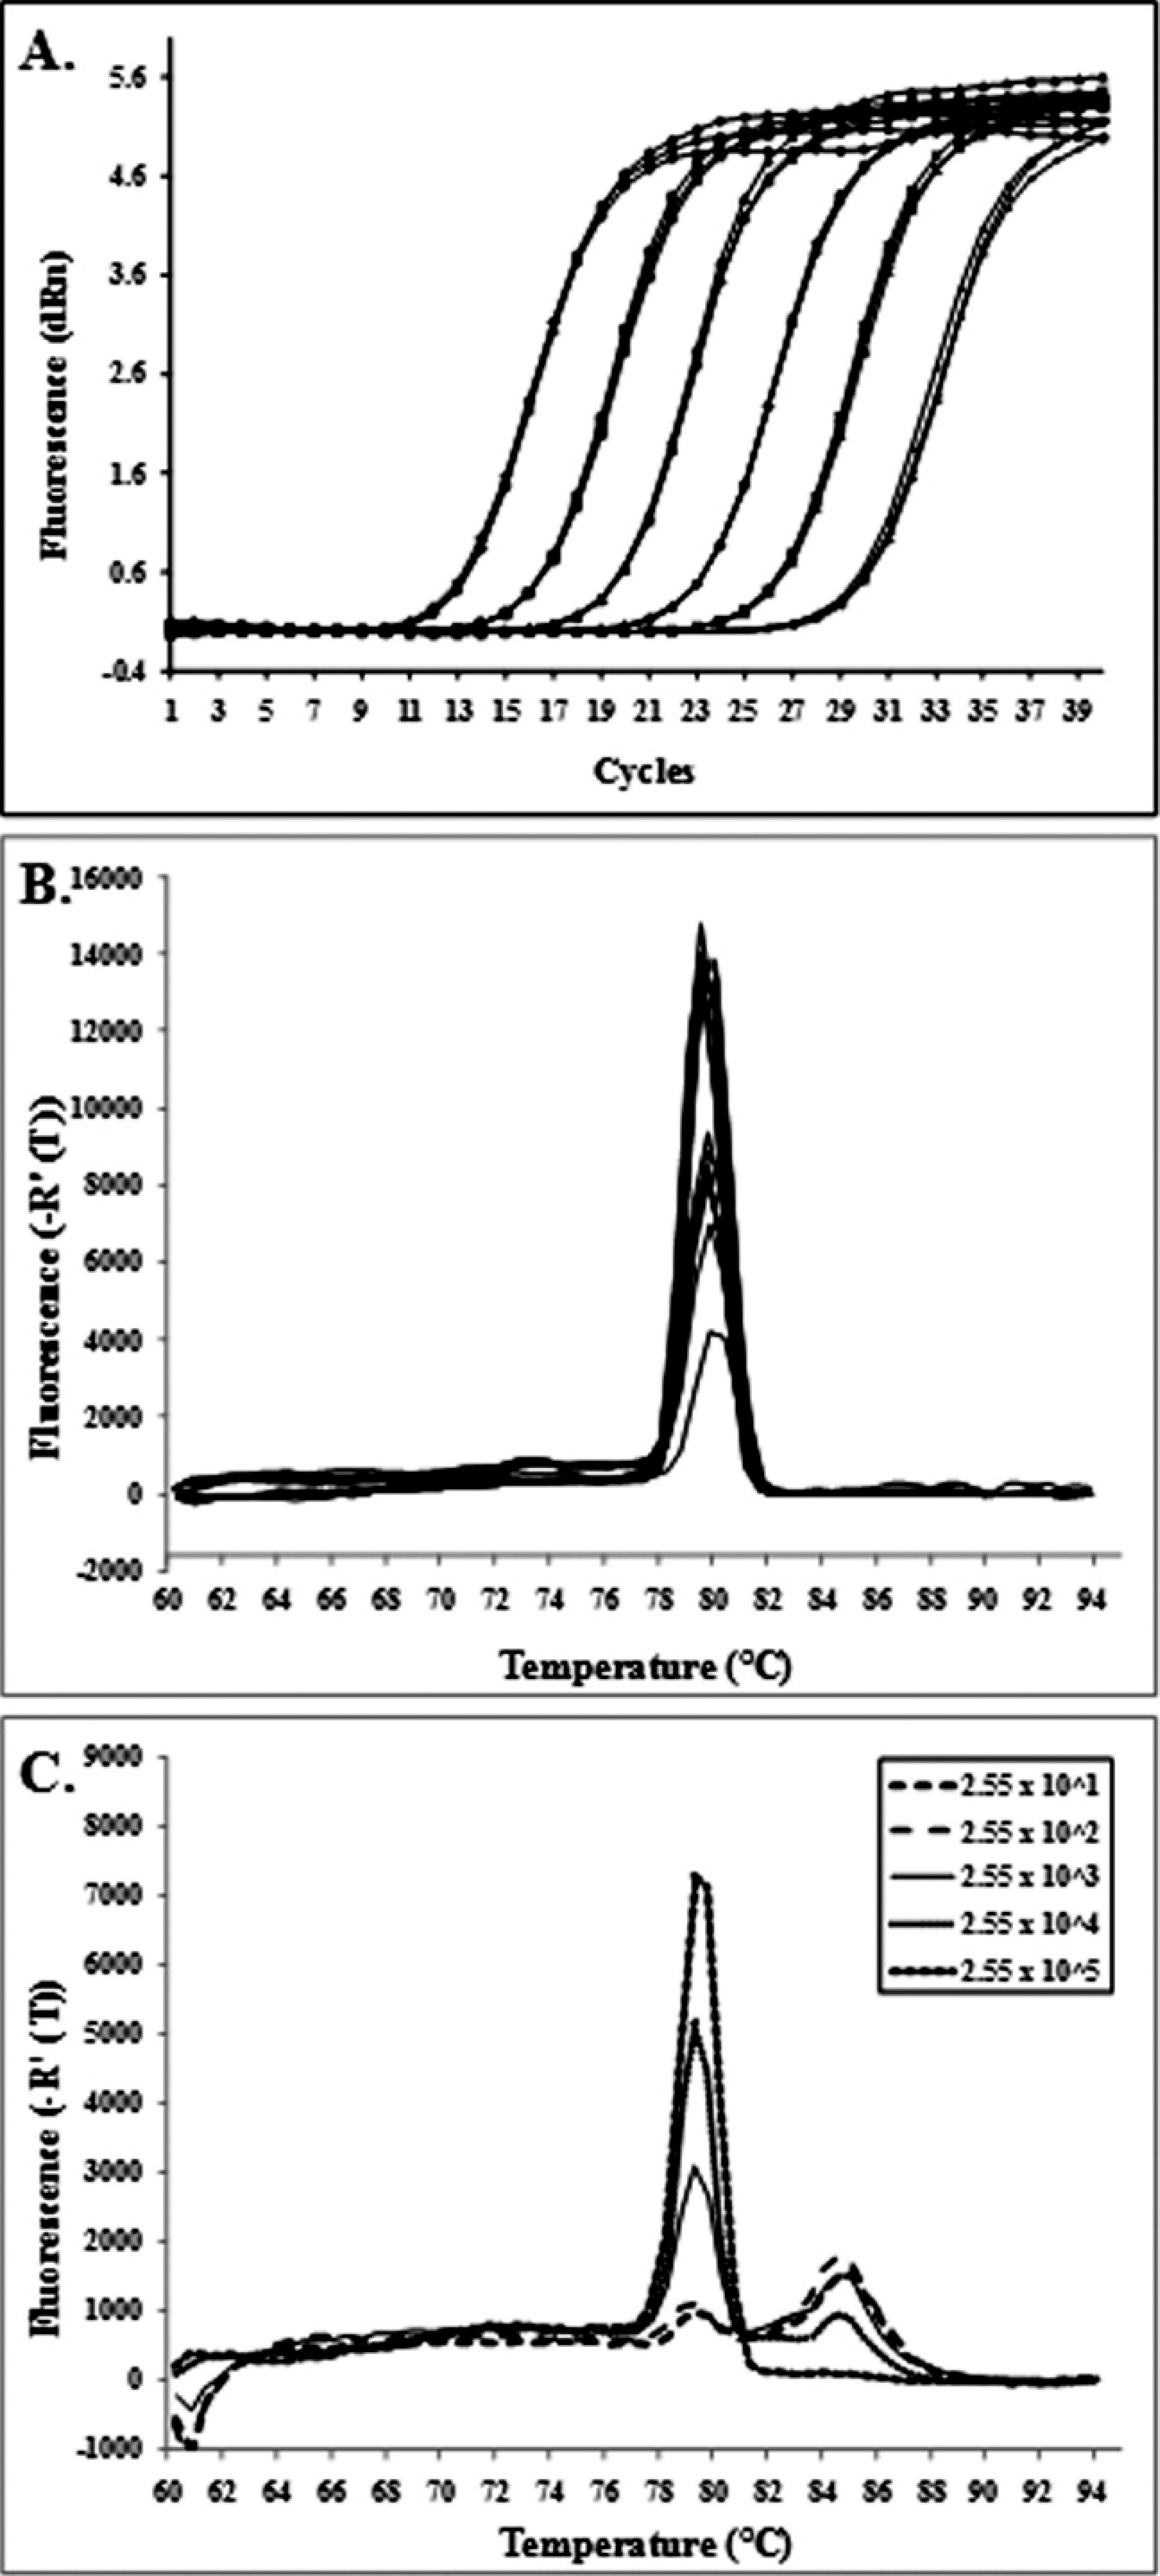
amplification plots (threshold cycle vs. fluorescence level) of 10-fold dilutions of the standard DNA with quantities from 2.5 × 10⁶ to 2.5 × 101
Lawsonia intracellularis/well. The highest concentration is a 1/10 dilution of the standard DNA. Five microliters were assayed per well.
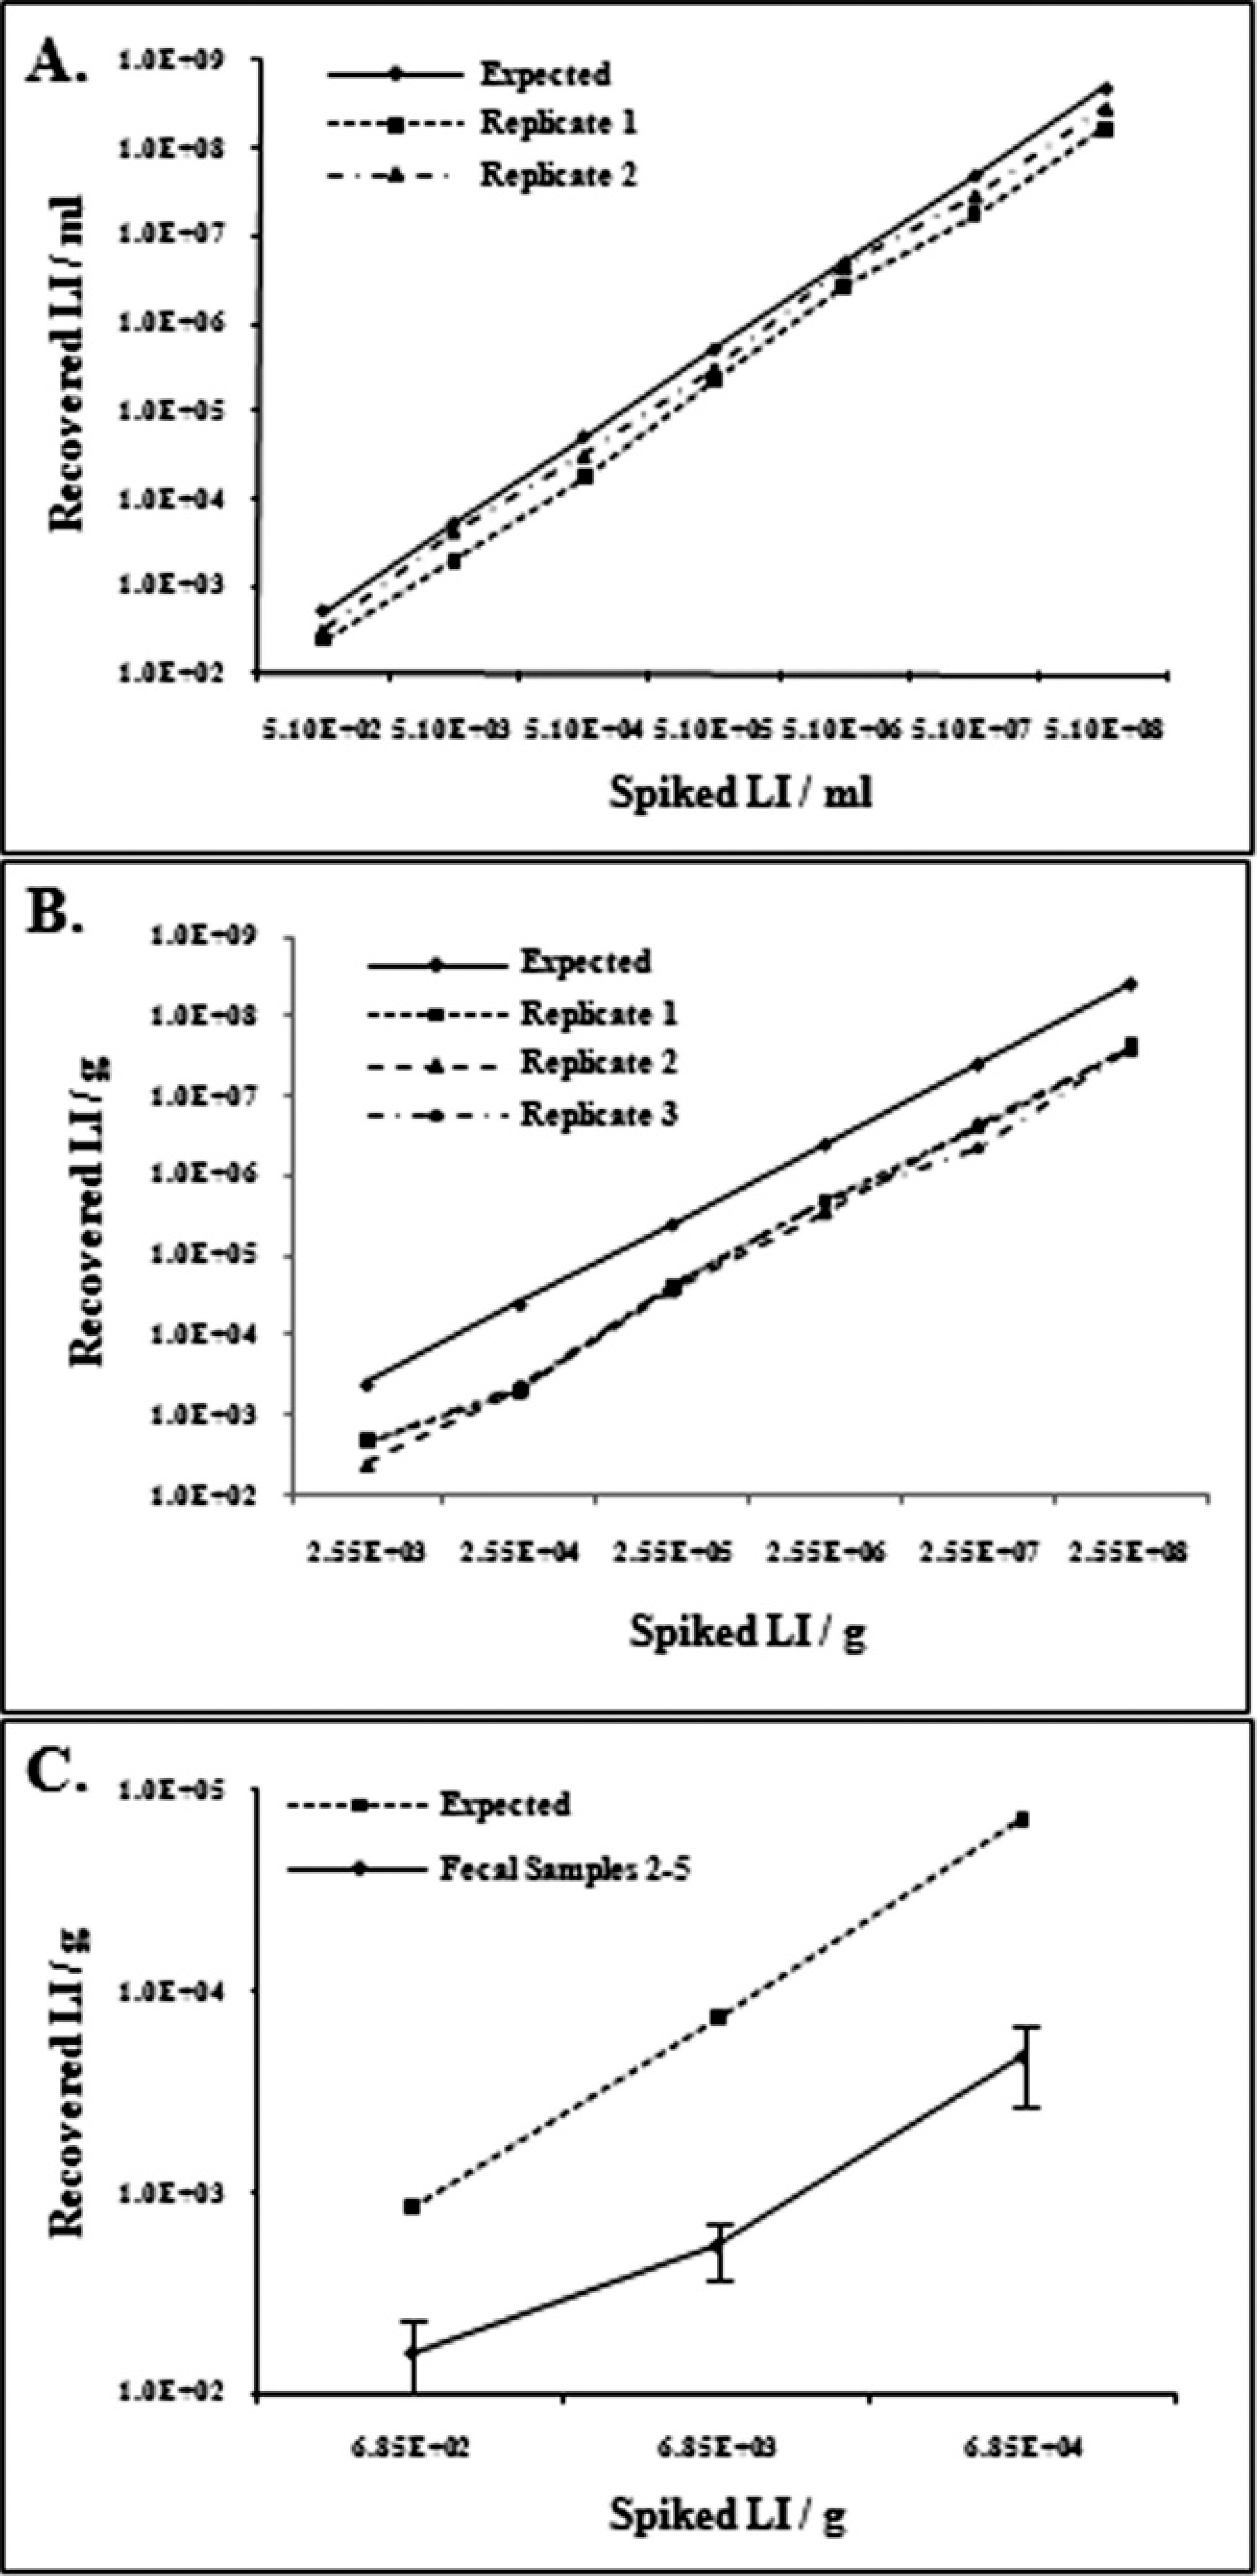
A, performance of quantitative polymerase chain reaction (qPCR) for the cell culture samples.
In spiked fecal sample 1, the recovered copies were highly predictive of the spiked copies for all concentrations ranging from 2.55 × 10⁸ to 2.55 × 10³ L. intracellularis/g, with good agreement among replicates (Fig. 2B) and an apparent recovery rate of 15%. A concentration between 2.55 × 10⁴ and 2.55 × 10³ L. intracellularis/g was the lower limit of the linear range. At 2.55 × 10² L. intracellularis/g, only 2 of 9 wells gave specific products. The detection limit of the assay was 2.55 × 101 L. intracellularis/g. For spiked fecal samples 2–5, the recovered copies were again highly predictive of the spiked copies for concentrations >6.85 × 10³ but were more variable for the 6.85 × 10² concentration (Fig. 2C). Below concentrations of approximately 103 cells/g of feces, the qPCR could detect the presence of L. intracellularis but could not quantify the concentration accurately or precisely, a finding that is common to qPCR studies. 5,19 Fecal samples 2–5 had apparent recovery rates ranging from 7% to 9%. The aspA qPCR product had the same specific melting temperature (Tm) peak of 79°C when amplified from all 5 fecal samples, although fecal sample 1, with low concentrations of L. intracellularis, had a second peak at a higher and incorrect Tm (Fig. 1C). This second peak of nonspecific amplification appeared only after cycle 36 in the qPCR assay, and only in fecal sample 1. When the PCR products were investigated further by running them in a 2% agarose gel, this higher-Tm, nonspecific amplicon was observed at approximately 300 bp, along with the expected 162-bp specific product.
A previously published real-time PCR assay 10 that used a TaqMan probe system had a limit of detection of 1 L. intracellularis cell per PCR tube, which equated to approximately 4 × 10⁴ L. intracellularis/g of feces. This difference in the detection limit of the assays may be due to the difference in DNA extraction methods. In the previous study, 10 feces were boiled in lysis buffer prior to DNA extraction. Although the extraction method is easier and cheaper than that used for feces in the current study, it likely does not remove all potential PCR inhibitors from the feces, which can lead to false-negative results. In the present study, an occasional well was positive at the 2.55 × 101 cells/g concentration. Although probabilistically it is unlikely that L. intracellularis DNA is present in the reaction well at this starting concentration, when enough wells at this low spiking concentration are tested, occasional positives can occur. The detection of L. intracellularis DNA was more consistent across extractions at the 2.55 × 10² cells/g concentration, and so perhaps 2.55 × 10² cells/g is a more accurate detection limit for this assay. The lower limit of the linear range of our SYBR Green–based qPCR in fecal samples was 2.55 × 10³ L. intracellularis/g, whereas a recent probe-based qPCR stated a limit of quantification of 10 genomic equivalents/μl reaction volume (approximately 2.8 × 10⁶ genomic equivalents of L. intracellularis/g). 13 It is not possible to directly compare these results because the assays have different target genes, use TaqMan probe versus SYBR Green, use plasmid versus genomic DNA standards, and, perhaps most importantly, use different methods to enumerate L. intracellularis in culture. A direct comparison would require that the same field samples be tested side by side in these systems.
Using this SYBR Green assay, L. intracellularis was detected in feces at lower levels than had been previously reported using probe-based systems. One drawback of a SYBR Green assay, though, is that no internal amplification control is possible. Thus, to check for inhibition by the fecal DNA, standard DNA (2.5 × 10² L. intracellularis) was amplified in the presence and absence of 2 different samples of L. intracellularis–negative fecal DNA. No inhibition was seen (data not shown). Another drawback is the nonspecificity of SYBR Green binding, so in any SYBR Green qPCR assay one must always check the dissociation curve to assure that the Ct reflects the correct product. In the case of fecal sample 1, the extraneous peak in the dissociation curve was associated with a 300-bp nonspecific product. The attempt to sequence the nonspecific product with the qPCR primers uniformly gave either no product or a low-quality mixed sequence with poor GenBank matches. It is possible that repetitive sequences present in the fecal DNA could contribute to the amplification of this product. Any extraneous peak visible in the dissociation curve analysis would contribute to the overall fluorescence. The resulting shift of the amplification curve to the left could cause one to overestimate the concentration of the organism in the sample. In this particular case, even though the extra peak is clearly visible by dissociation curve analysis, it is not contributing noticeably to the concentration. If it were, this would be reflected as a major increase in recovery rate at low spiking levels; only minor fluctuations in recovery rate are evident in Fig. 2B. Fecal samples 2–5 show an apparent increase in recovery rate at low spiking levels (Fig. 2C); however, this was not due to the fluorescence contribution of an extra peak. At the low spiking levels, some of the qPCR wells had no Ct, and because only positive qPCR wells were used to estimate copy number, this would skew the data upward. At these low levels the assay is being used below the linear range of the assay, and, therefore, the results are not considered reliable.
To determine the effect of freezing and thawing of the fecal samples on qPCR performance, half of each spiked fecal sample was kept frozen at −20°C for approximately 2 weeks. These samples were then thawed, and DNA was extracted. For both the fresh-extracted and frozen-extracted feces, DNA was run on qPCR immediately after DNA extraction. After the fecal samples were frozen and thawed, the average Ct increased by approximately 2–3 cycles in all concentrations above 103 L. intracellularis/g, indicating that approximately 75% of the L. intracellularis DNA in the sample was degraded. For the concentrations of less than 103 L. intracellularis/g, 5 of the 7 replicates that were positive on fresh feces appeared to be negative following the freeze/thaw cycle. Two DNA samples that had been extracted from the spiked fresh feces and then stored at −20°C were run on the same plate as DNA extracted from spiked frozen feces. This comparison confirmed that the shift in Ct was due to extraction after freezing and not to variability between plates. A recent study 13 found that the amount of L. intracellularis DNA did not change when the fecal samples were frozen for as long as 6 months. Part of the difference between the results of this previous study and those of the current study could be that the previous study monitored actual L. intracellularis–infected feces, while the fecal samples in the present study were artificially spiked. Future studies should continue to investigate the optimal way to store samples and the impact that freezing and thawing have on estimated L. intracellularis concentrations.
In conclusion, a new SYBR Green–based qPCR assay targeting the aspA gene was developed for the detection and quantification of L. intracellularis in cell culture and pig fecal samples. This assay appears to be sensitive, specific, reproducible, accurate, and precise when used for L. intracellularis quantification and detection in cell culture and spiked swine fecal samples. The assay needs to be validated with natural field samples, and for this validation, a standard curve generated with spiked fecal samples will provide the most accurate quantification. Following validation, this new qualitative and quantitative assay will be helpful in future disease transmission and epidemiological studies and can be used to investigate the dynamics of fecal L. intracellularis excreted postinfection.
Acknowledgements
The authors would like to thank Benjawan Wijarn and Molly Freese for their excellent technical assistance on this project and Dana Beckler and Tim Boyer for their valuable discussions about real-time PCR.
Footnotes
a.
Brilliant® II SYBR® Green QPCR Master Mix, Mx3000P Real-Time PCR System; Agilent Technologies, La Jolla, CA.
b.
A7638, Sigma-Aldrich, St. Louis, MO.
c.
DNeasy® Blood and Tissue Kit, Qiagen Inc., Valencia, CA.