
Abstract
Torque teno virus (TTV) is a recently identified virus that has a wide range of host tropisms from humans to shrews. Human TTV and Torque teno mini virus are distributed worldwide, and their high prevalence in human populations has been reported. Pigs have their own species-specific TTV, and like human TTV, a high prevalence of porcine TTV also has been reported. Despite its high prevalence, the role of TTV-related disease or syndrome in humans and pigs has not been determined. In the swine industry, TTV is thought to be one of the agents that aggravate clinical manifestation of Porcine circovirus–associated disease (PCVAD), a newly emerging, economically devastating disease. The purpose of the current study was to quantify TTV viral load in serum obtained from Porcine circovirus-2–negative pigs and PCVAD-affected pigs with real-time quantitative polymerase chain reaction assays and to compare TTV viral load between these groups. Results of this study indicate that there are no statically remarkable differences in TTV viral load between the 2 groups, which indicates that TTV might not be an agent of aggravation in PCVAD.
Torque teno virus (TTV; family Anelloviridae, genus Alphatorquevirus) is a nonenveloped, circular, single-stranded, negative-sense DNA virus 14 that was first isolated from a Japanese patient suffering from a posttransfusional non-A–G hepatitis in 1997. 16 After finding the causative viral agent, several studies have been conducted on the biological characteristics, epidemiology, and pathogenicity of TTV in hepatitis and its relation with other diseases in humans. 4 Results of previous studies determined that human TTV possesses a quite stable genome within the same genogroup, shares low nucleotide sequence identity with different genogroups, and has a high prevalence in the human population, which arouses suspicion of possible relationships between TTV and other diseases. 1,7,11 Those previous studies implied a possible clinical implication in TTV, but human TTV and Torque teno mini virus (TTMV) are often referred to as orphan viruses because they are not linked to any specific disease or syndrome. Even though TTV could infect several species, including human, horse, dog, cat, and pig, TTV has shown host specificity and variable genomic length within the order of the animal. 17,20 The genomic length of TTV in humans and primates is approximately 3.8 kb in length and is approximately 2.9 kb in pigs and dogs. Swine TTV has also shown worldwide distribution, and a high seropositive ratio in the general pig population has been reported. 13 To date, more than 25 genogroups of TTV have been identified in humans, 5 but only 3 fully sequenced swine TTV have been published. After the first finding of swine TTV in 2004, different genogroups in pigs were subsequently identified. 13,15
Porcine TTV isolates Sd-TTV31 and Sd-TTV1p have a relatively high nucleotide sequence identity (69.6%) and are classified as TTV genogroup 1. Sd-TTV31, a prototype of genogroup 1, and Sd-TTV2p, a recently sequenced swine TTV, share a low nucleotide sequence identity (44%) with Sd-TTV31. Sd-TTV2p by itself composes novel TTV genogroup 2. 15 A number of researchers have reported TTV prevalence in various situations. 6,8 Coinfection with different genogroups of TTV in an individual was found to be common. 12 TTV genogroup 2 has been found more frequently in Porcine circovirus–associated disease (PCVAD)–affected pigs than in TTV genogroup 1, 9 although TTV genogroup 2 was also prevalent in European wild boars. 12 In the swine industry, Porcine circovirus-2 (PCV-2), the causative agent of PCVAD, 2 is one of the most important pathogens because of its high mortality and great economic impact. Porcine circovirus-2 alone was not assumed to be sufficient to cause PCVAD and needed cofactors to cause the disease. 3,18 Recently, TTV has been proposed as a candidate that aggravates PCV-2 infection and causes clinical manifestation of the disease.
To date, the only available method for detection of TTV is nucleic acid detection. One method available for porcine TTV, nested polymerase chain reaction (nPCR), is very sensitive but is time consuming, is labor intensive, and creates the potential for significant contamination problems. To date, no tissue culture system has been available for the propagation of the virus, in that immunological detection methods such as enzyme-linked immunosorbent assay (ELISA) and quantitative PCR (qPCR) are not yet available for TTV detection.
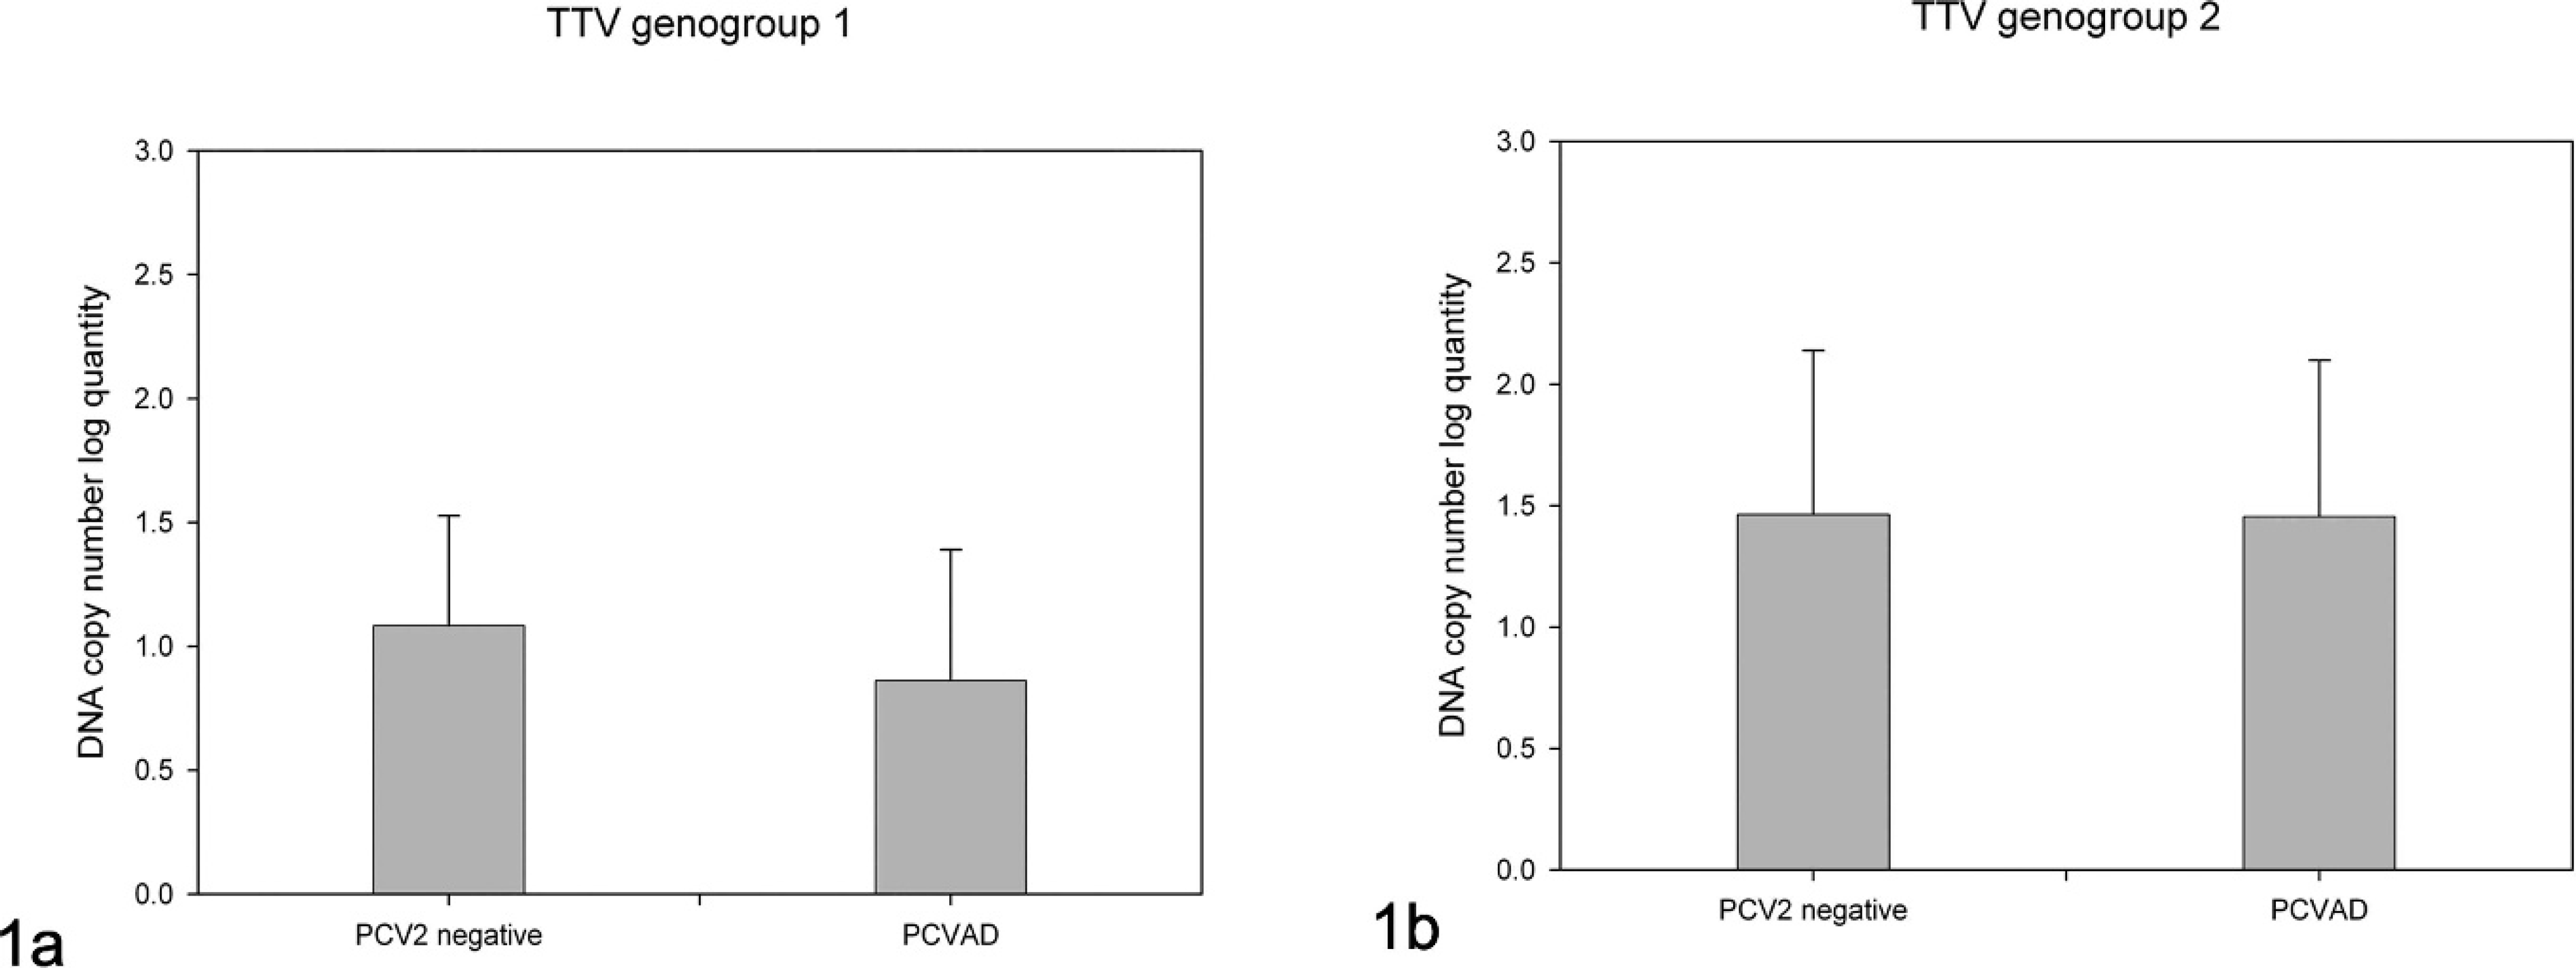
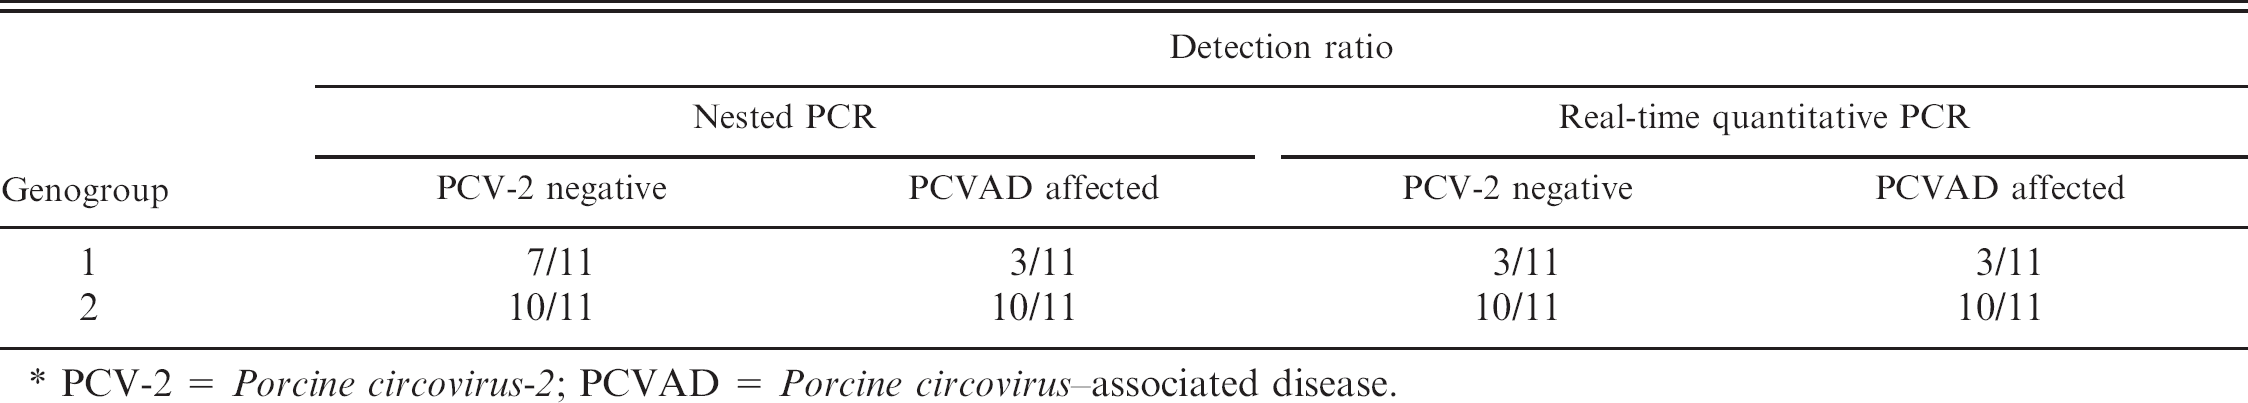
Viral load difference of each Torque teno virus (TTV) genogroup between Porcine circovirus–associated disease (PCVAD)–affected and Porcine circovirus-2 (PCV-2)–negative groups.
The purpose of the current study was to develop a qPCR assay for quantification and differentiation of TTV geno-groups and investigate a possible link between TTV and PCVAD in pigs. To compare TTV viral load in various situations, blood samples were collected from 11 PCV-2–negative 150-day-old pigs as negative controls and 11 typical PCVAD-affected pigs of the same age and breed. Absence of PCV-2 in control pigs was confirmed by PCV-2–specific PCR in serum, immunohistochemistry of lymphoid tissues, and serological testing (ELISA). Porcine circovirus–associ-ated disease–affected pigs were diagnosed according to generally accepted criteria that includes clinical signs (dyspnea, wasting, respiratory discharge, etc.), postmortem findings, and PCV-2 detection in lymphatic organs.
DNA was extracted from serum samples with DNazol a according to the manufacturer's instructions and eluted with 30 μl of diethylpyrocarbonate (DEPC)-treated distilled water and stored at −70°C until use. The 3' untranslated region (UTR) of nucleotide sequences of TTV genogroup 1 representative strain TTV 1p (GenBank accession AY823990.1) and TTV genogroup 2 representative strain TTV 2p (GenBank accession AY823991) were selected as target regions of the qPCR, and primers and probes were designed with the Beacon designer. b TTV genogroup 1–specific probe (5'-/56FAM/CCCGACCAATCAGATTTGACTCCTCCT/3BHQ_1/-3'), sense primer (5'-CGGGCAAAATGGCGGACAG-3'), and antisense primer (5'-ACACCCTATGCAAATGAGGACTTG-3') were diluted a concentration of 10 pmol and used for qPCR. TTV genogroup 2–specific probe (5'-/5HEX/TCTACCACCAGCGGCATAAACTCAGC/3BHQ_1/-3'), sense primer (5'-AAAAGAACCAATCAGAAGAACTTCCTC-3'), and antisense primer (5'-AGGCGGTTAGACACTCAGCTC-3') were diluted and also used for qPCR. Amplicon sizes of TTV genogroups 1 and 2 were 140 and 116 bp in length, respectively. The sense primer (5'-AGCACTCTTGGTCTGGACATCG-3') and antisense primer (5'-AGCAGGCACAGAAGCAGTAGTC-3') were designed for PCV-2 SYBR Green–based qPCR on the basis of the nucleotide sequence of the open reading frame 2 (ORF2) gene retrieved from GenBank (accession AF027217). Quantitative PCR was performed with a real-time PCR detection system c and a commercial mix c containing 2x reaction buffer with each deoxyribonucleotide triphosphate (dNTP), Taq DNA poly-merase, 6 mM MgCl2, and stabilizers, as well as a SYBR Green mix c containing 100 mM KCl, 40 mM Tris–HCl, pH 8.4, 0.4 mM each dNTP (dATP, dCTP, dGTP, and dTTP), Taq DNA polymerase (50 U/ml), 6 mM MgCl2, SYBR Green I 20 nM fluorescein, and stabilizers for SYBR Green–based qPCR. The PCR conditions were predenaturation at 95°C for 10 min followed by 45 cycles of 95°C for 15 sec and 60°C for 40 sec. For SYBR Green–based qPCR, melting curve analysis was done to check specificity of PCR reaction. After PCR cycling, the sample temperature was dropped to 30°C for 1 min then heated from 70°C to 90°C at a linear transition rate of 0.1°C/sec. A decrease in fluorescence was detected, and melting temperature (Tm) values were analyzed by commercial analysis software. c The PCR products were analyzed by electrophoresis in 3% agarose gel with 30 min running on Tris acetate–ethylene-diamine tetra-acetic acid buffer. To check the detection limit of qPCR and compare the results, previously published nPCR methods for amplification of 3'UTR of each TTV genogroup were used. 9 Nested PCR for TTV and PCR for PCV-2 were carried out with a commercial PCR kit. d Briefly, 1 μl of DNA, 1 μl of each primer of 10 pmol concentration, and 17 μl of DEPC-treated distilled water were mixed into a premix tube containing 2.5 U of Taq polymerase, 2.5 mM of each dNTP, 1x reaction buffer, and 1x gel loading buffer. The PCR conditions of each genogroup were followed as previously described. The PCV-2 ORF2 gene was amplified with the use of a specific primer set as previously described. 10 For standard curve analysis, nPCR products corresponding to the 3'UTR region of TTV in each genogroup and PCR products of the PCV-2 ORF2 gene were purified by a commercial DNA extraction system. d Then purified PCR product was inserted into pGEM-T easy vector e and transformed into Escherichia coli–competent cell DH5α for cloning. Insert-containing plasmid DNA was purified with the use of a DNA extraction system, d and was serially diluted 10-fold from 108 to 101 copies/μl in suspension buffer

Viral load related to clinical signs.
The duplex qPCR assay and SYBR Green–based qPCR developed in the present study detected TTV DNA in the sample efficiently. The detection limit of qPCR assay was 10 DNA copies/μl of suspension buffer (Fig. 1). The Tm value of the SYBR Green–based qPCR assay was 83.3°C (±0.2°C). The PCVAD-affected pigs had PCV-2 viremia, and as previously reported, pigs with severe clinical signs showed a higher PCV-2 viral load (Fig. 2A). 19 The result of qPCR compared with nPCR is summarized in Table 1.
In the case of TTV genogroup 1, the nPCR assay showed an approximately 63% positive ratio in the PCV-2–negative group, whereas a positive ratio of 27% was shown in the PCVAD-affected group. Quantitative PCR assay resulted in 27% positive in both groups. TTV genogroup 2 was more prevalent in both groups. Both nPCR and qPCR resulted in a 90% positive ratio. TTV genogroup 2 was more prevalent in the PCVAD-affected group and in PCV-2–negative pigs than in TTV genogroup 1. No remarkable differences in prevalence of TTV genogroups between PCVAD- and PCV-2–negative groups were determined in the present study. Dissimilarity of TTV viral load in the PCV-2–negative group compared with the PCVAD-affected group is shown in Figure 2. Viral load of TTV genogroup 1 was generally low in both groups. The mean value of DNA copies showed possible divergence between groups, but it was not significant by statistical analysis (P < 0.06); viral load of TTV genogroup 2 between groups showed similar results (P > 0.1). These findings perhaps resulted from the small number of animals used in the study. The results might vary if sample numbers were increased to form a definitive conclusion. However, PCV-2–free pigs are extremely difficult to obtain, and supplies are limited worldwide.
In the current study, prevalence of TTV genogroup 2 in serum was much higher than TTV genogroup 1 in both PCV-2–negative and PCVAD-affected pigs, and the viral load of each group was not significantly different. The TTV viral load of each genogroup was not altered by clinical severity related with manifestation of PCV-2–associated disease (Fig. 2). This result suggests that TTV genogroup 2 could readily cause viremia even in the PCV-2–negative pigs. In the case of TTV genogroup 2, there were no significant differences in prevalence between groups of pigs with or without PCV-2. Recent research on porcine TTV was mainly focused on the relationship with PCV-2, but high prevalence and a relatively less remarkable viral load divergence of TTV has raised questions that TTV coinfection could be a risk factor for PCVAD pathology. However, on the basis of the current study, there was no evidence that supported TTV as a trigger for PCVAD. Further study of TTV pathology is required to answer these questions, and diverse technologies are required for defining the role of TTV in clinics. Although results of nPCR were more sensitive compared with qPCR, the duplex qPCR assay introduced in the current study could reduce time and labor for further TTV research.
Torque teno virus genogroup detection ratio comparing nested polymerase chain reaction (PCR) with real-time quantitative PCR. *
PCV-2 = Porcine circovirus-2; PCVAD = Porcine circovirus–associated disease.
Footnotes
a.
Invitrogen Corp., Carlsbad, CA.
b.
Premier Biosoftware, Palo Alto, CA.
c.
Chromo4™ System, iQ™ Supermix, iQ™ SYBR® Green Supermix, Opticon Monitor™; Bio-Rad Laboratories, Hercules, CA.
d.
Maxime™ PCR preMix Kit, MEGAquick spin™; INtRON Biotechnology Inc., Seongnam, Korea.
e.
Promega Corp., Madison, WI.