
Abstract
The objective of the current study was to compare the performance of 4 methods to quantify Equid herpesvirus 1 (EHV-1) by real-time polymerase chain reaction (PCR) in nasal secretions from experimentally and naturally infected horses. Nasal secretions were collected on the challenge day and daily thereafter for 13 days from 4 experimentally infected horses. Additional nasal swabs were collected from 30 horses with clinical signs consistent with natural EHV-1 infection. Absolute quantitation of EHV-1 target molecules was performed using standard curves for EHV-1 and equine glyceraldehyde-3-phosphate dehydrogenase, and DNA yield, and was expressed as EHV-1 glycoprotein B (gB) gene copies per million nucleated nasal cells, EHV-1 gB gene copies per entire swab, EHV-1 gB gene copies per 1 μl of purified DNA, and EHV-1 gB gene copies per 1 ng of template DNA. The study results showed that all 4 calculation methods yielded comparable results between experimentally and naturally infected horses, and that the different methods were significantly correlated with each other. Reporting of quantitative results for EHV-1 viral load in nasal swabs collected from infected horses constitutes an important advance in both the research and diagnostic fields, allowing one to determine the infectious risk of affected horses, disease stage, or response to antiviral therapy. However, protocols that normalize the PCR results against a preselected volume of DNA or nasal secretions are likely to be more prone to variations than protocols that calculate the load for the entire swab, incorporate a housekeeping gene, or use a constant amount of extracted DNA.
Equid herpesvirus 1 (EHV-1; family Herpesviridae, subfamily Alphaherpesvirinae, genus Varicellovirus) infection is widespread in horse populations throughout the world and produces well-documented syndromes and outbreaks of contagious respiratory disease, epidemic abortion, neonatal death, and myeloencephalopathy. 17 It is believed that EHV-1 circulates in horse populations via subclinical or clinical infection after primary infection or reactivation. The biologic source of such virus originates from a primary lytic infection or the shedding of virus after reactivation of a latent state. Periodic reactivation of latent infection can lead to viral shedding and horizontal transmission. 4 Thus, early recognition of disease as well as viral shedding is crucial for implementation of management practices that decrease the risk of exposure of susceptible horses.
Traditionally, virus isolation from a nasopharyngeal swab or blood has been the gold standard for diagnosis of viral shedding or viremia, respectively. Recently, polymerase chain reaction (PCR) assays, which are both more sensitive and rapid, have largely replaced the time-consuming procedure of virus isolation. 2,16 However, the increasing application of sensitive molecular diagnostic techniques for detection of pathogens in practice settings has presented new dilemmas with regard to how test results are interpreted and used by both equine practitioners and regulatory veterinarians. Because routine PCR assays targeting the DNA of EHV-1 genes are unable to differentiate between replicating (lytic) and nonreplicating virus, positive PCR test results should be interpreted only in the context of clinical signs shown in infected horses. The traditional PCR assays were not quantitative, and therefore they were incapable of determining the amount of viral DNA present in specific samples. In recent years, novel molecular platforms, such as real-time PCR, have enabled the study of viral kinetics of EHV-1 in respiratory secretions, blood samples, and tissues after experimental or natural infection. 1,3,5,6,10,13 However, determination and reporting of EHV-1 viral loads on diagnostic samples submitted by veterinarians from field cases are not currently practiced routinely in the molecular diagnostic setting to enable practitioners to determine disease stage or response to therapy. The objective of this study was to compare the performance of 4 different calculation methods to determine the absolute quantity of EHV-1 by real-time PCR in nasal secretions collected from experimentally and naturally infected horses.
The experimental study involved 4 Quarter Horse geldings between 1 and 2 years of age. The horses were housed together in a pipe-pen corral, and hay and water were supplied ad libitum. Using a commercially available type-specific enzyme-linked immunosorbent assay, a none of the horses had detectable EHV-1 antibodies prior to study onset. Each horse was inoculated by instillation of 1 × 10⁷ plaque-forming units (PFU) of EHV-1/Army183 in a volume of 10 ml of tissue culture supernatant using a 15-cm catheter placed into the ventral nasal meatus. After virus inoculation, the horses were monitored daily for 13 days for clinical signs via physical examination and measurement of rectal temperature. Nasal secretions were collected on the challenge day (day 0) and daily thereafter for the duration of the study (days 1–13) using 15-cm-long Rayon-tipped swabs. b Swab tips were placed into 15-ml conical tubes containing 2 ml of viral transport medium (minimal essential medium with 0.125% gentamycin and 0.1% amphotericin B) and processed for nucleic acid purification the same day. All procedures were approved by the Institutional Animal Care and Use Committee of the University of California at Davis.
Additionally, nasal swabs were collected from 30 adult horses with field exposure to EHV-1. These horses were presented either to primary care veterinarians or to the William R. Pritchard Veterinary Medical Teaching Hospital (University of California at Davis) because of acute onset of fever or neurologic signs. These horses were involved in several confirmed EHV-1 outbreaks that occurred in 2007 and 2008 throughout California. For each horse, a Rayon-tipped swab b was collected and submitted to the laboratory for nucleic acid purification in conical tubes containing 2 ml of viral transport medium.
Each tube was initially vortexed for 10 sec before removing the swab. Thereafter, 200 μl of medium containing nasal secretions was processed for nucleic acid purification using an automated nucleic acid extraction system c according to the manufacturer's recommendations. Nucleic acid yield from nasal swabs was quantified by spectrophotometric measurement of the absorbance at 260 nm using a microplate spectrophotometer. d All samples were assayed for the presence of the equine glyceraldehyde-3-phosphate dehydrogenase (eGAPDH) gene and the glycoprotein B (gB) gene of EHV-1 using previously reported real-time TaqMan PCR assays. 14 The total amount of nucleated cells for each collected swab was determined using a standard curve for eGAPDH. Absolute quantitation of EHV-1 target molecules was performed using standard curves for EHV-1 and eGAPDH and DNA yield and is expressed as: 1) EHV-1 gB gene copies per million cells, 2) EHV-1 gB gene copies per swab, 3) EHV-1 gB gene copies per 1 μl of extracted DNA, and 4) EHV-1 gB gene copies per 1 ng of template DNA.
Statistical data analysis was performed using the Mann-Whitney test to make pairwise comparisons of nucleated cells per nasal swab and total amount of DNA per swab at different time points throughout the study and between the 2 horse groups. A Spearman rank correlation test was used to assess the relationship between the 4 different viral load quantitation methods. A value of P < 0.05 was considered significant.
Clinical signs observed in the 4 experimentally infected horses were mild and consisted mostly of fever (rectal temperature > 38.6°C) and nasal discharge (Table 1). Fever was observed from 1 to 7 days after infection (mean time of fever = 3.75 days). Nasal discharge occurred for up to 6 days (mean time of nasal discharge = 5.25 days), from 2 to 7 days after infection, and varied from serous to mucopurulent in character. Ocular discharge and swelling of the submandibular lymph node were observed in only 1 horse. Depression, anorexia, and coughing were not detected in any horse.
Clinical signs in 4 horses following experimental inoculation with Equid herpesvirus 1. *
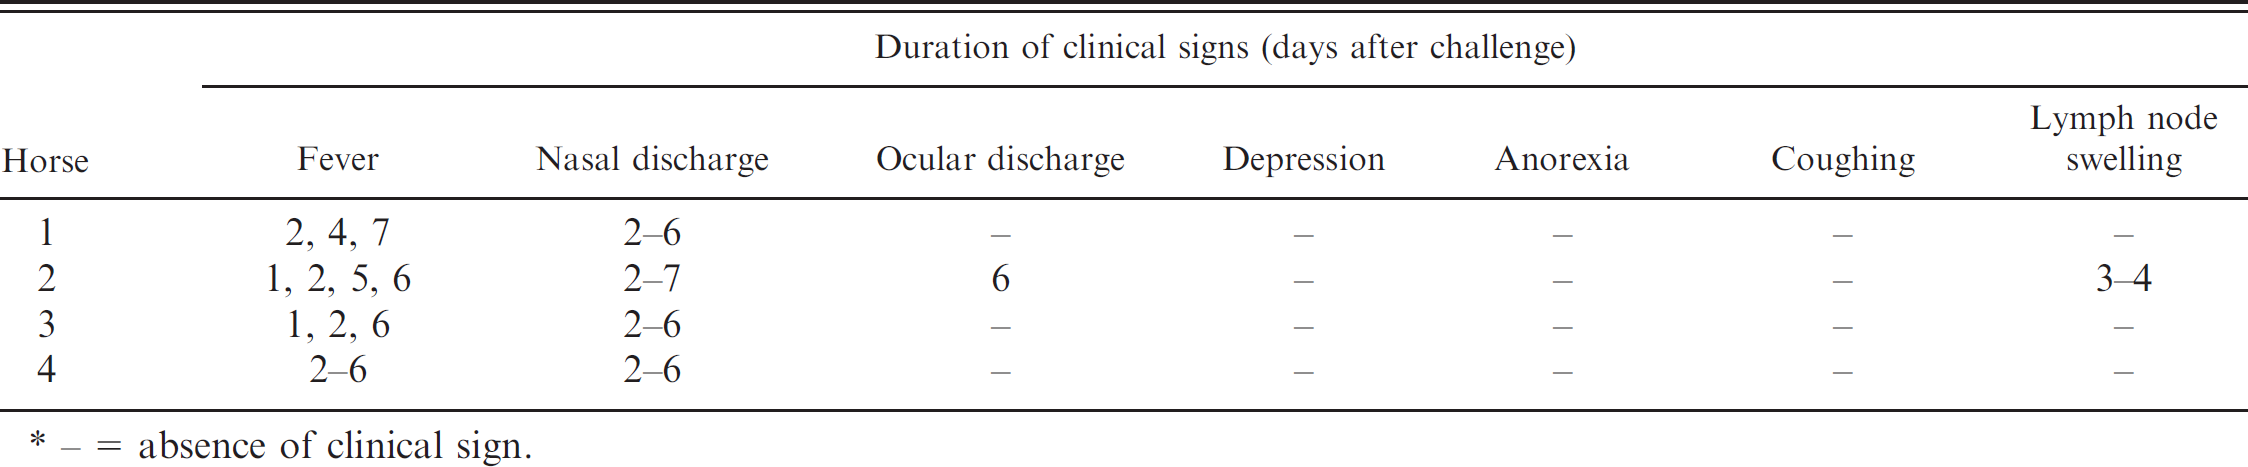
- = absence of clinical sign.
Nucleic acid was purified successfully from all nasal swabs of the experimentally and naturally infected horses; the total amount of DNA yielded from each swab ranged from 11.7 to 26.6 μg per swab for the experimentally infected horses and from 10.4 to 20.0 μg per swab for the naturally infected horses. No statistically significant differences were found with regard to the amount of nucleic acid purified per swab from the experimentally infected horses at different time points (P > 0.05). Further, no statistical differences were found between the amount of nucleic acid purified from swabs from experimentally and naturally infected horses (P > 0.05).
For the experimentally infected horses, the daily number of nucleated cells per swab ranged from 5.8 × 10⁵ to 7.3 × 10⁶, whereas the mean daily nucleated cell count per swab ranged from 1.3 × 10⁶ to 4.8 × 10⁶. The swabs of the naturally infected horses contained between 2 × 10⁵ and 5.4 × 10⁶ cells per swab (mean nucleated cell count per swab = 1.4 × 10⁶). The differences in nucleated cells per swab between the different time points and between experimentally and naturally infected horses were not statistically significant (P > 0.05).
Real-time PCR detected nasal viral shedding in all 4 experimentally infected horses, with a range of detection of 8–13 days (mean detection time = 11.5 days per horse). The calculated daily viral loads for the experimentally infected horses showed similar trends (Fig. 1). Viral shedding increased rapidly and peaked on day 2 after infection before decreasing slowly during the remaining study period. For the 4 different calculation methods, the mean daily viral loads ranged from 1,098 copies to 4.7 × 10⁸ EHV-1 gB gene copies per million nucleated cells, from 1,150 copies to 6.5 × 10⁸ EHV-1 gB gene copies per swab, from 5.9 copies to 3.1 × 10⁶ EHV-1 gB gene copies per 1 μl of extracted DNA, and from 0.093 copies to 4.2 × 10⁴ EHV-1 gB gene copies per 1 ng of template DNA. Results from the 4 different calculation methods showed a highly significant positive correlation between each other (r = 0.85 to 1; P < 0.001).
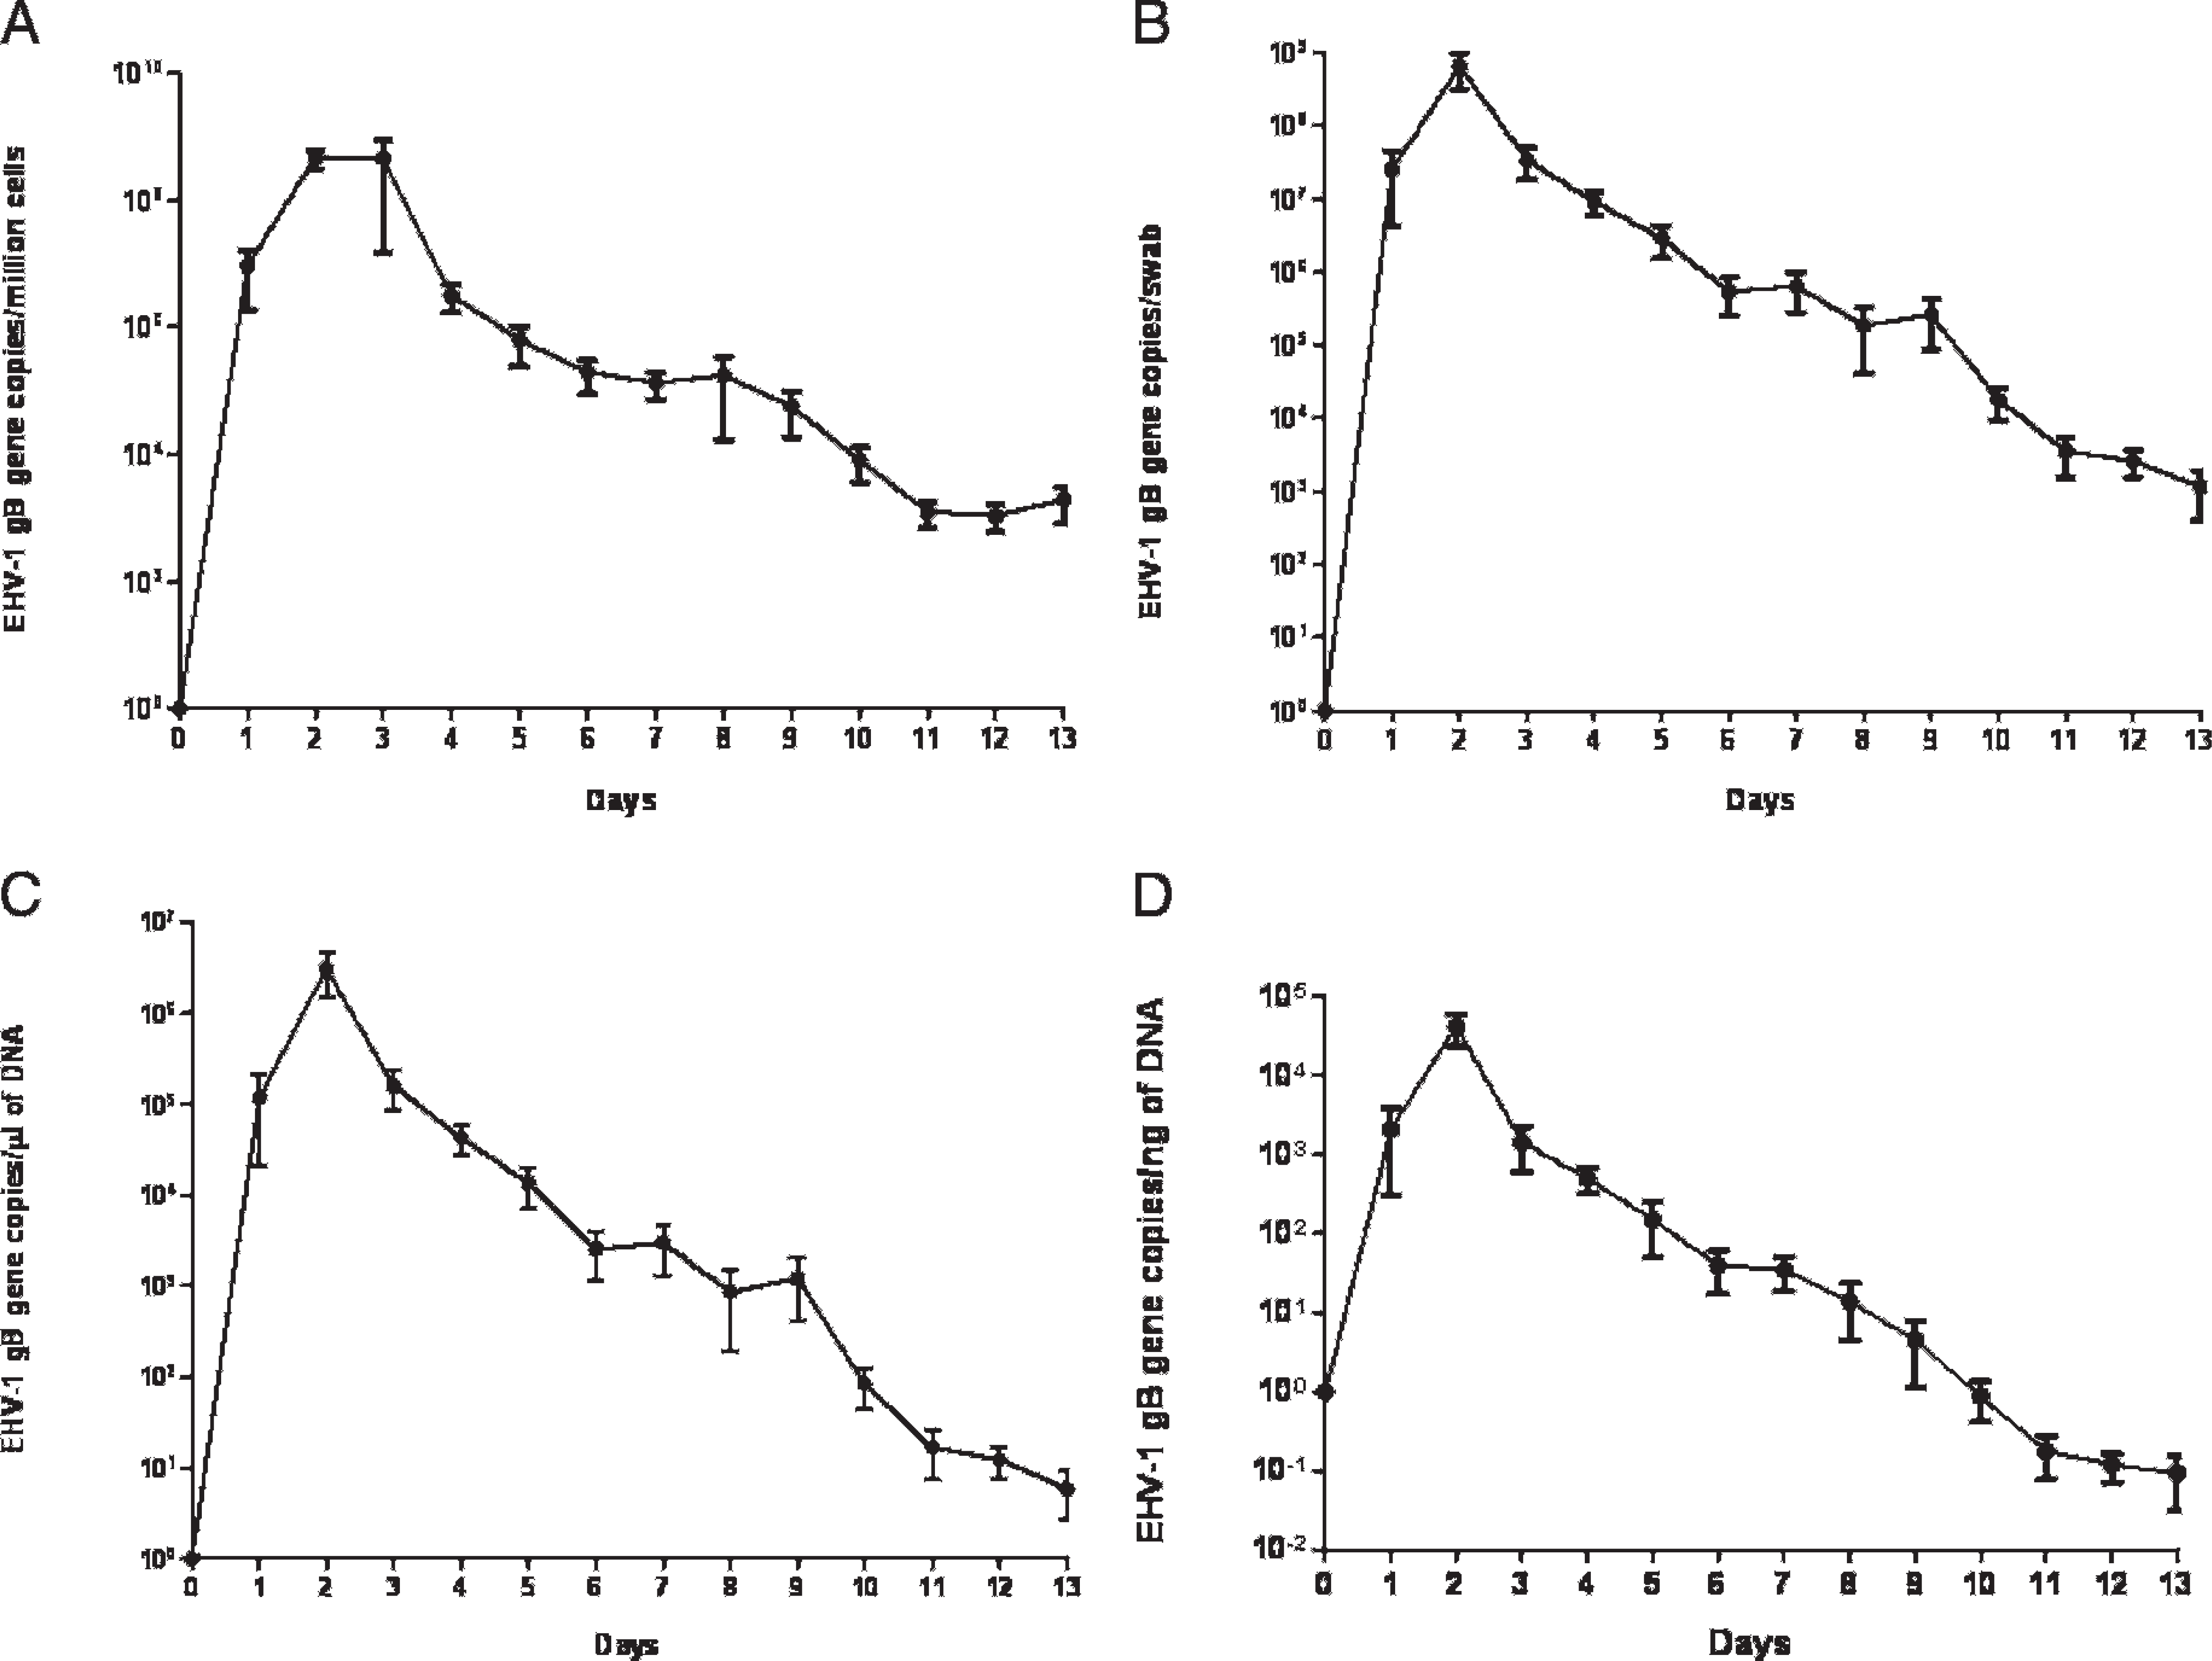
Results of Equid herpesvirus 1 (EHV-1) detection in nasal secretions in 4 horses experimentally infected with EHV-1. Plotted results express mean and SD of viral loads expressed as A, EHV-1 glycoprotein B (gB) gene copies per million nucleated nasal cells;
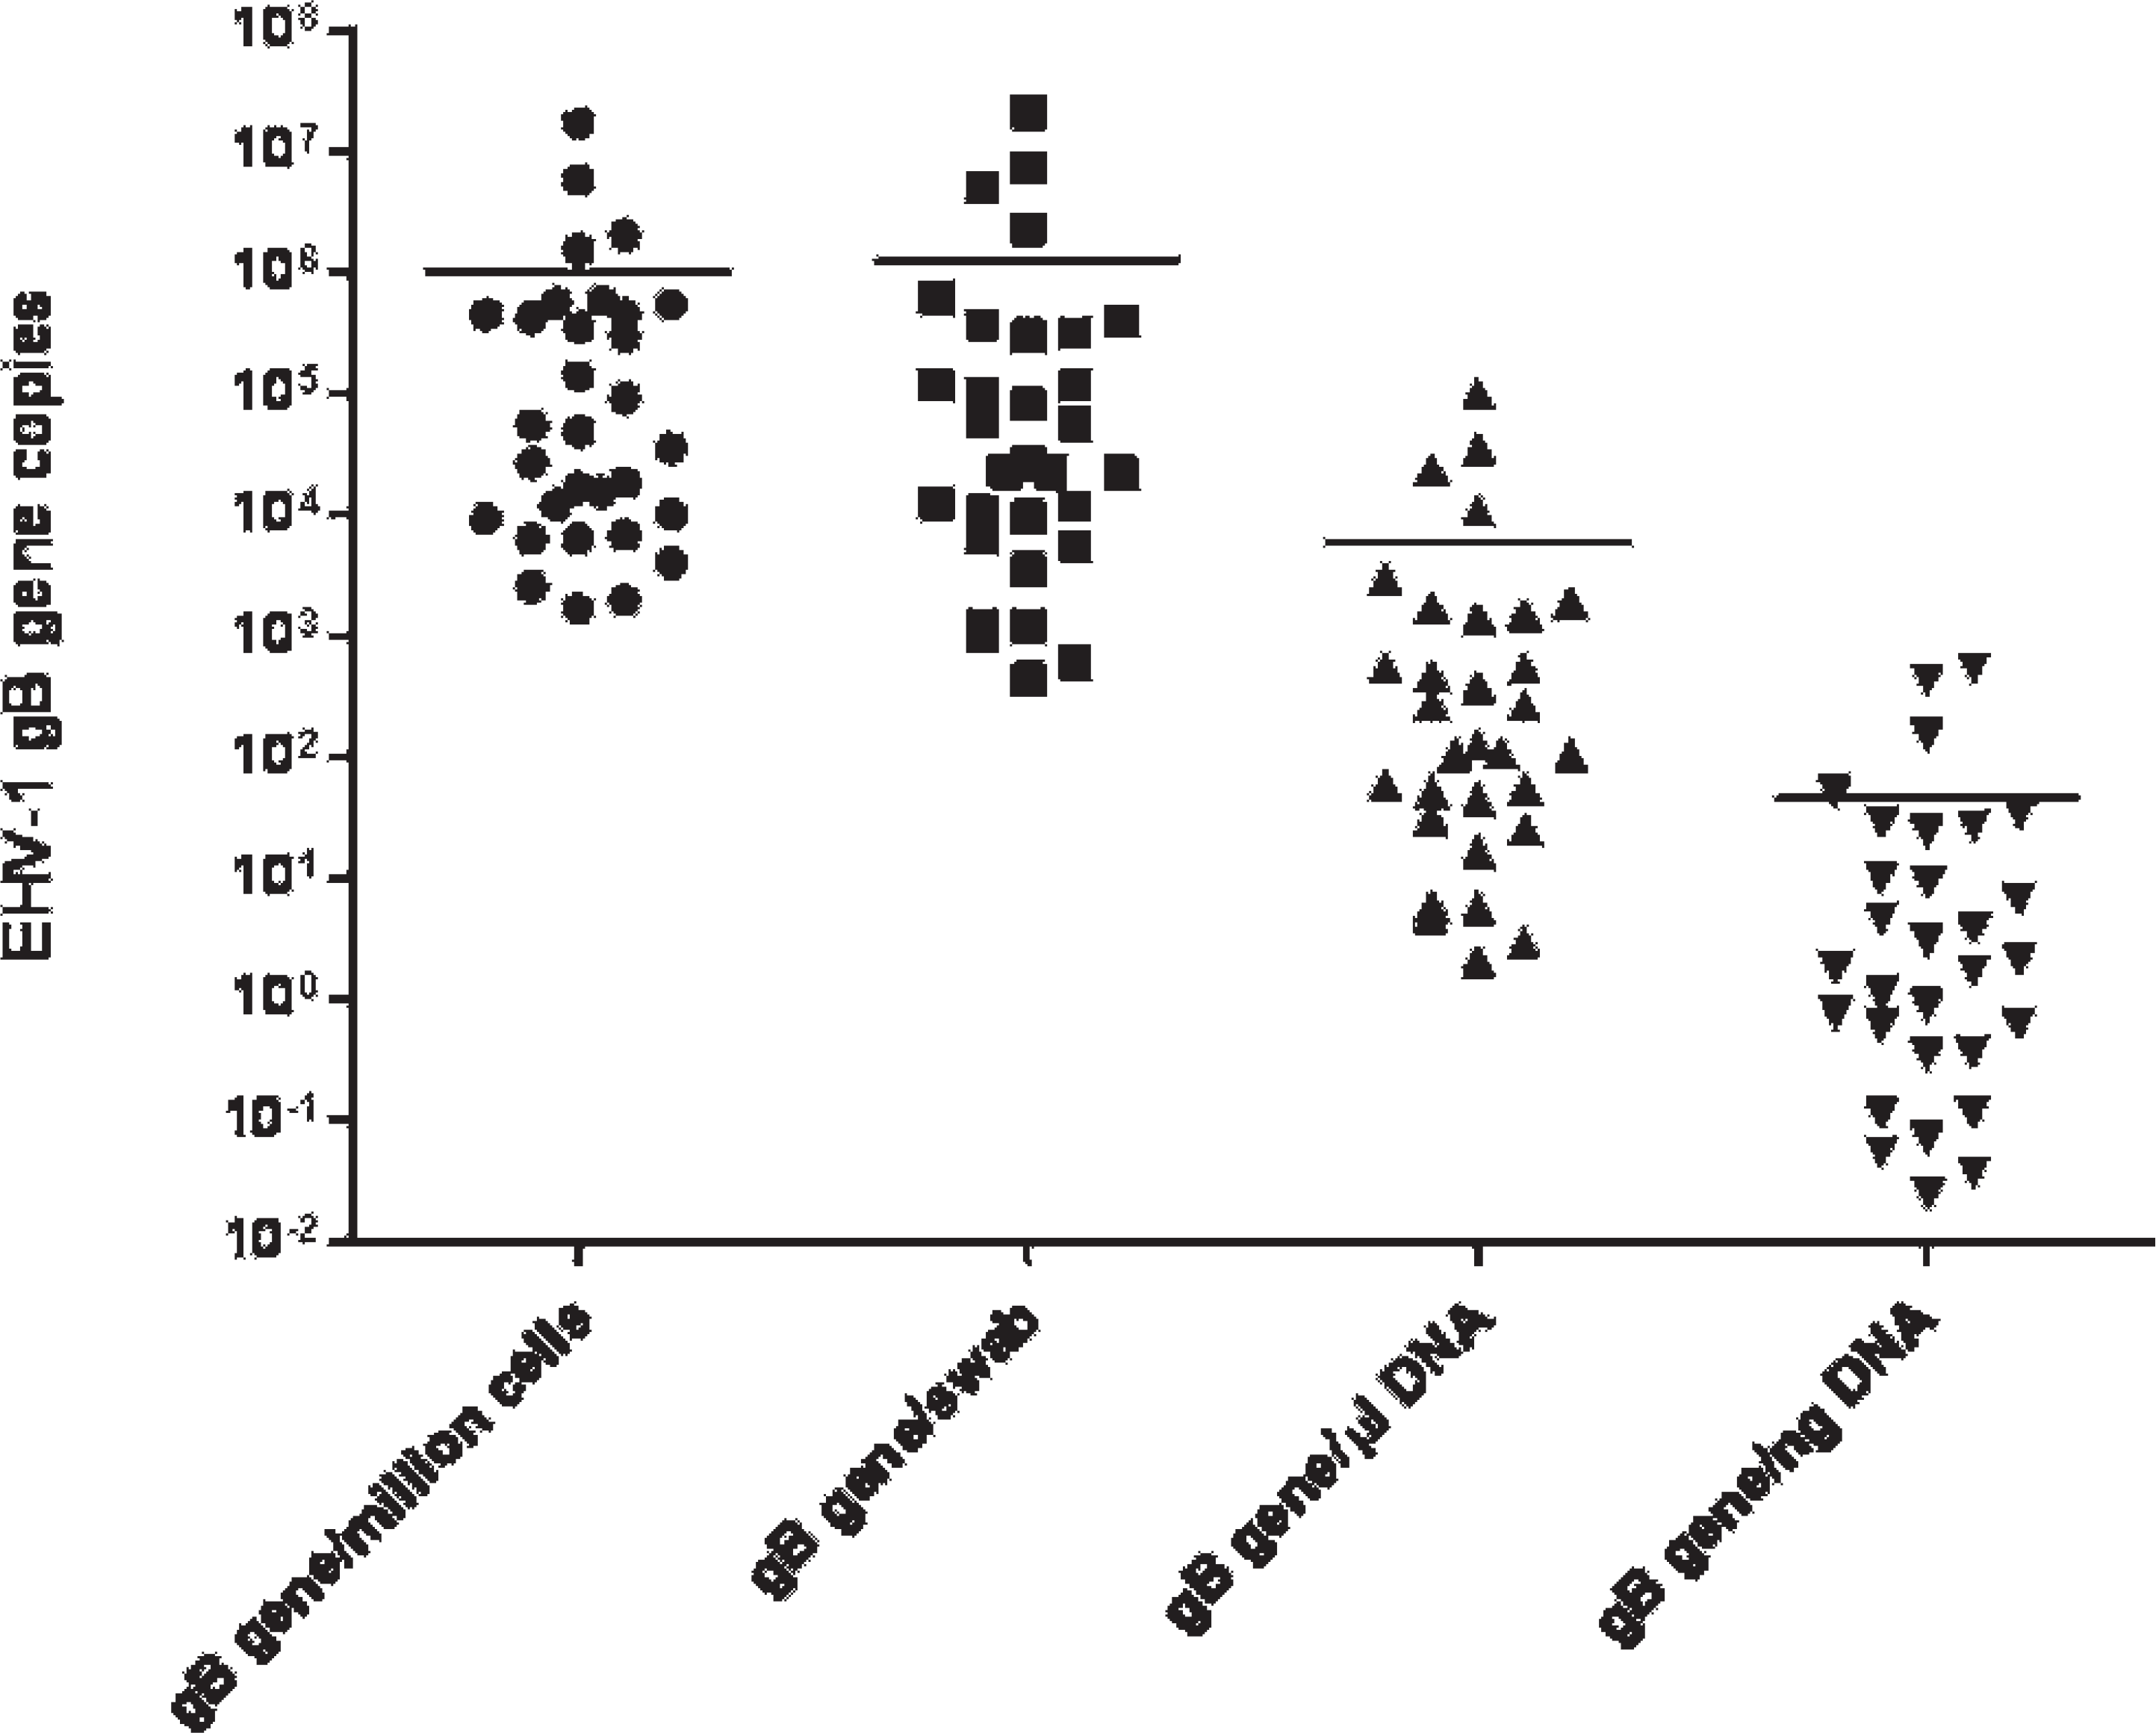
Quantitative results of Equid herpesvirus 1 (EHV-1) detection in nasal secretions of 30 naturally infected horses with EHV-1 using 4 different calculation methods (EHV-1 glycoprotein B [gB] gene copies per 1 million nucleated nasal cells, EHV-1 gB gene copies per swab, EHV-1 gB gene copies per 1 μl of extracted DNA, and EHV-1 gB gene copies per 1 ng of template DNA). Bars represent the means for each quantitative method.
In naturally infected horses, EHV-1 viral load ranged from 1,690 to 1.7 × 10⁷ EHV-1 gB gene copies per million nucleated cells (mean = 9.9 × 10⁵ gB gene copies per million cells), from 1,445 to 2.1 × 10⁷ EHV-1 gB gene copies per swab (mean = 1.3 × 10⁶ gB gene copies per swab), from 2.1 to 1.0 × 10⁵ EHV-1 gB gene copies per 1 μl of extracted DNA (mean = 5,937 gB gene copies per 1 μl of DNA), and from 0.03 to 554 EHV-1 gB gene copies per 1 ng of template DNA (mean = 45.1 gB gene copies per 1 ng of DNA; Fig. 2). Again, results from the 4 different calculation methods showed a highly significant positive correlation between each other (r = 0.71-1; P < 0.001).
Viral load testing by real-time PCR is used routinely in selected human infectious diseases (i.e., Human immunodeficiency virus, Hepatitis C virus) to determine prognosis and disease stage and to monitor response to therapy. 8,9,15 A similar approach has been reported recently for the molecular diagnosis of equine α-herpesviruses to discriminate between lytic and nonlytic infection. 11,12 However, standardized use of these novel PCR assays by both commercial and research laboratories is necessary for more accurate and reproducible investigation of disease outbreaks in the future.
The amount of nucleic acid recovered from the swabs of experimentally and naturally infected horses was similar to a recent study that compared different nucleic acid extraction methods. 7 Results of the current study determined that the amount of nucleic acid purified on the different study days, as well as between experimentally and naturally infected horses, was similar. This was likely due to a comparable saturation of the Rayon-tipped swabs with nasal secretions between the different time points and horse groups. It can be assumed that the size and composition of the swab may influence nucleic acid yield. Further, it is also possible that the yield of nucleic acid retrieved from the swabs may have been influenced by the maximal DNA-binding capability of the capture plate (20 μg) used in the automated extraction system. Equally important to the quantity of recovered nucleic acid is the quality of the extracted nucleic acid, which determines the sensitivity and accuracy of the target gene. For this study, equine GAPDH was used as the housekeeping gene to determine whether the extracted DNA specimens were free of amplification inhibitors and to calculate the number of nucleated cells per swab. The study results showed that each collected nasal swab contained approximately 1 million nucleated nasal cells and that variation in the amount of cells did not differ significantly between the different time points and horse groups. The positive correlation between nucleic acid yield and nucleated cells implies that most of the measurable nucleic acid originates from nucleated cells (epithelial and inflammatory cells) present in nasal secretions. Although it has become routine practice to limit nasal swabbing to the proximal ventral meatus of horses suspected with EHV-1 infection by using 15-cm-long Rayon- or Dacron-tipped nasal swabs, the use of larger swabs and variations in collection technique are factors that may influence the retrieval of nasal secretions, therefore influencing the cell number and amount of nucleic acid yield.
Previous attempts at quantitating EHV-1 by real-time PCR have reported the results as EHV-1 DNA copies per microliter of template DNA, 5 per nanogram of DNA, 6 per million cells, 12 and per milliliter of nasal swab. 10 Reporting results per volume of purified DNA is more subject to variation between laboratories and depends mainly on the extraction protocol used and the final volume of eluted DNA (most commercial extraction protocols use elution volumes between 80 and 200 μl for nasal swabs). Reporting results per unit of extracted DNA appears to be one of the most consistent methods, assuming all commercial extraction protocols have similar extraction efficiencies. However, one of the drawbacks of this approach is that the extracted DNA must be quantitated, thereby requiring an additional time-consuming step and specific equipment. Further, additional open-tube steps can increase the risk of contaminating the environment or the sample itself, especially when samples with high EHV-1 load are processed. The possible variability in cell number per nasal swab has been one of the main criticisms in normalizing viral load to an arbitrarily chosen number of nucleated cells. However, one of the advantages of normalizing the results against a housekeeping gene is that the same gene is used to determine sample quality (internal quality control) and extraction efficiency. For this reason, housekeeping genes also normalize preanalytic variables, such as loss of DNA (and RNA) integrity during sample collection, storage, and shipment. Neither of the other methods includes an assessment of these preanalytic variations, which can lead to increased frequency of false-negative PCR results. Finally, reporting PCR results per volume of nasal secretions has the same disadvantage as reporting per volume of extracted DNA. Variations in swab size, initial volume of fluid used to retrieve the nasal secretions from the swab, and all preanalytic variables are not controlled for and may influence the PCR results.
The study results show that all 4 calculation methods yielded comparable viral load dynamics in experimentally and naturally infected horses. The different calculation methods were significantly correlated with each other. For all horses, the expressions of EHV-1 viral load per million cells or per swab gave similar results. The similarity between these 2 methods is based on the comparable number of calculated or counted nucleated cells used to express viral load. Expression of the viral loads per microliter or nanogram gave 2–4 orders of magnitude lower values of absolute EHV-1 gB gene copies, respectively, when compared to viral loads expressed per million cells or per swab. However, one must keep in mind that this apparent difference between the different methods is related to the arbitrarily chosen units.
In conclusion, the present study showed comparable results in EHV-1 viral load dynamics in nasal secretions between 4 different absolute quantitation methods. For obvious reasons of reproducibility and accuracy, research and diagnostic laboratories tend to use quantitative methods with the least evidence of variability between samples and extraction protocols. Protocols normalizing their results against a preselected volume (i.e., eluted DNA or volume of nasal secretions) are likely to be more prone to variations than protocols standardizing the viral load to the entire swab, a housekeeping gene, or an arbitrarily chosen amount of extracted DNA. The use of an internal quality-control system further increases the reliability of the results and minimizes the risk of reporting false-negative results. By determining quality-control cutoffs based on prevalence data, false-negative PCR results can be minimized. Independently of each laboratory's preference, the use of quantitative results for EHV-1 has made tremendous improvements in the diagnostic field, with the potential for practitioners to determine the infectious nature of index cases, disease stage, or response to antiviral therapy.
Acknowledgements. The study was supported by the Center for Equine Health, School of Veterinary Medicine, University of California at Davis, with additional contributions from public and private donors. The authors would like to acknowledge the critical assistance they received from veterinarians and staff of the University of California at Davis during sample collection.
Footnotes
a.
Svanovir™, Svanova Biotech AB, Uppsala, Sweden.
b.
Sterile Rayon Tipped Applicators, Puritan Medical Products Company LLC, Guilford, ME.
c.
CAS-1820 X-tractor Gene, Corbett Life Science, Sydney, Australia.
d.
BioTek Instruments Inc., Winooski, VT.