
Abstract
Proliferative gill disease (PGD), caused by the myxozoan parasite Henneguya ictaluri, is the most prevalent parasitic infection affecting commercial channel catfish (Ictalurus punctatus) aquaculture. There are currently no effective chemotherapeutic or biological control measures for PGD, which often peaks during the spring and fall when water temperatures are between 16–25°C. The current diagnostic techniques of gross examination of gill clip wet mounts and histopathology are subject to false-negatives during the early stages of infection, and the quantifiable nature of end-point polymerase chain reaction (PCR) is subjective. Consequently, a rapid and more sensitive quantitative real-time PCR assay was developed for the detection of H. ictaluri during the early stages of infection in channel catfish. A 23 base-pair TaqMan probe was designed based on previously published H. ictaluri PCR protocols. The sensitivity of the assay was the equivalent of a single H. ictaluri actinospore, and in a pond challenge study, quantitative real-time PCR proved to be more sensitive than gross examination, microscopic examination of gill clip wet mounts, and histopathologic examination of gill tissue sections. Future applications of this assay will focus on developing methodologies to be used in conjunction with current pond-monitoring protocols to evaluate potential treatments and better manage this significant seasonal disease.
Introduction
Proliferative gill disease (PGD), first reported in 1981, is one of the most significant parasitic infections to affect the commercial production of channel catfish, Ictalurus punctatus (Rafinesque, 1818). Losses are greatest at temperature ranges of 16–25°C and can result in mortality rates in excess of 50%. 4,16 The disease, commonly known as “hamburger gill,” is characterized grossly by swelling, hemorrhage, and distortion of the gill filaments, which creates a mottled appearance. Chondrolysis due to localization of parasitic trophozoites causes the gill filaments to become fragile and break. Epithelial cell hyperplasia and inflammatory cell infiltration associated with the developing organism drastically reduce the gill surface area, severely inhibiting gas exchange and osmoregulation. 4,16 Infected fish swim listlessly near the water's surface, exhibiting behaviors consistent with oxygen stress. Outbreaks of PGD are highly unpredictable and many cases go unreported. 26 Losses can occur in all sizes of fish; however, smaller fish appear to be most susceptible to the disease. Additional monetary losses occur from subclinical infections, which can result in decreased feed intake and growth rates. Currently, there are no efficacious therapeutic or prophylactic treatments for PGD, and attempted biosecurity methods have been unsuccessful. 17,26
Molecular evidence has confirmed previous work (Bellerud BL: 1993, Etiological and epidemiological factors effecting outbreaks of proliferative gill disease on Mississippi channel catfish farms. Doctoral dissertation. Mississippi State University, Starkville, MS; Burtle GJ: 1998, Control of the oligochaete vector of proliferative gill disease in catfish. 1998 Annual Report, Department of Animal and Dairy Science, The University of Georgia, College of Agricultural and Environmental Sciences 22–25) 2,5,18,23 linking the cause of the disease to the myxozoan parasite Henneguya ictaluri. 19,20 The Complex life cycle involves a myxospore stage in channel catfish and an actinospore stage in the benthic oligochete Dero digitata (Bellerud BL: 1993, Doctoral dissertation). 2,5,11,17,19,20,23–26 Damage to gill tissue is thought to result from the development of an intense inflammatory reaction by the fish in response to penetration and proliferation of the actinospore stage of the parasite life cycle 19,20,23,26 (Fig. 1). A presumptive diagnosis is based on the presence of lytic areas in the filamental cartilage, seen microscopically in gill wet mounts (Fig. 2); however, this method is more reliable in smaller fish where size does not limit the number of filaments that can be accurately examined. Trophozoites are typically not seen unless histopathologic examination of gill sections is performed. The diagnosis is confirmed based on the presence of multinucleated trophozoites surrounded by granulomatous inflammation (Figs. 3, 4) in hematoxylin and eosin (HE)-stained tissue sections or by H. ictaluri-specific polymerase chain reaction (PCR). 19,24,26 Research has shown that although PCR is more sensitive than histologic examination and more reliable in detecting early stages of infection, 24 it is unable to objectively quantify level of infection and is relatively time consuming in that it requires postreaction processing.
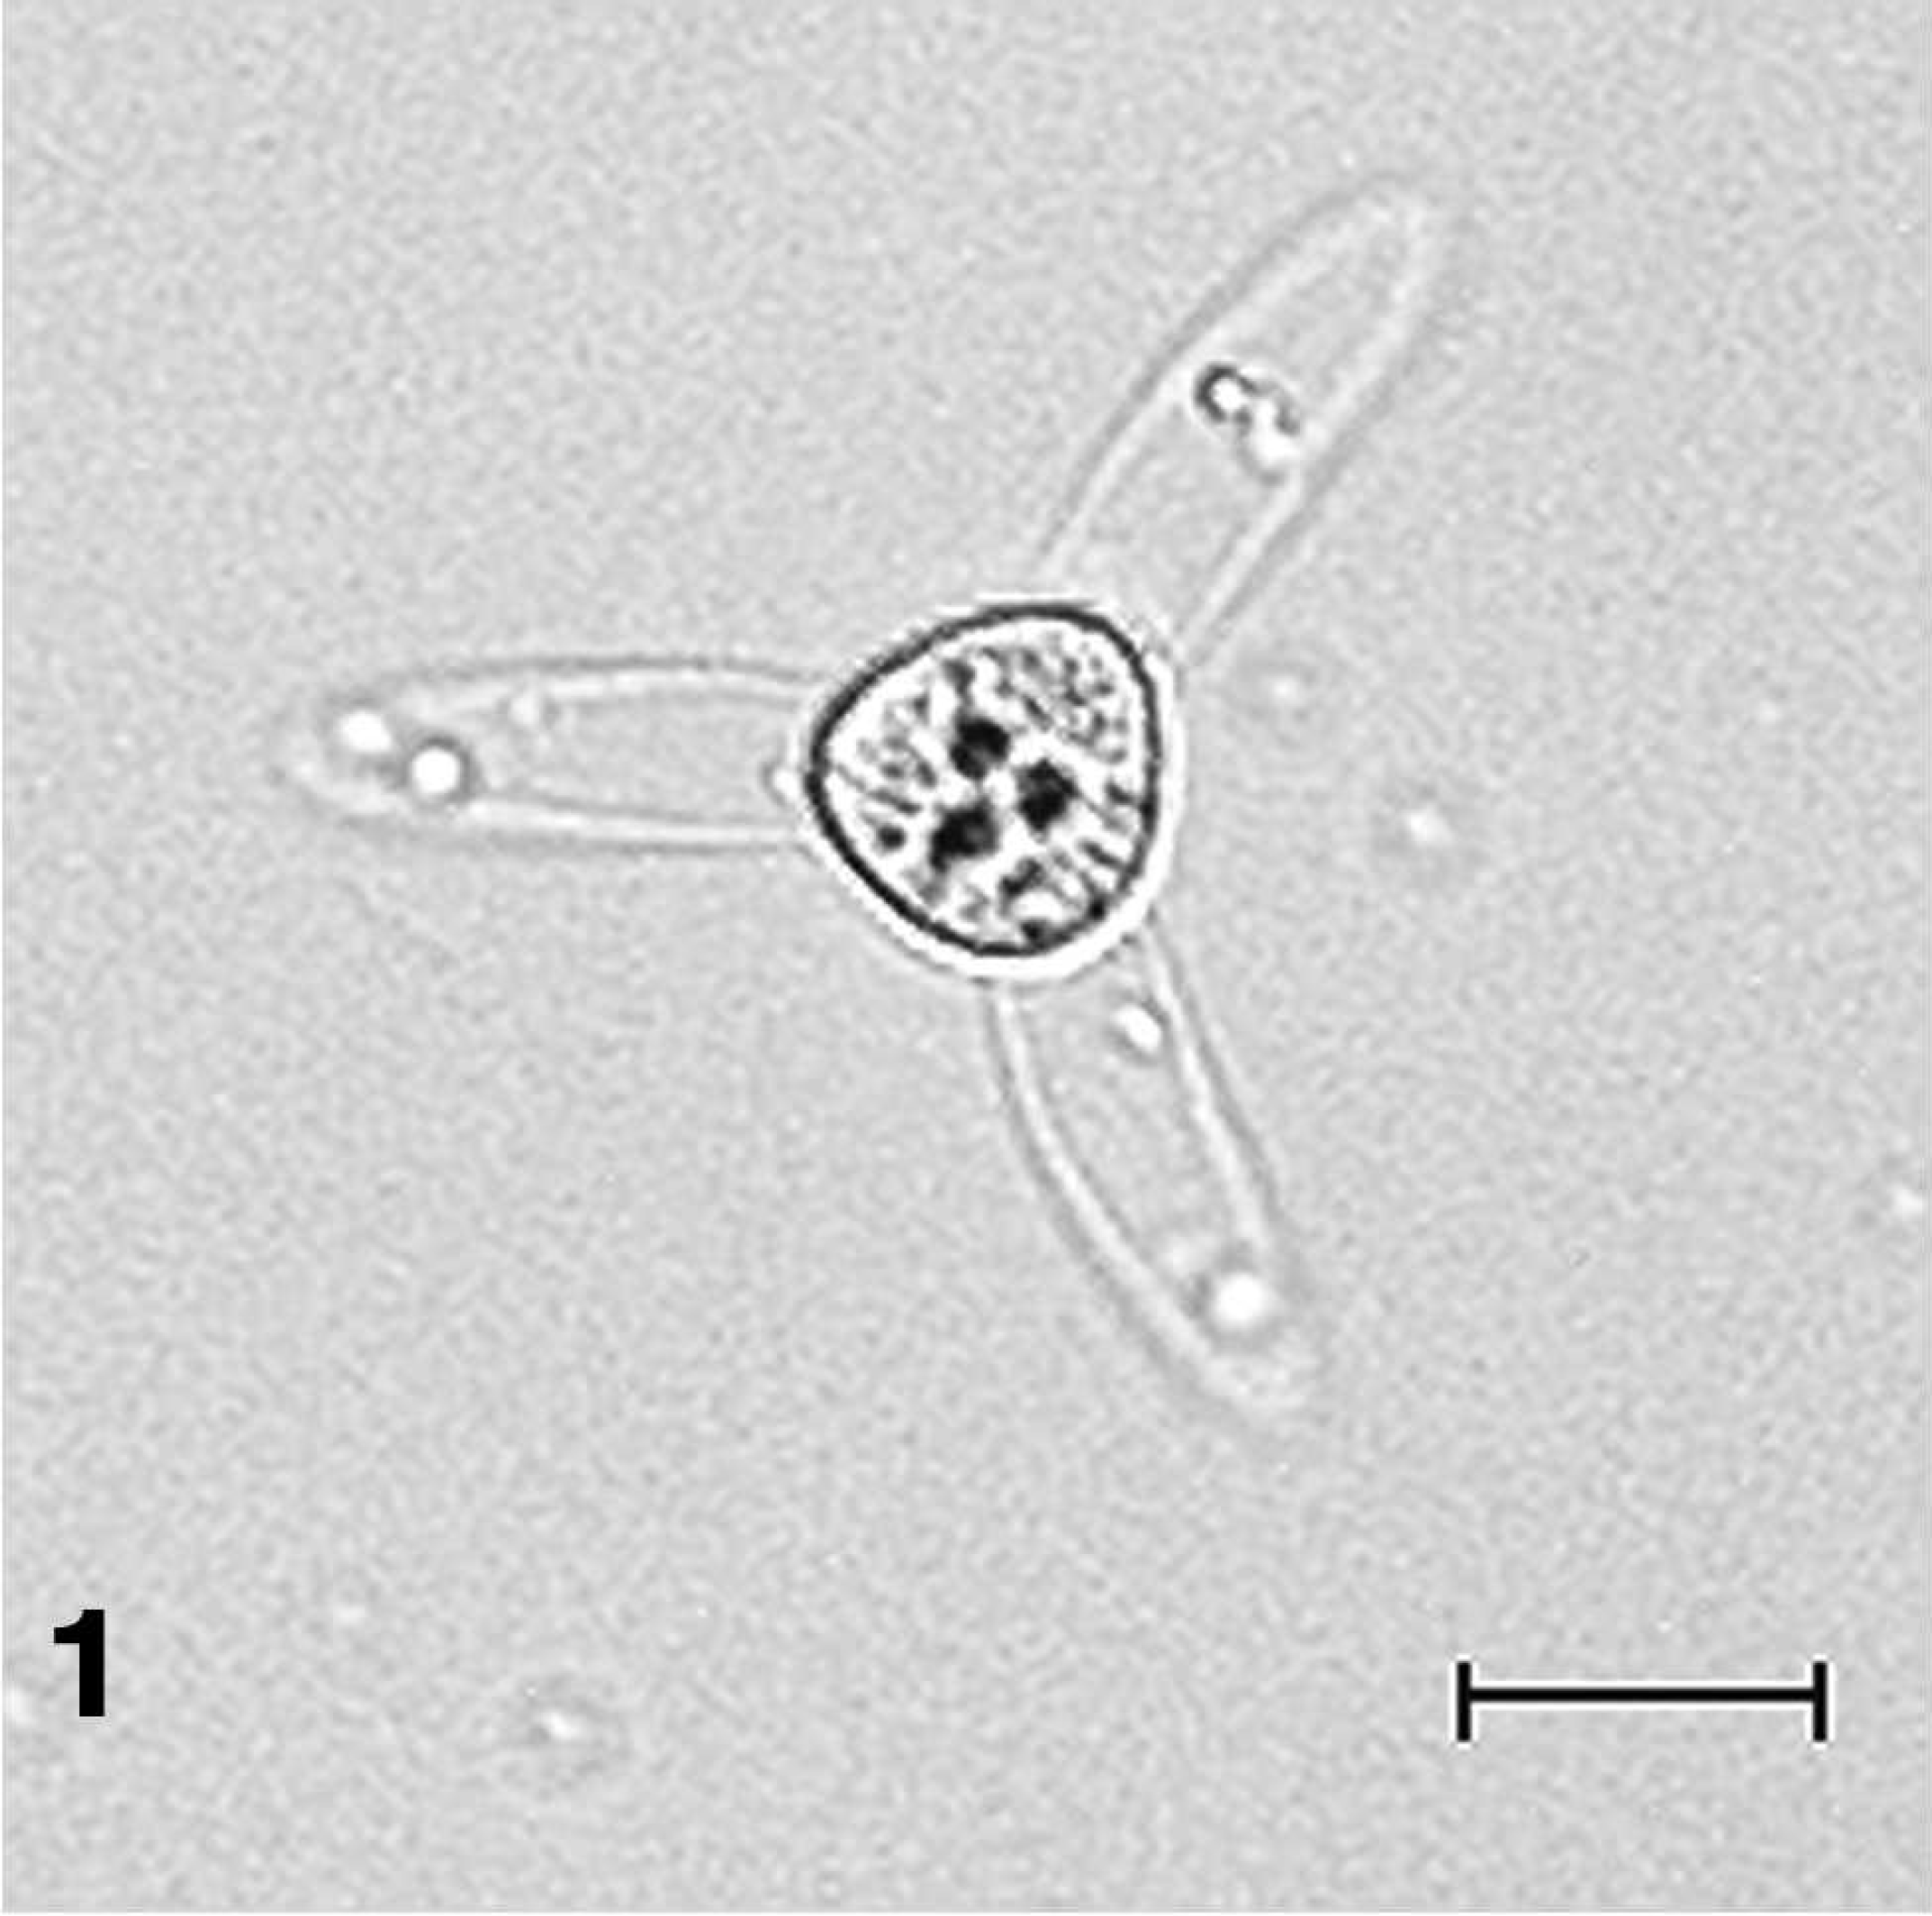
Henneguya ictaluri aurantiactinomyxon-type actinospore. Bar = 20 μm.
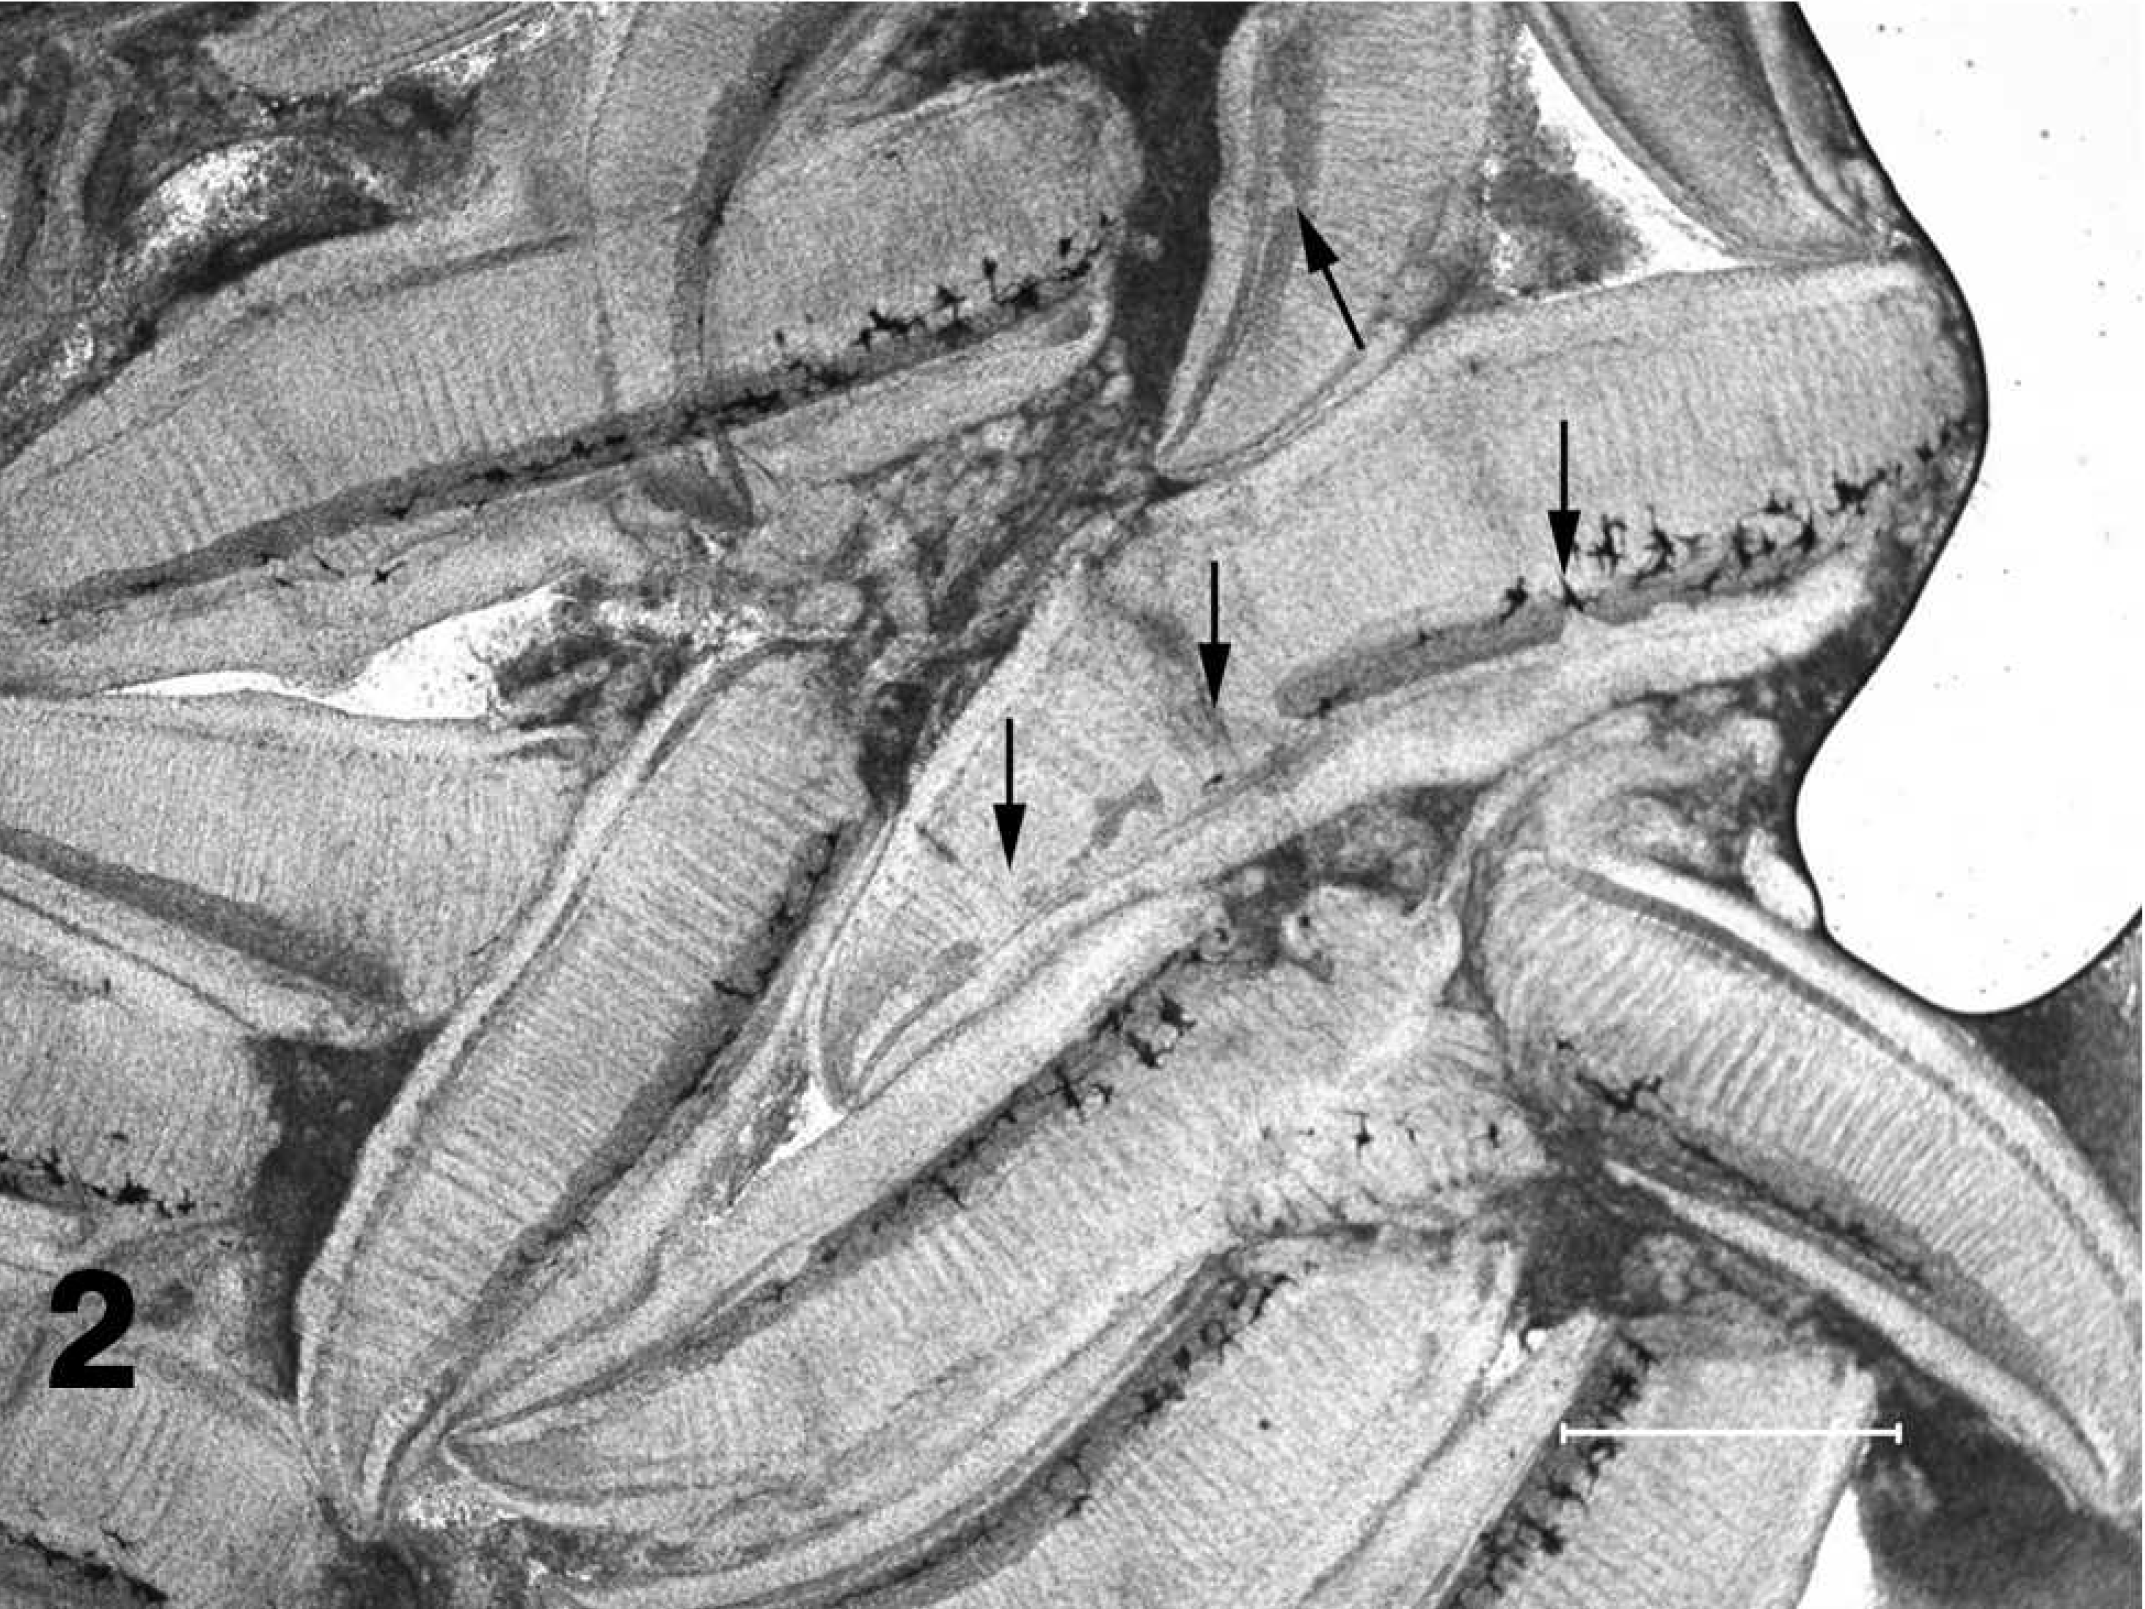
Wet mount preparation of gill filaments excised from a channel catfish fingerling with proliferative gill disease demonstrating foci of chondrolysis in the filamental cartilage (arrows). Bar = 1 mm.
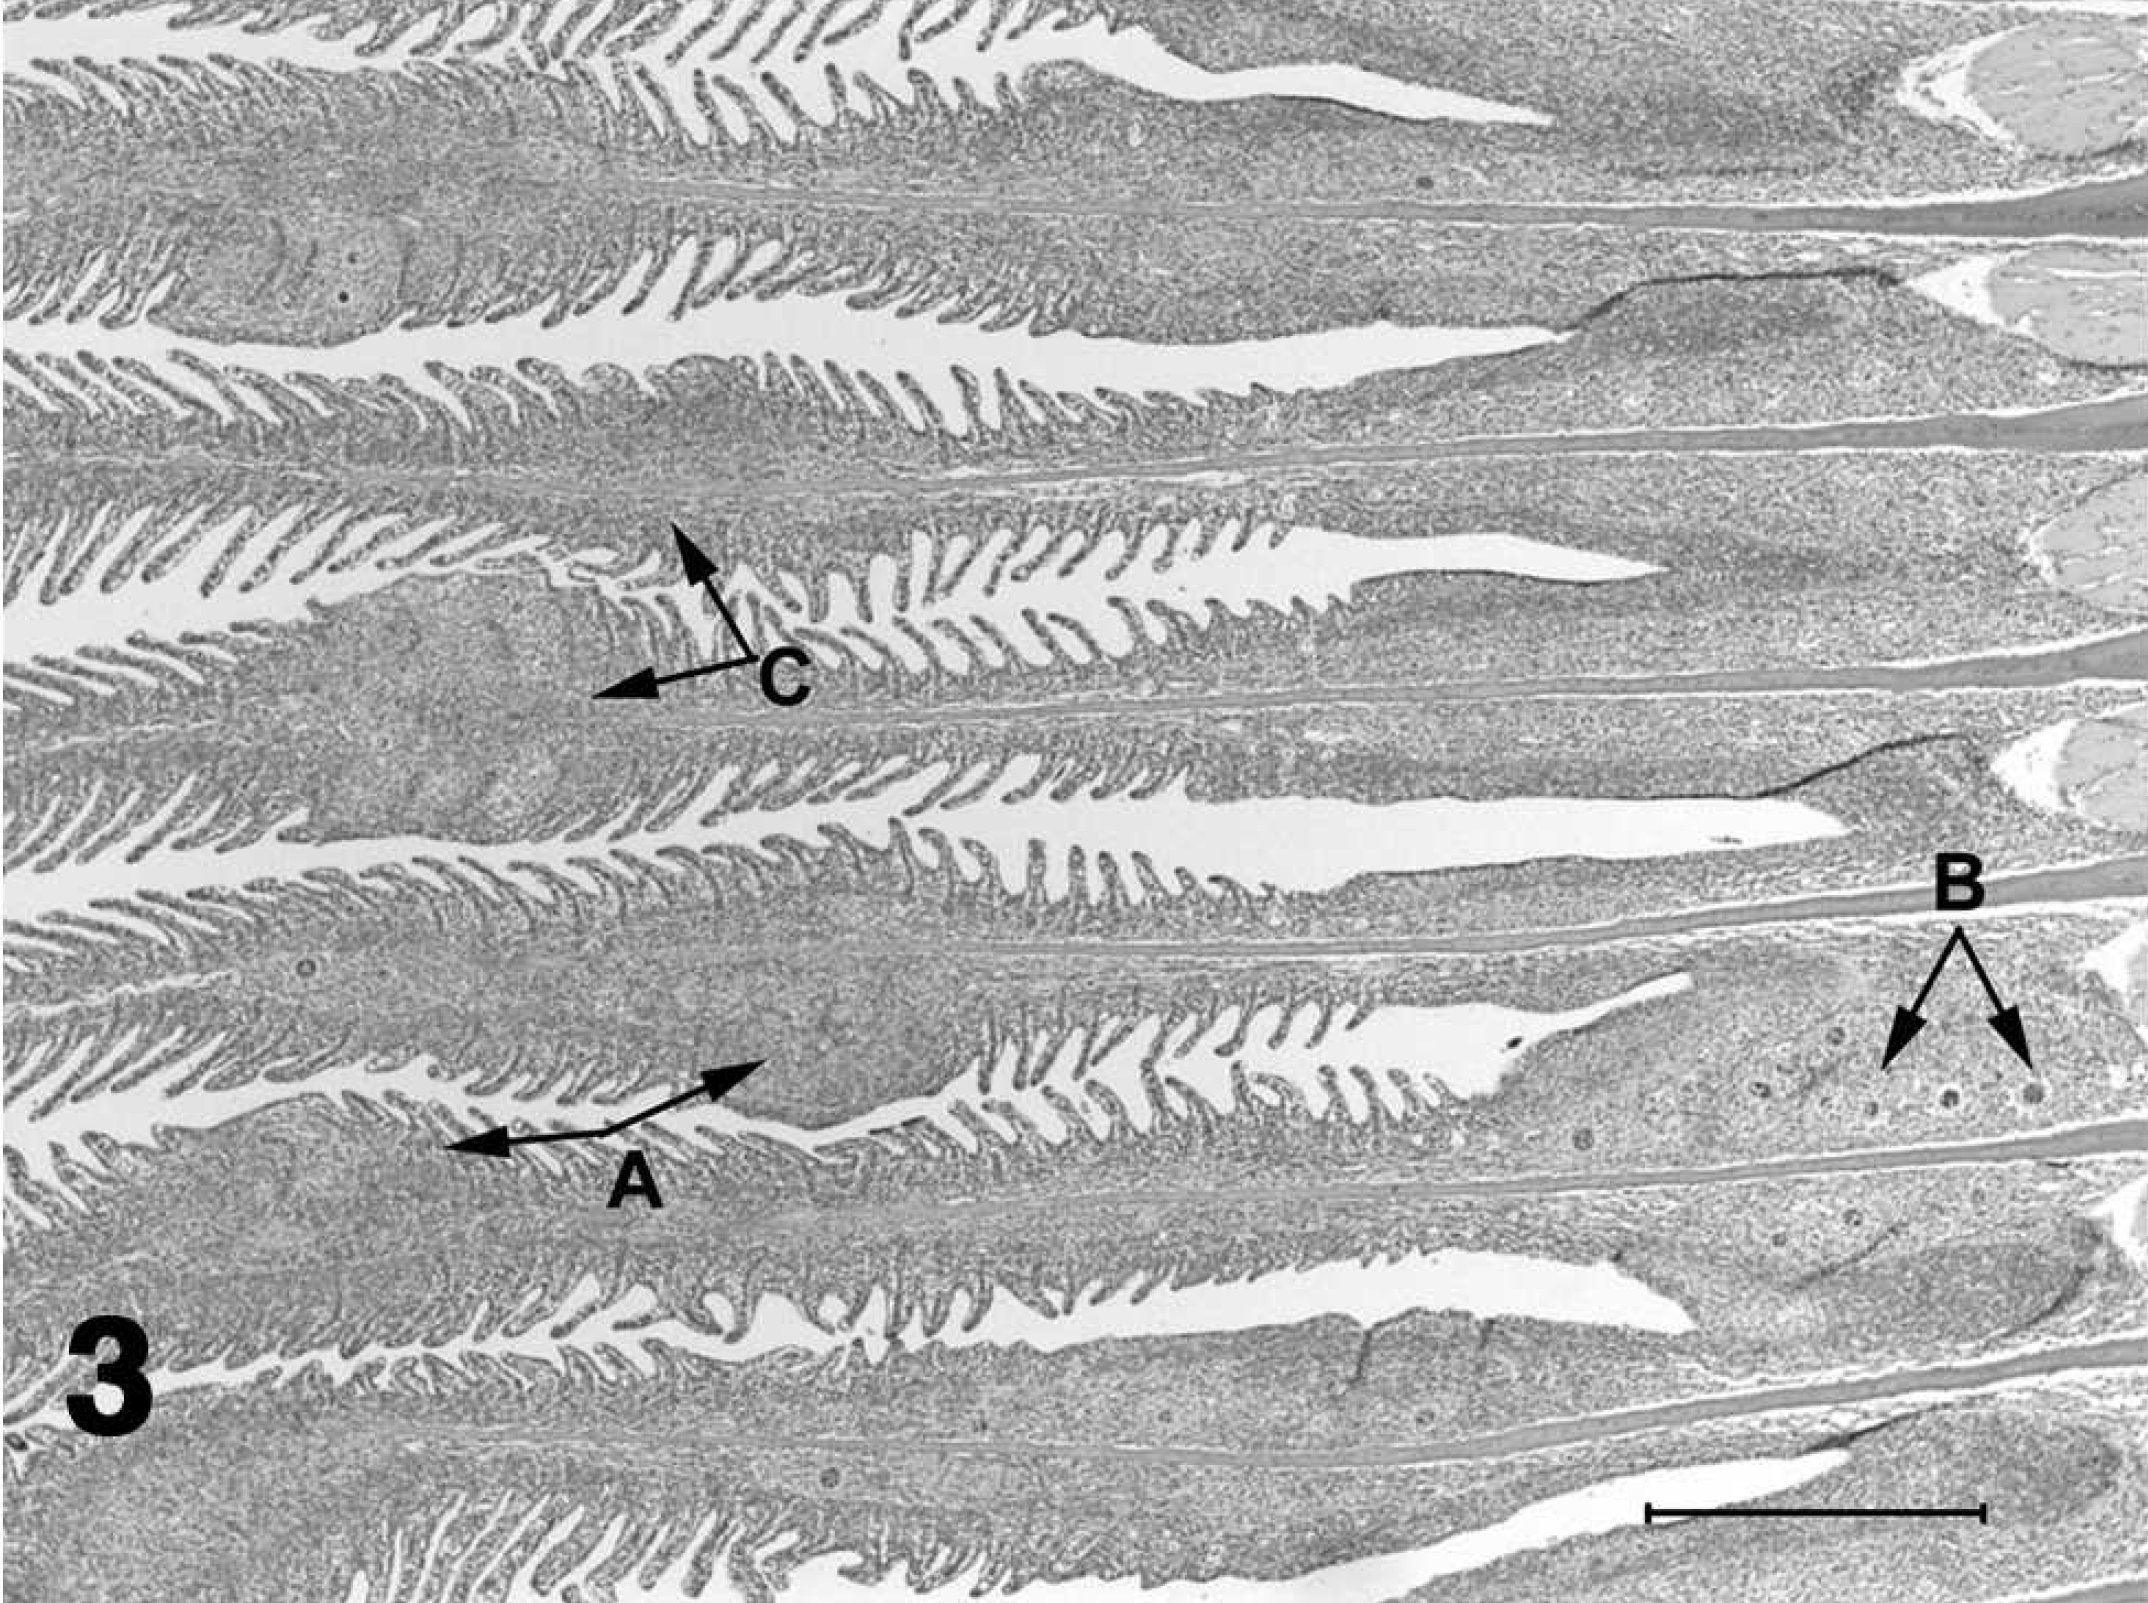
Histologic section of gill from a channel catfish fingerling with proliferative gill disease.
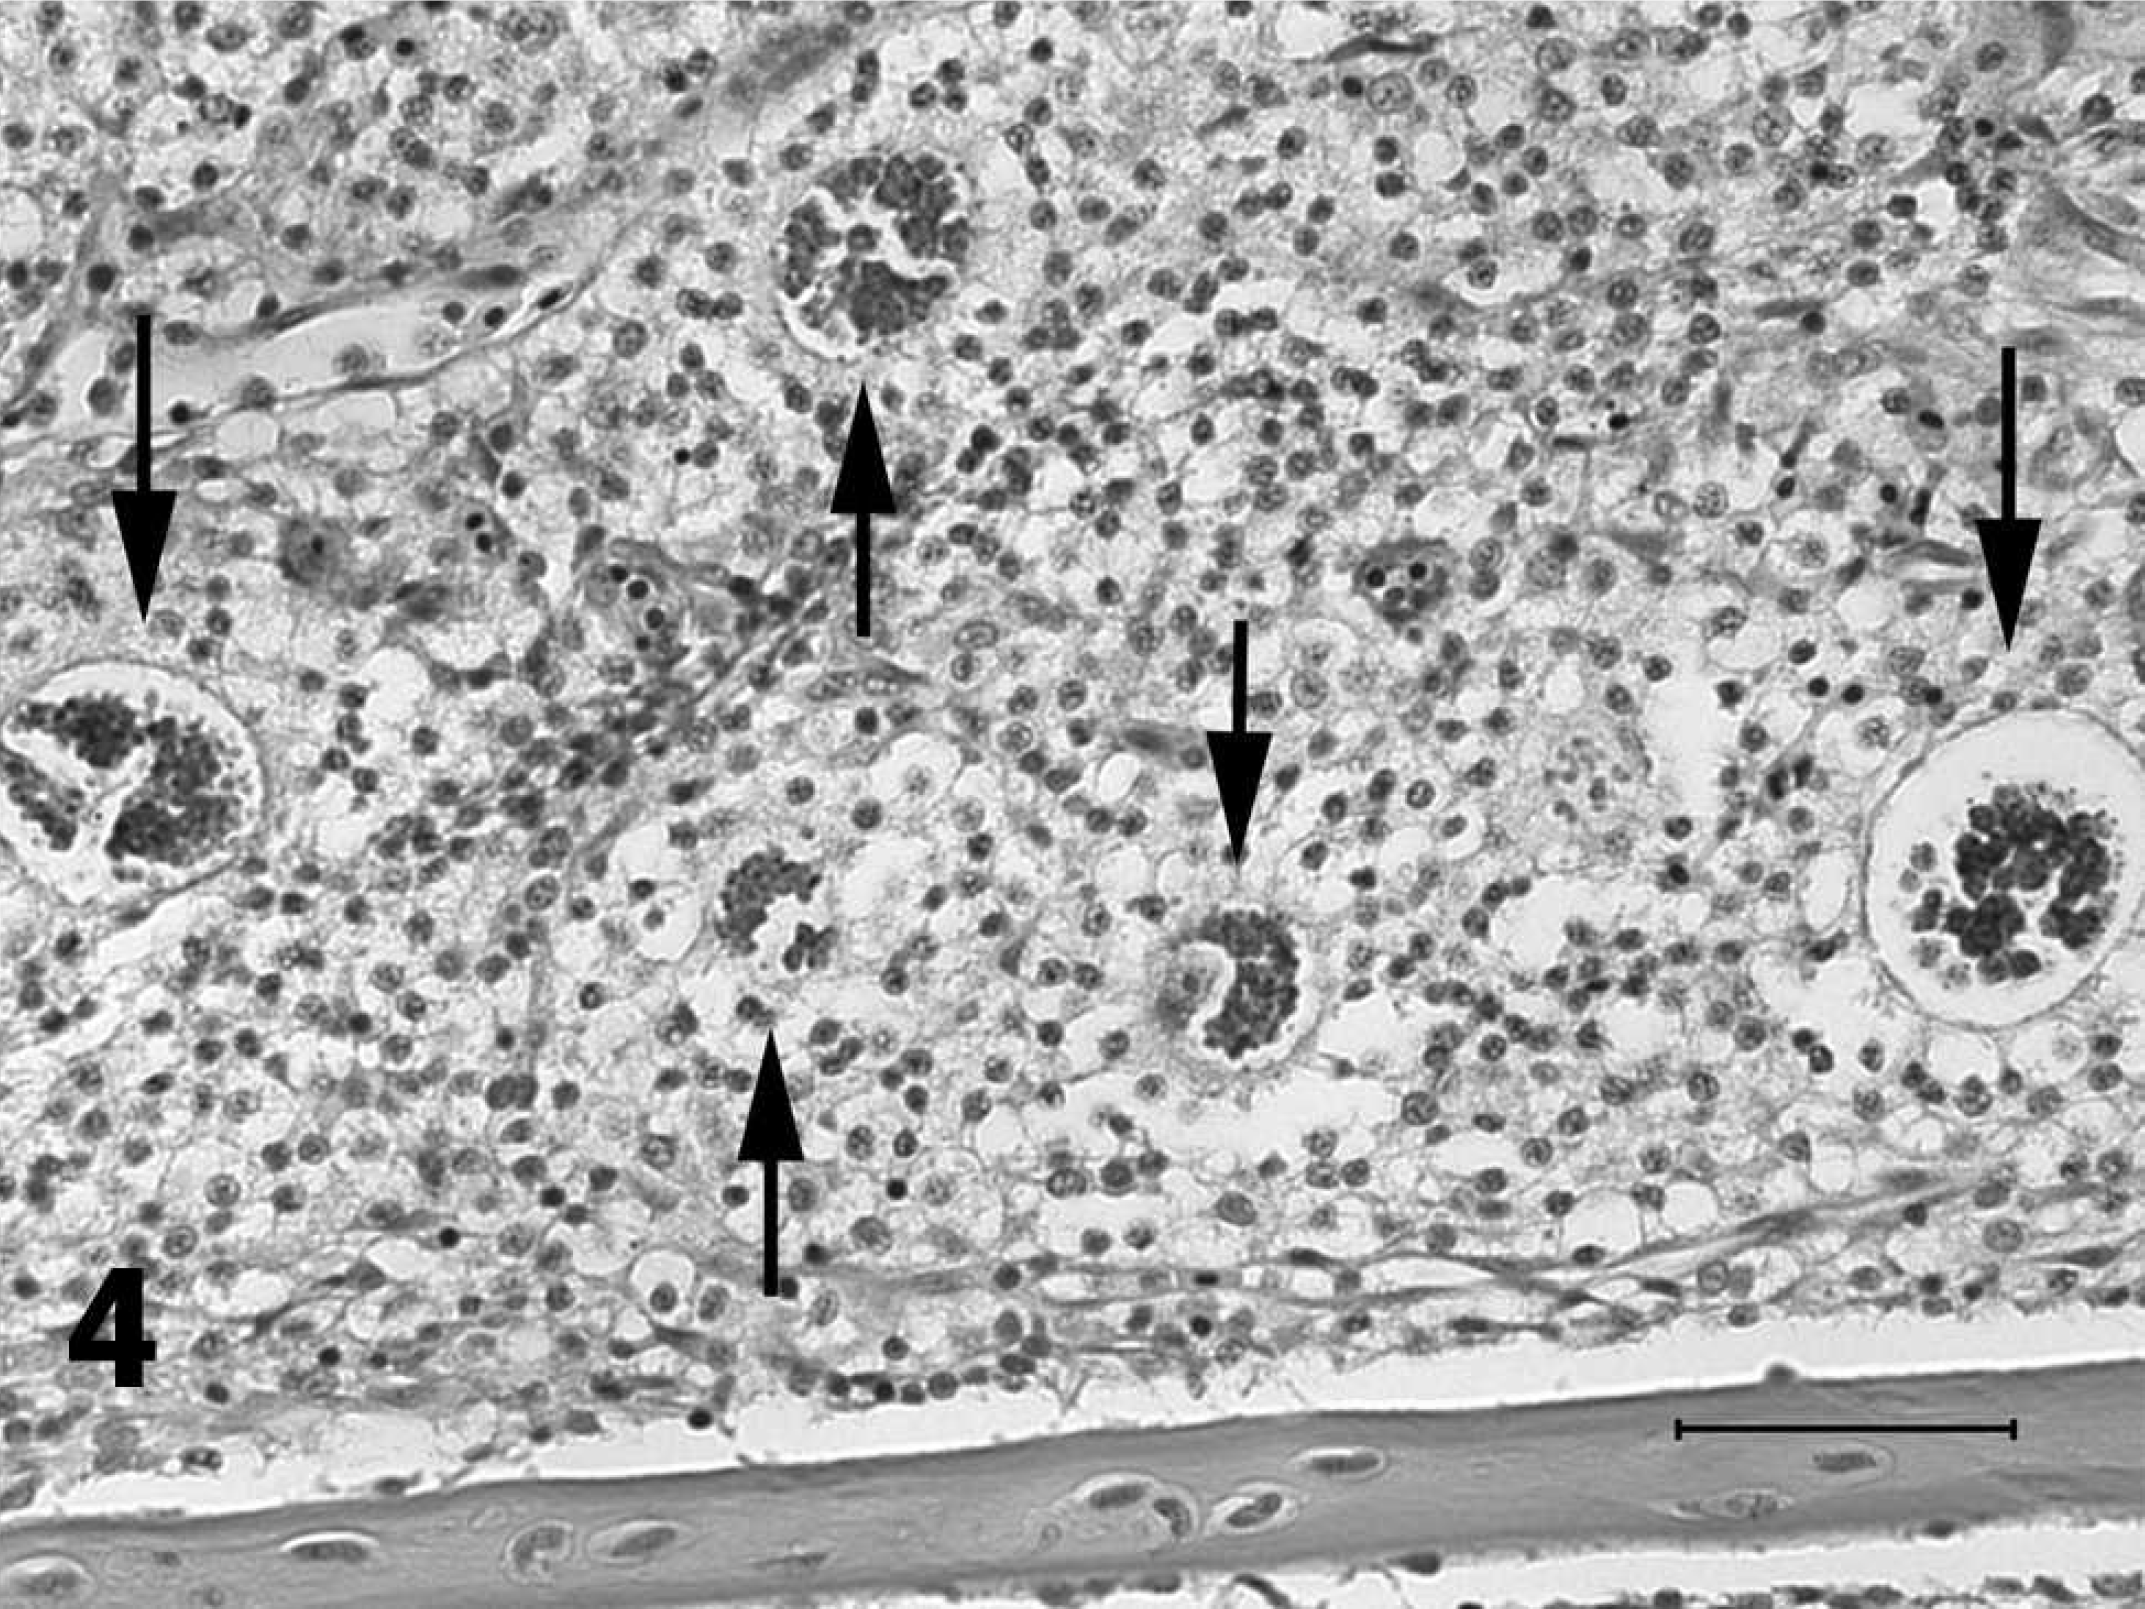
Higher magnification of deeply basophilic granular aggregates composed of multiple small trophozoites (arrows) in the gill of a channel catfish fingerling with proliferative gill disease. Hematoxylin and eosin stain. Bar = 50 μm.
Quantitative real-time PCR uses PCR chemistry in conjunction with fluorogenic probes to detect and monitor the amplification of reaction products after each amplification cycle. 12 This allows rapid detection and quantification of PCR product as well as a means to monitor the reaction as it progresses, thereby eliminating the need for postreaction processing. Reactions are characterized by the PCR cycle in which target amplification emits sufficient fluorescence to cross a predetermined threshold significantly greater than background fluorescence, referred to as the cycle threshold (Ct). 12,27 Consequently, the greater the starting quantity of target DNA added to a reaction, the fewer number of cycles necessary for a significant increase in fluorescence to appear, yielding a lower Ct value. Using serially diluted standards of known concentrations to generate a standard curve, absolute quantitation of PCR product can be determined, assuming standards and samples have approximately equal amplification efficiencies. Standards for double-stranded DNA are normally created by cloning the target amplicon in a plasmid vector. 12,22,27 The standard curve produces a linear relationship between Ct values and starting quantities of template DNA, allowing the determination of plasmid standard equivalents (PSEs) for unknown samples based on their respective Ct values. 12,27
Quantitative real-time PCR has been used in the detection of pathogens in a number of aquatic systems, including fish tissues and environmental water samples. 1,3,6–10,14 This assay is often more sensitive than conventional diagnostic techniques and offers the ability to quantify the pathogen, even at very low levels. In most cases, real-time PCR provides a rapid, more sensitive means of pathogen detection than conventional end-point PCR 13 and may be less subject to contamination than nested PCR assay.
Development of a more sensitive, quantifiable method of detecting subclinical PGD infections in channel catfish is important during the spring and fall when identifying a potential outbreak can avert major economic losses to the disease. A quantitative realtime PCR assay specific for H. ictaluri was developed for the detection and quantification of H. ictaluri infections in channel catfish. The assay's efficacy as a diagnostic tool was evaluated against the currently practiced diagnostic techniques of conventional PCR and microscopic examination of histologic sections and gill wet mounts.
Materials and methods
Actinospore collection
Benthic sediment was collected from a commercial channel catfish pond experiencing an outbreak of PGD in the resident catfish population, diagnosed by the Aquatic Diagnostic Laboratory (National Warmwater Aquaculture Center [NWAC], Stoneville, MS). Dero digitata were isolated from the benthic sediment 2,18 and observed for 72 hr for the passing of the actinospore stages of H. ictaluri, H. exilis, and Aurantiactinomyxon mississippiensis. Organisms were identified morphologically according to descriptions of actinospores commonly found in commercial channel catfish ponds (Bellerud BL: 1993, Doctoral dissertation). Actinospores of each species were pooled separately by species, were enumerated, and a subsample was taken for molecular confirmation by sequencing. 11,20,24
DNA extraction from actinospores
Actinospores were suspended in 20 ml of nuclease-free H2O and gently stirred with a magnetic stir bar. The concentration of actinospores/μl was determined by counting the number of actinospores in 10 separate 10-μl samples. Eight aliquots of volumes representative of 25 and 100 H. ictaluri actinospores were collected using a volumetric pipette and placed in individual 1.5-ml micro-centrifuge tubes. Eight aliquots of 5 and 10 actinospores and 16 aliquots of a single actinospore were collected using a fine glass pipette and also placed directly in individual 1.5-ml microcentrifuge tubes. The actinospores were centrifuged at 7,000 × g for 10 min and the pellet resuspended in 600 μl of cell lysis solution from a DNA isolation kit. a Proteinase K (20 mg/ml) was added before overnight incubation at 55°C. The remainder of the isolation was carried out according to the kit manufacturer's protocol for DNA isolation. a The purified genomic DNA was then suspended in 30 μl of TE Buffer b (10 mM of Tris, 1 mmol of EDTA [ethylenediamine tetra-acetic acid], pH 7.0−8.0) and stored at −80°C.
Sequence amplification and cloning of SSU rRNA genes
Target regions of the small subunit (SSU) ribosomal RNA (rRNA) genes were amplified from the actinospore genomic DNA of each of the 3 myxozoan species using the universal myxozoan primers H2 and H9 11 (Table 1). The 25-μl PCR reaction mixtures contained 2.5 mμl 10X reaction buffer (10 mmol of Tris, 50 mmol of KCl, pH 9.0, 4.0 mmol of MgCl2), 2.0 μl of deoxyribonucleotide triphosphate [dNTP]) mixture (2.5 mmol of each dNTP), 5 pmol of each primer, 0.5 units of hot start Taq DNA polymerase, c 2 μl of DNA template, and nuclease-free H2O to volume. The PCR was carried out using a thermal cycler d programmed for 1 cycle of 95°C for 10 min, 50°C for 2 min, and 72°C for 4 min, followed by 35 cycles of 92°C for 1 min, 50°C for 1 min, and 72°C for 3 min, with a final extension cycle of 72°C for 5 min. The PCR amplification products were analyzed by electrophoresis on a 1.5% agarose gel and stained with a nucleic acid stain e to confirm the presence of the 714-bp product. The PCR product was then purified using a centrifugal filter device f and cloned using a commercial cloning kit. g The plasmid clones with 18S SSU rRNA gene inserts from H. ictaluri, A. mississippiensis, and H. exilis were each grown in culture overnight and plasmid purification was performed using a commercial plasmid purification kit. h The inserts were sequenced using the H2 and H9 primers 11 on double-stranded DNA 21 using a cycle sequencing kit i and the accompanying Taq DNA polymerase. j Excess unincorporated dideoxy terminators from the completed DNA sequencing reactions were removed by spin column purification, k and the sequencing reaction products were analyzed on a genetic analyzer. 1 The 714-bp amplicons were confirmed to be H. ictaluri, H. exilis, and A. mississippiensis by a BLASTn search (nucleotide Basic Local Alignment Search Tool; http://www.ncbi.nlm.nih.gov/blast/Blast.cgi) for similar sequences from the National Center for Biotechnology Information nonredundant nucleotide (nr/nt) database. The purified plasmid myxozoan DNA was quantified using a spectrophotometer and accompanying software. m
Primer and probe sequences.
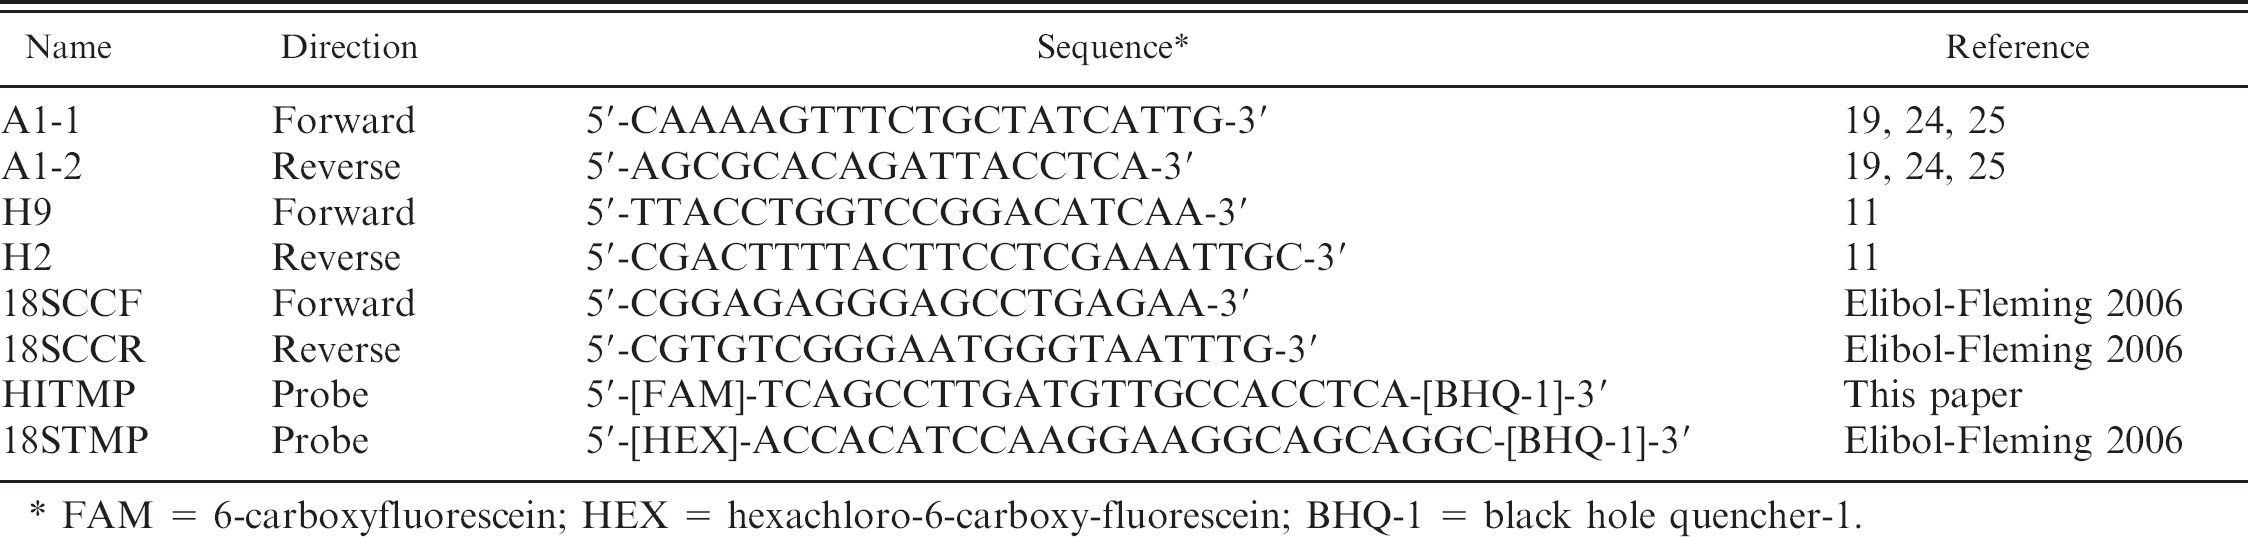
FAM = 6-carboxyfluorescein; HEX = hexachloro-6-carboxy-fluorescein; BHQ-1 = black hole quencher-1.
TaqMan probe design
Sequence alignments of the 18S SSU rRNA genes of H. ictaluri (GenBank accession number AF195510), A. mississippiensis (GenBank accession number AF021878), and H. exilis (GenBank accession number AF021881) were performed using a genetic analysis software package, n concentrating on a 175-bp highly variable region from nt 1490 to nt 1665 in the 18S SSU rRNA genes. 11 A unique H. ictaluri-specific TaqMan probe was designed based on the 103-bp region from nt 1516 to nt 1619 amplified by the H. ictaluri-specific primers A1-1 and A1-2 19,24,25 (Table 1). The 23-bp probe sequence (5'-TCAGCCTTGATGTTGCCACCTCA-3') beginning at nt 1573 was commercially prepared. o The TaqMan probe was labeled with a fluorescent reporter dye, 6-carboxyfluorescein (FAM), on the 5' end, and the quencher dye, black hole quencher-1 (BHQ-1), on the 3' end. A BLASTn search for similar sequences was performed as previously described to ensure the sequence was unique to H. ictaluri.
Generation of quantitative real-time PCR standards
Target regions of the 18S SSU rRNA genes were amplified from genomic DNA of H. ictaluri actinospores and specific pathogen-free (SPF) channel catfish by use of H. ictaluri-specific PCR primers 19,24 and universal 18S SSU rRNA primers (Elibol-Fleming B: 2006, Effects of Edwardsiella ictaluri infection on transcriptional expression of selected immune relevant genes in channel catfish, Ictalurus punctatus. Doctoral dissertation. Mississippi State University, Starkville, MS), respectively (Table 1). The PCR was carried out as described previously and again the PCR amplification products were analyzed by electrophoresis to confirm the presence of a single PCR product. The target amplicons were purified using a centrifugal filter device f and cloned using a commercial cloning kit. g The plasmid clones with 18S SSU rRNA gene inserts from H. ictaluri and channel catfish were grown in culture overnight and plasmid purification was performed using a commercial plasmid purification kit. h The plasmid standards were quantified as described above, and their concentrations were adjusted to 1.0 ng/μl. Standards were then serially diluted and used to generate standard curves and to serve as positive controls for quantitative real-time PCR analysis.
Quantitative real-time PCR
The 12.5-ml PCR contained 6.25-ml quantitative real-time PCR supermix, p 20 pmol of each primer (A1-1 and A1-2), 0.25 pmol of TaqMan probe (HITMP), 3 μl of template DNA, and nuclease-free H2O to volume. Amplifications were performed on a real-time PCR system q programmed for 1 cycle of 95°C for 3 min 30 sec, followed by 40 cycles of 95°C for 30 sec, 56°C for 1 min, and 72°C for 30 sec. Data collection was carried out following the 72°C elongation step at the end of each cycle.
Quantitative real-time PCR specificity and sensitivity
The assay was tested on equal concentrations (1 × 10⁻² ng) of plasmid DNA inserts of the 3 myxozoan species commonly found in commercial channel catfish ponds, along with genomic DNA from actinospores (n = 1,000) of the closely related A. mississippiensis and SPF channel catfish. Sensitivity was tested on genomic DNA isolated as described above from 8 aliquots of 5, 10, 25, and 100 H. ictaluri actinospores and 16 aliquots of a single actinospore. Reactions for aliquots containing each of the selected numbers of actinospores were performed in triplicate. The Ct was set at 25 for all runs, and sample Ct values were compared with Ct values from a standard curve of a serially diluted plasmid of the H. ictaluri-specific PCR amplicon. Plasmid standard equivalents were determined for unknown samples by comparing their Ct values against that of the serially diluted plasmid standards. Data were considered valid if the slope of the standard curve was between −3.1 and −3.6, representing reaction efficiencies between 90% and 110%. 27 Actinospore PSEs were calculated for each individual aliquot by dividing the sample PSE by the number of actinospores analyzed. Data analysis was conducted using a statistical analysis software package, r and actinospore PSEs per aliquot were compared using Scheffé's least significant difference test for unequal sample sizes (P < 0.05).
Quantitative real-time PCR inhibition
To test for inhibition by host DNA, genomic DNA was isolated from SPF channel catfish as described previously. This genomic DNA was suspended in 100 μl of TE Buffer b (10 mmol of Tris, 1 mmol of EDTA, pH 7.0-8.0), spiked with 10 ng of the H. ictaluri plasmid DNA and serially diluted. In addition, 10 ng of H. ictaluri plasmid DNA was suspended in 100 μl of nuclease-free water and serially diluted. Both dilution series were analyzed simultaneously according to the quantitative real-time PCR protocol described previously, and the Ct was set at 25 for all runs.
Evaluation of quantitative real-time PCR as a diagnostic technique
All diagnostic methods were evaluated by testing their ability to detect H. ictaluri stages in fish that had been held in a PGD-positive pond for 1 or 7 days. Fifteen SPF channel catfish fingerlings were placed in each of 2 net pens, designated A and B, and held in a commercial channel catfish pond with clinically diagnosed PGD in the resident fish population. All fish (n = 15) were sampled from net pen A after 1 day in the pond. On day 6, 15 SPF channel catfish fingerlings were replaced in net pen A and held adjacent to net pen B. All fish were sampled from both cages (n = 15 fish/cage) on day 7. Upon removal from the pond, fish were transported live to the NWAC in an aerated holding tank then euthanized immediately by an overdose of MS-222 (3-aminobenzoic acid ethyl ester methanesulfonate). s
Gross examination and histology
The presence and severity of PGD lesions were determined by microscopic examination of wet mounts of gill clips (∼40–80 filaments) from a left gill arch. A second gill clip (∼40–80 filaments) was removed from a left gill arch and processed for molecular analysis. The presence and severity of PGD was determined by microscopic examination of histologic sections of samples from a right gill arch. Individual gill arches from the right side of the fish were removed and placed in 10% neutral buffered formalin for a minimum of 24 hr. Tissues were then processed by dehydration in a graded series of ethanol solutions of increasing strength, followed by clearing in a series of xylenes, embedding in paraffin, and sectioning at 6 μm. Prepared slides were stained with HE, 15 and samples were designated as positive or negative based on the presence of the characteristic multinucleated trophozoites (Figs. 3, 4). 16,19,20 For wet mount examination, PGD was defined as the presence of lytic lesions in the cartilage of the gill filaments (Fig. 2). 19,26
Quantitative real-time PCR
Gill clips designated for molecular analysis were placed in 600 μl of cell lysis solution from a DNA isolation kit a and initially incubated for 10 min at 95°C before adding 3 μl of proteinase K (20 mg/ml). Samples were then incubated at 55°C until all tissue had dissolved. The remainder of the isolation was carried out according to the manufacturer's suggested protocol. After drying by vacuum centrifugation, the purified DNA was resuspended in 100 μl of TE Buffer b (10 mmol of Tris, 1 mmol of EDTA, pH 7.0-8.0) and quantified as previously described. At least 1 ng of total genomic DNA was added to each reaction, and all samples were analyzed in triplicate according to the quantitative real-time PCR protocol previously described. To correct for initial template variations between samples, 18S SSU rRNA PSEs were determined, along with H. ictaluri DNA PSEs, using the 18S SSU rRNA and probe combinations described previously (Elibol-Fleming B: 2006, Doctoral dissertation; Table 1). Sample CT values were compared with a standard curve based on serially diluted plasmid standards of the amplicons generated by the A1-1/A1-2 24 primers or the 18SCCF/18SCCR (Elibol-Fleming B: 2006, Doctoral dissertation), respectively (Table 1). Again, data were considered valid if the slope of the standard curve was between −3.1 and −3.6, representing reaction efficiencies between 90% and 110%. 27 Results were normalized against the initial concentration of 18S SSU rRNA to prevent false-negatives resulting from variations in starting template quantity.
End-point PCR sensitivity and specificity
Genomic DNA of H. ictaluri actinospore aliquots, along with the genomic DNA of PGD-exposed channel catfish, were analyzed by end-point PCR 24 to determine any differences in sensitivity and specificity. The PCR contained the reagents as listed previously using H. ictaluri specific primers (A1-1 and A1-2) and 2 μl of DNA template. The cycling conditions included an initial cycle of 95°C for 10 min, 50°C for 1 min, and 72°C for 30 sec, followed by 35 cycles of 92°C for 1 min, 50°C for 15 sec, and 72°C for 15 sec, with a final extension step of 72°C for 5 min. The PCR amplification products were analyzed by electrophoresis on a 1.5% agarose gel and stained e to confirm presence of the 104-bp product.
Results
The quantitative real-time PCR assay developed to detect H. ictaluri in channel catfish tissues was found to be highly specific and very sensitive. No amplification of the plasmid inserts of H. exilis and A. mississippiensis, extracted genomic DNA of A. mississippiensis actinospores (n = 1,000), or SPF channel catfish gill tissue was detected. The assay was unable to discriminate between dilutions less than 1 × 10⁻⁸ ng of the H. ictaluri plasmid standard; however, the assay calculated the PSE from one H. ictaluri actinospore to be 9.55 × 10⁻⁶ ng of the plasmid standard. All 16 one-actinospore samples were detected; thus, the assay is sensitive enough to detect a single actinospore (Fig. 5). By comparison, the end-point PCR protocol was limited to definitive detection of 5 actinospores, upporting previous work. 24 A least significant difference test performed on the calculations of spore equivalents for all aliquots revealed no significant differences (P < 0.05; Table 2). The mean observed DNA equivalents of the actinospore aliquots demonstrated a linear trend (Fig. 6). Inhibition of the PCR reaction by channel catfish DNA was not evident as SPF channel catfish samples spiked with H. ictaluri plasmid DNA, demonstrated the same amplification and standard curve as those suspended in nuclease-free water (Fig. 7).
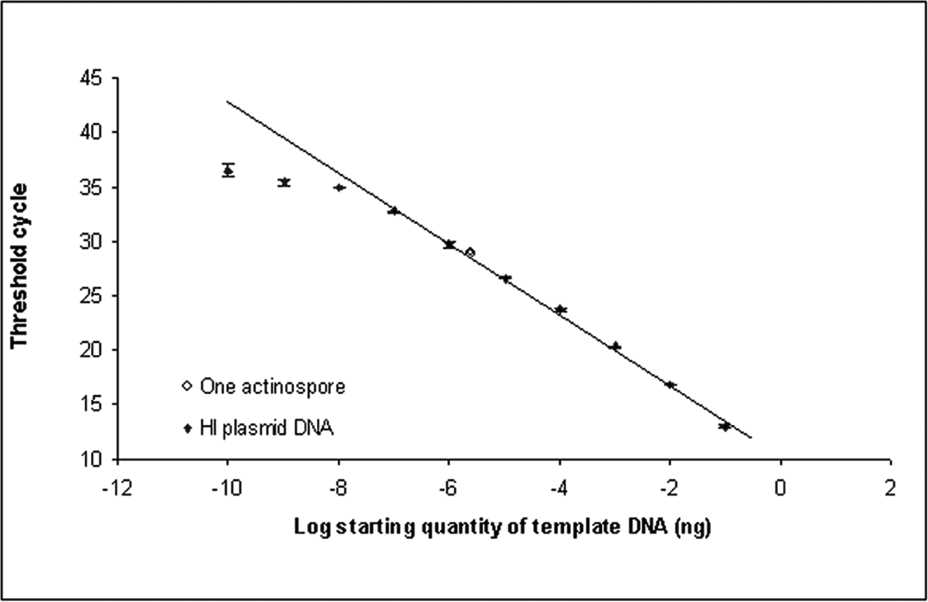
Real-time polymerase chain reaction amplification of a serial dilution of 104-bp Henneguya ictaluri plasmid inserts demonstrating the ability to detect a single actinospore. All samples were run in triplicate. The x-axis uses a log10 scale. The sensitivity limit of the assay is 1 × 10⁻⁷ ng of purified H. ictaluri plasmid DNA. The curve is linear over 7 orders of magnitude, and the equation for the linear portion of the curve is 3.15x + 12.946; r 2 = .9992; HI = H. ictaluri. Values are presented as means ± SEM.
Calculated plasmid standard equivalents (PSEs) for a single Henneguya ictaluri actinospore.*
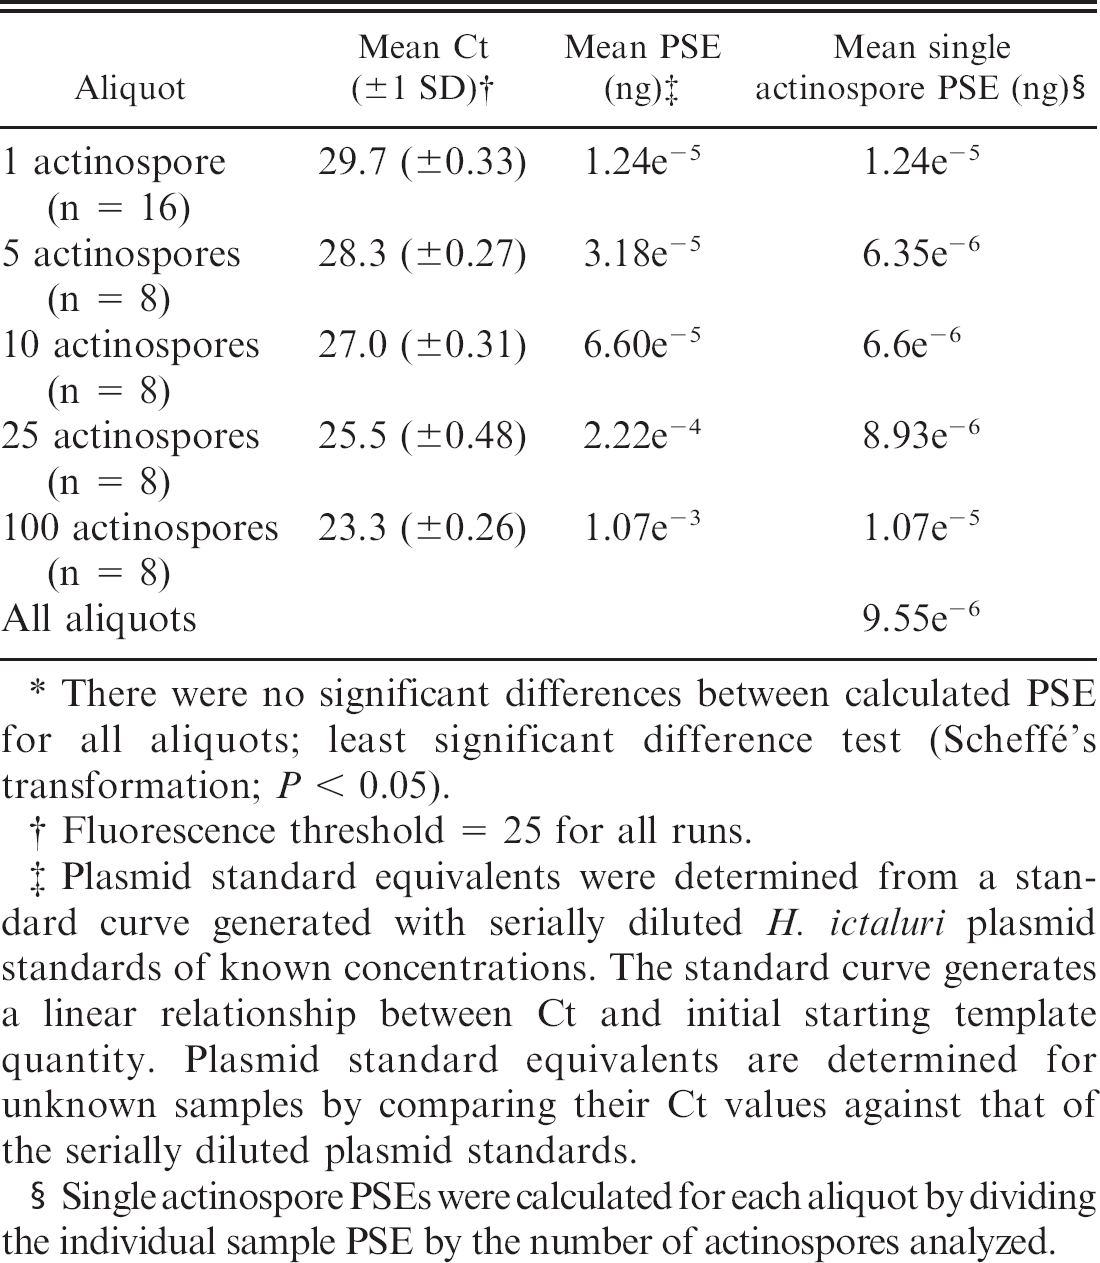
There were no significant differences between calculated PSE for all aliquots; least significant difference test (Scheffé's transformation; P < 0.05).
Fluorescence threshold = 25 for all runs.
Plasmid standard equivalents were determined from a standard curve generated with serially diluted H. ictaluri plasmid standards of known concentrations. The standard curve generates a linear relationship between Ct and initial starting template quantity. Plasmid standard equivalents are determined for unknown samples by comparing their Ct values against that of the serially diluted plasmid standards.
Single actinospore PSEs were calculated for each aliquot by dividing the individual sample PSE by the number of actinospores analyzed.
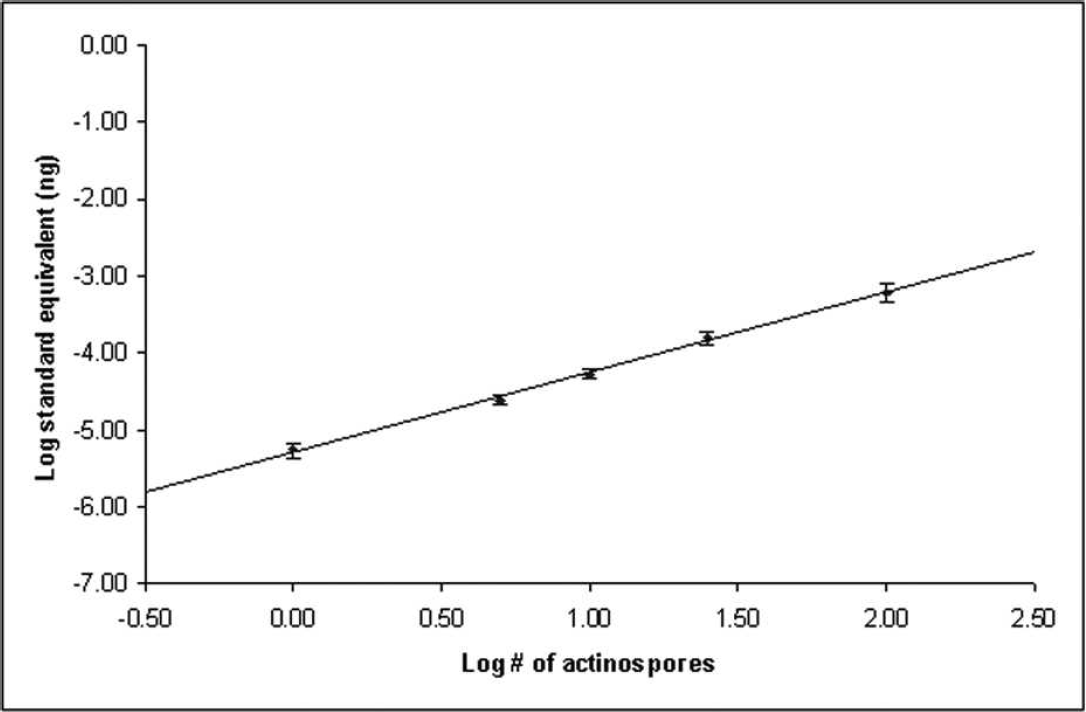
Standard curve derived from the mean plasmid standard equivalents for known numbers of actinospores. Both axes use a log10 scale. Actinospore numbers were represented by 8 aliquots of 5, 10, 25, and 100 Henneguya ictaluri actinospores and 16 aliquots of a single H. ictaluri actinospore. Reactions for each aliquot were performed in triplicate. Plasmid standard equivalents were determined by comparison to a standard curve generated by serially diluted H. ictaluri plasmid standard. The equation for the curve is y = 1.033x − 5.2853; r 2 = 0.9981. Values are presented as means ± SEM.
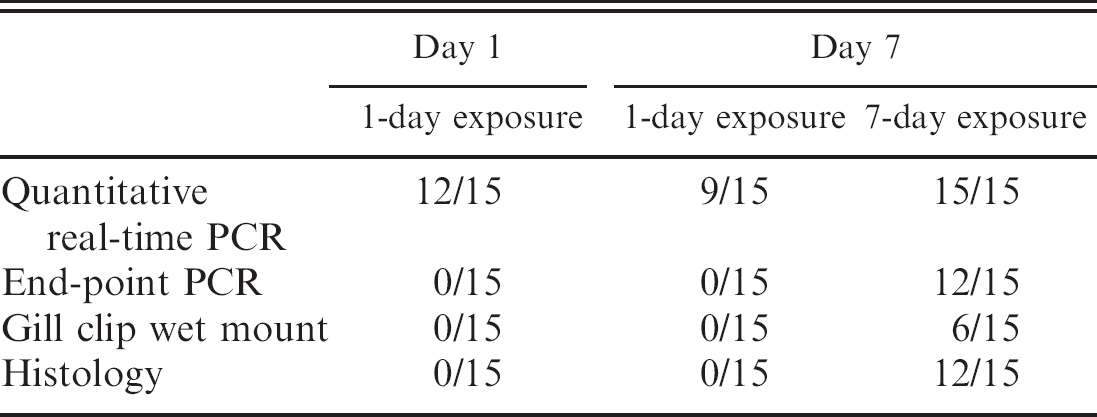
The quantitative real-time PCR protocol detected PGD infection in all exposure groups involved in the pond study was the only procedure to detect infection in either of the 24-hr exposure groups, and it identified a 20% decrease in the number of fish infected from day 1 to day 7 in the 24-hr exposure groups (Table 3). End-point PCR, microscopic examination of gill clip wet mounts, and histopathologic examination of gill tissue sections only detected the parasite after 7 days postexposure and missed 20–60% of infections (Table 3). No mortalities were observed for any of the exposure treatments.
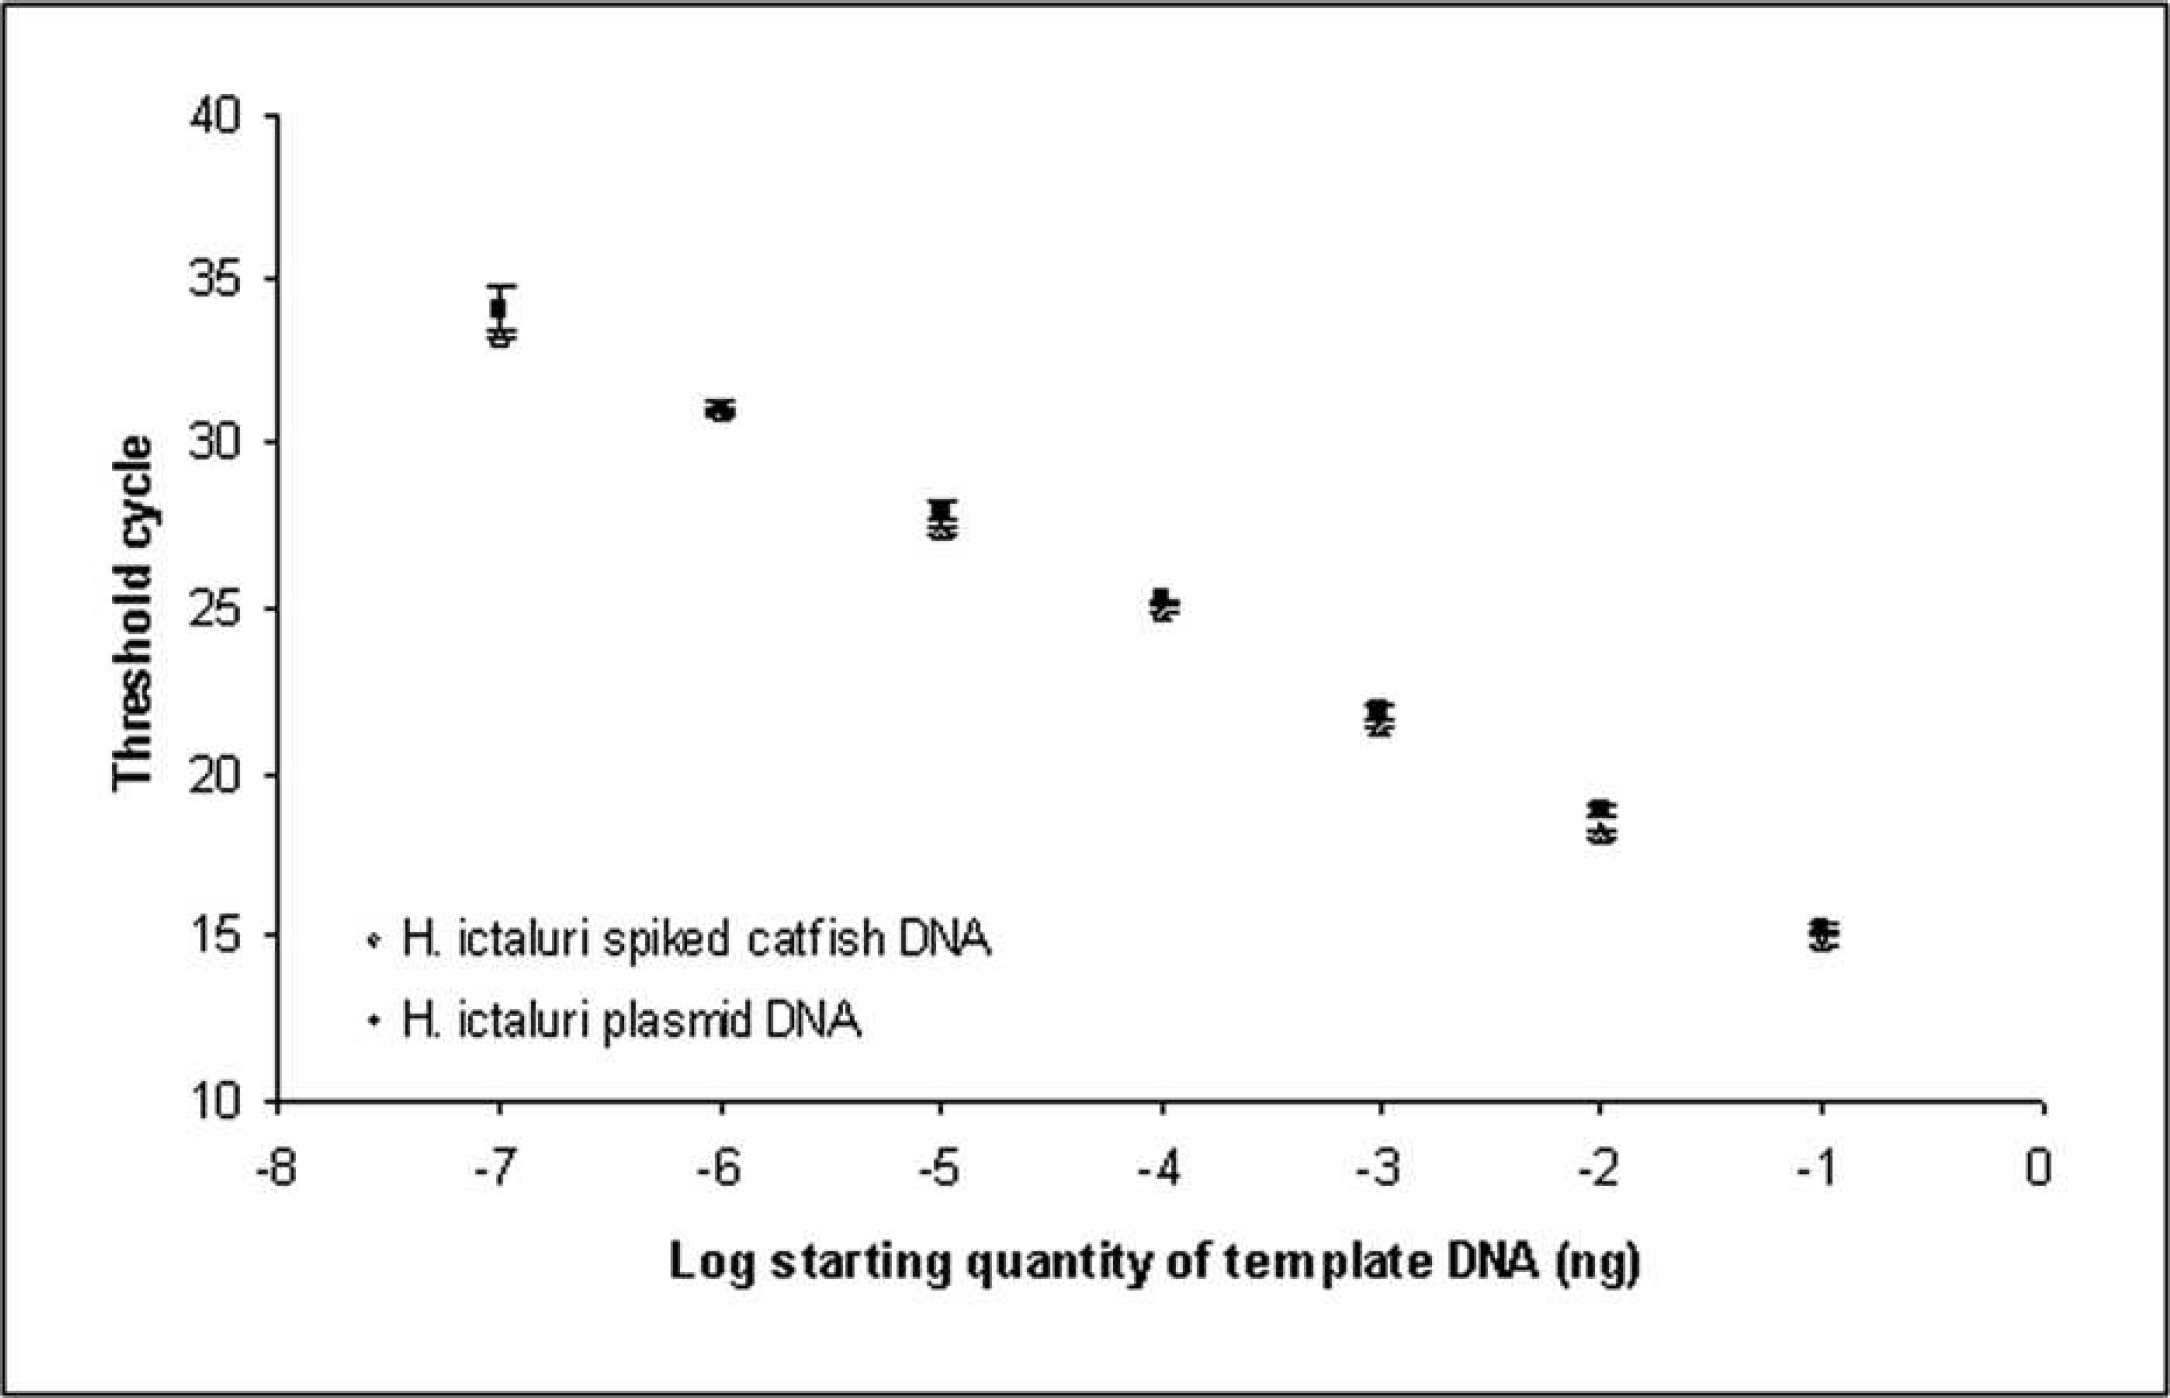
Comparison of the amplification products of pure Henneguya ictaluri plasmid DNA and channel catfish genomic DNA spiked with H. ictaluri plasmid DNA. The x-axis uses a log10 scale. Values are presented as means ± SEM.
Channel catfish gills determined positive for Henneguya ictaluri infection by 4 different diagnostic techniques.
Discussion
The H. ictaluri quantitative real-time PCR assay outperformed all currently practiced diagnostic techniques, including end-point PCR at all times tested (1 and 7 days after exposure). The assay detected H. ictaluri infection 1 day after exposure and identified a 20% decrease in the number of fish infected from the 1st to 2nd sampling period, which could not be determined by any of the conventional diagnostic techniques. The sensitivity of detection is a single actinospore, whereas the end-point PCR protocol is subjectively quantifiable and limited to detecting 5 actinospores. 24 Although the sensitivity of the endpoint PCR protocol can be increased by increasing the number of thermal cycles, this also increases the incidence of false-positives. 24 The quantitative real-time PCR assay provides diagnosticians and researchers with a rapid, more sensitive, and quantifiable method of confirming PGD infections.
By comparison, histologic preparation normally requires a 24-hr fixation period before tissue processing and sectioning, and end-point PCR requires postreaction processing. The immediate results provided by gross examination of gill clip wet mounts are convenient in their expediency but identify damage that has already occurred in the gills.
Significant losses can occur when catfish fingerlings are understocked for growout in the spring, even when resident fish populations demonstrate no clinical signs of disease. Previous research in the Fish Health Laboratory (FHL) of the Thad Cochran National Warm Water Aquaculture Center (Stoneville, MS) showed that moving fish from a problem pond to a clean environment results in nearly immediate recovery, creating a need for determining the PGD status of a pond before stocking or for identifying a parasite-free environment to relocate fish. 26 The quantitative real-time PCR assay provides researchers with a means of determining parasite load in sentinel fish exposed to a PGD-positive pond for just 1 day. The infectious window of the H. ictaluri actinospore stage is approximately 1–2 days. 26 As such, quantifying the parasite load in gill tissues of fish exposed to a PGD-positive pond for 1 day indirectly represents the rate at which actinospores are being released into the environment. Consequently, determining parasite load in 1-day exposures at 2 separate time points can identify increasing or decreasing rates of actinospore release, thereby providing insight into the dynamics of an ongoing outbreak. This information can prove invaluable in evaluating potential treatments or management decisions. Quantifying the parasite load in 1-day sentinel fish exposures before stocking can potentially identify problematic rates of actinospore release in the pond and may offer producers an opportunity to take preventive measures to avoid large economic losses commonly attributed to PGD.
Although the quantitative real-time PCR assay is more costly and requires specialized equipment and training than currently practiced diagnostic methods, the assay is more sensitive and confirms H. ictaluri infection more rapidly than histology and end-point PCR. Gross examination of gill clip wet mount preparations provides a reasonably accurate presumptive diagnosis in moderate to severe infections and, although convenient, the method has limited sensitivity, especially in larger fish where size limits the number of filaments that can be accurately examined in wet mount preparation. It should be noted that this quantitative real-time PCR assay is not intended to replace, but rather be used in conjunction with currently practiced diagnostic techniques to provide a more rapid, sensitive, and accurate diagnosis. As stated previously, the ability to quantify H. ictaluri DNA from fish tissue will provide an invaluable tool in epidemiologic studies, treatment evaluations, and management of this disease.
Acknowledgements
The authors would like to thank S. Ewing, A. Ellington, and S. Meador for their assistance in oligochete isolation and tissue preparations; L. Hanson for providing primer sequences; and A. Varela-Stokes, C. Panuska, B. Peterson, and S. Quiniou for critical review of the manuscript. This research was supported by The College of Veterinary Medicine, Mississippi State University, and Mississippi Agricultural and Forestry Experiment Station (MAFES), Mississippi State University. This is MAFES publication J-11388.
Footnotes
a.
Puregene® DNA Isolation Kit, Gentra Systems, Minneapolis, MN.
b.
Puregene® DNA Hydration Solution, Gentra Systems, Minneapolis, MN.
c.
Takara® hot start Taq polymerase, Takara Bio USA, Madison, WI.
d.
MJ Research PTC-100 Thermal Cycler, GMI, Ramsey, MN.
e.
Gelstar® Nucleic Acid Gel Stain, Cambrex Corp., East Rutherford, NJ.
f.
Montage® PCR Centrifugal Filter Device, Millipore Corp., Billerica, MD.
g.
PCR4-TOPO® Cloning Kit, Invitrogen Corp., Carlsbad, CA.
h.
Qiagen Plasmid Miniprep Kit, Qiagen, Valencia, CA.
i.
ABI PRISM® BigDye Terminator Cycle Sequencing Kit, Applied Biosystems, Foster City, CA.
j.
AmpliTaq® DNA Polymerase, Applied Biosystems, Foster City, CA.
k.
Centrisep® Spin Columns, Princeton Separations, Adelphia, NJ.
l.
ABI PRISM® 310 Genetic Analyzer, Applied Biosystems, Foster City, CA.
m.
NanoDrop® spectrophotometer and software version 3.2.1, NanoDrop Technologies, Wilmington, DE.
n.
o.
Sigma-Genosys, Sigma-Aldrich Co., St. Louis, MO.
p.
Bio-Rad IQ® supermix, Bio-Rad Laboratories, Hercules, CA.
q.
Bio-Rad iCycler® version 3.1, Bio-Rad Laboratories, Hercules, CA.
r.
SAS software version 9.1, SAS Institute, Cary, NC.
s.
Argent Chemical Laboratories Inc., Redmond, WA.