
Abstract
Our earlier study revealed that long-term ethidium bromide application causes mitochondrial DNA depletion in human prostate cancer DU145 cell line (DU145MtDP), and this DU145MtDP subline appears to have expanded CD44Bright cell population than its parental wild type DU145 cells (DU145WT). Increasing evidence suggests that CD44Bright cells are highly cancer stem cell like, but it is not clear about their dynamic transition between CD44Dim and CD44Bright phenotypes in prostate cancer cells, and how it is affected by mitochondrial DNA depletion. To address these questions, four cell subpopulations were isolated from both DU145WT and DU145MtDP cell lines based on their CD44 expression level and mitochondrial membrane potential. The cell motility and colony formation capability of the fluorescence activated cell sorting–sorted cell subpopulations were further examined. It was discovered in the DU145WT cells that CD44Dim cells could transit into both CD44Dim and CD44Bright phenotypes and that CD44Bright cells were prone to sustain their CD44Bright phenotype as renewal. However, such transition principle was altered in the DU145MtDP cells, in which CD44Bright cells showed similar capability to sustain a CD44Bright phenotype, while the transition of CD44Dim cells to CD44Bright were suppressed. It is concluded that mitochondrial DNA depletion in the human prostate cancer DU145 cells influences their renewal and CD44 subphenotype transition. Such alterations may be the driving force for the enrichment of CD44Bright DU145 cells after the mitochondrial DNA depletion, although the molecular mechanisms remain unclear.
Keywords
Introduction
A body of well-established studies have shown that mitochondrial DNA (mtDNA) mutations and depletion play important roles in carcinogenesis,1–3 while the reduction of mtDNA content is identified as a critical step in cell stemness restoration and neoplastic development.4–7 However, the mechanisms underlying mtDNA depletion and metabolic reprogramming-initiated enhancement of cancer cell stemness in prostate cancers, particularly of castration-resistant prostate cancer (CRPC), remain largely unknown. In previous study, we have established mtDNA-depleted CRPC DU145 cell subline (DU145MtDP). 8 It was revealed that those DU145MtDP cells developed a strong molecular basis to augment glycolytic activity and maintain immature mitochondria, which endorsed the cells with enhanced cancer stemness. However, it has been known for decades that only a few cells in a bulk cancer cell population are of the greatest stemness, and which are often referred as cancer stem cells (CSCs). 9 Interestingly, CSCs have been identified with constitutional heterogeneity and dynamically maintained biological properties.10–13 In our earlier study, we found that the DU145MtDP subline comprised several CSC-suspicious subpopulations, such as CD44Bright, SP+, and ALDHBright. 8 Among those, the most pronounced CSC-like subpopulation is the CD44Bright cells, because this DU145MtDP subline was proven to have a ~30% larger CD44Bright population than its parental wild type cells. The CD44Bright cancer cell subsets have been frequently reported to be positively associated with CSC-like phenotypes among various cancer cell lines;14–18 therefore, highlighting an important role of CD44 expression in CSC biology. Taken all above clues in consideration, clarifying the mechanisms underlying the phenomenon that mtDNA depletion leads to enrichment of CD44Bright subpopulation in DU145 cells is helpful for researchers to comprehend the biological progress of CRPC.
In order to investigate the potential dynamic maintenance properties of CD44 phenotype transition, we utilized fluorescence activated cell sorting (FACS) technology and sorted those wild type DU145 (DU145WT) and mitochondrial DNA–depleted human prostate cancer DU145 (DU145MtDP) cells based on their CD44 expression level (CD44Bright/Dim) and mitochondrial membrane potential status (ΔψmHigh/Low). After being isolated, the cells were subjected to profiling CD44 phenotypes (after 10 days), cell motility, energetic metabolism, mtDNA content, and colony formation capability in consideration of their CD44Dim and CD44Bright phenotypic transitions.
Results
DU145WT and DU145MtDP cell lines have different CD44Bright/Dim and Δψm statuses
The DU145WT and DU145MtDP cells were categorized into four subsets by their CD44 expression level and Δψm statuses as follows: G1 (ΔψmHigh/CD44Dim), G2 (ΔψmHigh/CD44Bright), G3 (ΔψmLow/CD44Dim), and G4 (ΔψmLow/CD44Bright). A schematic diagram characterizing all cell subsets is presented in Figure 1(a), and the representative cell profiling for sorting are shown in Figure 1(b). The singular JC-1-stained DU145 cells were applied as negative controls. The DU145WT cells were revealed with well-maintained Δψm (Figure 1(b), left panels), whereas the DU145MtDP cells could be seen with intense mitochondrial depolarization. As shown in the right panels of Figure 1(b), the DU145WT cells are generally enriched in G1 subset (ΔψmHigh/CD44Dim), whereas DU145MtDP cells comprise abundant G4 subset (ΔψmLow/CD44Bright), all in agreement with our previous findings. 8

The sorting. (a) Four black square frames (G1–G4) shown on the top panel represent the actual sorted cells in the experiment. (b) The color-filled histograms horizontally and vertically against the scatter plots indicate the signal distributions of each fluorophore.
CD44 phenotype transition and Δψm changes in DU145WT cells
The CD44 phenotypes and Δψm statuses in both DU145 cell lines were re-examined after the FACS-isolated four cell subsets were cultured for 10 days. As shown in Figure 2, the four DU145WT cell subsets sorted based on CD44 expression level and Δψm were all able to develop both ΔψmHigh and ΔψmLow phenotypes, although with uneven proportions. The cells isolated as CD44Dim phenotype (G1 and G3) developed both CD44Dim and CD44Bright cell populations, whereas the cells isolated as CD44Bright phenotype (G2 and G4) resulted in only CD44Bright cells. These observations generally implied that the DU145WT cells might follow a dynamic maintenance of their CD44 phenotypes, while the CD44Bright cells could be potentially originated from the CD44Dim cells.

The re-detection of Δψm and CD44 phenotypes of wild type DU145 cells. On the left, the red frames show the original states of sorted cells, and the outcomes of their phenotypic transitions after 10 days in culture are shown on the right side.
MtDNA depletion suppresses the CD44 phenotype transition and Δψm maintenance in the DU145MtDP cells
However, the DU145MtDP exhibited distinct CD44 phenotypic transition principle and Δψm statuses compared to the wild type cells (Figure 3). It was revealed that all the isolated DU145MtDP cell subsets were prone to display a ΔψmLow status, whereas the DU145WT cells displayed both ΔψmHigh and ΔψmLow. Furthermore, it appeared that the CD44Dim subsets (G1 and G3) of the DU145MtDP cells were incapable to generate CD44Bright cell populations within 10 days in contrast to their parental DU145WT cells. Interestingly, the CD44Bright subsets (G2 and G4) derived from the DU145MtDP cells were also found with phenotype unchanged, which was similar to what was observed in the DU145WT cells. These observations therefore suggest that the mtDNA depletion has altered the dynamic maintenances of the CD44 phenotypes and Δψm statuses in the DU145 cells. The developmental outcomes regarding each individual fluorophore of all the isolated cells can be found in Figure S1A with statistical analyses.

The re-detection of Δψm and CD44 phenotypes of mtDNA-depleted DU145 cells. On the left, the red frames show the original states of sorted cells, and the outcomes of their phenotypic transitions after 10 days in culture are shown on the right side.
MtDNA depletion universally enhances the cell motility performance in the DU145 cells
To evaluate the cell motilities in all cell subtypes, we performed transwell assays immediately after the cells were sorted. The cells penetrated through 8-µm-pore transwell membranes were visualized by applying crystal violet staining. As shown in Figure 4(a), the DU145MtDP cells, even the unsorted DU145MtDP cells, were more penetrative than the DU145WT cells. The DU145MtDP cells isolated as G3 (ΔψmLow/CD44Dim) and G4 (ΔψmLow/CD44Bright) subsets showed more penetrated cells than other cell subsets, while the G1 (ΔψmHigh/CD44Dim) subset isolated from the DU145WT cells had significantly lower number of penetrated cells.

The transwell assays. (a) Images show evaluations of cells motility. Black arrows point out the cells penetrated through 8-µm-pore polycarbonate membrane (bars = 50 µm). (b) The migration efficiencies of different phenotypic cells were calculated based on the numbers of the penetrated cells/total input cells. The data are presented as means from three independent experiments (mean ± SD). (c) Transcriptome analyses of metastasis-related genes according to previously published references. The Log2 transformed ratio of FPKM values (MtDP/WT) are indicated by color-coded index bars. (d) The relative gene expression level of metastasis-related genes. The data are presented as means from three independent experiments (mean ± SD; statistical significance: *p < 0.05, **p < 0.01, and ***p < 0.001).
To further evaluate the cell motility of all above cell subsets, the migration efficiencies were calculated based on the counting results of the penetrated cells and the initial seeded cell number. As shown in Figure 4(b), our results revealed that although the G4 subtype (ΔψmLow/CD44Bright) of DU145WT cells showed the highest migration efficiency among all the cell subsets isolated from the DU145WT cells, its migration efficiency was still about two times lower than that of the corresponding DU145MtDP subtype. The above results suggest that CD44 phenotypes alone may have no significant contributions to the cell motility performance in DU145 cells, whereas the ΔψmLow status seems to have a stronger association.
In previous studies, we have performed RNA deep-sequencing to investigate the transcriptome rearrangement after mtDNA depletion in the DU145 cells. As shown in Figure 4(c), a series of cell motility-/metastasis-related genes were found to be overexpressed in the DU145MtDP cells, for example, MMP1, SOX4, CD24, and CXCR4. To further investigate the expression level of the above genes in the CD44Bright and CD44Dim subpopulations, the DU145WT and DU145MtDP cells were sorted based on their CD44 phenotypes. The relative gene expression level of SOX4, SNAI2, MMP1, and CXCR4 in CD44Bright and CD44Dim subsets was then determined by quantitative polymerase chain reaction (qPCR) experiments. As shown in Figure 4(d), the results of qPCR were generally in agreement with the earlier transcriptome analyses, and the genes SOX4, SNAI2, MMP1, and CXCR4 all displayed higher expression level in the DU145MtDP cells. However, in both DU145WT and DU145MtDP cells, the expression level of SOX4 and SNAI2 showed no significant changes between their CD44Bright and CD44Dim subpopulations, respectively. Interestingly, the expression level of MMP1 and CXCR4 were significantly higher in the CD44Bright subpopulation of DU145MtDP cells.
In addition, since the cell surface molecule CD26 has been proven playing critical roles in cancer metastasis, 19 we also studied the co-expression pattern of the CD44 and CD26 in DU145WT and DU145MtDP lines, respectively, by flow cytometry. As shown in Figure S1B, the CD44Bright/CD26Bright subpopulation was significantly larger in the DU145MtDP cells compared to the wild type. More interestingly, the fluorescence intensity of the CD26 in the DU145MtDP cells was dramatically higher in those cells showing stronger CD44 staining, suggesting that the highly expressed CD44 in DU145MtDP cells may promote the expression of CD26 and thus contribute to cell metastasis. Taken together, all above results indicate that the CD44Bright phenotype does not directly contribute to stronger cell motility in DU145 cells, while the secondary effects that were related to the mtDNA depletion–induced CD44 overexpression may play more dominated roles.
The CD44Dim subpopulation in DU145WT shows stronger mitochondrial respiration than CD44Bright subpopulation
To investigate the energetic metabolism in those cell subsets with different CD44 phenotypes, the CD44Dim and CD44Bright subsets isolated from the DU145WT and DU145MtDP cells were subjected to Seahorse Mito Stress tests, and their relative mtDNA content were measured by qPCR.
As shown in Figure 5(a), all DU145WT cells exhibited normal responses to the Seahorse Mito Stress test, all showing a typical respirational metabolic phenotype (high oxygen consumption rate (OCR) and low extracellular acidification rate (ECAR)). In contrast to the DU145WT cells, all DU145MtDP cells showed a limited oxygen consumption (low OCR) but with significantly stronger glycolysis capacity (high ECAR). By using the WAVE software from the Agilent Technologies, we further analyzed the mitochondrial adenosine triphosphate (ATP)–synthesizing potential (original as the ATP production value from the software) between all sorted cell subsets. The results showed that the mitochondrial ATP–synthesizing potential was significantly higher in the CD44Dim cells compared to the CD44Bright cells in the DU145WT (Figure 5(b), left panel). It was also discovered that all DU145MtDP cells exhibited significantly higher ECAR values than those of DU145WT cells in this test. However, there were no significant differences of ECAR values between the CD44Dim and CD44Bright subsets in the DU145MtDP cells (Figure 5(b), right panel).
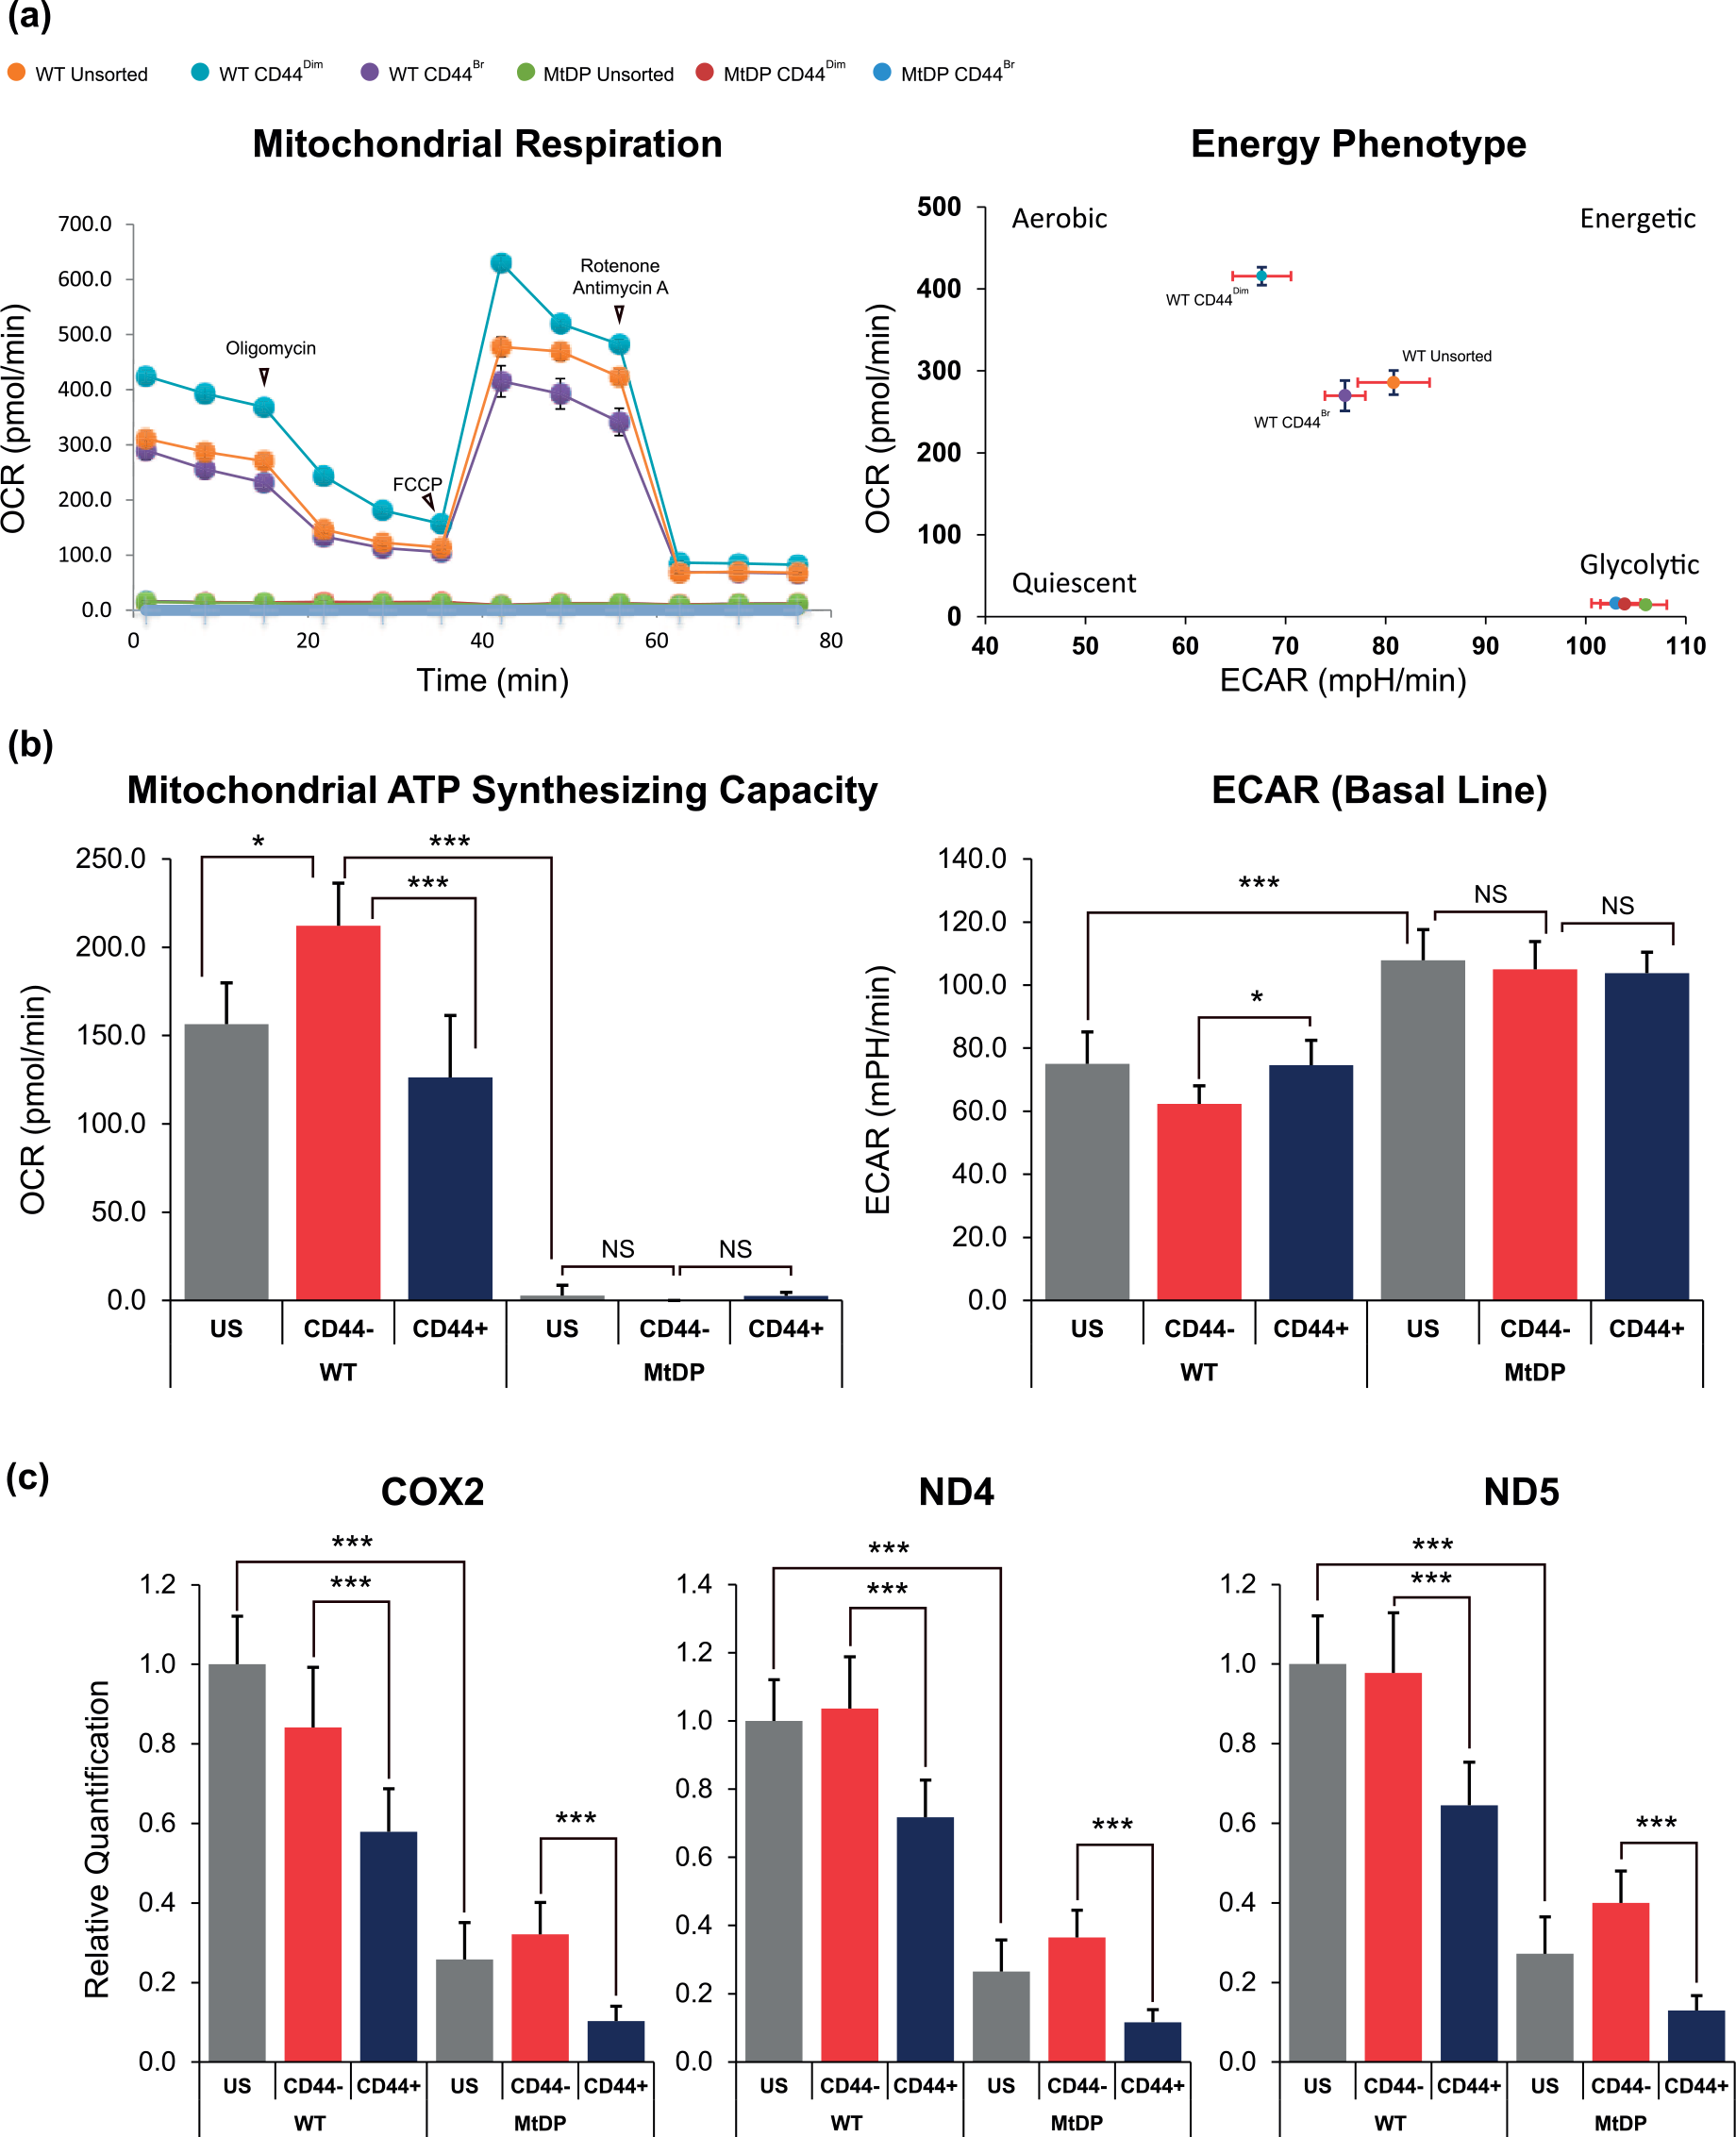
(a) The line chart and dot plot show a group of representative results of the Seahorse Mito Stress test. All wild type DU145 cells exhibit a mitochondrial respiration–dependent metabolism, whereas the mtDNA-depleted DU145 cells are highly dependent on glycolysis. (b) The mitochondrial ATP–synthesizing capacity and ECAR values of all cells were analyzed using the WAVE software and the Mito Stress test report generator, and the obtained data are represented in histograms. The ECAR values of mtDNA-depleted DU145 cells are significantly higher compared to the wild type DU145 cells, and the CD44Dim subset in wild type DU145 cells shows significantly stronger mitochondrial respiration than the CD44Bright subset. The data are presented as means from three independent experiments (mean ± SD). (c) The relative mtDNA content in all cells. The mtDNA content is significantly higher in CD44Dim cells compared to the CD44Bright cells in both wild type and mtDNA-depleted DU145 cells. The mtDNA content is sharply reduced in all mtDNA-depleted DU145 cells. The data are presented as means from three independent experiments (mean ± SD; statistical significance: *p < 0.05, **p < 0.01, and ***p < 0.001).
In addition, by using total intracellular DNA as the template, we also applied qPCR method to determine the relative mtDNA content between the CD44Dim and CD44Bright subsets in both DU145WT and DU145MtDP cells. The results showed that the mtDNA encoded genes, including COX2, ND4, and ND5, were all found to be sharply reduced in the DU145MtDP cells compared to the wild type (glyceraldehyde 3-phosphate dehydrogenase (GAPDH) gene was taken as reference control). However, the results also showed that the mtDNA contents were significantly lower in those CD44Bright subsets in both DU145WT and DU145MtDP cells. These results together indicate that the CD44Dim DU145 cells should have higher mtDNA reservation than those of CD44Bright cells. In contrast to the CD44Dim, the CD44Bright DU145 cells are more prone to be glycolytic in metabolism with less mtDNA storage.
The DU145MtDP cells are vulnerable to JC-1 staining, but the CD44Bright phenotypic DU145MtDP cells exhibit stronger survival capability
It was noticed that ~30% DU145MtDP cells were revealed with a ΔψmHigh status, even the cells were mtDNA deficient, indicating alternative compensatory mechanisms were, at least, partly rescuing their impaired proton pumping/transfer functions in mitochondria, due to the immature mitochondrial functions. This fact meanwhile suggests a potential venerable mitochondrial status of the DU145MtDP cells, which might negatively affect cell survival, particularly when the cells were loaded with Δψm-dependent probes, since theoretically the accumulation of JC-1 dye in mitochondria may disturb their normal physiological homeostasis. To test this hypothesis, we evaluated the long-term impact of JC-1 staining on the overall proliferative and survival capabilities of the DU145MtDP and DU145WT cells by performing colony formation assays.
To accomplish this investigation, the cells were sorted depending on their G1–G4 phenotypes or CD44 expression level only. The equal amount of unstained and unsorted (UAU) cells as well as stained but unsorted (SBU) cells was prepared as controls. As shown in Figure 6, the UAU DU145WT cells developed larger colonies than DU145MtDP cells. However, the efficiency of the colony formation was similar in both cell lines (~29% vs ~31%, DU145WT vs DU145MtDP) despite of the colony size. However, both SBU DU145MtDP and DU145WT cells showed significantly reduced colony numbers and sizes in comparison to the corresponding UAU cells (UAU vs SBU: ~29% vs ~17% for DU145WT, ~31% vs ~5% for DU145MtDP, Figure 7), while the DU145WT cells still formed more and larger colonies than DU145MtDP cells (SBU: ~17% vs ~5%, DU145WT vs DU145MtDP). This phenomenon indicates that the DU145MtDP cells are indeed more vulnerable to the JC-1 staining–induced survival stress compared to the DU145WT cells. To further evaluate the responses of different phenotypic cells (G1–G4) to antagonize JC-1 staining–induced cell survival stress, we also examined the colony formation efficiencies among all the G1–G4 cell subsets. Decreased colony formation efficiencies were confirmed in all the G1–G4 phenotypic DU145WT cells compared to their UAU cells. Neither a specific CD44 phenotype nor the Δψm statuses revealed an improved capability of DU145WT cells to survive after the JC-1 staining. Interestingly, it was found that the DU145MtDP cells with the G2 and G4 phenotypes showed significantly greater colony formation efficiencies than the cells with G1 and G2 phenotype (DU145MtDP—G1: ~1%, G2: ~5%, G3: ~1%, and G4: ~6%), suggesting that CD44Bright phenotype was positively associated with a stronger capability of the DU145MtDP cells to tolerate JC-1 staining–induced mitochondrial damage and cell survival stress. However, the results suggest this tolerance was independent from the Δψm statuses. To further confirm this, both DU145 cell lines were stained with JC-1 dye and CD44-antibodies, but cells were only sorted based on their CD44Dim/Bright phenotypes. The results were well consistent with the above observations and indicated that the CD44Bright phenotype was uniquely correlated with an advanced capability of the DU145MtDP cells against the JC-1 staining–induced cellular/mitochondrial toxicity.

Colony formation assays to evaluate the impact of JC-1 staining on the survival and growth conditions in DU145 cells. After being sorted, 2000 cells were seeded on six-well plates and cultured for 12 days. The figure shows a group of representative results of the colony formation outcomes.

The statistical comparison of the data from colony formation assays. The histograms display colony formation efficiencies, which was calculated based on the counting results of colony numbers (statistical significance: *p < 0.05, **p < 0.01, and ***p < 0.001).
Discussion
In this study, our results suggest that the overall proportions of the CD44Bright and CD44Dim subsets in both DU145WT and DU145MtDP cells should be the outcomes of a long-term dynamic balancing consequence of inter-conversion process. Although our study revealed that the CD44Dim DU145WT cells have a capacity to transit into cells with CD44Bright phenotype, the proportion of the CD44Bright subset in the unsorted DU145WT cells was still found to be less than 50% (~40%–45%). This fact strongly suggests that the phenotypic inter-conversion of CD44 is defined by the presence of CD44Bright or CD44Low cells per se. Furthermore, we have revealed in our earlier study that the DU145WT cells have well-developed mitochondrial functions compared to the DU145MtDP cells, 8 and such physiological mitochondrial functions may substantially contribute to the maintenance of a ~40% of CD44Bright subset in the DU145WT cells.
Interestingly, the DU145MtDP cells comprise significantly larger CD44Bright subset (~45% vs ~75%, DU145WT vs DU145MtDP), and it was confirmed in this study that the DU145MtDP cells exhibited suppressed transition from CD44Dim into CD44Bright phenotype. Therefore, it is highly persuasive that the enriched CD44Bright subset in the DU145MtDP cells was more prone to be only originated from the CD44Bright cells. In this case, the renewal of the DU145MtDP CD44Bright cells must have been greatly activated in order to maintain a larger CD44Bright cell population.
Another interesting discovery is related to the regulation of Δψm. The maintenance of polarized Δψm in a human cell is critically dependent on the proton pumping/transfer function at electron transport chain (ETC) complex I, III, and IV,20,21 while theoretically, however, the absence of mtDNA encoded subunits might consequently lead to ETC defects and result in proton pumping/transfer failure. 22 Astonishingly, it was clearly observed that ~30% of the DU145MtDP cells still managed to sustain a ΔψmHigh status, which strongly suggests that alternative mechanisms should be involved in the process of sustaining a necessary electrochemical gradient to form normal Δψm. As a convincible explanation, it has been previously proved by some researchers in other mtDNA-depleted cell lines that rho0 cells (mtDNA free) can utilize adenine nucleotide carrier (ANT) with an incomplete ATP synthase (mainly F1 subunits) to maintain a relatively normal Δψm.23,24 Therefore, we speculate that our DU145MtDP cells might also have utilized the similar mechanism for sustaining their “normal” Δψm and which should be involved in specific functions for cell survival. Interestingly, in the later experiments we found that JC-1 staining was harmful for all DU145 cells by means of cell viability examination. We later verified that the DU145MtDP cells are highly vulnerable to the JC-1 staining–induced cellular toxicity. Since the positively charged JC-1 molecules can be selectively accumulated in mitochondria, 25 it therefore implies that the abundant JC-1 molecules enriched in mitochondria might impair their normal physiologies. Furthermore, because those DU145MtDP cells have poorly developed mitochondrial functions, the survival of these cells should be more easily affected by any additional mitochondrial functional damages compared to their parental wild type DU145 cells, which contain sufficient mtDNA storage with well-maintained ETC function. This hypothesis could be supported by the results shown in the Figure 3, since after being stained with JC-1 dye, all the G1–G4 phenotypic DU145MtDP cells turned to show a depolarized Δψm status even if they were sorted as ΔψmHigh. Taken all together, our studies indicate that the polarized mitochondrial status maintained in the DU145MtDP cells through the compensatory mechanisms is relatively fragile but critically important for the growth and survival of those cells. This is in agreement with some previous reports. 23 Furthermore, our studies also illustrated that CD44Bright phenotype is coupled with advanced capability of DU145MtDP cells to antagonize JC-1 staining–induced mitochondrial lesions. Although the related molecular basis has not yet been clarified, this phenomenon suggests that the overexpression of CD44 might play important roles in protecting CSC-like cells from further mitochondrial lesions and promoting their survival under hostile conditions like therapeutic treatments or hypoxia.
Even so, the biological roles of CD44 overexpression in response to mtDNA depletion remain elusive. CD44 has been proven to be a pivotal coherent molecule, which increases the capability of cancer cells to form distant metastasis.26–30 Based on this fact, we hypothesize that the overexpression of CD44 caused by mitochondrial lesions might protect cancer cells from further mitochondrial damages and help them to re-settle in distant tissues when they escape from a pernicious environment, such as in a chemotherapy, because it has been known that CD44 overexpression was tightly correlated with greater chemotherapy resistance in various cancer types.31–39
Taking all above results into consideration, it strongly suggests that overexpression of CD44 molecule may not directly contribute to prostate cancer invasion, but CD44 possibly may contribute to a stronger cell survival or motility with some “side-effects” via alternative molecular mechanisms. As an experimental evidence to support this hypothesis, our study proved that the CD44Bright DU145 cells possess less mtDNA content with higher glycolysis activity. These results suggest that the CD44Bright cells should be more adaptive to survive in a hostile environment via metabolism reprogramming toward glycolysis, compared to those CD44Dim cells. As another important experimental support, our study also discovered that as a pivotal molecular mediator in cancer metastasis, the CD26 expression in DU145 cells is significantly promoted by the overexpression of CD44 after the mtDNA depletion. All these emphasize that the CD44 overexpression may not directly enhance the metastasis itself, but CD44 may promote cell survival via metabolism reprogramming and promote cells to escape from harmful environment by expressing alternative cell invasion–related proteins.
Taken together, our study demonstrated that both CD44 phenotypes and Δψm statuses in human DU145 prostate cancer cells are dynamically maintained, and mtDNA deficiency interrupts the CD44 phenotypic transition and the maintainence of Δψm. The renewal of the CD44Bright cells in the DU145MtDP cells could have been greatly activated, so that a larger CD44Bright cell subpopulation can be maintained, although the molecular mechanisms require more studies to clarify, highlighting necessary studies targeting the signaling axis upstream or downstream of CD44 molecule in order to improve the current treatment of CRPC disease.
Materials and methods
Cell culture
Human CRPC DU145 cell line was obtained from American Type Culture Collection (ATCC) and routinely cultured in phenol red–free RPMI-1640 medium (Catalog Number: 11835-063; Gibco®) supplemented with 8% fetal bovine serum (FBS; Catalog Number: F7524; Sigma-Aldrich; not of USA origin), 100 U/mL penicillin, and 100 µg/mL streptomycin (Gibco™). The mtDNA-depleted DU145 cells were previously established in our lab, and the detailed establishment procedure with the cell culturing method could be found in our prior publication. 8 All the cells were cultured in a 37°C saturated humidity incubator containing 5% CO2 (Binder®).The culture medium was strictly changed every other day because auxotrophic DU145MtDP cells require pyruvate and uridine for survival.
FACS
To perform the sorting, the DU145WT and DU145MtDP cells were cultured until ~90% confluence. The culture medium was discarded and replaced by pre-warmed staining medium, which was prepared as using phenol red–free RPMI-1640 medium supplemented with 8% FBS, PU (pyruvate and uridine), antibiotics, and 1 µM JC-1 (Invitrogen™) at final concentration. The cells were stained for 30 min in a 37°C water bath in the dark, then the staining medium was removed and the cells were rinsed with pre-warmed Dulbecco’s phosphate-buffered saline (DPBS; Ca2+ free; Gibco™). Subsequently the cells were dissociated using TrypLE™ Express (Gibco™) reagent, and the cell pellets were carefully collected. Cells were then re-suspended in pre-warmed sorting medium, which was phenol red–free RPMI-1640 medium supplemented with 8% FBS, PU, and antibiotics. The cell densities were adjusted to 1~2 × 10⁶ cells/300 µL, and the cells were co-stained with monoclonal antibody against CD44 molecule (allophycocyanin (APC) directly conjugated, Catalog Number: 559942; BD Pharmingen™) and incubated for another 20 min in a 37°C water bath avoiding light. Lastly, cells were carefully spinned down and rinsed twice with pre-warmed DPBS (Ca2+ free). The sorting was carried out in a BD FACS Aria™ II cell sorter (BD Biosciences), where the JC-1 dye was excited by a 561 nm laser and JC-1 red signal was detected by a photomultiplier tube (PMT) detector with a 585/15 nm band-pass filter, while theAPC was excited by a 640 nm laser and the emission signal was detected by a PMT detector with band-pass filter 670/14 nm.
Flow cytometric detection of Δψm and CD44
The sorted cells were cultured in 60-mm or 100-mm diameter cell culture dishes for 10 days in respective medium. Then, the cells were stained with JC-1 dye and APC-conjugated CD44 antibody by following the same procedure as used for the sorting. To obtain the data, stained cells were passed through a BD LSR II flow cytometers (BD Biosciences). Further data analysis and figure preparations were performed using FlowJo v7.6 (FlowJo) software.
The transwell assay
Approximately 1 × 10⁴ cells were prepared in serum-free media supplemented with PU and loaded onto each 8-µm-pore polycarbonate membrane inserts (Transwell®; Corning). The well for each chamber was filled with 500 µL of media containing 10% FBS and 200 ng/mL of granulocyte-colony stimulating factor (G-CSF). After 24 h of incubation, the insert chambers were fixed with methanol and stained with 0.1% crystal violet–methanol solution. The unpenetrated cells were carefully removed by swabs and the polycarbonate membranes were dried under ambient temperature. Lastly, the membranes were mounted on slides and the number of penetrated cells was counted in a blinded manner.
Colony formation assay
For any cell subtypes, after being sorted, 2000 cells were seeded onto six-well plates and were cultured in respective media for 12 days. Subsequently, the cells were directly fixed and stained by 0.2% crystal violet in methanol solution. The plates were carefully washed and photographed. Cell colonies were counted by the software Image-Pro Plus (v6.0) and the obtained data were subjected to calculate colony formation efficiencies.
DNA/RNA extraction, PCR, and transcriptome analyses
For any cell subtypes, after being sorted, intracellular DNA or total RNA was extracted using commercial kits. For DNA extraction, a PureLink Genomic DNA Mini Kit (K182001; Invitrogen) was applied. For RNA extraction, a PureLink RNA Mini Kit (12183018A, Invitrogen) was applied. The DNA/RNA extraction was performed by strictly following the instructions provided by the manufacturer. The quality of all DNA/RNA samples was evaluated on a Nanodrop 2000 US-Vis Spectrophotometer (Thermo Fisher Scientific). The primer pairs were designed using the Primer-BLAST of National Center for Biotechnology Information (NCBI) online, and all primers were synthesized by Integrated DNA Technologies (IDT). The primer information can be found in the supplementary material attached to this article. The qPCR experiments were accomplished using a QuantStudio® 5 Real-Time PCR System (Thermo Fisher Scientific) and sufficient fast SYBR Green master mix regent (385612; Applied Biosystems), and the 2-ΔΔCT method was used for the relative quantification. The information of the transcriptome analyses can be found in our earlier publication. 8
Agilent Seahorse XF Cell Mito Stress test
The metabolic phenotype was investigated on an XFe96 Extra-cellular Flux analyzer. After being sorted, approximately 2 × 10⁴ cells were seeded onto standard Seahorse 96-well plates and were cultured overnight to accomplish the attachment. The culturing medium was replaced by 175 µL of Seahorse XF Base Medium (Minimal Dulbecco’s Modified Eagle’s Medium (DMEM)), supplemented with 10 mM glucose, 2 mM glutamine, and 1 mM pyruvate at final concentration, 1 h prior to the test. To investigate the mitochondrial respiration functions and energetic phenotypes, an Agilent Seahorse XF Cell Mito Stress kit was applied. The injection strategy was programmed as, 1st: oligomycin (1 µM at final concentration), 2nd: carbonyl cyanide 4-(trifluoromethoxy) phenylhydrazone (FCCP) (1 µM at final concentration), and 3rd: rotenone and antimycin A (0.5 and 0.5 µM at final concentration). The WAVE software (version 2.3) was applied for further data analysis.
Statistical analyses
For the transwell assay, PCR experiment, Seahorse Mito Stress test, and colony formation assay, three independent experiments were performed. Each experiment included at least four parallel samples and the data were presented as mean ± standard deviation (SD). One-way analysis of variance (ANOVA) test was applied to perform multiple-group comparison (Bonferroni method). Statistical significance was represented in figures by *p < 0.05, **p < 0.01, ***p < 0.001. All analyses were performed with the SPSS version 20 statistics software (IBM).
Footnotes
Declaration of conflicting interests
The author(s) declared no potential conflicts of interest with respect to the research, authorship, and/or publication of this article.
Funding
The author(s) disclosed receipt of the following financial support for the research, authorship, and/or publication of this article: This study was financially supported by grants from the Inger and John Fredriksen Foundation, Astri and Birger Torsteds Legat, The Radium Hospital Research Foundation, The Norwegian Cancer Society, China Scholarship Council, and The National Natural Science Foundation of China (81272824).
References
Supplementary Material
Please find the following supplemental material available below.
For Open Access articles published under a Creative Commons License, all supplemental material carries the same license as the article it is associated with.
For non-Open Access articles published, all supplemental material carries a non-exclusive license, and permission requests for re-use of supplemental material or any part of supplemental material shall be sent directly to the copyright owner as specified in the copyright notice associated with the article.