
Abstract
To identify cell-specific markers, we designed a DNA microarray platform with oligonucleotide probes for human membrane-anchored proteins. Human glioma cell lines were analyzed using microarray and compared with normal and fetal brain tissues. For the microarray analysis, we employed a spherical self-organizing map, which is a clustering method suitable for the conversion of multidimensional data into two-dimensional data and displays the relationship on a spherical surface. Based on the gene expression profile, the cell surface characteristics were successfully mirrored onto the spherical surface, thereby distinguishing normal brain tissue from the disease model based on the strength of gene expression. The clustered glioma-specific genes were further analyzed by polymerase chain reaction procedure and immunocytochemical staining of glioma cells. Our platform and the following procedure were successfully demonstrated to categorize the genes coding for cell surface proteins that are specific to glioma cells. Our assessment demonstrates that a spherical self-organizing map is a valuable tool for distinguishing cell surface markers and can be employed in marker discovery studies for the treatment of cancer.
Introduction
Currently, the high-throughput screening technology is widely available in the field of life science, especially in relation to molecular diagnosis and drug discovery. The versatility of the microarray technology enables the simultaneous analysis of a large number of genes at any given time. Cluster analysis is usually performed on the results of DNA microarray experiments. However, the routine procedure of data mining dealing with huge number of signals obtained from microarray has not yet been optimized.
Various methods of hierarchical and nonhierarchical clustering have been employed in previous analyses. The most popular methods include nonhierarchical clustering such as k-means, 1 partitioning around medoids, 2 and the cluster affinity search technique. 3
We have employed a spherical self-organizing map (sSOM), which is also a nonhierarchical clustering method, to cluster genes by the gene expression profiles of cells and tissues.4–9 In this study, we attempted to identify human glioma-specific cell surface markers by analyzing nine glioma-derived cell lines and compared normal adult and fetal brain tissues. Because the information relating to marker proteins on cells is extremely useful in identifying and targeting cells specifically, a sophisticated and conventional procedure to identify cell-specific surface markers is highly desirable.
Our procedure proposed here is rather new and innovative in the analysis of data from gene clustering of the expression profiles obtained from the DNA microarray technique.
Materials and Methods
Cell lines and culturing
We employed nine glioma cell lines for this study: A172, Gli36, U251MG, U373MG, GI-1, KG1C, T98G, CCFSTTG1, and TM31. A172, Gli36, U251MG, U373MG, GI-1, and KG1C cells were cultured in Dulbecco's Modified Eagle's Medium supplemented with 10% fetal bovine serum (FBS), containing 4 mM l-glutamine, 100 U/mL penicillin, and 100 μg/mL streptomycin. T98G and CCFSTTG1 cells were cultured in RPMI 1640 with 10% FBS, containing 2 mM l-glutamine, 100 U/mL penicillin, and 100 μg/mL streptomycin. TM31 cells were cultured in minimum essential medium with 10% FBS, 2 mM l-glutamine, 100 U/mL penicillin, and 100 μg/μL streptomycin. All cell lines were maintained at 37°C in a 5% CO2-humidified incubator.
RNA preparation
Total RNA was prepared from the cells using an RNeasy Mini Kit (Qiagen) according to the manufacturer's instructions. RNAs were essentially treated with DNase I to remove genomic DNA. To synthesize cDNA for DNA microarray analysis, 20 μg of total RNA was reverse-transcribed using SuperScript II (Invitrogen) with an oligo dT18 and dNTP-containing amino alkylated dUTP (0.4 mM, Ambion). Commercially obtained total RNA derived from normal adult and fetal brain (Stratagene) was compared as control throughout this study.
Reverse transcription and quantitative polymerase chain reaction
Using 2 μL of diluted cDNA (corresponding to 0.1 μg of original total RNA), real-time polymerase chain reaction (RT-PCR) was performed with the primers listed in Supplementary Table 1. The PCR profiles were 94°C for 5 minutes for initial denaturation followed by 95°C for 30 seconds, 55°C for 30 seconds, and 72°C for 30 seconds, followed by 72°C for 7 minutes final elongation. The cycling conditions were different and were carried out as follows: 25 cycles (for ID 287 and 1,286 and GAPDH), 28 cycles (for ID 2, 45 259, 314 339, 998, and 1,012), and 30 cycles (for the remaining candidates and epithelial growth factor receptor [EGFR]). For CD44s, caveolin-1, and GAPDH, quantitative RT-PCR (qRT-PCR) was performed using a LightCycler DX400 (Roche) with SYBR Green Realtime PCR Master Mix (Toyobo). The PCR profile was 40 cycles of 95°C for 10 seconds, 60°C for 10 seconds, and 72°C for 25 seconds.
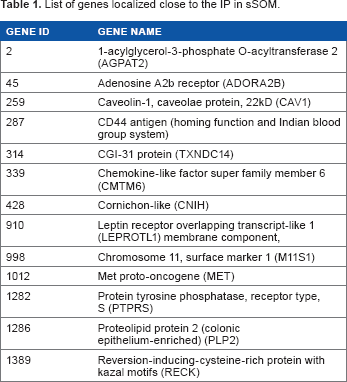
List of genes localized close to the IP in sSOM.
DNA microarray
We originally designed the DNA microarray, which focused on cell membrane-bound proteins to identify cell surface markers specific to the cells.7–9 It was designed to contain 1,795 oligonucleotide probes corresponding to human genes. To avoid the effect of alternative splicing, the coding sequence for the membrane-bound region or glycosylphosphatidylinositol (GPI) anchor-modified region was focused to design the oligonucleotide probes. The probes were conjugated on the slide glass coated with diamond-like carbon, as previously described.6,9 The Cy3-labeled cDNA synthesized above was hybridized to the cell surface marker DNA microarray and then scanned with a FLA-8000 scanner (Fuji Film). Intensity for each spot of the array was captured by GenePix® Pro5.1 image analysis software (Axon Instrument).
sSOM analysis
For the initial screening of the genes, the obtained intensity of each spot from the microarray analysis of duplicates was evaluated by the following criteria:

where A denotes the gene expression level in normal brain tissue in adult or fetus, G denotes the average expression level of each gene from the nine glioma cell lines, and V denotes the standard deviation of each expressed gene among the nine glioma cell lines. The genes that were not expressed above zero were considered insignificant and filtered out. The values were then plotted on to the sSOM software “Blossom” obtained from SOM, Japan Co. Ltd.
To find genes whose expression was significantly upregulated in glioma cell lines, we applied the following formula:

where G denotes the average of the difference between each expressed gene from the nine glioma (Gi) cell lines and gene expression level in adult or fetal brain (N); Vdenotes the standard deviation of (Gi – N).
The SOM algorithm was previously described by Tokutaka et al 10 and Okita et al. 11
Immunostaining
Glioma cells grown on 18 mm cover slips were washed with phosphate-buffered saline (PBS) twice, prior to fixation with 4% paraformaldehyde for 10 minutes. The fixed samples were incubated with blocking solution (PBS containing 10% FBS, 1% bovine serum albumin [BSA], and 0.02% NaN3), followed by incubation with anti-CD44 mouse monoclonal antibody (Cell signaling Technology, diluted 1:100 in PBS containing 1% BSA) at 4°C overnight or with anti-caveolin 1 rabbit polyclonal antibody (Cell Signaling Technology, diluted 1:200) at room temperature for one hour. After incubation, the samples were washed with PBS three times and then incubated with Alexa-488 conjugated secondary antibody (Life Technologies) at a dilution of 1:300 for 30 minutes. After washing three times with PBS, the samples were mounted, and fluorescent images were captured using LSM 510 Meta (Zeiss).
Results and Discussion
Design of microarray for cell surface proteins
We designed 1,797 oligonucleotide probes for human cDNA-coding transmembrane proteins and GPI-anchored proteins, which are located on the cell surface (Fig. 1A). Each probe was synthesized based on the nucleotide sequence coding for the transmembrane region or the region containing amino acid residues attached to GPI as a 60-mer modified with at the 5′-end. The duplicated probes were covalently conjugated to the activated surface of diamond-like carbon-coated slide glass, as previously described.6,9
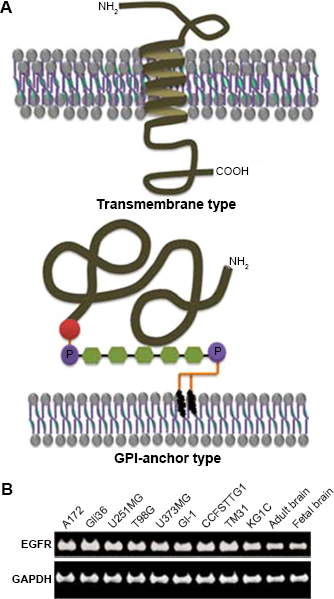
(A) Typical protein types integrated or anchored on cellular membrane. Transmembrane type has at least one region spanning the lipid bilayer. GPI-anchored type has a hydrophobic C-terminal tail (red) in the precursor form, and a processed C-terminal (brown) is attached to GPI and retained on the cell surface. (B) Expression of EGFR in the nine glioma cell lines and adult and fetal brain tissues. Evaluation was performed by reverse transcription PCR.
Cell surface markers commonly expressed in gliomas
We analyzed nine cell lines, namely, A172, Gli36, U251MG, U373MG, GI-1, T98G, CCFSTTG1, TM31, and KG1C, which were derived from human glioma. It is well known that EGFR overexpression in tumor samples of low-grade glioma 12 and anaplastic astrocytoma 13 has been associated with poor prognosis. As shown in Figure 1B, EGFR was overexpressed in all cell lines evaluated in this study. However, EGFR is also clearly expressed in normal brain tissues, suggesting that EGFR is still not a good marker to distinguish glioma from normal cells. To screen for candidate markers specific and common to gliomas, total RNA from nine glioma cell lines and brains from adult and fetus was analyzed on our DNA m icroarray.
The genes were plotted in the two dimensions of V and |A – G| in Supplementary Figure 1. Because the genes, which had good differences in intensity between glioma and brain tissues and had very low V between gliomas, were considered helpful in characterizing glioma cells, the genes were selected for further sSOM analysis. As a result, 1,174 and 179 genes were selected for the analyses of normal adult brain and fetal brain tissues, respectively.
Gene expression profiles on sphere surfaces
The expression profiles were shown on each sphere surface for the selected genes (Fig. 2). The longitude and latitude were fixed in all sphere surfaces so that the profiles could be distinguished at a glance. Gene expression profiles were compared as two sets between normal adult brain vs glioma, and fetal brain vs glioma. From the intensity of the gene expression plotted on the sSOM, it appears that the patterns of expression profiles were considerably different between the two comparisons. When compared with normal adult brain, the profiles of glioma appear very similar to one another while there was no significant gene expression visible in the normal adult brain on the same side of the sphere. Fetal brain had the same expression profile on the same side. However, the pattern was different from the patterns of the glioma cell lines, which were again quite similar. When we compared the glioma cell panels alone, shown in Figure 2A and B, the heat map characteristics were entirely different between each other, based on the comparison with adult or fetal brain. The heat map characteristics shown in Figure 2 clearly emphasize that there is similarity in the expression patterns within the glioma cell lines compared with those within adult or fetal brain. sSOM was able to show the glioma-specific characteristics irrespective of the different stages of the normal adult or fetal brain. Thus, some genes were specifically and commonly expressed in gliomas, as suggested by the red part of the profiles of glioma cell lines, which were localized in almost the same part of the sphere surfaces.
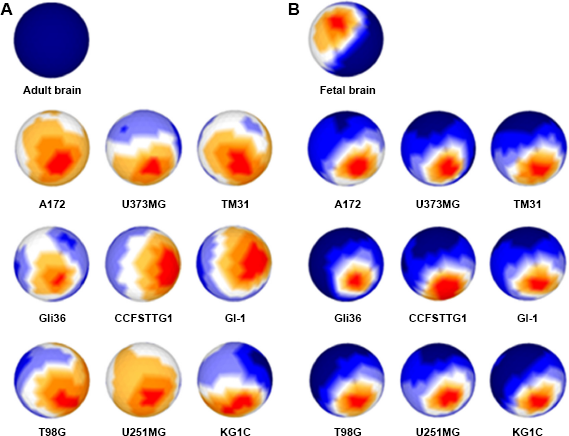
Gene expression profiles of nine glioma cell lines and brain tissues presented on sphere surfaces. Profiles of intensity of each gene were plotted on the sphere surface with the longitude and latitude fixed at the same positions. Nine glioma cell lines vs normal adult brain (A) and vs fetal brain (B). Intensity of the spot is depicted in red, yellow, white, blue, and dark blue as very high, high, medium, low, and very low, respectively.
Mining genes commonly expressed in glioma cell lines but not in brain tissues
Although it was possible to select the genes of interest from the aforementioned procedure, we further considered the extraction of the genes to be focused by overlaying the profiles in one sSOM (Fig. 3A).
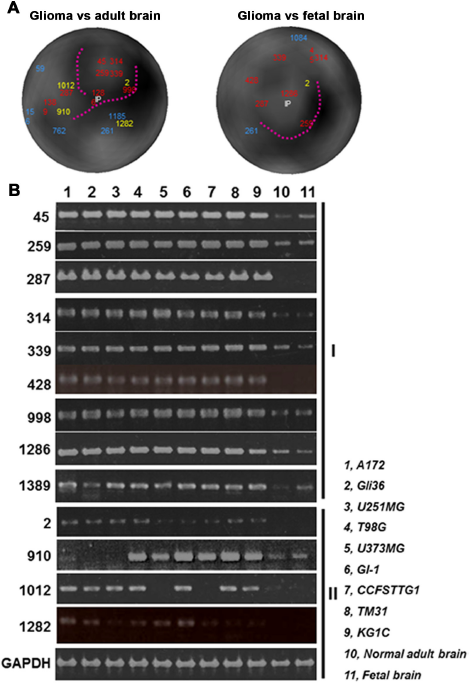
(A) Mining genes upregulated in gliomas by sSOM. Each number denotes the gene's identity. IP denotes the ideal point, where the expression in every glioma is maximum but zero expression in brain tissue. The points close to the IP could be nominated as the best candidates of the glioma marker. Dark areas (with broken lines) show the borders of each cluster of genes. Numbers in red, yellow, and blue represent close, good, and little relationship with IP, respectively, as the results of RT-PCR. (B) Evaluation of the expression of genes selected through sSOM procedure. Genes in groups I and II are the genes for which the numbers are shown in red and yellow, respectively. Evaluation was performed by reverse transcription PCR using agarose gel. The experiment was repeated three times and the same results were obtained.
As the ideal point (IP), the virtual gene that was expressed in all glioma cell lines at the highest level, but not expressed in brain tissues, were inserted in the dataset for reference. Based on these calculations, we generated the gene expression profiles against the adult brain and fetal brain separately compared with glioma. In Figure 3A, both of the gene expression profiles were shown on the same side of the sphere surface with IP at the center. The genes located close to IP are interpreted as the genes expressed in all glioma cell lines but not in brain tissues. The dark part of the sphere surface translates to the distances apart from each other so that the dotted lines were able to clearly show the border of clusters. The genes evident in Figure 3A are listed in Table 1.
Evaluation of genes commonly expressed in glioma cell lines
Nineteen genes are shown in Figure 3A. The expression of these genes was evaluated by reverse transcription PCR (Fig. 3B), and CD44 and caveolin-1 were investigated by qRT-PCR (Supplementary Fig. 2). In Figure 3B, 13 genes showed a good relationship with glioma-specific expression. Genes expressed in all glioma cell lines were denoted as group I. Genes in group II were not expressed in few of the glioma cell lines. The genes in group I were shown in red, and those in group II were shown in yellow (Fig. 3A). The remaining six genes shown in blue could not be confirmed as being positively expressed in glioma. Based on these observations, the genes located close to IP were depicted in red, whereas the genes depicted in blue were located distant from IP (Fig. 3A). This suggests that sSOM clustering almost correlated with the results of gene expression results confirmed by PCR. In Figure 3A the 13 genes depicted in red and yellow has been tabulated in Table 1. Not only are there well-known genes but genes, whose function is not yet clear, are also listed. Because hyaluronic acid is abundant in the brain tissue, CD44 (hyaluronic acid receptor) might be a good marker of glioma among the listed genes. CD44 is known to have various forms resulting from alternative splicing14,15 so that the variant form of CD44 in glioma cell lines was assessed by reverse transcription PCR (Supplementary Fig. 3). As a result, the standard CD44 (CD44s) form was found to be dominantly expressed in the cell lines. Moreover, CD44 directly/indirectly contributes to antioxidant status, drug resistance, and migration in cancer cells.16,17 The high expression levels of CD44 in glioma correlate with malignancy and prognosis18,19 because CD44 is not only associated with astrocytes but also with cancer stem cells.20,21
Translation of the gene of interest is considered the most crucial point in tumor marker discovery. The gene should transcribe and eventually be translated into protein because protein expression is an absolute requirement for the invasion, migration, and various signaling aspects of cancer cells. For the confirmation of protein expression in the cells, CD44 and caveolin-1 in the genes of group I were the best candidates, which cross-reacted with antibodies that could easily detect proteins; these two proteins were evaluated by immunostaining (Fig. 4A and B). Both antibodies against CD44 and caveolin-1 showed clear staining in all nine glioma cell lines. Because this staining was not observed by the secondary antibody, there was no nonspecific binding by the secondary antibody. We concluded that the proteins were present on the cellular membrane because of the observation of staining on cell connections.
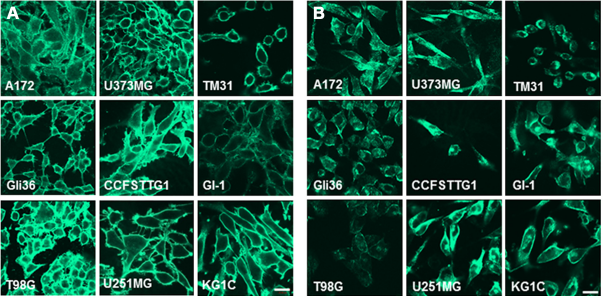
(
Conclusion
sSOM coupled with DNA microarray analysis has been successfully demonstrated to show gene expression profiles. Through this procedure, the identification of specific genes is possible for the nomination of cell surface markers, such as CD44 that are specific to glioma.
Author Contributions
Conceived and designed the experiments: YS, TKasai, and MS. Analyzed the data YS, MI, AV, KK, AS, and HT. Wrote the first draft of the manuscript: YS and MS. Contributed to the writing of the manuscript: YS, TKasai, AV, and MS. Agreed with the manuscript results and conclusions: YS, HT, and MS. Jointly developed the structure and arguments for the paper: AM and TKudoh. Made critical revisions and approved the final version of the manuscript: TKasai, AV, TKudoh, and MS. All the authors have reviewed and approved the final manuscript.
Supplementary Materials
Footnotes
Acknowledgments
The authors appreciate the excellent assistance of Ms. Mami Asakura throughout the entire study.