
Abstract
Hepatocellular carcinoma is one of the most mortal and prevalent cancers with increasing incidence worldwide. Elucidating genetic driver genes for prognosis and palindromia of hepatocellular carcinoma helps managing clinical decisions for patients. In this study, the high-throughput RNA sequencing data on platform IlluminaHiSeq of hepatocellular carcinoma were downloaded from The Cancer Genome Atlas with 330 primary hepatocellular carcinoma patient samples. Stable key genes with differential expressions were identified with which Kaplan–Meier survival analysis was performed using Cox proportional hazards test in R language. Driver genes influencing the prognosis of this disease were determined using clustering analysis. Functional analysis of driver genes was performed by literature search and Gene Set Enrichment Analysis. Finally, the selected driver genes were verified using external dataset GSE40873. A total of 5781 stable key genes were identified, including 156 genes definitely related to prognoses of hepatocellular carcinoma. Based on the significant key genes, samples were grouped into five clusters which were further integrated into high- and low-risk classes based on clinical features. TMEM88, CCL14, and CLEC3B were selected as driver genes which clustered high-/low-risk patients successfully (generally, p = 0.0005124445). Finally, survival analysis of the high-/low-risk samples from external database illustrated significant difference with p value 0.0198. In conclusion, TMEM88, CCL14, and CLEC3B genes were stable and available in predicting the survival and palindromia time of hepatocellular carcinoma. These genes could function as potential prognostic genes contributing to improve patients’ outcomes and survival.
Keywords
Introduction
Hepatocellular carcinoma (HCC) is among the most lethal and prevalent cancers in the human population, which is more common in men than in women. 1 It accounts for at least 85% of primary liver cancer which is the third most common cause of cancer mortality worldwide compared with secondary liver cancer. 2 The global incidence of HCC shows dramatical differences on its worldwide distribution, gender, race, and region. The risk factors for HCC then vary by many aspects, making the patients with HCC having a highly multiple courses.3,4
Survival has improved due to the advancement of the diagnostic time (lead-time bias), and the effective therapeutic strategies with the current 5-year survival in surgical patients might had exceeded 70%.5,6 A notion is supported that HCC comprises several biologically distinct subgroups with molecular heterogeneity that has not been appreciated from methods traditionally used to characterize HCC. Cancer staging therefore becomes a critical step in management of HCC. However, although improving the classification of HCC patients would at least improve the application of currently available treatment modalities for better prognosis, the prognosis of HCC is complex and multifaceted still. 7 The optimal staging system is still under intense debate despite that key predictors of prognosis are recognized as tumor extent, degree of liver dysfunction, and patient’s general health condition.7,8 But it is as true as with other cancers, the early diagnosis and early treatment of HCC can significantly improve the overall effect. Recent researches have confirmed that the occurrence of liver cancer is closely related with many oncogenes and tumor suppressor genes and that these genes’ expressions and their product structures at the cell or molecular level would contribute to explore the carcinogenesis of HCC.9–11 Besides, studying genes from genetic level for diagnosis, treatment, and prevention of HCC to explore cancer-related genes and protein as detecting molecular biomarkers opens up a new way for the study on the pathogenesis of HCC as well. Recently, many biomarkers were identified relating to invasion, metastasis, recurrence, and survival, such as transcripts of tumor-associated antigens (α-fetoprotein (AFP), melanoma-associated antigens (MAGEs), and cytokeratin 19 (CK19)),12,13 the molecular markers for cellular malignancy phenotype (DNA ploidy, 14 cellular proliferation index,15,16 cell cycle regulators, 17 oncogenes, and tumor suppressors18,19), as well as telomerase activity. 20 Some of these biomarkers are potential predictors for HCC metastatic recurrence and clinical outcomes. 21 Accordingly, the identification and clinical application of the prognostic biomarkers for HCC are feasible and promising.
In this study, we promoted to identify and elucidate genetic driver genes for prognosis and palindromia of HCC by analyzing the online data set using bioinformatics methods. RNA sequencing (RNA-Seq) data online were used to select stable key genes with differential expressions based on HCC characteristics. Kaplan–Meier survival analysis and clustering analysis were performed to figure out the driver genes which are potentially influencing the prognosis or outcomes of this disease. Finally, the selected driver genes were verified using an external data set. The identified stable driver genes were available to predict the survival time and palindromia of HCC, functioning as potential prognostic genes to the improvement of patients’ outcomes and survival.
Materials and methods
Data source and processing
The RNA-Seq data of 423 samples on platform IlluminaHiSeq were downloaded from The Cancer Genome Atlas (TCGA) database; 12 hereinto, 330 samples were from primary liver cancer patients with follow-up information, and 93 samples were normal liver tissues.
Level 3 data of RNA-Seq were mapped to corresponding genes using SeqMap software and the non-matched genes were cut off. But there was also a key challenge in transcript quantification from RNA-Seq data. To handle the reads that map to multiple genes or isoforms, RNA-Seq by Expectation Maximization (RSEM), an user-friendly software package used to quantify gene and isoform abundances from single-end or paired-end RNA-Seq data. 13 The value of every selected gene was standardized by log2 (RSEM + 1), and the whole construction procedure is shown in Figure 1.

Flow chart of the gene model construction.
Differential expression analysis
The outcomes of HCC patients in different stages varied resulting from differentially expressed genes. Differences in expressions of certain genes could result in diverse prognosis risk. First, genes significantly differed in patients were selected. Variance and median of their expressions in every sample were computed as statistical indicators. Genes with individual variance more than 20% of the total variance and median more than 20% of the total median were screened out.
Multi-iteration hierarchical clustering
The consensus clustering (CC) method providing quantitative and visual stability evidence for estimating the number of unsupervised classes with intrinsic groups sharing biological characteristics in a data set was applied to classify the HCC patient samples in this study. After centralized processing of these selected genes, ConsensusClusterPlus implementing the CC method in R 14 was used to group patient samples into two categories. Limma package15,16 in R was used for differential analysis of every gene in two categories with significant p value < 0.001 as the threshold.
Screening of stable key genes
To avoid the contingency in the results of the unsupervised pre-classified samples, multi-hierarchical clustering analysis 17 was repeated with expression level of every selected gene in categories for new genetic characteristics and sample classification. This repetition would continue until at least one of the two conditions (selected key genes and/or new categories) was consistent. Finally, stable key genes with differential expressions in HCC patients were obtained.
Survival analysis of key genes
Changes in expression level affect patient’s survival time. Survival analysis, a method to study the relationship and degree between survival time, outcomes, and numerous influencing factors by analyzing and inferring the survival time of animals or human according to experimental or survey data, was applied in this study to screen out key genes influencing patients’ survival.
Kaplan–Meier survival analysis 18 of the stable feature genes was performed using survival 19 in R language. Genes with significant p value < 0.01 were selected as prognostic genes in HCC. Euclidean distance was applied to cluster. 20
Molecular subtype construction of HCC
To further study the different aggregation effects of the ensemble gene expressions on HCC patients, patient samples were clustered again based on the prognostic genes. Molecular subtype of HCC was constructed using unsupervised clustering according to different expression profiles in survival analysis. Clinical features of every subtype were analyzed for differentiation in clinical features between subtypes.
Screening of driver genes
Subtypes with similar clinical features were classified together, differentially expressed genes of the classified subtypes. Genes with significant differences were selected as inner driver genes.
Prognostic influences of driver genes were observed by clustering the patient samples to compare the risks of prognosis and palindromia. Meanwhile, the expression correlation of driver genes was analyzed by comparing the consistency of their expressions in different samples.
Functional analysis of driver genes
In numerous literature search and analysis, the relationship between every driver gene and cancer was analyzed, and the biological significances of driver genes in previous researches were determined.
Gene Set Enrichment Analysis (GSEA) is a computational method to assess statistically significant, concordant differences of genes between two biological states. A new version of the Java-based software (GSEA-P 2.0) 21 was applied to observe biological pathways with functional changes in a patient sample. Enrichment score (ES) < −0.6, p < 0.01, and false discovery rate (FDR) < 0.05 were thresholds.
Verification of driver genes
External profiles of GSE40873 22 based on GPL570 platform were downloaded from the Gene Expression Omnibus (GEO) database to verify the effect of driver genes on the prognosis of HCC patients. Hereinto, there were 134 cancer samples and 49 noncancerous liver tissues of HCC patients, which were examined as a training set. Samples in this new data set were clustered according to the mean expression levels of three driver genes, and numbers of high-expressing and low-expressing genes were calculated finally. Patient samples with at least two driver genes upregulated were grouped in high-risk cluster, and patients identified at least two driver genes downregulated were in low-risk cluster.
Results
Differential expression analysis
There were a total of 20,530 gene expression profiles from 423 liver samples of HCC patients, including 330 primary liver cancer samples with follow-ups from patients.
A total of 14,421 genes were selected out with individual variance more than 20% of the total variance and median more than 20% of the total median.
Multi-iteration hierarchical clustering
Expression levels of 14,421 genes in 330 patient samples were screened and centralized. Clustering analysis with 1000 iterations was performed. Binary classification of the 14,421 genes is shown in Figure 2(a). There were 74 and 256 samples in each category with high correlations, respectively. Meanwhile, 6435 differential genes were selected as the potential key genes for further analysis.

Multi-iteration hierarchical clustering. Binary classification of the (a) 14,421 genes and (b) potential key genes. Blue area indicates correlation level; 1 and 2 represent two categories.
Survival analysis of stable key genes
In cyclic iterative screening, 5781 key genes of HCC were identified and grouped into two categories with 130 and 200 samples in each (Figure 2(b)). Similarly, samples in one category possess high correlations, but those in different category have low correlations. The average correlation level of the key genes was far higher than that of the raw genes.
In Kaplan–Meier survival analysis of the key genes, 156 prognostic genes were identified influencing the survival time of HCC patients. Patient samples were significantly clustered into 5 clusters, Cluster1 (48 samples), Cluster2 (121 samples), Cluster3 (44 samples), Cluster4 (56 samples), and Cluster5 (61 samples) (Figure 3). One gene was possible to be grouped into several different clusters at the same time. And the expressions were totally different in each cluster.

Cluster analyses of 156 prognostic genes. The horizontal axis represents samples calculated using Euclidean distance, vertical axis represents gene using Pearson correlation coefficient calculating distance, red and green indicate gene expression level, and white indicates outlier.
Molecular subtype construction of HCC
Kaplan–Meier survival analysis on Cluster1, Cluster2, Cluster3, Cluster4, and Cluster5 indicated differences on both survival time and palindromia (Figure 4) according to the clinical features. It is obvious that the prognosis of patients in Cluster1, Cluster2, and Cluster4 was significantly poor than those in Cluster3 and Cluster5. Cluster3 and Cluster5 were integrated as one molecular subtype of HCC as low-risk class, and Cluster1, Cluster2, and Cluster4 were integrated as high-risk class.
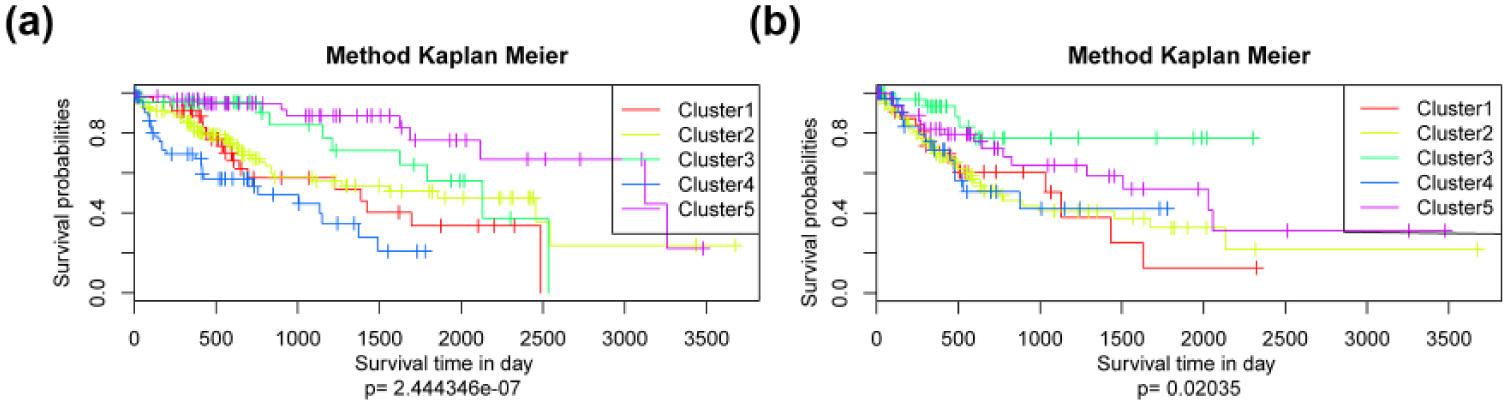
Survival analyses of molecular subtypes of hepatocellular carcinoma. Kaplan–Meier survival analysis comparing the (a) overall survival time of genes in five clusters and (b) palindromia of five clusters.
Screening and analysis of driver genes
Prognosis risk and palindromia risk of both the low-risk class and high-risk class were analyzed in survival analysis (Figure 5(a) and (b)). It is obvious that the differential expressions of genes in high-risk class were significantly higher than those in low-risk class on both two aspects. Further mining on the differentially expressing genes in the two representative classes identified three driver genes, TMEM88, CCL14, and CLEC3B, showing considerable correlation with the prognoses of HCC (Figure 5(d)).

Screening of driver genes. (a) Kaplan–Meier survival analysis of integrated high- and low-risk classes on prognosis risk, (b) Kaplan–Meier survival analysis of integrated high- and low-risk classes on palindromia risk, and (c) bidirectional hierarchical clustering of driver genes. The horizontal axis represents samples calculated using Euclidean distance, vertical axis represents gene using Pearson correlation coefficient calculating distance, red and green indicate gene expression level, and white indicates outlier. (d) Correlation coefficient and expression profile of three driver genes.
Patient samples were divided into three clusters according to the expressions of these driver genes (Figure 5(c)). Most samples in Cluster1 were patients in Grade 1 (G1) and Grade 2 (G2).
Meanwhile, patient samples were clustered again into Cluster1, Cluster2, and Cluster3 with expressions at high, medium, and low levels. Samples in three clusters were significantly related to different clinical grades (from G1 to G4) (Table 1). Clinical grades in Cluster1 were generally less than that in Cluster2 and Cluster3. Samples in G1 and G2 were amalgamated as Low Grade; similarly, samples in G3 and G4 were in High Grade for statistical analysis. Cluster1 showed significant differences with Cluster2 (p = 0.007347) and Cluster3 (p = 0.0001249) in Grade, respectively.
Grade distribution of three clusters.

In Kaplan–Meier survival analysis of three clusters (Figure 6), 5-year survival of Cluster3 was better than that of Cluster1 and Cluster2. The dramatic gap between Cluster3 and Cluster1 was caused by the different genes in between the two clusters, that is, TMEM88, CCL14, and CLEC3B, which could be defined as driver genes. It is suggested that high expressions of these genes could effectively decrease palindromia risk and improve the survival conditions.

Kaplan–Meier survival analyses of three clusters. Kaplan–Meier survival analyses on (a) survival time and (b) palindromia.
Functional analysis of driver genes
In document mining verification, TMEM88 and CCL14 were all related to cancers except for CLEC3B, however, illustrating that these three genes were potential clinical biomarkers in prognoses of HCC.
In GSEA of the two clusters based on the driver genes, a total of 14 biology pathways were identified enriched in low-expression cluster (Table 2). Most of the genes in low-expression cluster were associated with cell cycle. In addition, compared with genes in high-expression cluster relating to cell production, genes in low-expression cluster were more abnormal.
Functional analysis of genes clustered by driver genes.
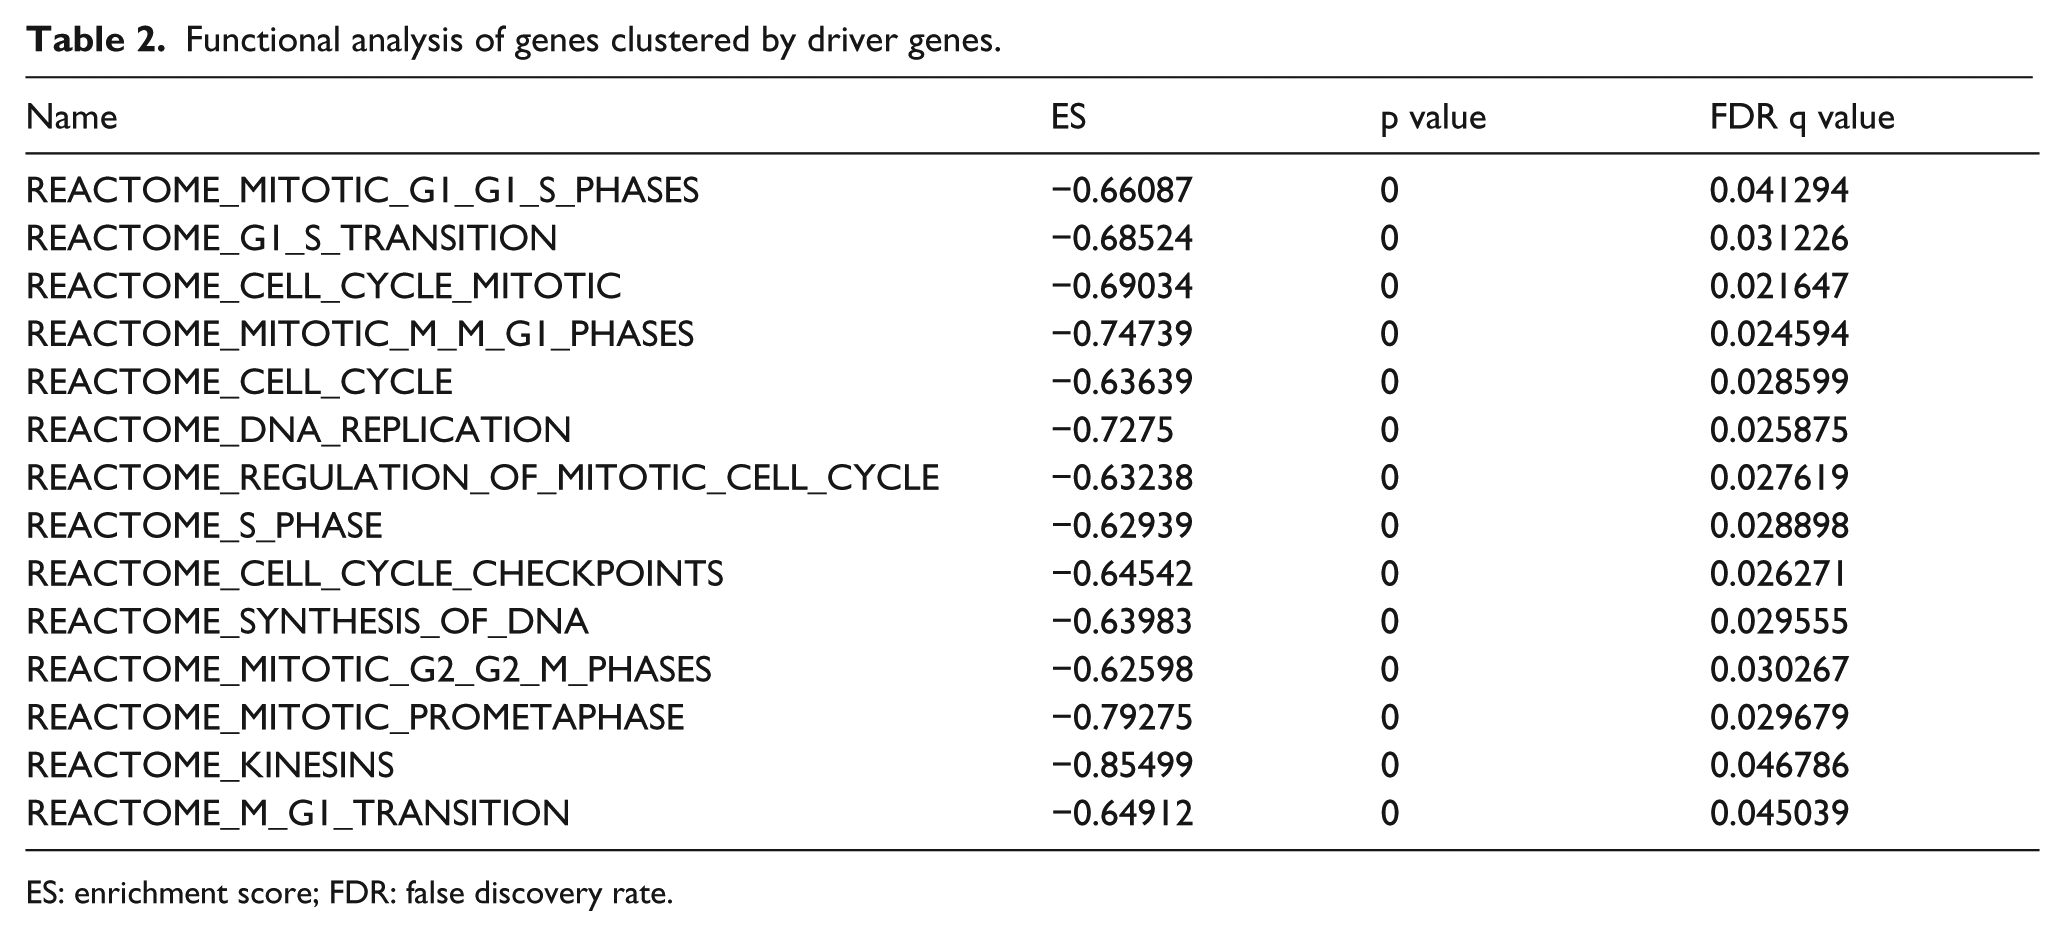
ES: enrichment score; FDR: false discovery rate.
Verification of driver genes
To verify the repeatability and transferability of the correlation between three driver genes and prognosis of HCC patients, we can download another independent data set with validation data for survival analysis from GEO database. A total of 49 HCC patients with follow-up information were available. Patient samples in new data set were grouped into high- and low-risk cluster, of which Kaplan–Meier survival analysis was performed (Figure 7). The difference between high- and low-risk clusters was significant with p = 0.0198.

Kaplan–Meier survival analysis of external data set clustered by driver genes.
Discussion
HCC has become quite common in Africa and Asia, considered as one of the most common malignancies worldwide. 23 HCC patients are still suffering from the high risks of palindromia and poor prognoses even though the clinical treatment has seen some improvement recently. 24 Previous studies suggested that early diagnosis of HCC combining with effective treatment is likely to prolong the lifetime of patients with liver cancer. 25 Thus, studies on identification of new high specificity and sensitivity biomarkers for HCC are essential and quite popular. It is well known that tumor progression is a complex process involving various factors, changes of various genes, and multiple stages developing. 26 Additionally, as for HCC patients, the prognostic modeling is not tightly related to tumor stage, degree of liver function impairment, patient’s general condition, and treatment efficacy. 27 Therefore, it would be rather difficult to estimate or predict the outcomes and survival of the HCC patients precisely with clinical observation or macro-detecting methods solely. The burgeoning of microarray assay on giant gene expression profiles lights the approach toward the screening of cancer-related genes for early diagnosis, pointing treatment, and prognostic prediction.
In this study, numerous RNA-Seq data from TCGA were analyzed and finally three driver genes (TMEM88, CCL14, and CLEC3B) were identified. Besides, these three driver genes were validated again by clustering another independent data set for survival analysis. The result suggested that these genes were effective to evaluate the prognoses of HCC patients. Besides, document mining verification illustrated that TMEM88 and CCL14 were all related to cancers except for CLEC3B.
TMEM88 (target protein transmembrane 88), a two-transmembrane–type protein, was reported to function as a dishevelled-binding protein. 28 Previous studies have confirmed that TMEM88 expressed at significantly higher levels in breast cancer tissues (71.22%, 99/139) than in normal breast tissues (11.4%, 4/35; p < 0.001). 29 Besides, Lee et al. 28 partially characterized the expression and possible mechanisms of action of TMEM88 in Xenopus embryos to find that this protein played a role in regulating Wnt signaling and was associated with Dvl proteins in a context-dependent manner. And this discovery was corroborated by analysis of microarray data of embryonic mouse intestines. Additionally, TMEM88 was identified playing roles in non–small-cell metastasis, 30 drug resistance of ovarian cancer, 31 and triple-negative breast cancer. 29 Unfortunately, the expression pattern of this protein in human cells, particularly in malignant tumor cells, has not been investigated, let alone the association of this gene and the prognosis of HCC patients. Accordingly, TMEM88 was newly screened out as prognostic marker of HCC in this study.
CCL14 (CC chemokine ligand 14) belongs to the CC family of chemokines, manifesting their role primarily in immune cell homeostasis and disease by attracting and activating leukocytes. 32 Similarly, CCL14 was found associated with not many cancers except for mammary cancer in previous study. 33 But the other members of CC family were detected playing roles in carcinogenesis and metastasis of some cancers. For instance, CCR9/CCL25 was found activated in cutaneous melanoma that mediates preferential metastasis to the small intestine, 34 CCL21 was identified downregulated in human colorectal adenocarcinomas, 35 and the chemokine CCL28 was detected in pleomorphic adenoma and adenolymphoma of the human salivary glands. 36 Therefore, the identification of the chemokine CCL14 influencing the survival of HCC patients was groundbreaking and reasonable.
Gene CLEC3B (C-type lectin domain family 3, member B) encoding tetranectin in humans has not been identified associated with human cancers, but its product, tetranectin, was downregulated in oral squamous cell carcinoma (OSCC). 37 This indicated the potential roles of CLEC3B as biomarker in HCC together with TMEM88 and CCL14. And the specific functions of these driver genes in the prognostic process of HCC should be studied further.
To sum up, the identification of three driver genes is creative and meaningful in the prediction of the survival and palindromia of HCC patients and contributed dramatically to prolong the survival time and rate of HCC worldwide. Besides, this result is reasonable and reliable with repeated survival analysis and clustering analysis, which was confirmed by external data set as well.
Footnotes
Declaration of conflicting interests
The author(s) declared no potential conflicts of interest with respect to the research, authorship, and/or publication of this article.
Funding
The author(s) disclosed receipt of the following financial support for the research, authorship, and/or publication of this article: This work was supported by the National Science Foundation of China (81371178).