
Abstract
Cell division cycle 45 was reported to be overexpressed in some cancer-derived cell lines and was predicted to be a candidate oncogene in cervical cancer. However, the clinical and biological significance of cell division cycle 45 in papillary thyroid cancer has never been investigated. We determined the expression level and clinical significance of cell division cycle 45 using The Cancer Genome Atlas, quantitative real-time polymerase chain reaction, and immunohistochemistry. A great upregulation of cell division cycle 45 was observed in papillary thyroid cancer tissues compared with adjacent normal tissues. Furthermore, overexpression of cell division cycle 45 positively correlates with more advanced clinical characteristics. Silence of cell division cycle 45 suppressed proliferation of papillary thyroid cancer cells via G1-phase arrest and inducing apoptosis. The oncogenic activity of cell division cycle 45 was also confirmed in vivo. In conclusion, cell division cycle 45 may serve as a novel biomarker and a potential therapeutic target for papillary thyroid cancer.
Introduction
Thyroid cancer is the most common malignant tumor of the endocrine system, and its incidence has increased rapidly worldwide in the past few decades. 1 Thyroid cancer includes papillary thyroid carcinoma (PTC), follicular thyroid carcinoma (FTC), and anaplastic thyroid carcinoma (ATC). Among them, PTC is the most common form and associates with a favorable therapeutic response and prognosis. 2 However, in the case of aggressive PTC and certain PTC variants, a regional recurrence or distant metastasis is observed in 5%–20% of the patients who have undergone total thyroidectomy.3,4 Therefore, further investigation on identification of novel biomarkers and potential drug targets is eagerly needed to provide better follow-up treatment.
The cell division cycle 45 (CDC45)-minichromosome maintenance protein complex (MCM)-GINS (CMG) complex is a conserved component of the DNA replication system. 5 CDC45, a component of the CMG complex, is required for DNA synthesis during genome duplication.6,7 Recruitment of CDC45 at G1/S transition is induced by human DNA helicase B for initial DNA replication. 8 Moreover, overexpression of CDC45 recapitulates all c-Myc-induced replication and damage phenotypes, and CDC45 functions as a downstream gene of Myc. 9 Though CDC45 was reported to be overexpressed in some cancer-derived cell lines 10 and was predicted to be a candidate oncogene in cervical cancer, 11 the expression profile and function of CDC45 in PTC still remain unknown.
In this study, it is the first time that we show aberrant expression and clinical significance of CDC45 in PTC. In addition, we also show biological function of CDC45 in PTC both in vitro and in vivo. Our findings suggest that CDC45 might play a significant role in regulation of PTC progression.
Materials and methods
Data sources and bioinformatics
A The Cancer Genome Atlas (TCGA) dataset named TCGA_THCA_exp_HiSeqV2-2015-02-24 was downloaded at the website of the UCSC cancer browser (https://genome-cancer.ucsc.edu/),12–14 containing 505 PTC tissues and 59 adjacent normal tissues. All normalized messenger RNA (mRNA) expression values were obtained from “genomicMatrix” file. CDC45 expression difference between PTC tissues and normal tissues was investigated using unpaired Student’s t-test. Association of CDC45 with other mRNAs, including Ki-67, CCND1, CCNE1, and CCNE2, was analyzed using Pearson correlation test.
A list of 148 genes with highest expression correlation (Pearson r value ⩾ 0.5; Table 1) with CDC45 were submitted to DAVID Bioinformatics Resources 6.7 (http://david.abcc.ncifcrf.gov/)15,16 for KEGG and Gene Ontology (GO) enrichment analysis.
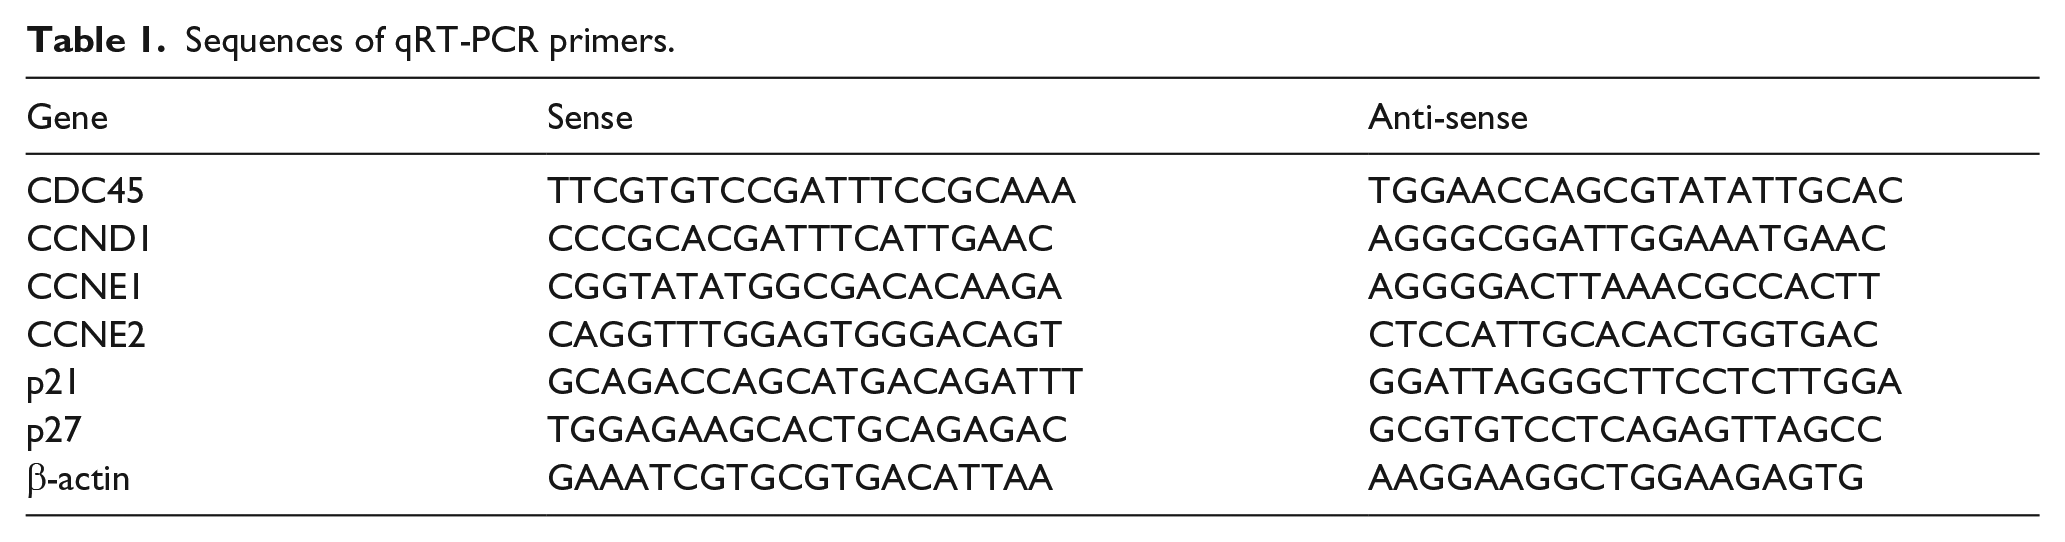
Sequences of qRT-PCR primers.
Tissue collection
In this study, we collected 64 paired cases of PTC and adjacent normal tissue samples from patients who received surgical resection at The First Affiliated Hospital of Nanjing Medical University (Nanjing, China) from 2012 to 2015. Informed written consent for scientific use of biological material was obtained from each patient, and this study was approved by the Ethics Committee of Cancer Institute of Jiangsu Province. All patients’ clinicopathological parameters, including age, gender, primary tumor size, lymph node status, tumor–node–metastasis (TNM) stage, tumor location, and focus type, were collected from their medical records.
Cell culture, small-interfering RNA, and small hairpin RNA construction
BCPAP and TPC-1 cells were cultured in RPMI 1640 media (KeyGen Biotech. Co., Ltd.) supplemented with 10% fetal bovine serum (FBS) and penicillin/streptomycin, and cultured at 37°C in a humidified incubator containing 5% CO2. Transfection was performed following the small-interfering RNA (siRNA) sequence transfection protocol for Lipofectamine RNAi MAX (Invitrogen). Nonsense RNAi (nsRNA) was used as a negative control. Transfection efficiency was evaluated by quantitative real-time polymerase chain reaction (qRT-PCR) and western blot. Two siRNAs were designed: the sequences were as follows: siRNA-1 for CDC45: 5′-GCGUGCAGACUUUCAGCAUTT-3′ (sense) and 5′-AUGCUGAAAGUCUGCACGCTT-3′ (antisense); siRNA-2 for CDC45: 5′-CCAAGGACCUGAAUGACAUTT-3′ (sense) and 5′-AUGUCAUUCAGGUCCUUGGTT-3′ (antisense). The human small hairpin RNA (shRNA) sequences were designed based on siRNA-1 and nsRNA.
Clone shRNA oligos into lentivirus vector
These shRNA oligos were cloned into lentivirus vector pLKO.1 followed the manufacturer’s instructions. Lentiviral particles were generated by co-transfection of TPC-1 cells with shCDC45/pLKO.1 or shNC/pLKO.1 together with pCMV-dR8.2 (packing plasmid) and pCMV-VSVG (envelope plasmid). Lv-shCDC45 or Lv-NC was harvested 48 h after transfection, and the titer was determined.
RNA extraction and qRT-PCR
Total RNA was extracted from cultured cells using TRIzol reagent (Invitrogen) according to the manufacturer’s instruction. For RT-PCR, 1000 ng total RNA was reverse-transcribed to a final volume of 20 µL complementary DNA (cDNA) using a Reverse Transcription Kit (cat no. RR036A; TaKaRa). qRT-PCR analysis was performed with SYBR Select Master Mix (cat no. 4472908; Applied Biosystems). The primers for CDC45, CCND1, CCNE1, CCNE2, p21, p27, and β-actin are shown in Table 1. The qRT-PCR data collection was performed using a QuantStudio™ 6 Flex Real-Time PCR System, and the qRT-PCR reaction included an initial denaturation step at 95°C for 10 min, followed by 40 cycles of 92°C for 15 s and 60°C for 1 min. Each sample was run in triplicate and the relative expression was calculated and normalized using the 2−ΔΔCt method.
Protein preparation and western blot
Cells were harvested and treated with lysis buffer on ice (KeyGen Biotech. Co., Ltd.), and a bicinchoninic acid assay (BCA) kit (KeyGen Biotech. Co., Ltd.) was used to quantify protein concentration. Equal amounts of protein were loaded in sodium dodecyl sulfate polyacrylamide gel electrophoresis (SDS-PAGE) gels. After separation in the gel, the protein was transferred on a polyvinylidene fluoride (PVDF) membrane. Membranes were blocked in 2% bovine serum albumin (BSA) in Tris buffered saline with Tween 20 (TBS-T) for 1 h and then incubated overnight (4°C) with antibodies against CDC45 (sc-20685, 1:500; Santa Cruz Biotechnology), cyclin D1 (2978, 1:1000; Cell Signaling Technology), cyclin E1 (ab7959, 1:200; Abcam), CCNE2 (11935-1-AP, 1:500; Proteintech), p21 (sc-397, 1:500; Santa Cruz Biotechnology), p27 (sc-528, 1:200; Santa Cruz Biotechnology), or β-actin (8H10D10, 1:1000; Cell Signaling Technology). After being washed in TBS-T, membranes were incubated with goat anti-rabbit horseradish peroxidase (HRP)-conjugated secondary antibody (1:10,000; Abcam) or goat anti-mouse HRP-conjugated secondary antibody (1:10,000; Abcam) for 2 h at room temperature. The blots were visualized by enhanced chemiluminescence (ECL) detection (Thermo Fisher Scientific). All experiments were repeated at least three times independently.
Immunohistochemistry
Immunohistochemistry (IHC) for CDC45 expression in samples was performed using standard methods. Briefly, tissue sections were deparaffinized and rehydrated through graded alcohol. Endogenous peroxidase activity was blocked by incubation in 3% H2O2. Antigen retrieval was carried out with 0.01 M citrate buffer (pH 6.0) and microwave heat induction. The anti-CDC45 rabbit polyclonal antibody (sc-20685 1:200; Santa Cruz Biotechnology) was used. CDC45 staining was scored by blinded observers (including a pathologist) according to intensity and percentage of positive cells. The staining intensity was scored according to four grades: 0 (no staining), 1 (weak staining), 2 (intermediate staining), or 3 (strong staining). The product (percentage of positive cells and respective intensity scores) was used as the final staining score (a minimum value of 0 and a maximum of 300).
Cell proliferation assay
The cell proliferation was monitored using a Cell Counting Kit-8 (CCK-8; KeyGen Biotech. Co., Ltd). After transfection, cells were plated in 96-well plates at a density of 2000 cells in 100 µL per well and the absorbance was measured at 450 nm with an ELx-800 Universal Microplate Reader. Experiments were repeated at least three times with similar data.
For colony formation assay, a total of 100 transfected cells were placed in a fresh six-well plate and maintained in media containing 10% FBS, replacing medium every 3 or 4 days. After 2 weeks, cells were fixed with 4% paraformaldehyde and stained with 0.1% crystal violet. Visible colonies were then counted. For each treatment group, each well was assessed in triplicate.
Flow-cytometry analysis
Flow-cytometry analysis was performed to detect cell-cycle distribution and cell apoptosis. For cell-cycle distribution, cells were transferred and fixed in centrifuge tubes containing 4.5 mL of 70% ethanol on ice. The cells were kept in ethanol for at least 2 h at 4°C. Then, the ethanol-suspended cells were centrifuged for 5 min at 300g. Cell pellets were re-suspended in 5 mL of phosphate-buffered saline (PBS) for approximately 30 s and centrifuged at 300g for 5 min and then re-suspended in 1 mL of propidium iodide (PI) staining solution and kept in the dark at 37°C for 10 min. Samples were analyzed using a FACSCalibur flow cytometer. The percentage of the cells in G0/G1, S, and G2/M phases were counted and compared.
For apoptosis analysis, cells were washed and re-suspended at a concentration of 1 × 10⁶ cells/mL. Then, an Annexin V-FITC Apoptosis Detection Kit (BD Biosciences) was used following the manufacturer’s protocol. After incubation at room temperature in the dark for 20 min, the cells were immediately analyzed by a FACScan flow cytometer (Becton Dickinson). All samples were assayed in triplicate.
Xenograft experiment
All animal studies were conducted in accordance with NIH animal use guidelines and protocols approved by Nanjing Medical University Animal Care Committee. Six female nude mice (aged 4–6 weeks) were purchased from Nanjing Medical University School of Medicine’s accredited animal facility. Briefly, 1.0 × 10⁶ exponentially growing TPC-1 cells transfected with shRNA-CDC45 or shRNA-NC were injected in axilla subcutaneously. Tumor volume was estimated using calipers every week as length × width2 × 0.5. Mice were sacrificed 5 weeks after injection, and tumor weights were measured and tumors were collected for further analysis.
Statistical analysis
All statistical analyses were performed using SPSS Statistics (version 20.0) and GraphPad Prism 6 software (GraphPad Software, Inc.). The results were presented as mean ± SD. Relative quantification of mRNA expression level was calculated with the 2−ΔΔCt method. Student’s t-test was used to analyze difference between two groups. Association of CDC45 expression with other mRNAs was analyzed using Pearson correlation test. Association of CDC45 expression with clinicopathological parameters was analyzed using chi-squared test; p < 0.05 was considered statistically significant.
Results
CDC45 is widely upregulated in PTC and correlates with more aggressive clinicopathological characteristics
By analyzing TCGA_THCA_exp_HiSeqV2-2015-02-24 dataset, compared with normal tissues, we found that CDC45 expression was significantly increased (up to 1.74-fold; p < 0.0001) in PTC tissues (Figure 1(a)). Moreover, CDC45 was positively correlated with that of Ki-67 (r = 0.5371, p < 0.0001), a cell proliferation marker, in the 505 PTC tissues in dataset (Figure 1(b)).

CDC45 is upregulated in PTC tissues and correlates with more aggressive clinical characteristics. (a) CDC45 is upregulated in PTC tissues compared with adjacent normal tissues in TCGA dataset. (b) CDC45 was found to be positively correlated with Ki-67 (r = 0.5371, p < 0.0001) in TCGA dataset. (c) qRT-PCR showed CDC45 was upregulated in 92.2% (59 of 64) PTC tissues. (d and e) Relative fold change of CDC45 in different tumor T stages and TNM stages (*p < 0.05, **p < 0.01, ***p < 0.001, and #no significance).
The expression profile of CDC45 was then further validated by qRT-PCR in 64 paired PTC patients’ tissues (tumor and adjacent normal tissues). As shown in Figure 1(c), CDC45 mRNA was elevated in 92.2% (59 out of 64) of PTC patients.
To study whether CDC45 expression was associated with clinicopathological features (including age, gender, primary tumor size, lymph node status, TNM stage, tumor location, and focus type), first, patients were divided into two groups: low-CDC45 and high-CDC45 groups, according to the median level of CDC45 expression. We found that high-CDC45 level was significantly associated with bigger tumor size (p = 0.0004) and advanced TNM stage (p = 0.0166; Table 2). As shown in Figure 1(d) and (e), Student’s t-test also exhibited similar results. However, no significant association was observed between CDC45 expression with age, gender, lymph node status, tumor location, or focus type. Second, IHC was then performed to evaluate the protein expression of CDC45 in PTC tissues and corresponding normal tissues. The result showed that the score of CDC45 staining was significantly increased in PTC tissues (204.1 ± 5.917) compared with adjacent normal tissues (92.97 ± 6.504; Figure 2(b)). Consistent with mRNA results as mentioned above, the score of CDC45 staining was also significantly increased along with more advanced T stage in PTC tissues (Figure 2(a) and (c)).
Correlation between CDC45 expression and clinical characteristics (n = 64).
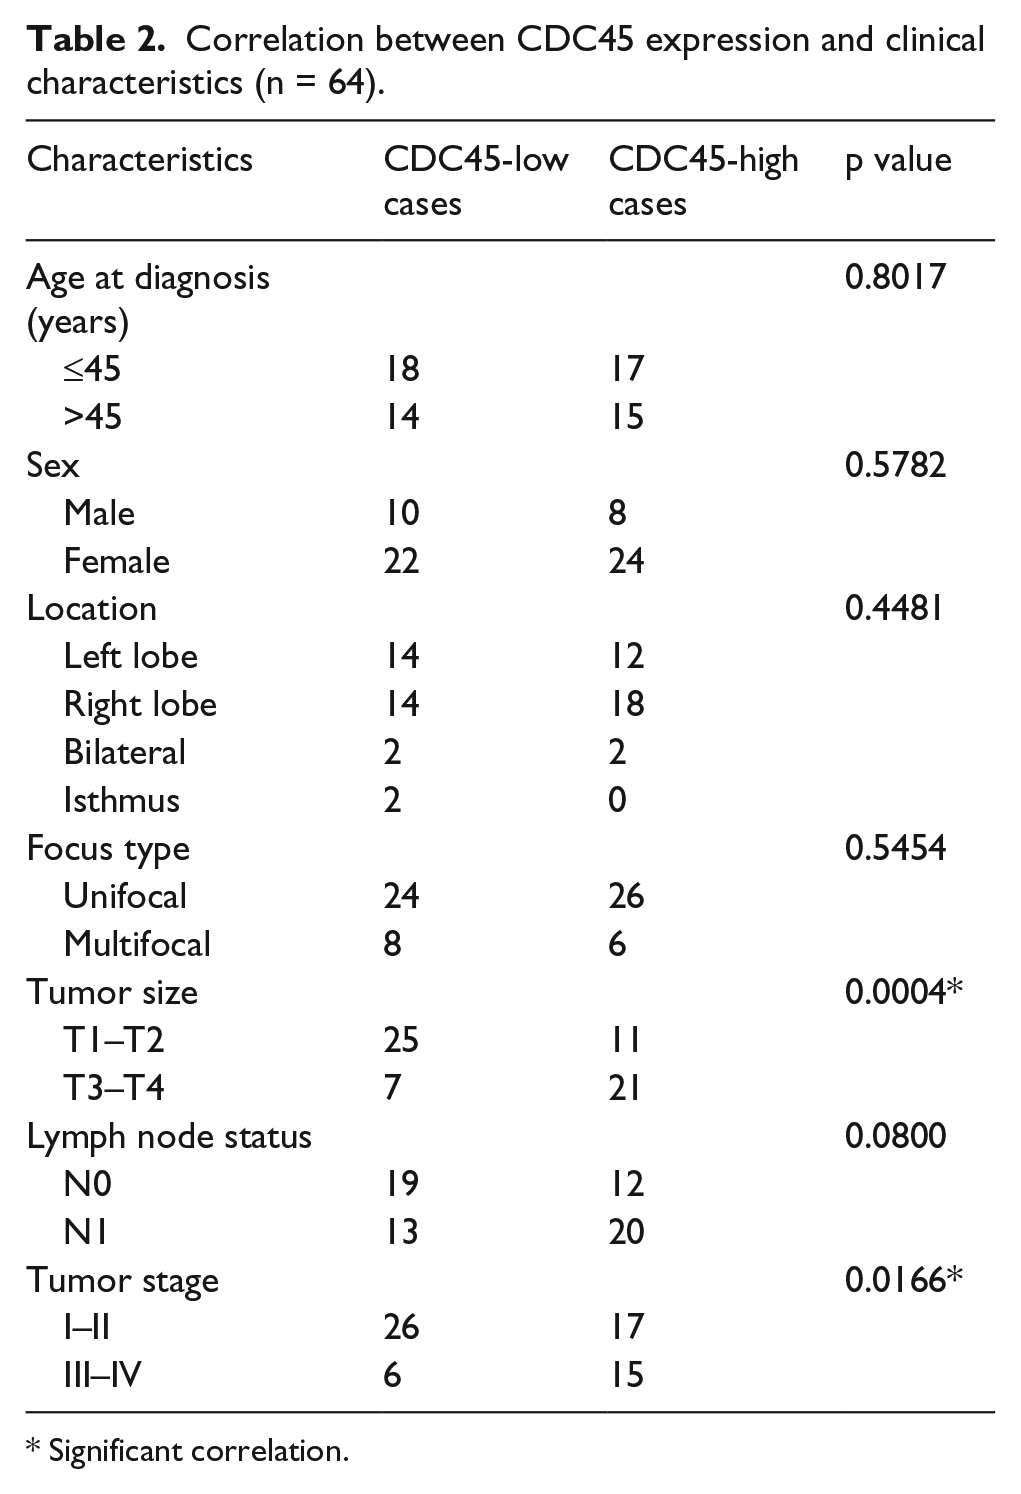
Significant correlation.
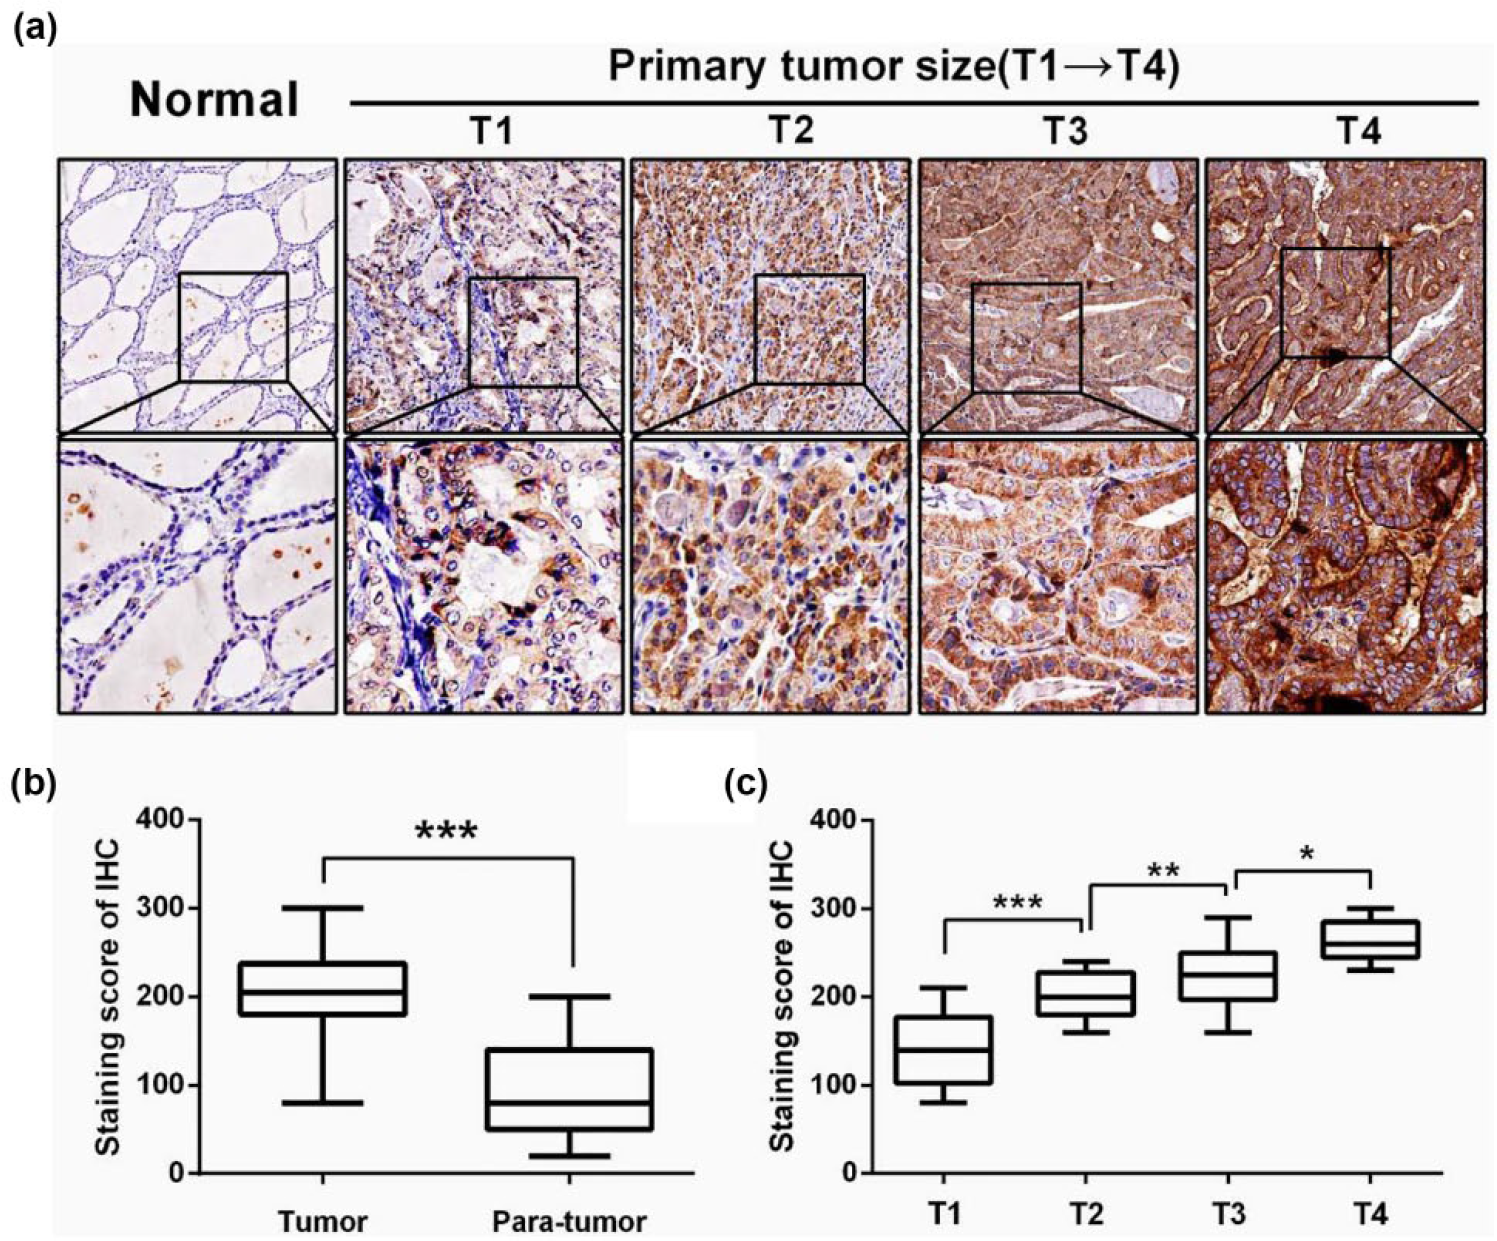
IHC staining of CDC45 in PTC and adjacent normal tissues. (a) IHC staining of CDC45 in PTC and adjacent normal tissues. (b) The score of CDC45 staining was significantly increased in PTC tissues (204.1 ± 5.917) compared with adjacent normal tissues (92.97 ± 6.504). (c) The score of CDC45 staining was significantly increased along with more advanced T stage in PTC tissues (*p < 0.05, **p < 0.01, and ***p < 0.001).
Knockdown of CDC45 inhibits PTC cells proliferation via inducing G1-phase arrest and apoptosis in vitro
To investigate the biological function of CDC45 in vitro, BCPAP and TPC-1 cell lines were chosen as appropriate cellular models for further investigation. By two different effective siRNAs used to knockdown CDC45, we found that knockdown of CDC45 markedly inhibited proliferation of both BCPAP and TPC-1 cells by CCK-8 assay (Figure 3(a)). Moreover, si-CDC45 transfected group had significantly fewer colonies than si-NC group (Figure 3(b)).
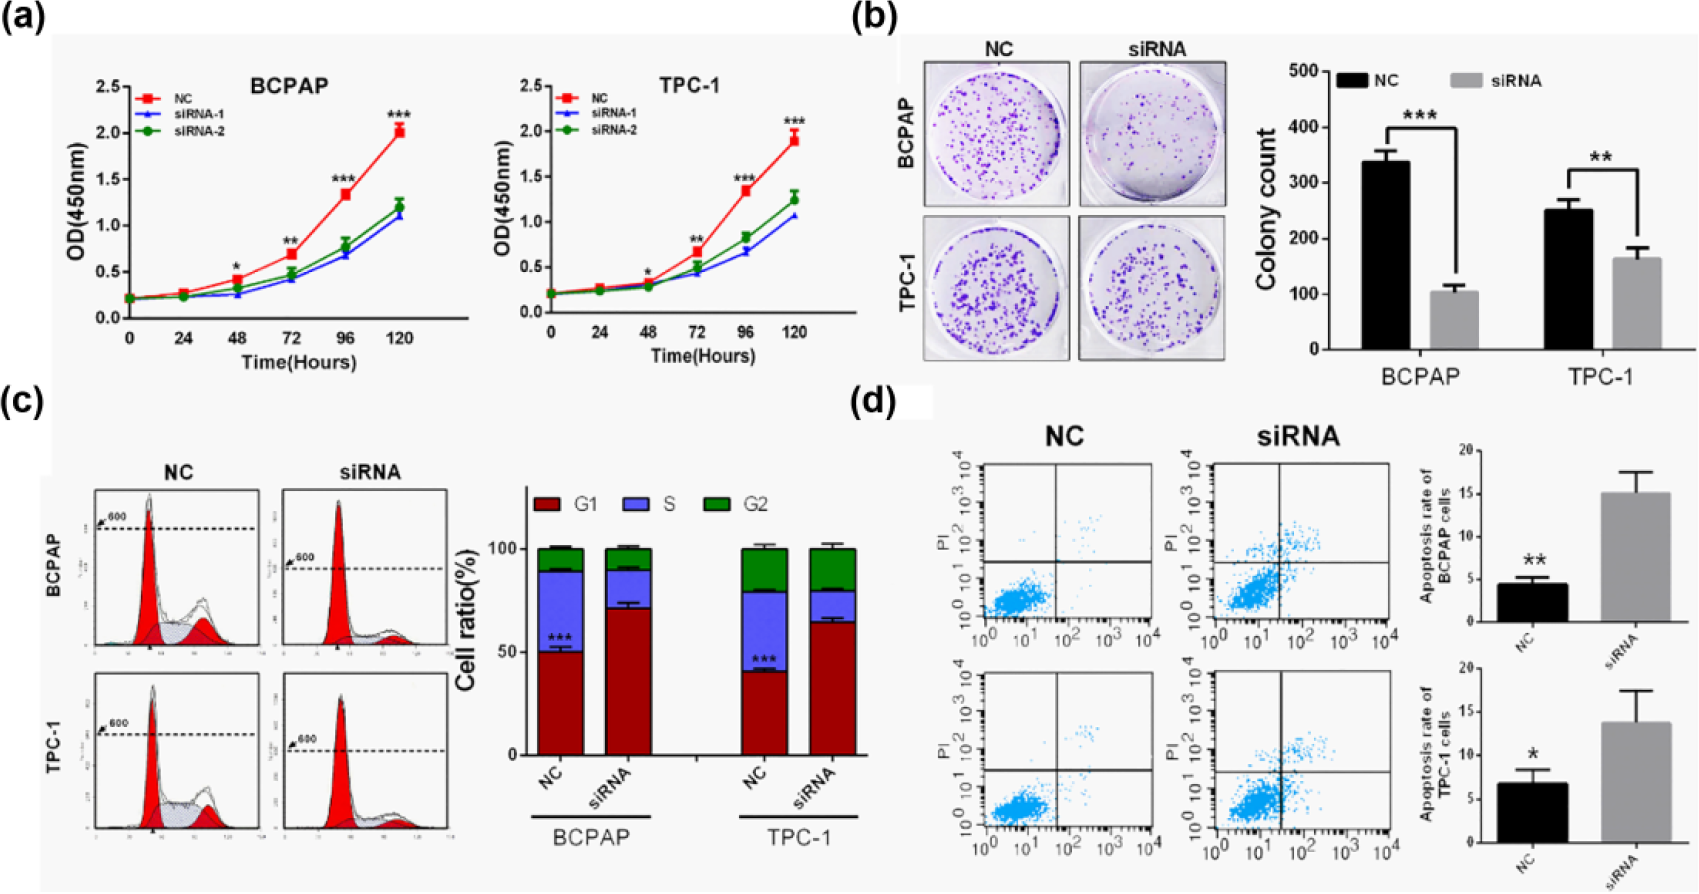
Knockdown of CDC45 inhibited PTC cells proliferation via G1-phase arrest and apoptosis in vitro. (a) Knockdown of CDC45 inhibited both BCPAP and TPC-1 cell proliferation. (b) Colony numbers of BCPAP and TPC-1 cells transfected with si-CDC45 were less than those transfected with si-NC. (c) BCPAP and TPC-1 cells transfected with siRNA-CDC45 exhibited more arrest at G1 phase than those transfected with si-NC. (d) Knockdown of CDC45 induced apoptosis of both BCPAP and TPC-1 cells after 48 h transfection (*p < 0.05, **p < 0.01, and ***p < 0.001).
Finally, the effects of CDC45 on cell-cycle distribution and apoptosis were assessed by flow cytometry analysis. As shown in Figure 3(c), siRNA-CDC45 treatment significantly increased the percentage of BCPAP and TPC-1 cells in G1 phase compared to siRNA-NC group. Furthermore, knockdown of CDC45 also induced apoptosis of both BCPAP and TPC-1 cells after 48 h of transfection (p < 0.05; Figure 3(d)).
Silence of CDC45 suppresses tumor growth in vivo
To assess the oncogenic role of CDC45 in vivo, we established xenograft tumor models using TPC-1 cells transfected with shRNA-NC or shRNA-CDC45. All nude mice developed xenograft tumors at injection sites, and xenograft tumors were harvested 5 weeks after injection (Figure 4(a) and (b)). As shown in Figure 4(c) and (d), average volume and weight of tumors in the shRNA-CDC45 group were significantly lower than those in the shRNA-NC group. IHC analysis revealed that tumors derived from shRNA-CDC45-transfected cells showed weaker staining of Ki-67 than those in NC group (Figure 4(e)).

Knockdown of CDC45 inhibited tumor growth in vivo. (a and b) Xenograft tumor models using TPC-1 cells transfected with shRNA-NC or shRNA-CDC45. (c and d) Tumor nodules derived from CDC45 knockdown (KD) TPC-1 cells are significantly smaller than those in NC group. (e) Immunohistochemistry showed that Ki-67 staining was weaker in CDC45-KD group (*p < 0.05, **p < 0.01, and ***p < 0.001).
CDC45 exerts its oncogenic activity via upregulation of some certain cyclins (CCND1, CCNE1, and CCNE2)
As mentioned in section “Materials and methods,” a list of 148 genes which have highest correlation values with CDC45 in PTC were picked out from TCGA dataset. Then, we used GO and KEGG enrichment analysis on the 148 genes. As shown in Figure 5(a) and (b), results of the two analyses were similar. Most of the genes were enriched in the cell-cycle pathway. Considering knockdown of CDC45 induces G1-phase arrest, we determined expression levels of the some G1-phase or G1-/S-transition regulators, including CCND1, CCCNE1, CCNE2, p21, and p27, using qRT-PCR and western blot in shRNA-NC- and shRNA-CDC45-treated TPC-1 cells. When compared with shRNA-NC transfected cells, both mRNA and protein expression levels of CCND1, CCNE1, and CCNE2 were significantly decreased in shRNA-CDC45-transfected cells, while p21 or p27 was not altered (Figure 5(c) and (d)). Then, we performed correlation analysis on CDC45 with the three cyclins in TCGA thyroid cancer dataset. Pearson correlation test revealed that all the three cyclins’ expression were positively correlated with CDC45 (Figure 5(e)–(g)).

Knockdown of CDC45 influences G1-/S-related cyclin expression. (a and b) Genes co-expressed with CDC45 are mostly enriched in the cell-cycle pathway using GO and KEGG enrichment analysis. (c and d) Both mRNA and protein expression levels of CCND1, CCNE1, and CCNE2 decreased after transfection of si-CDC45, while p21 or p27 expression was not altered. (e, f, and g) Pearson test in TCGA database showed that CDC45 positively correlated with CCND1, CCNE1, and CCNE2 in PTC tissues (*p < 0.001 and #no significance).
Discussion
CDC45 was first identified as a polypeptide of 650 amino acids in the budding yeast by Hopwood and Dalton 17 It assembles into a complex with minichromosome maintenance (MCM) family genes for initiation of chromosomal DNA replication.5,7,18,19 By mutational analysis, Simon et al. 6 validated the mechanism of CDC45 association with MCM ring and GINS co-activator which are critical for CMG assembly. All these studies indicated that CDC45 plays a critical role in DNA replication. DNA replication, a key step in cell cycle, must be tightly regulated to ensure that genome is accurately duplicated. Aberrant DNA replication leads to genomic instability and cancer,20,21 and some researchers believe that DNA replication stress is a hallmark of cancer, and it may open up new possibilities for cancer diagnostics and treatment.22,23
In addition to previous studies that reported CDC45 upregulation in some cancer-derived cell lines, 10 we first present evidence that CDC45 overexpression widely occurs in PTC and significantly correlates with greater tumor size and more advanced TNM stage in both mRNA and protein levels. Consistent with these clinical findings, experiments on PTC cell lines showed that suppression of CDC45 significantly inhibited cell proliferation by inducing G1-phase arrest and apoptosis.
Considering that Gerhardt et al. 8 reported CDC45 is recruited at G1/S transition for initial DNA replication, combined with siRNA-CDC45-induced G1 arrest, we therefore hypothesized that CDC45 might also promote cell-cycle progression by inducing G1/S transition. We therefore measured several G1-/S-transition-related genes to explore the potential mechanism. We found that CCND1, CCNE1, and CCNE2 expressions were significantly decreased by siRNA-mediated CDC45 knockdown, which was consistent with the result of Pearson correlation test on CDC45 with these cyclins (p < 0.0001). Xenograft assay also showed that depletion of CDC45 suppressed tumor growth. Cell-cycle alteration is one of the hallmarks of cancer.24,25 CCND1, CCNE1, and CCNE2 are key G1-/S-transition-related genes, and limiting the supply of these cyclins enforces the existence of G1 phase. 26
In conclusion, our study demonstrates that CDC45 is upregulated in PTC and correlated with more advanced tumor stage. CDC45 promotes PTC cells proliferation in vitro and tumor growth in vivo. Moreover, CDC45 knockdown inhibits cell-cycle progression partly via downregulating some certain cyclins and inducing apoptosis. These suggest that CDC45 plays an oncogenic role in PTC, and CDC45 may serve as a potential therapeutic target and a novel prognostic biomarker in PTC patients.
Footnotes
Acknowledgements
The authors would like to thank Chuan Su (Director of Key Laboratory of Pathogen Biology of Jiangsu, Nanjing Medical University) for technical guidance and Xiaoping Zhou (Director of Information Center, W&C Branch Hospital of Jiangsu Province Hospital) for statistics guidance. J.S. and R.S. contributed equally to this work.
Declaration of conflicting interests
The author(s) declared no potential conflicts of interest with respect to the research, authorship, and/or publication of this article.
Funding
The author(s) disclosed receipt of the following financial support for the research, authorship, and/or publication of this article: This study was supported by the Jiangsu Provincial Research Foundation for Basic Research (No. BK20131441).
References
Supplementary Material
Please find the following supplemental material available below.
For Open Access articles published under a Creative Commons License, all supplemental material carries the same license as the article it is associated with.
For non-Open Access articles published, all supplemental material carries a non-exclusive license, and permission requests for re-use of supplemental material or any part of supplemental material shall be sent directly to the copyright owner as specified in the copyright notice associated with the article.