
Abstract
In recent years, abnormal RNA editing has been shown to play an important role in the development of esophageal squamous cell carcinoma, as such abnormal editing is catalyzed by ADAR (adenosine deaminases acting on RNA). However, the regulatory mechanism of ADAR1 in esophageal squamous cell carcinomas remains largely unknown. In this study, we investigated ADAR1 expression and its association with RNA editing in esophageal squamous cell carcinomas. RNA sequencing applied to esophageal squamous cell carcinoma clinical samples showed that ADAR1 expression was correlated with the expression of STAT1, STAT2, and IRF9. In vitro experiments showed that the abundance of ADAR1 protein was associated with the induced activation of the JAK/STAT pathway by type I interferon. RNA sequencing results showed that treatment with type I interferon caused an increase in the number and degree of RNA editing in esophageal squamous cell carcinoma cell lines. In conclusion, the activation of the JAK/STAT pathway is a regulatory mechanism of ADAR1 expression and causes abnormal RNA editing profile in esophageal squamous cell carcinoma. This mechanism may serve as a new target for esophageal squamous cell carcinoma therapy.
Introduction
The incidence of esophageal cancer ranks eighth among cancers worldwide. 1 A total of 80%–85% of esophageal cancer cases occur in developing countries, including China. The majority of esophageal cancer cases in China are esophageal squamous cell carcinoma (ESCC), 2 and it has a remarkable geographic distribution. 3 Previous studies indicated that ethnic and genetic factors as well as lifestyle play roles in ESCC development. The incidence of esophageal cancer is threefold higher in men than in women. 4 From a molecular oncology perspective, more than 83% of ESCCs contained a somatic mutation in TP53. 5 Over-expression of epidermal growth factor receptor (EGFR) occurs in 59.6%–76% of ESCCs and is associated with a poor prognosis.6,7 In addition, the purported risk factors for ESCC include a low consumption of fruits and vegetables; deficiency of selenium, zinc, and vitamin E; high level of exposure to areca nuts or polycystic aromatic hydrocarbons; and poor oral hygiene.8,9 The prognosis and 5-year overall survival of patients with ESCC remain very poor. 10 The above reports suggest that the progression of ESCC is complex. Therefore, identifying additional molecular mechanisms involved in ESCC is of utmost importance.
The family of adenosine deaminases acting on RNA (ADAR), including ADAR1, ADAR2, and ADAR3, is characterized by the high conservation of the C-terminal region, which functions in deaminase catalysis, and an N-terminal region that can combine with dsRNA. 11 ADAR1 and ADAR2 have the capacity to catalyze RNA editing, while previous reports suggest that ADAR3 cannot.12–14 RNA editing is discovered by a common post-transcriptional modification to change the sequence of nucleotides that generated various proteins.15,16 In recent years, several papers revealed that RNA editing appears to be specific to cell types or cell environments. Both hyper- and hypo-editing of coding regions can contribute to human diseases, including a variety of cancers.17,18 For example, hyper-editing of antizyme inhibitor 1 (AZIN1), which inhibits cell growth by facilitating the degradation of cell cycle regulatory proteins, could promote tumor progression in hepatocellular carcinoma (HCC) and ESCC.19,20 Also in primary ESCC, hyper-edited filamin B (FLNB) contributes to abnormal cell proliferation.20,21 Similarly, hyper-editing of CDK13, which is associated with the cell cycle, 22 was detected in breast cancer. 23 However, previous studies focused on the function of specific RNA editing sites. In this study, we changed the focus from specific RNA editing sites to the regulatory mechanism of ADAR1. It has been reported that ADAR1 is regulated by interferon (IFN)-related pathways in breast cancer 23 and mouse cell lines, 24 while the regulatory mechanism of ADAR1 in ESCC remains unclear.
Here, we performed integrated experiments to detect the relationships between ADAR1 expression and JAK/STAT pathway-related genes, including STAT1, STAT2, and IRF9, that are activated through type I IFN and found that type I IFN generated abnormal RNA editing.
Materials and methods
Cell lines and clinical samples
Seven Japanese ESCC cell lines (KYSE30, KYSE70, KYSE150, KYSE180, KYSE410, KYSE450, and KYSE510) were cultivated in 50% RPMI 1640 medium (HyClone, Logan, UT, USA) and 50% F12 medium (HyClone), mixed with 10% fetal bovine serum (Gibco, New York, NY, USA), 100 IU/mL penicillin and 100 IU/mL streptomycin (HyClone). HET-1a, a cell line derived from normal esophageal squamous epithelium cells, was maintained in BEGM (Bronchial Epithelial Cell Growth Medium) with several growth factors (Lonza, Basel, Switzerland) added. All cell lines were confirmed by short tandem repeat (STR), and mycoplasma contamination was monitored.
A total of 15 paired primary ESCC tumor tissues and their matched non-tumor tissues were obtained from the Cancer Institute and Hospital of the Chinese Academy of Medical Science between 2007 and 2008 for DNA and RNA extraction (Table S1). All clinical samples used in this study were approved by the medical ethics committee of the National Cancer Center/Cancer Hospital.
IFN and inhibitor treatment
Human ESCC cell lines seeded in six-well plates were treated with the following doses of IFN: 1000 U/mL of Recombinant Human IFN-alpha A/D (BglII), IFN-α (cat# 11200-1; R&D Systems, Minneapolis, MN, USA) or 1000 U/mL of Recombinant Human IFN-beta 1a, IFN-β (cat# 11415-1; R&D Systems). Cell lines were treated for 24 h (1 day), 48 h (2 days), and 96 h (4 days) after seeding; untreated cells were used as controls.
Cells seeded in six-well plates were treated with S-ruxolitinib, inhibiting JAK1 expression (Selleckchem, Houston USA), as well as s31-201, inhibiting STAT3 expression (Selleckchem, Houston, USA). After being treated with inhibitors for 24 h, cells were mixed with IFN for culture.
DNA and RNA preparation
DNA from tumor and matched normal fresh-frozen tissues as well as from cell lines was isolated using the Qiagen QIAamp DNA Mini Kit (Qiagen, Venlo, Netherlands). The total RNA was isolated from cultured cell lines or clinical samples using TRIzol reagent (Invitrogen, Carlsbad, CA, USA), and the complementary DNA (cDNA) was prepared with a Fermentas RevertAid™ Premium First Strand cDNA Synthesis Kit (Thermo, Rockford, IL, USA) according to the manufacturer’s protocol.
Quantitative real-time polymerase chain reaction
Quantification of ADAR1 transcripts relative to GAPDH (glyceraldehyde 3-phosphate dehydrogenase) was performed in triplicate using SYBR Green PCR Master Mix and Applied Biosystems 7900 RT-PCR System (Applied Biosystems, Foster City, CA, USA) following the manufacturer’s instructions. The following primer-pairs were used:
ADAR1 forward 5′-ACAGCCAAAGACACTCCCTCTC-3′
ADAR1 reverse 5′-GGCTCAGCATGGCTATCTGG-3′
GAPDH forward 5′-CCTGGTATGACAACGAATTTG-3′
GAPDH reverse 5′-CAGTGAGGGTCTCTCTCTTCC-3′
Western blot analysis
The cultured cell lines with and without IFN treatment were lysed by radioimmunoprecipitation assay (RIPA) buffer mixed with protease and phosphatase inhibitor mixtures (Thermo). Equal amounts of proteins were separated by 10% sodium dodecyl sulfate–polyacrylamide gel electrophoresis (SDS-PAGE) electrophoresis, transferred to nitrocellulose filter membranes (Whatman GmbH, Maidstone, Kent, UK) and blocked with Tris-buffered saline (TBS) buffer containing 5% nonfat milk for 1 h at room temperature. The membranes were incubated overnight at 4°C with primary antibodies and then washed with Tris-buffered saline with Tween 20 (TBST) buffer with three times. After washing, the membranes were incubated with horseradish peroxidase (HRP)-conjugated secondary antibodies for 1 h at room temperature and then washed in TBST buffer three times. The protein bands were detected using enhanced chemical luminescence (Millipore, Billerica, MA, USA), and the immunoblots were quantified using ImageJ software. The following antibodies were used: mouse anti-ADAR1 antibody (1:480, ab88574; Abcam), mouse anti-β-actin antibody (1:2000, ab8227; Abcam), rabbit anti-STAT1 antibody (1:1000, CST, #14994), anti-P-STAT1 antibody (1:1000, CST, #7649), anti-STAT2 antibody (1:1000, CST, #72604), and anti-P-STAT2 antibody (1:1000, CST, #88410).
High-throughput sequencing
DNA exome sequencing of clinical samples was performed by BGI (Shenzhen, China), while DNA exome sequencing of cultured cell lines was performed by WuXi AppTec (Wuxi, China). RNA sequencing (RNA-seq) of clinical samples was completed by BGI, and RNA-seq of cultured cell lines with and without IFN treatment was completed by Novogene (Beijing, China).
RNA editing analysis
First, duplicate reads were removed using Picard MarkDuplicates based on BAM files generated from RNA-seq data alignment, as was done for the exome data. The preliminary list of SNPs in RNA was generated using SAMtools (version 0.1.19), and the DNA genotypes for those SNPs were determined. The putative RNA editing sites were obtained by comparing the DNA and RNA sequences. To reduce the false-positive sites, we selected RNA editing candidate sites using the following criteria: (1) the site was supported by more than 10 mapped reads in RNA-seq data, and those reads were not duplicative; (2) the RNA mutant genotype was supported by more than two unique sense and antisense strand mapped reads, separately; (3) at least 10% of the RNA mapped reads supported the mutant allele; and (4) the site was homozygous in the corresponding DNA data and supported by more than 10 uniquely mapped reads. In addition, we excluded all RNA variants detected at HLA genes empirically. If the fold change of editing degree between tumor and normal tissue was more than two, a given RNA editing site was defined as RNA overediting in ESCC tumors. In view of previous papers showing reduced accuracy of the identification of non-A→G and T→C RNA editing using transcriptome data because of mapping errors, only A→G and T→C editing sites were retained for the RNA editing analysis.
Statistical analysis
Statistical analysis was performed using GraphPad Prism 6.0 software. Data are presented as the mean ± standard error of the mean (SEM), which was obtained from triplicate experiments. Student’s t-test was used to estimate the significance of difference; p < 0.05 was considered significant.
Results
ADAR1 was significantly over-expressed and abnormal RNA editing sites were detected in primary ESCC tumors
First, we found ADAR1 was upregulated in 15 primary ESCC samples (p < 0.0001, paired Student’s t-test, two-tailed; Figure 1(a)) compared to their normal counterparts from same individuals. However, there was no significant difference in ADAR2 expression between ESCC tumors and matched adjacent non-tumor tissues (p = 0.6614, paired Student’s t-test, two-tailed; Figure 1(b)). We also analyzed ADAR1 transcripts in ESCC tumors and their matched adjacent non-tumor tissues by quantitative real-time PCR, and the results confirmed the over-expression of ADAR1 detected by RNA-seq (10/15 patients, over-expressed at least twofold; Figure 1(c)). It has been reported that the over-expression of ADAR1 is caused by the gain of ADAR1 DNA copy number. 20 We found that ADAR1 amplification was frequent in our samples (66.67%, fold change ≥1.5, n = 15), but ADAR1 expression was not correlated with DNA copy number in clinical ESCC samples (Spearman r = 0.08167, p = 0.7709, Spearman correlation, two-tailed; Figure 1(d)).

ADAR1 was significantly over-expressed and abnormal RNA editing sites were detected in primary ESCC tissues. (a) ADAR1 mRNA expression level in ESCC tumors and matched normal tissues by RNA-seq (n = 15). ****p < 0.0001, paired Student’s t-test. (b) ADAR2 mRNA expression level in ESCC tumors and matched normal tissues by RNA-seq (n = 15). (c) The fold change of ADAR1 expression between tumors and matched normal tissues comparing RNA-seq and quantitative real-time PCR. (d) The correlation between ADAR1 expression and DNA copy number in ESCC (n = 15). (e) The statistics and annotation of RNA editing sites. (f) Venn diagram shows RNA editing overlap occurred in tumor and normal samples from same patients.
Then, we analyzed A-to-I RNA editing by comparing DNA and RNA sequences from the ESCC tumor and normal samples. We observed 815 RNA editing events in 15 ESCC tumors, with a total of 1353 such events in all samples, including both tumor and normal RNAs. Of these, only a fraction of RNA editing sites occurred both in tumor and in normal tissue for a given patient (Figure 1(e)). Furthermore, 609 events could be classified as RNA hyper-editing in tumors when compared with RNA editing loci in matched normal tissues (Table S2; Figure 1(f)). Specific RNA editing sites, such as AZIN1 (chr8:103841636, 5/15 patients), FLNB (chr3:58141791, 8/15 patients), and CDK13 (chr7:39990344, 2/15 patients; chr7:39990548, 4/15 patients, Table S2), were hyper-edited in tumor tissues compared to matched normal tissues. These findings are consistent with a previous report. 20 However, we did not find the numbers of RNA editing or particular RNA editing sites in correlation with patients’ prognosis, which may due to the limited sample size of ESCC.
ADAR1 expression was correlated with the JAK/STAT pathway in ESCC
We aimed to determine how ADAR1 expression is regulated and its involvement in ESCC progression. The type I IFN pathway has been associated with ADAR1 expression in terms of the KEGG canonical pathway in previous reports.23,24 According to the KEGG canonical pathway, type I IFN can activate the JAK/STAT pathway. 25 Therefore, we analyzed the expression level of genes in the JAK/STAT pathway, STAT1, STAT2, and IRF9, to investigate their relationship with ADAR1 expression. We observed that the expression level of STAT1 (p < 0.0001, paired Student’s t-test, two-tailed; Figure 2(a)), STAT2 (p < 0.0001, paired Student’s t-test, two-tailed; Figure 2(a)), and IRF9 (p < 0.0001, paired Student’s t-test, two-tailed; Figure 2(a)) were upregulated in ESCC tumor tissues compared to their matched adjacent non-tumor tissues. Furthermore, the expression level of ADAR1 was correlated with STAT1 (Spearman r = 0.8456, p < 0.0001, Spearman correlation, two-tailed; Figure 2(b)), STAT2 (Spearman r = 0.9088, p < 0.0001, Spearman correlation, two-tailed; Figure 2(b)), and IRF9 (Spearman r = 0.8185, p < 0.0001, Spearman correlation, two-tailed; Figure 2(b)). These results showed that ADAR1 expression was correlated with the expression of genes involved in JAK/STAT pathway in ESCC tumor tissues.

The expression of ADAR1 was correlated with the expression of genes involved in the JAK/STAT pathway. (a) The expression of STAT1, STAT2, and IRF9 was upregulated in ESCC tumors when compared to matched normal tissues using RNA-seq. ****p < 0.0001, paired Student’s t-test. (b) The correlation between ADAR1 expression and the expression of genes involved in the JAK/STAT pathway by RNA-seq (n = 15). ****p < 0.0001, *p < 0.05, Spearman correlation.
Type I IFN regulated ADAR1 expression through the JAK/STAT pathway
Seven ESCC cell lines and one normal esophageal squamous epithelium cell line, named HET-1a, were treated with type I IFN-α or IFN-β to confirm the causality of ADAR1 expression induced through such molecule. The results of quantitative real-time PCR showed that ADAR1 mRNA expression level was increased in all cell lines that were cultured with type I IFN for 24, 48, and 96 h (Figure 3(a)). In addition, we used western blot to confirm the quantitative real-time PCR results and showed that the ADAR1 protein expression level was also upregulated in all cell lines that were treated with type I IFN for 24, 48, and 96 h (Figure 3(b)). Collectively, these evidences indicated that type I IFN could induce ADAR1 expression.
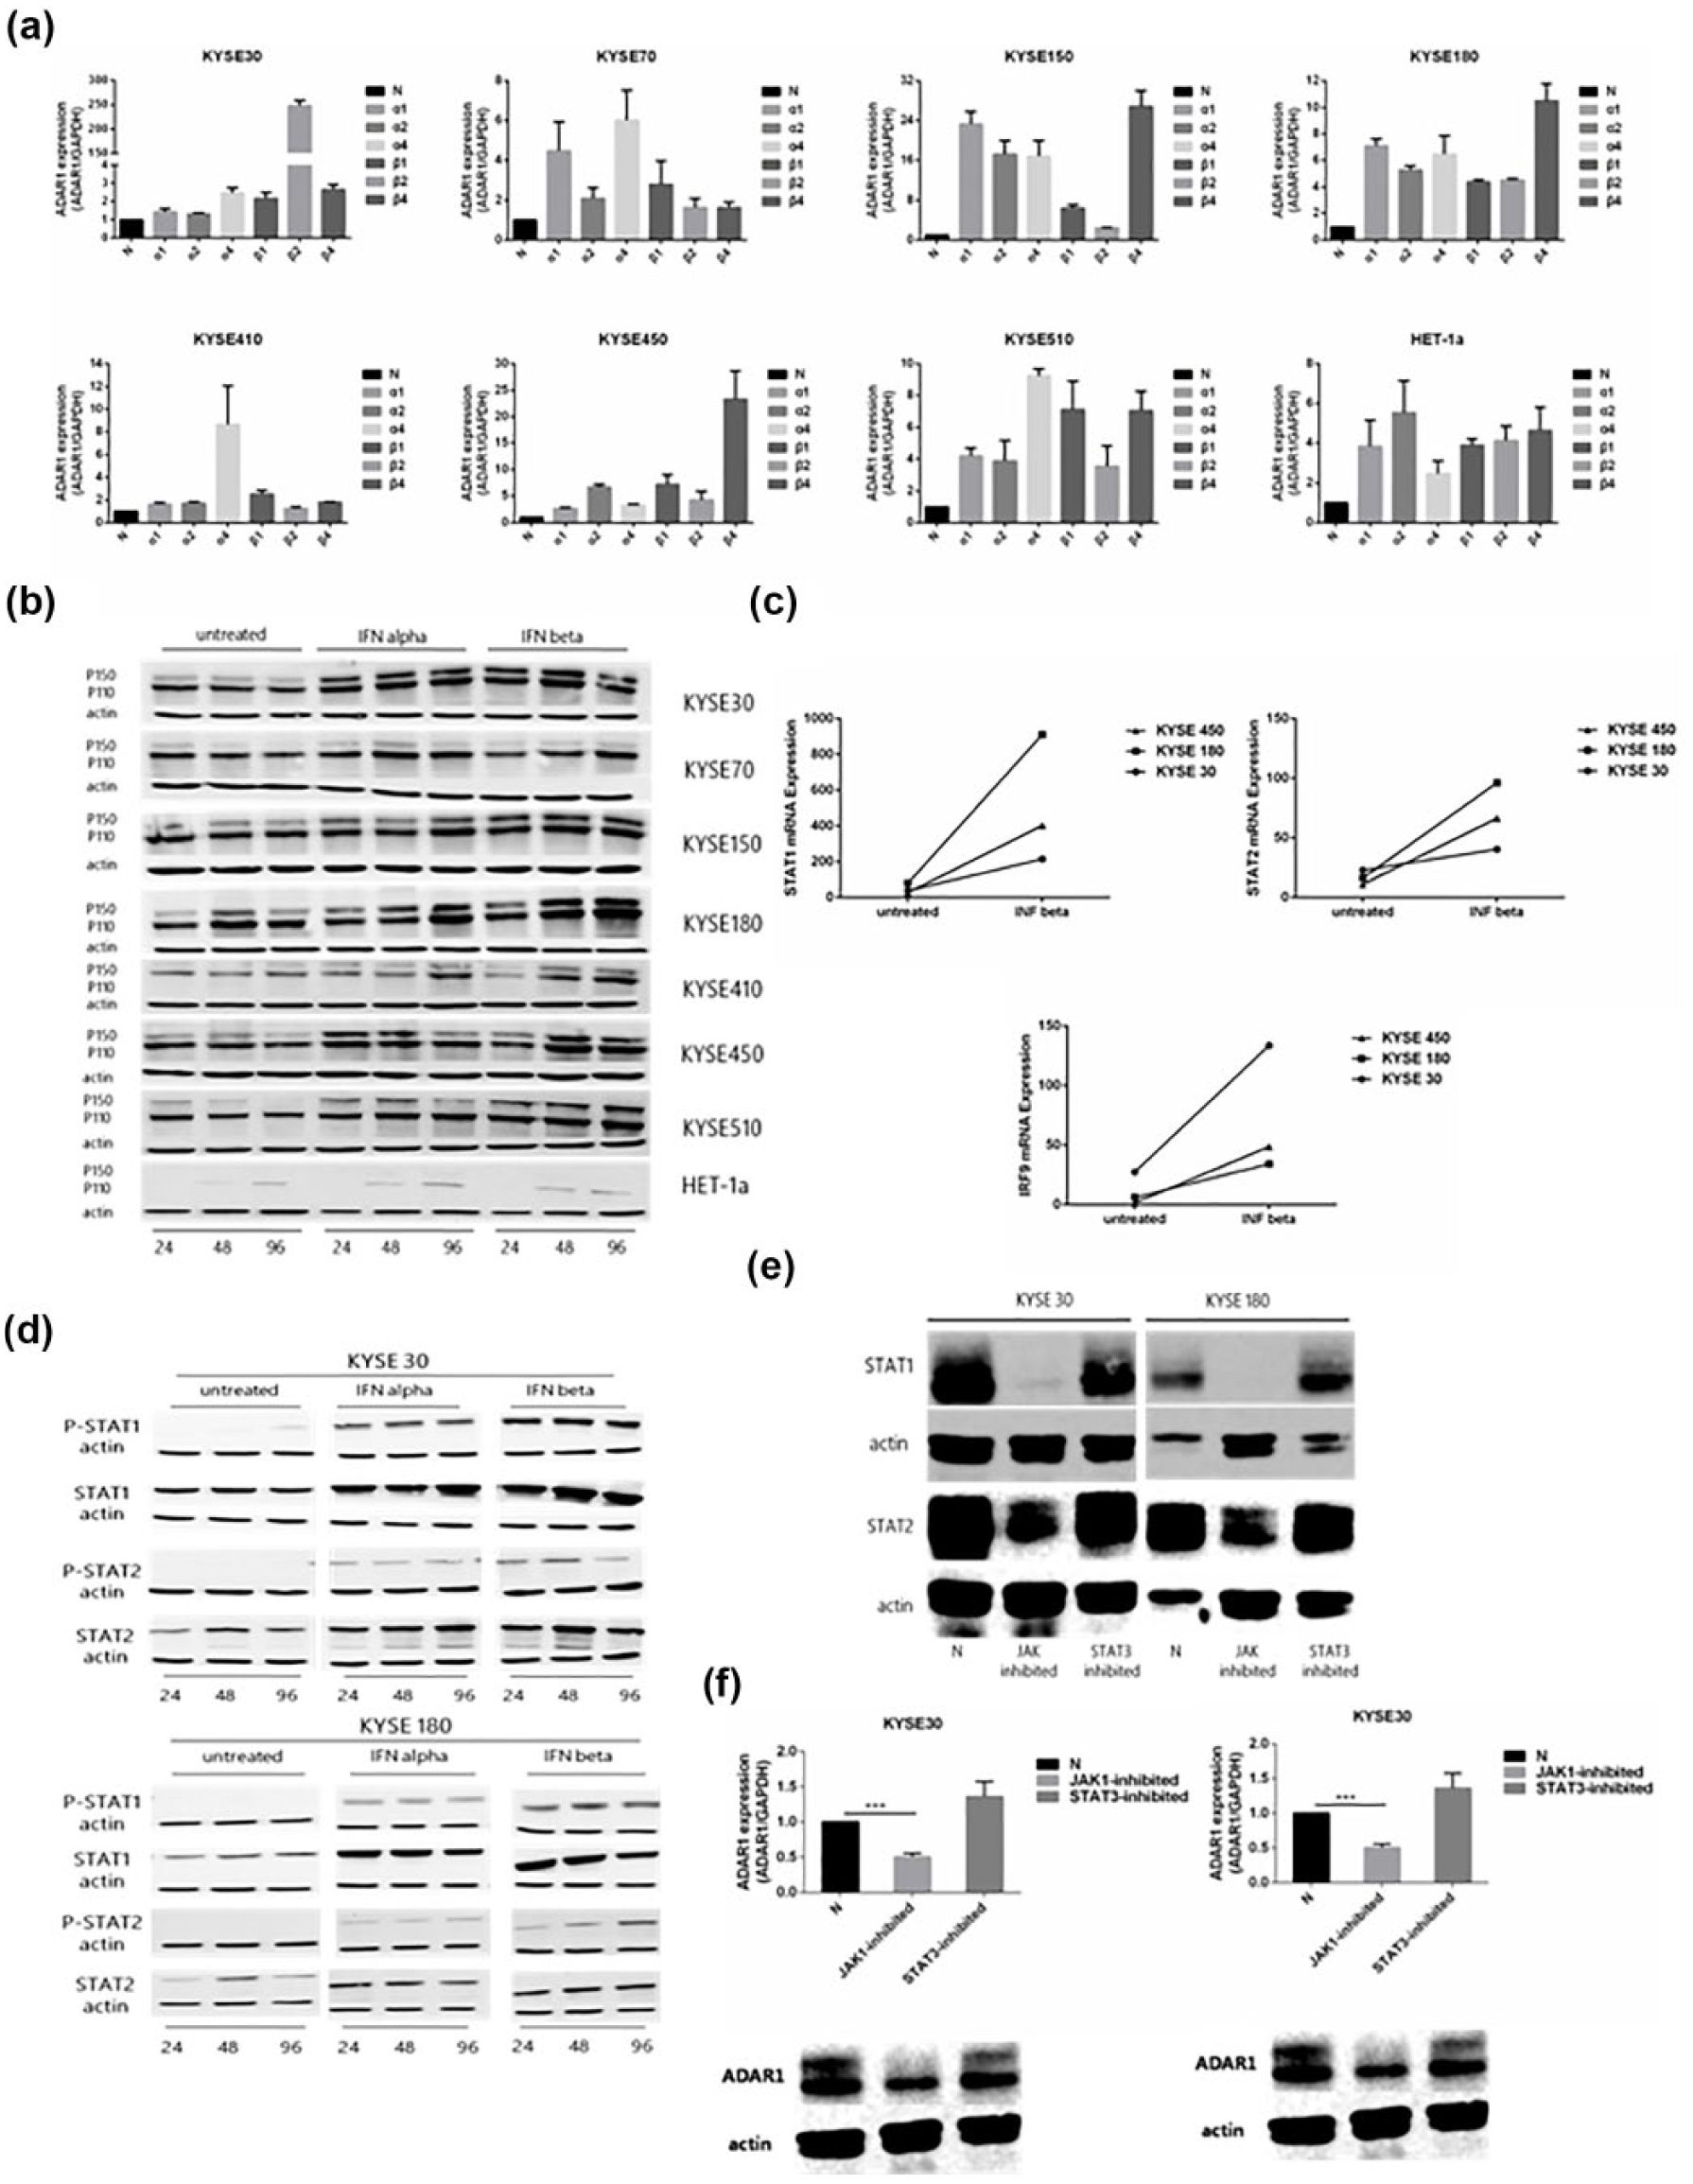
Type I interferon regulated ADAR1 expression through the JAK/STAT pathway. (a) ADAR1 mRNA expression in ESCC cell lines treated with interferon β when compared to control cells using quantitative real-time PCR. (b) ADAR1 expression tested for two protein subtypes, P110 and P150, in ESCC cell lines treated with interferon α or β, when compared to control cells. The x-axis indicates time (hours) of inhibitor treatment. (c) STAT1, STAT2, and IRF9 mRNA expression in ESCC cell lines treated with interferon β when compared to control cells using RNA-seq. (d) STAT1 and STAT2 protein expression in ESCC cell lines treated with interferon α or β, when compared to control cells. The x-axis indicates time (hours) of inhibitor treatment. (e) STAT1 and STAT2 protein expression in ESCC cell lines treated with S-ruxolitinib or s31-201, respectively. (f) ADAR1 expression in ESCC cell lines treated with S-ruxolitinib or s31-201, respectively, when compared to control cells through western blot and quantitative real-time PCR. 24: 24 h; 48: 48 h; and 96: 96 h; N: control cells; α1, α2, and α4: treated with interferon α for 1, 2, and 4 days, respectively; β1, β2, and β4: treated with interferon β for 1, 2, and 4 days, respectively.
However, how type I IFN regulates ADAR1 expression remains unclear. Therefore, we cultured ESCC cell lines with type I IFN for 72 h and sequenced their transcriptome. The RNA-seq analysis showed the mRNA expression levels of STAT1, STAT2, and IRF9 were upregulated under type I IFN treatment (Figure 3(c)). The protein of STAT1, STAT2, and the phosphorylation level was measured by western blot; increases in KYSE30 and KYSE180 were observed after treatment with type I IFN (Figure 3(d)). These data suggest that type I IFN–regulated ADAR1 expression may take advantage of JAK/STAT pathway. To further investigate this molecular path, we applied two small-molecule inhibitors, S-ruxolitinib and s31-201, to inhibit JAK1 and STAT3, respectively, and confirm the impact of JAK/STAT genes on ADAR1 expression. Treatment with S-ruxolitinib in KYSE30 and KYSE180, the expression levels of STAT1, STAT2, and their phosphorylated proteins were decreased in ESCC cells (Figure 3(e)), and the ADAR1 expression level was also suppressed (Figure 3(f)). In contrast, the expression levels of total STAT1, STAT2, and their phosphorylated proteins showed no difference among cells treated with s31-201 and control cells (Figure 3(e)); the ADAR1 expression level was also not affected as well (Figure 3(f)). These results collectively suggested that type I IFN regulates ADAR1 expression through JAK/STAT pathway in ESCC samples.
The JAK/STAT pathway induced A-to-I mRNA editing in ESCC cell lines through the upregulation of ADAR1 expression
The above evidence illustrated that type I IFN can affect ADAR1 expression through the JAK/STAT pathway. Next, we determined RNA editome using RNA-seq compared with IFN-β-treated and normal ESCC cells of KYSE30, KYSE180, and KYSE450. First, ADAR1 expression was upregulated in three ESCC cell lines (Figure 4(a)). Then, the number of A-to-I mRNA editing events was increased compared to that in control cells that were not treated with IFN-β (Figure 4(b)). As shown in Figure 4(b), we observed 335 RNA editing events in KYSE30 with IFN-β treatment, more than 208 editing events in control cells and 245 RNA editing events in KYSE180 with IFN-β treatment, compared to 197 editing events in control cells. Similarly, the 293 RNA editing events observed in KYSE450 with IFN-β treatment, compared to 224 editing events in control cells.

Type I interferon response affected A-to-I mRNA editing in ESCC through ADAR1 induction. (a) ADAR1 mRNA expression in ESCC cell lines treated with interferon β, compared with control cells. (b) The number of RNA editing sites in the ESCC cell lines treated with interferon β, compared with control cells. (c) The editing degree of selective RNA editing sites in the above paired-treated ESCC cell lines.
Finally, we analyzed the edited degree of specific A-to-I mRNA editing sites and found that type I IFN conferring an increasing level of those A-to-I editing sites in three ESCC cell lines: AZIN1 (chr8:103841636), FLNB (chr3:58141791), and CDK13 (chr7:39990548, Figure 4(c)). The mean editing degree in AZIN1, FLNB, and CDK13 was 21%, 24.3%, and 78.7%, respectively, in three ESCC cell lines treated with IFN-β. In the control cells, the mean editing degree of these three genes was 0%, 10%, and 70%, respectively. These data suggested that the JAK/STAT pathway affected A-to-I mRNA editing in ESCC cell lines through the upregulation of ADAR1 induction.
Discussion
The ADAR family includes three members: ADAR1, ADAR2, and ADAR3. ADAR1 and ADAR2 express in most human tissues, while ADAR3 was detected only in the brain. 26 ADAR1 and ADAR2 can catalyze RNA editing, but ADAR3 does not have such a function.12–14 Previous studies reported that all three ADAR enzymes were downregulated in glioblastoma, conferring a proliferation rate increase through the reduction of A-to-I RNA editing. 27 Nevertheless, Chan et al. 21 found that ADAR1 upregulation and ADAR2 downregulation resulted in a disturbance of A-to-I RNA editing, which participated in the progression of HCC. Moreover, the over-expression of ADAR1 was detected in non–small cell lung cancer 28 and breast cancer, 29 while the upregulation both of ADAR1 and ADAR2 was confirmed in prostate cancer. 30 In this study, we observed over-expression of ADAR1 in ESCC tissues compared to their matched non-tumor tissues, but no differences were observed in ADAR2 between ESCC tissues and their matched non-tumor tissues.
Previous reports revealed the relationship between ADAR1 expression and cancer, and the mechanisms for the regulation of ADAR1 also emerged. Qin et al. 20 reported that the increase in ADAR1 expression was due to the DNA copy number gain in ESCC, and Anadon et al. 28 observed the same phenomenon in non–small cell lung cancer. Meanwhile, several reports also have indicated that the level of ADAR1 was regulated by other factors in addition to DNA copy number. For example, ADAR1 was regulated by PTBP1 transcription factor through the internal ribosome entry site (IRES) in astrocytoma. 31 The expression of ADAR1 and ADAR2 was controlled by histone deacetylase (HDAC) and DNA methyltransferase (DNMT), respectively. 32 Another report found that inflammation factors, such as IFNs, lead to the upregulation of ADAR1 in breast cancer. 23 In addition, transcriptional activation of ADAR1 by IFN occurs in the absence of STAT1 by a non-canonical STAT2-dependent pathway in mouse. 24 Consistent with the previous findings, the correlation between ADAR1 expression and IFN was also detected in ESCC by in vitro experiment in this study.
Not only is the mechanism of ADAR1 regulation unclear, but the target genes of ADAR1 can also be highly complex. A-to-I RNA editing mediated by ADAR is the change of nucleotide sequence of RNA transcripts relative to that of the encoding DNA and can enhance the RNA and protein diversity. 33 A-to-I RNA editing has two types: special site editing and hyper-editing. 34 A type of A-to-I RNA editing was found to occur in the coding region, leading to a change in nucleotide sequence, 35 and affecting the progression of cancer. For example, the chloride channel GABRA3 is necessary and sufficient for invasion and metastasis of breast cancer. A-to-I editing on the GABRA3 transcript results in a single amino acid change in the α3 protein at the I/M site.36,37 In addition, editing of the hematopoietic cell tyrosine phosphatase PTPN6 transcript is linked to acute myeloid leukemia (AML), 38 but editing does not occur in the subgroup of AML with normal karyotype. 39 In this study, we analyzed A-to-I RNA editing sites in ESCC cell lines treated with type I IFN compared to control cells using RNA-seq and found both the number and the editing degree of A-to-I RNA editing sites were changed. We speculate that A-to-I RNA editing participates in ESCC progression by dysregulating the molecular network.
However, there are several questions that remain unanswered. We observed a correlation between ADAR1 expression and JAK/STAT pathway-related genes, but how STAT1 and STAT2 regulate ADAR1 activation is unclear. Modulation of editing at an individual site is entangled with many processes, and the mechanism of ADAR1 regulation could be very important. The widespread editing induced by ADAR1 in combination with the conservation of editing sites across tissues and patients suggests that there may be clinical and therapeutic implications for a wide range of cancer patients. Some RNA editing events may be served as “driver” mutations, and further efforts are required to characterize the function of clinical relevant RNA editing in ESCC.
Footnotes
Acknowledgements
We thank Fang Zhou for the careful work in collecting information on ESCC patients. We are also grateful to Meihua Xiong and all the staff in the Lab and Tumor Bank of the Department of Thoracic Surgery for their support during the study.
Compliance with ethical standards
Samples were obtained with informed consent, and the study was approved by the medical ethics committee of the National Cancer Center/Cancer Hospital.
Data deposition
The sequencing data supporting findings in this manuscript can be found in the European Genome-Phenome Archive (EGA) under accession EGAS00001001731.
Declaration of conflicting interests
The author(s) declared no potential conflicts of interest with respect to the research, authorship, and/or publication of this article.
Funding
The author(s) disclosed receipt of the following financial support for the research, authorship, and/or publication of this article: The work was supported by National Natural Science Foundation of China (81502514, 81402300), The National Key Basic Research Development Plan973 Plan (2015CB553901), and CAMS Innovation Fund for Medical Sciences (CIFMS) (2016-I2M-1-001)