
Abstract
PTOV1 has been demonstrated to play an extensive role in many types of cancers. This study takes the first step to clarify the potential relationship between esophageal squamous cell carcinoma and PTOV1 expression and highlight the link between PTOV1 and the tumorigenesis, progression, and prognosis of esophageal squamous cell carcinoma. PTOV1 expression was detected by quantitative reverse transcription polymerase chain reaction and western blotting or immunohistochemical staining in esophageal squamous cell carcinoma cell lines, esophageal squamous cell carcinoma tissues, and its paired adjacent non-cancerous tissues. Moreover, we have analyzed the relationship between PTOV1 expression and clinicopathological features of esophageal squamous cell carcinoma. Survival analysis and Cox regression analysis were used to assess its prognostic significance. We found that PTOV1 expression was significantly higher in the esophageal squamous cell carcinoma cell lines and tissues at messenger RNA level (p < 0.001) and protein level (p < 0.001). Gender, tumor size, or differentiation was tightly associated with the PTOV1 expression. Lymph node involvement (p < 0.001) and TNM stage (p < 0.001) promoted a high PTOV1 expression. A prognostic significance of PTOV1 was also found by Log-rank method, and the overexpression of PTOV1 was related to a shorter OS and DFS. Multiple Cox regression analysis indicated overexpressed PTOV1 as an independent indicator for adverse prognosis. In conclusion, this study takes the lead to demonstrate that the overexpressed PTOV1 plays a vital role in the tumorigenesis and progression of esophageal squamous cell carcinoma, and it is potentially a valuable prognostic predicator and new chemotherapeutic target for esophageal squamous cell carcinoma.
Introduction
The incidence of esophageal cancer ranks the eighth most common cancer worldwide, and the mortality rate ranks the sixth. 1 With an annual estimated 679,000 new cases and 498,000 related deaths, esophageal cancer is the second largest contributor to cancerous disease in China. 2 High-incidence region like northeastern to the Middle East China has been regarded as a major part of the “esophageal cancer belt.” Esophageal squamous cell carcinoma (ESCC) represents more than 90% of esophageal cancers. ESCC is often diagnosed at advanced stage, for the fact that ESCC tightly associates with extensive lymphatic spread and vascular invasion, and early symptoms are usually absent. Therefore, decreased survival rate always follows with the late diagnosis. On the basis of surgical treatment, adjuvant chemotherapy or neoadjuvant chemotherapy has been a promising strategy to improve the outcome of advanced ESCC. However, the reported response rate is still unsatisfactory because of the irreversible disease progression.3,4 Though the clinical staging system has been used to predicate long-term survival in ESCC, its value is limited. Therefore, it is vital to find a specific molecular marker for early diagnosis and targeted prevention.
Prostate tumor overexpressed 1 (PTOV1), a 46-kDa protein, was first identified in a differential screening for gene expression in prostate cancer. 5 Its gene was located on a region of chromosome 19 (19q13) that was associated with high risk of ESCC. 6 PTOV1 gene comprised 12 exons and encoded a protein with two congenetic tandemly arranged PTOV domains, each containing a nuclear localization signal. PTOV1 was an adaptor, conserved in vertebrates and arthropods, and interacted with a number of proteins both in the nucleus and cytoplasm. 7 As a proto-oncogene, PTOV1 has been suggested to be one of the genes frequently discerning between normal and carcinomatous tissues. In normal epithelial cells from different organs, PTOV1 was mostly undetectable or showed a weak staining.8–11 Its overexpression was not only associated with the occurrence and tumor grade of prostate cancer but also associated with laryngeal, pancreas, breast, liver, kidney, bladder, cerebral gliomas, colon, ovary, and squamous laryngeal cancerous tissues.10–17
A role for PTOV1 overexpression in cells’ proliferation has been implicated in many types of malignancy, owing to the synchronous increase of PTOV1 and Ki-67.5,7,14,15 Additional evidences were also supportive of a tumor promoter role for PTOV1 in cancers, including the induction of β-catenin nuclear translocation and the increase in β-catenin/TCF transcriptional activity.7,18 Moreover, PTOV1 has been demonstrated to promote cancer cell the ability of invasiveness and metastasis by upregulating the expression of c-Jun protein post-transcriptionally, which was a major transcriptional factor involved in various cellular events, including differentiation, proliferation, and apoptosis.19,20 Though PTOV1 has been implicated to be a potential serum biomarker for tumor early diagnosis, as well as a perfect predicator for long-term prognosis in multiplicate-type tumors,10–13,15 PTOV1 expression and its role in ESCC have not been explored.
In this study, we have detected PTOV1 expression by immunohistochemistry, western blotting, and quantitative reverse transcription polymerase chain reaction (qRT-PCR) on several esophageal cancer cell lines, ESCC tissues, and adjacent non-cancerous tissues (ANCTs), respectively; analyzed the relationship between PTOV1 expression and clinicopathological characters of ESCC; highlighted the link between PTOV1 overexpression and the tumorigenesis, progression, and prognosis of ESCC.
Materials and methods
Clinical samples and cell lines
In all, 120 patients enrolled in this study were from Thoracic Surgery of Xiangya Hospital, Central South University during January 2010 to September 2013, who were diagnosed with ESCC definitely by three pathologists. ESCC tissues and paired ANCTs (3–7 cm away from the tumor margin) were obtained, all specimens were stored at −80°C after immediate snap-frozen in liquid nitrogen for RNA and total protein extraction. All patients were younger than 75 years of age and diagnosed first, and those would be excluded if there was history of previous malignancies, chemotherapy, radiotherapy or other adjuvant therapy before sampled. The clinical and pathological information were complete and reliable. The tumor–node–metastasis (TNM) stage was classified according to American Joint Committee on Cancer (AJCC, 7th edition). 21 All the personal information was concealed to ensure the privacy. The design and methods of this study were in accordance with the requirements of related regulations and procedures. The Institutional Review Board (IRB) of Xiangya Hospital, Central South University has approved the research to be conducted. All authors had access to information that could identify individual participants during or after data collection.
Human ESCC cell lines (TE-1, EC109, and EC9706) were obtained from Chinese Academy of Sciences cell bank (China). A normal human esophageal epithelial cell line (HEEpic) was purchased from the American Type Culture Collection.
Real time PCR
Total RNA was extracted from cells or tissues using TRIzol (Invitrogen, USA) according to the manufacturers’ protocol. After treatment with DNA-free (Ambion, USA) to remove the chromosomal DNA, the complementary DNA was synthesized using reverse transcription kit (Promega, USA) and stored at −20°C. The messenger RNA (mRNA) expression levels of PTOV1 and glyceraldehyde 3-phosphate dehydrogenase (GAPDH) were determined using the ABI PRISM 7500 sequence detection system (Applied Biosystems, USA). The primer sequences were sense/anti-sense: PTOV1: 5′-CGAGTACAGGAGCATGAGCA-3′/5′-CTTCACCAACAGAGACTGCG-3′; GAPDH: 5′-GACTCATGACCACGTCCATGC-3′/5′-AGAGGCAGGGATGATGTTCTG-3′. The mRNA expression levels of the PTOV1 genes were normalized to the GAPDH signal. All the reactions were done in triplicate using 20 µL samples containing 50 ng of complementary DNA. The reaction protocol involved heating for 10 min at 95°C, followed by 40 cycles of amplification (15 s at 95°C and 1 min at 60°C). The data were analyzed using the ABI PRISM 7500 Sequence Detection software. The expression of PTOV1 was described as 2−ΔΔCt. 22
Western blotting analysis
The cells and tumor tissues were collected and lysed on ice according to the instructions, respectively. After centrifugation at 12,000g for 20 min, the concentration of protein was measured, and then, the protein samples were denatured by boiling for 10 min and loaded onto sodium dodecyl sulfate–polyacrylamide gel electrophoresis (SDS-PAGE; 10%) gel for electrophoresis. The proteins were transferred onto polyvinylidene fluoride (PVDF) membrane (Millipore, USA) which was then incubated in the blocking solution at room temperature for 2 h. Anti-PTOV1 (1:500; Bioss, China) and anti-GAPDH (1:1000; Cell Signaling Technology, USA) were used for western blotting incubated at 4°C overnight. The membranes were subsequently incubated with horseradish peroxidase (HRP)-labeled goat anti-rabbit IgG for 1.5 h at room temperature. Protein expression was normalized against GAPDH expression. Bands were visualized by employing the BeyoECL Plus Detection System (Beyotime, China) and Bio-Rad Image Lab Software (USA).
Immunohistochemistry staining
The rapid PV two-step staining method with the following specifications was used: Paraffin slice thickness is 4 µm, slices were grilled at 65°C for 60 min and then dewaxed in xylene and rehydrated in an increasing diluted ethanol series, high-temperature antigen was retrieved via microwave in 0.1 M citrate solution (pH 6.0) for 10 min, 3% H2O2 was incubated at room temperature for 20 min, goat serum was incubated at room temperature for 20 min, and anti-PTOV1 rabbit polyclonal antibody (1:100; Bioss) was incubated at 4°C overnight. The slice were rewarmed in the next day, then incubated with the second anti-rabbit antibody at room temperature for 20 min. After washed with phosphate-buffered saline (PBS), 3,3’-diaminobenzidine (DAB) coloration, and hematoxylin mounted, the slice were analyzed by microscopic examination. Results interpretation method: Immunohistochemical (IHC) staining was scored independently by two pathologists without the knowledge of patient characters; any discrepancy was solved by consensus review. The score of immunoreactivity was measured by calculating the extent and intensity of staining cells positive in a semi-quantitative manner. As described previously, 23 the standards for evaluation included the following: positive stain intensity (0, negative; 1, weak positive; 2, moderate positive; 3, strong positive) and proportion of positive areas (none, 0; ≤10% = 1; 11%–35% = 2; 36%–70% = 3; >70% = 4). The staining score was the multiplication of the two scores. Five high power fields in each specimen were selected randomly, and final score is the average of the five scores. Samples were defined as low PTOV1 expression when the final IHC scores were 0–4 and high PTOV1 expression when the final scores were more than 4.
Statistical analysis
SPSS software (version 16.0; SPSS Inc., USA) was used for statistical analyses. All data were presented as mean ± standard deviation (SD). Categorical variables were compared by χ2 test. Continuous variables were compared using independent two-sample t-test. Survival analysis was conducted by Kaplan–Meier method and log-rank test. Univariate and multivariate analyses were performed by the Cox proportional hazard model. All tests were two-tailed and a p < 0.05 was considered to be statistically significant.
Results
PTOV1 was found overexpressed in ESCC cell lines and tissues
To explore the potential role of PTOV1 in ESCC, we first detected PTOV1 expression in ESCC cell lines (TE-1, EC109, and EC9706) and normal esophagus epithelial cell line (HEEpic) by qRT-PCR and western blotting. Interestingly, as shown in Figure 1(a) and (b), PTOV1 mRNA and protein expression were elevated significantly in TE-1, EC109, and EC9706 when compared to HEEpic (p < 0.05).

PTOV1 was upregulated in ESCC cell lines and tissues. (a) PTOV1 mRNA expression was much higher in ESCC cell lines (TE-1, EC109, and EC9706) than that in normal esophageal cell line (HEEpic). (b) PTOV1 protein was also shown to be increased in ESCC cells, compared to HEEpic. (c) PTOV1 mRNA expression was detected in eight paired ESCC tissues, and it showed a nearly 10-fold increase in ESCC tissues than ANCTs (*p < 0.05; **p < 0.01).
Subsequently, PTOV1 mRNA expression was detected by qRT-PCR in eight paired ESCC tissues selected randomly and the PTOV1 mRNA was demonstrated to express at significantly higher levels in the ESCC tissues with an approximate 10-fold higher levels observed in the cancerous tissues, when compared to the ANCTs (Figure 1(c)). Additionally, as shown in Figure 2, the overexpression of PTOV1 protein in ESCC tissues was verified by western blotting as well as IHC staining, and a strong positive relationship between PTOV1 mRNA and protein was also discovered. These collective results implicated a potential role for PTOV1 in ESCC. Therefore, clinical ESCC tissues and its paired ANCTs were collected to analyze the relationship between PTOV1 expression and the characters of ESCC.

PTOV1 protein overexpressed frequently in ESCC tissues. (a) Representative western blotting analysis of PTOV1 protein in eight paired ESCC tissues, and GAPDH was used as the control. (b) Representative immunohistochemical analysis of PTOV1 protein expression in the eight paired ESCC tissues.
Classification of the patients and their characters
There were a total of 120 patients enrolled in this study. Among them, 95 males and 25 females were included in our cohort, and the mean age of the patients was 59.9 years (range = 40-74 years). As a common ESCC-related factor, a drinking history was shared by 60.8% patients in this study; 53 patients were diagnosed when the mass was more than 4 cm. According to the clinical TNM stage, the enrolled patients were classified as follows: 32 cases of stage I, 39 cases of stage II, and 49 cases of stage III.
High PTOV1 expression was found in ESCC cell cytosome, occasionally nuclei
IHC was used to detect PTOV1 expression in 120 paired ESCC tissues and ANCTs. We found that PTOV1 protein was mainly expressed in ESCC tissues, as displayed in Figure 3, and the positive reactants of PTOV1 were yellow or brown substances present primarily in the cytoplasm and occasionally in the nucleus, while there was weak or no positive staining in most ANCTs (Figure 3(a)). Almost all ESCC tissue slice showed similar percent positive area for cytoplasmic PTOV1 but varied in staining intensity and nuclear staining. Three examples shown in Figure 3 represent some extremes, from weak, intermediate, to strong expression of PTOV1 protein in ESCC tissues (Figure 3(b)–(d)). Occasionally, there was PTOV1 nuclear staining, especially in the metastatic cancer cells (Figure 3(e)). According to IHC analysis, PTOV1 protein was expressed extensively in tumor tissues (91.67%, 110/120), while only 16.67% (20/120) was expressed in ANCT group. As described in “Materials and methods” section, PTOV1 immunostaining was scored according to percent area stained and immunostaining intensity. Most ESCC tissues in this study showed a significantly high PTOV1 protein expression when compared to ANCTs (p < 0.01, Figure 3(f)).
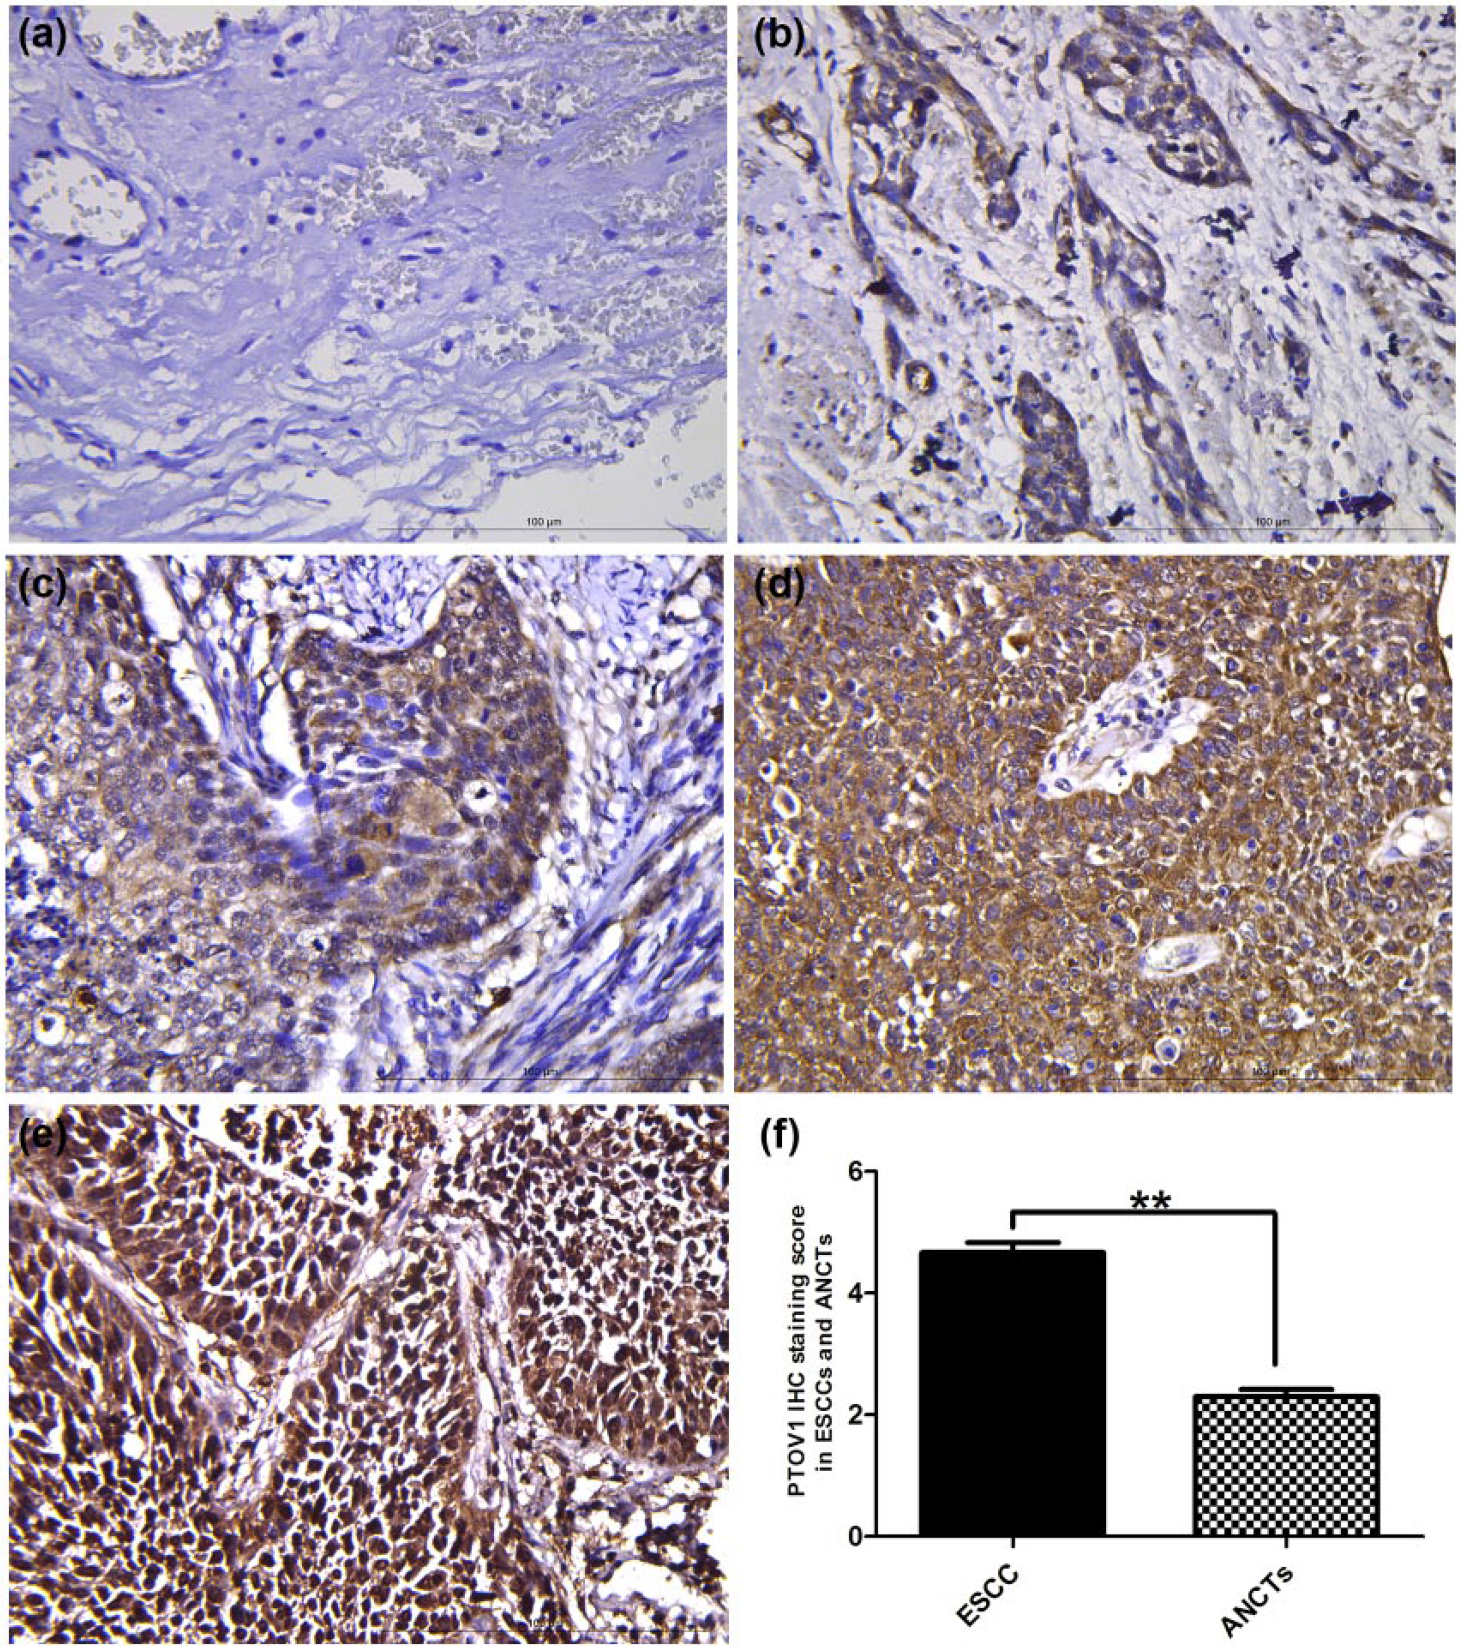
PTOV1 protein was detected by IHC in ESCC tissues. (a) Little PTOV1 expression was found in normal esophageal tissues (400×). (b–d) Weak, moderate, or high PTOV1 expression in different ESCC tissues was presented (400×). (e) Metastatic tissues showed a significant nuclei staining. (f) IHC staining score of PTOV1 was much higher in ESCC group than that in ANCT group (**p < 0.001).
PTOV1 overexpression was associated with the clinicopathological characters in ESCC
To further explore the role of PTOV1 in human ESCC, we next evaluated the association between PTOV1 expression and clinical parameters in 120 ESCC patients. According to the IHC analysis, 77 cases in this study were classified as high PTOV1 expressing and 43 as low PTOV1 expressing. Table 1 shows the overview of the clinical features, and the chi-square test was used to analyze the inner relationship. As summarized in Table 1, the high PTOV1 expression was significantly related to the characters of the tumor, including poor tumor differentiation (p = 0.043) and larger lesion (p = 0.022). Moreover, a significant higher proportion of high PTOV1 expression was found in male ESCC patients, when compared to female counterparts (p = 0.018). However, there was no significant difference identified between PTOV1 expression, age (p = 0.142), and drinking history (p = 0.400).
Correlations between PTOV1 expression and clinicopathological features of 120 cases of ESCC.

ESCC: esophageal squamous cell carcinoma; TNM: tumor–node–metastasis.
Significance of bold values are p < 0.05.
Interestingly, high PTOV1 expression in the ESCC tissues was found to increase with progressing clinical stage (Figure 4). PTOV1 staining score was significantly increased in ESCC tissues from clinical stage I to III (p < 0.01, Figure 5(a) and Table 1). The PTOV1 IHC staining score was higher in the lesions with lymph node metastasis than in those without; moreover, it was much more frequent to observe nuclear staining in the metastatic cancer cell (p < 0.01, Figure 5(b) and Table 1).
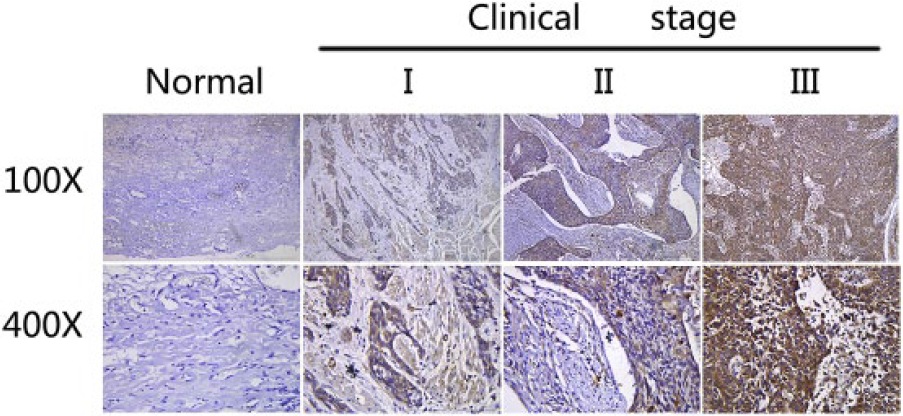
Overexpressed PTOV1 was associated with clinical progression of ESCC. Representative images of IHC staining for PTOV1 in ESCC tissues and paired ANCTs in different clinical stages. The degree of PTOV1 increased with the advanced clinical stage of ESCC.

Overexpressed PTOV1 was associated with tumor progression and poor prognosis. (a and b) The level of PTOV1 expression was significantly related to TNM stage and lymph nodal involvement (*p < 0.005, ***p < 0.0001). (c and d) According to the IHC staining score, the ESCC group was classified into low PTOV1 expression group (n = 43) and high PTOV1 expression group (n = 77). Kaplan–Meier survival analysis and log-rank test of PTOV1 expression in ESCCs showed that the higher expression of PTOV1 indicated a poorer DFS (p < 0.001) and OS (p < 0.001).
Upregulation of PTOV1 expression was associated with the prognosis of ESCC
According to previous findings, PTOV1 was a promising indicator for the long-term outcome in a variety of tumors. To assess the potential role of PTOV1 in the prognosis of ESCC, the Kaplan–Meier analysis and log-rank test were conducted on 120 patients who had intact follow-up information. High PTOV1 expression was demonstrated to be associated with a shorter overall survival (OS) time and disease-free survival (DFS) time. As it is shown in Figure 5, patients in the high PTOV1 expression group were ~6.3 times likelier to die of ESCC than patients with low PTOV1 expression (median survival time: 33 months vs >60 months, p < 0.001; Figure 5(a)). Similarly, the DFS time in high PTOV1 expression patients was ~5.2 times shorter than that in patients with low PTOV1 expression (median survival time: 43 months vs >60 months, p < 0.001; Figure 5(b)).
Overexpression of PTOV1 might be a proper indicator for the unfavorable prognosis
Univariate Cox proportional hazards regression model was performed on all parameters. As shown in Table 2, OS was significantly dependent on depth of tumor infiltration (T classification, hazard ratio (HR) = 2.622), lymph node metastasis (N classification, HR = 3.371), TNM stage (p < 0.01), and PTOV1 expression levels (HR = 5.15; Table 2). Likewise, T classification (HR = 2.573), N classification (HR = 3.887), TNM stage (p < 0.01), and PTOV1 expression levels (HR = 5.909; Table 2) were significant prognostic factors for DFS. Consequently, these factors were enrolled in the multivariate Cox regression analysis. Similar to PTOV1 in many other researches, the overexpressed PTOV1 protein was demonstrated to be an independent indicator for the poor OS (HR = 4.100) and DFS (HR = 2.921) in ESCC, along with the lymph node metastasis (HR = 1.799 for OS, HR = 1.931 for DFS) and TNM stage (HR = 3.289 for OS, HR = 9.719 for DFS) (Table 3).
Univariate Cox regression analysis of overall and disease-free survival in 120 patients with ESCC.

HR: hazard ratio; CI: confidence interval; TNM: tumor–node–metastasis; ESCC: esophageal squamous cell carcinoma.
Multivariate Cox regression analysis of overall and disease-free survival in 120 patients with ESCC.

HR: hazard ratio; CI: confidence interval; TNM: tumor–node–metastasis; ESCC: esophageal squamous cell carcinoma.
Discussion
PTOV1 was first described as a gene and protein overexpressed in prostate tumors and preneoplastic lesions. 5 Since its discovery, overexpression of PTOV1 was found in multiple tumor tissues relative to its adjacent normal tissues.11–13 Moreover, the increasing binding partners and associated cellular functions have been found and helped to identify PTOV1 as a regulator of gene expression at transcriptional and post-transcriptional levels, which implicated a critical role in promoting cancer cell proliferation and motility for PTOV1. 7
To the best of our knowledge, there is no investigation into the underlying role of PTOV1 in ESCC; currently, this is the first report regarding the possible relationship. In this study, we have investigated PTOV1 expression in a series of paired ESCC specimens with intact follow-up data. At first, we found that PTOV1 protein was constantly upregulated in ESCC tissues and cell lines, which demonstrated that PTOV1 was transcriptionally and translationally upregulated in ESCC. As a modulator of gene translation and transcription, PTOV1, detected by IHC staining, has also been found mainly in the cytoplasm of ESCC tissues, but occasionally strong nuclei staining. This discrepant PTOV1 protein distribution was also associated with the tumor pathological differentiation and progression in this study. Consistent with previous analysis of PTOV1 in other cancers, 8 these results indicated that overexpressed PTOV1 played an important role in the occurrence of ESCC.
Previous findings have suggested that PTOV1 exerted its oncogenic role by modulating the mediator transcriptional regulatory complex.5,8,14 Several proteins have been reported to be regulated by PTOV1, including HES1, Flotillin-1, HEY1, RAR, and Dickkopf-1. 7 They are involved in extensive biological function, such as tumorigenesis, cancer cell proliferation, and chemotherapy resistance. As a member of the notch signaling target genes, HES1 was a basic helix–loop–helix transcription factor. Loss of HES1 contributes to the aggressive phenotype of medullary thyroid carcinoma and negatively affects the Notch1 signaling pathway. 24 PTOV1 has been reported to promote prostate cancer progression partly by downregulating HES1. 25 Recently, HES1 has also been demonstrated to be an independent prognostic indicator for ESCC, 26 so it is presumed that overexpressed PTOV1 might promote the occurrence and development of ESCC by negatively regulating HES1. However, further investigation is warranted to clarify this.
A strong nuclear staining was more frequently found in the T3 or T4 stage and metastatic cancer cells; from the clinical data, we also found a correlation between PTOV1 overexpression and ESCC clinical progression. Similar to other findings,12,13,15 PTOV1 overexpression had a strong relationship with the tumor size and T staging. Moreover, IHC staining showed that the intensity of PTOV1 expression in the ESCC tissues increased with progressing clinical stage and lymph node involvement, and all these collectively indicated that the elevated expression of PTOV1 lead to a more aggressive character. Overexpressed PTOV1 was proved to enhance the translation of active c-Jun and increase its nuclear localization in primary and metastatic tumors differently, 19 which indicated a potential mechanism for PTOV1 in promoting metastasis.
Moreover, the pro-oncogenic function of PTOV1 is also partly associated with its mitotic activity induced by promoting cell division cycle entry into the S phase. 8 As a cell-cycle-associated mitogenic protein, PTOV1 has been demonstrated to shuttle between the nucleus and the cytoplasm; moreover, it would assist Flotillin-1 nuclear translocation and promote the mitogenic activity of Flotillin-1 in a cell-cycle-dependent manner. 27 Flotillin-1 promotes tumorigenesis of various cancers,28–30 including ESCC. Moreover, Flotillin-1 activates tumor necrosis factor-α–receptor signaling and sustains activation of Nuclear factor-κB (NF-κb) in ESCC cells. Analogically, PTOV1 might also promote the tumorigenesis and progression of ESCC in the similar manner due to their tightly linked cellular function.
Apart from involvement in the tumor initiation and progression, PTOV1 was also proved to be a potential prognostic indicator for ESCC in our present analysis. In clinical practice, the TNM staging system was a universal system to predict outcomes for ESCC patients, 21 however, it was not rare that the same clinical TNM stage finally got distinct outcomes, which indicated that the TNM stage alone was not sufficient fully to predict the clinical outcome of ESCC. Therefore, molecular biomarkers combined with clinicopathological characters are used to help treatment decision-making. In this study, survival analysis has showed that the patients with high PTOV1 expression were more easily to experience a shorter survival time; moreover, univariate and multivariate analyses showed that overexpressed PTOV1 was an independent predictor of poor OS and DFS. It strongly indicated that PTOV1 was involved in the progression of ESCC and might represent a biomarker for the identification of subsets of ESCC patients with a more aggressive form of the disease.
As is known to all, ESCC is predominantly found in male, with a ratio of approximately 2.4:1 to female. 2 This gender discrepancy may be attributed to the enhanced activity and increase in the androgen receptor in men, which promotes the growth of ESCC.31,32 PTOV1 has been mapped to 19q13, where a large number of genes nearby were stimulated by androgens; therefore, PTOV1 itself is activated by androgens. 33 As shown in Table 1, this study revealed that high PTOV1 expression was also predominantly found in men, which indicated that males might need more aggressive treatment strategy than females with the same TNM stage.
Adjuvant therapy was clinically used to improve the prognosis of ESCC patients when needed; however, it was always followed by the attendant side effects and uncertain efficacy. PTOV1 has been reported to involve in the resistance to chemotherapy,7,34 and the ectopic overexpression of PTOV1 would bring the cells a greater capacity to survive, self-renew, and proliferate, and knockdown of PTOV1 would induce a striking cell-cycle arrest at the G2/M phase and apoptosis. 7 Consistently, a recent study showed that PTOV1 impaired the retinoid-induced cancer cell cytotoxicity significantly through forming a ternary complex with the RAR coactivator CREB-binding protein (CBP), thereby promoting dissociation of CBP from RAR at the RA-responsive gene promoter.34,35 According to our results, PTOV1 may represent a potential biomarker for the ESCC patients to guide therapeutic strategy selection and improve survival quality.
Taken together, these data in this study suggest that PTOV1 may play a vital role in the initiation and progression of ESCC, and PTOV1 may be a potential biomarker for advanced clinical stage and poor prognosis in ESCC, which may help to identify patients at high risk and offer a rationale for selecting subsequent adjuvant treatment. Though this study shows a potential oncogenic role of overexpressed PTOV1 in ESCC, further investigation is warranted to illuminate the underlying mechanism of PTOV1 in regulating the tumorigenesis and progression of ESCC.
Footnotes
Declaration of conflicting interests
The author(s) declared no potential conflicts of interest with respect to the research, authorship, and/or publication of this article.
Funding
The author(s) disclosed receipt of the following financial support for the research, authorship, and/or publication of this article: This work was supported by grants from the New Xiangya Talent Project of the Third Xiangya Hospital of Central South University (No. 20150310).