
Abstract
Dysregulation in microRNA expression is a common feature in colorectal cancer. Due to the inconsistent results regarding serum miR-92a expression pattern and the insufficient studies on serum miR-375 and miR-760, we aimed in this study to investigate their expression profile and diagnostic and prognostic power in Egyptian colorectal cancer patients. The expression profile of miR-92a, miR-375, and miR-760 was determined in the sera of 64 colorectal cancer patients using quantitative real-time reverse transcription polymerase chain reaction in comparison to 27 healthy control subjects. The expression fold change of the studied microRNAs was correlated with patients’ clinicopathological features. Receiver operating characteristic curve analysis was done to determine the role of these microRNAs in colorectal cancer diagnosis and follow-up according to the yielded area under the curve. The expression pattern of miR-92a was significantly upregulated (3.38 ± 2.52, p < 0.0001), while both of miR-375 and 760 were significantly downregulated (−1.250 ± 1.80, p< 0.0001; −1.710 ± 1.88, p < 0.0001, respectively) in colorectal cancer than the control. MiR-92a was positively correlated (r = 0.671, p = 0.0001), while miR-375 and miR-760 were inversely correlated (r = −0.414, p = 0.001; r = −0.644, p = 0.0001) with advanced colorectal cancer stages. Receiver operating characteristic curve analysis disclosed the highest diagnostic potential for miR-760 to discriminate colorectal cancer patients and early-stage colorectal cancer from the control (area under the curve = 0.922 and 0.875, respectively), while the highest prognostic potential for discrimination between colorectal cancer stages was for miR-92a. In conclusion, serum level of miR-92a, miR-375, and miR-760 may serve as biomarkers of colorectal cancer in Egyptian patients with high diagnostic power for miR-760 and high prognostic power for miR-92a.
Introduction
Colorectal cancer (CRC) is a heterogeneous carcinoma involving the colon and rectum. The intestinal epithelia are highly prone to CRC development due to their high turn-over and proliferative rate. 1 Among all cancers, the world wide incidence rate of CRC is 9.7%, to be the third most common cancer after lung and breast cancers and the fourth cause of death. 2 Early identification of CRC in the resectable stage I upgrades the 5-year survival rate to 90%, which progressively declines with the unresectable and distant metastatic stage IV to 10%. 3 In Egypt, CRC is the commonest gastrointestinal cancers (53%) and ranked the sixth most frequent cancer in both men and women, but with slight more predominance in men relative to women (1.3:1). 4
Currently, the gold standard in CRC screening and diagnosis is the colonoscopy, but it has low patient compliance due to its invasive nature and higher cost. 5 However, the other most widely applied non-invasive screening tools—fecal occult-blood test (FOBT) and serum carcinoembryonic antigen (CEA)—have many limitations. The most available, non-invasive, and inexpensive screening test is FOBT; in spite of its high specificity to CRC, its use is limited because of its low sensitivity and dietary restrictions. 6 CEA has both low sensitivity and specificity issues to be recommended for CRC diagnosis, particularly early stages. 7 So, early identification of CRC is a big challenge for the currently available non-invasive biomarkers.
MicroRNAs (miRNAs) are class of endogenously expressed, single-stranded, small non-protein-coding RNAs of 18–22 nucleotides in length, which have a great regulatory role over the expression of the majority of the human protein-coding genes. 8 They are involved in regulation of various cellular processes including, differentiation, development, morphogenesis, metabolism, apoptosis, and carcinogenesis. 9 Their highly frequent miss-expression pattern in several cancers have been reported and found to be mirrored in the circulation. Circulatory miRNAs exhibited a remarkable stability in body fluids and resistance against temperature and pH changes. 10 These properties besides the non-invasive sample collection may potentiate the use of circulating miRNAs as cancer biomarkers, especially in CRC early diagnosis and follow-up.
Based on comprehensive reviewing of the scientific literature concerning the use of miRNAs as cancer biomarkers and particularly in CRC, the studied miRNAs (92a, 375, and 760) were selected according to their biological availability in the different specimens (tissue, stool, plasma, and serum), but with inconsistent expression behavior among different cancers and CRC specimens or with insufficient studies.
MiR-92a is one of the most studied miRNAs in cancers. It was found to be oncogenic miRNA with upregulated expression in several cancers such as leukemia, 11 breast, 12 and hepatocellular carcinomas. 13 However, other studies reported downexpression in circulating miR-92a in the previously mentioned cancers.14–16 The inconsistent pattern of expression for miR-92a was also reported in CRC. In spite of being most commonly over expressed,17–22 many studies opposed this expression pattern.23–27 These controversies were the cause behind the incorporation of miR-92a in this study.
Regarding miR-375, it was first discovered and annotated as pancreatic tissue-specific miRNA. 28 Later studies revealed its aberrant expression (predominant downexpression) in cancers such as brain, lung, liver, esophageal, and gastric carcinomas,29–33 but its upregulation was reported in breast and prostate cancers.34,35 Many CRC tissue–based studies came to an agreement on the downexpression of miR-375 in CRC as a consistent pattern,36–41 in addition to one plasma-based study. 42 This study was the first to detect miR-375 expression in sera of CRC patients to find whether there is a difference in the expression pattern between the different CRC specimens.
The information surrounding the role of miR-760 in cancer pathogenesis remains insufficient as one of the least attention paid miRNA in oncological studies, especially CRC. Only two studies were found about miR-760 expression in CRC as circulating biomarker; one was carried out over CRC patients’ plasma, 43 while the other examined serum exosomal miR-760. 44 We aimed in our study to investigate for first time the total serum miR-760 expression level in CRC patients’ sera.
The aim of this study was to explore the expression profile of miR-92a, miR-375, and miR-760 in the sera of Egyptian CRC patients as different ethnic people than the most of studies and as a part of north Africa and middle east, revealing their levels in the different stages, their possible role in carcinogenesis, their ability to discriminate CRC from control subjects, and their diagnostic power in early detection of CRC and prognostic differentiation between the different CRC clinical stages as non-invasive circulating molecular biomarkers using quantitative real-time reverse transcription polymerase chain reaction (qRT-PCR).
Materials and methods
This study was a pilot retrospective observational study carried out on 91 subjects; 64 of them were CRC patients recruited from the Gastrointestinal Endoscopy Unit in Al-kasr Al-Ainy Hospital, Cairo University in Egypt, who attended the colonoscopy unit for colorectal screening due to the following reasons:
General screening.
Suffering from variable colonic symptoms, including CRC alarming symptoms.
Exclusion criteria included patients suffering from hereditary CRC, inflammatory bowel diseases, CRC recurrence, other types of cancers except CRC metastases, inflammatory polyps, intestinal adenomas, precancerous lesions, and CRC patients initiated cancer chemotherapy, radiotherapy, or surgical intervention.
Patients’ diagnosis and cancer staging were based on the colonoscopic findings, abdominal radio-imaging, pathological findings, and clinical decisions. Based on these findings, patients were classified according to the American Joint Committee on Cancer (AJCC) 2010 into three stages:
Stage I/II: local cancer.
Stage III: lymph node involvement.
Stage IV: distant metastasis.
In addition to 27 control subjects who were selected as apparently healthy volunteers without gastrointestinal symptoms, chronic disease history, cancer, and family history of CRC.
The study protocol was approved by the ethics committee of Al-Kasr Al-Ainy hospital, Cairo University, Egypt, and the subjects were enrolled in this study after written informed consent about the study.
Methods
Serum preparation
A volume of 5 mL of venous blood samples was withdrawn from CRC patients and control subjects using BD Vacutainer system. The samples were collected in serum separator tubes and allowed to clot for 15 min and then centrifuged at 4000 r/min for 10 min. Sera were stored at −80°C until the time of analysis.
Serum total RNA extraction including miRNAs
It was carried out using miRNeasy Mini Kit (Cat. No. 217004; Qiagen, Germany) and protocol for purification of serum total RNA, including miRNA which combines phenol/guanidine-based lysis of samples and silica membrane–based purification of total RNA. Before extraction processing, samples and kit components were brought to room temperature for 30 min to allow thawing. Serum denaturation was achieved through mixing 200 µL with 1 mL of QIAzol denaturant solution at room temperature for 5 min. Then, aqueous and organic phase separation was performed by addition of 200 µL of chloroform to the denatured serum, mixed by vortexing for 15 s, left for 5 min at room temperature, and then centrifuged for 15 min at 14,000 r/min at 4°C.
The aqueous phase (approximately 600 µL) was extracted and mixed with 900 µL absolute ethanol, then applied onto RNeasy Mini Spin Columns, centrifuged at 14,000 r/min for 15 s at room temperature, and the flow-through was discarded. Two buffer solutions were then used on two consecutive steps (RWT and RPE, respectively) to wash the mini spin columns with centrifugation at 14,000 r/min for 15 s at room temperature for each step and throwing the flow-through. Before RNA elution, the mini spin columns were centrifuged again at 14,000 r/min for 2 min at room temperature to be dried and to be free from ethanol. Finally, the total RNA was eluted using 50 µL of RNase-free water applied directly onto the mini spin column silica membrane and centrifuged for 1 min at 14,000 r/min at room temperature. The eluted RNA was divided into two portions, a small portion (5 µL) was used for NanoDrop spectrophotometric RNA quantitation and purity assessment, while the remained larger portion was stored at −80°C until subsequent analytical steps.
Quantitation of purified RNA including miRNAs
Sample extracted RNA was subjected to RNA quantitation and purity assessment using NanoDrop® (ND)-1000 spectrophotometer (NanoDrop Technologies, Inc., Wilmington, DE, USA). Absorbance at 260 nm was used to detect the concentration of RNA in the sample (A260 = 1 → 44 µg/mL), while ratios of absorbance at 260/280 and at 260/230 nm were determined to detect RNA purity. The generally accepted ratio for 260/280 is 1.8–2.1, while >1.7 for 260/230 ratio.
MiRNAs reverse transcription into complementary DNA
This step was performed using miScript® II RT Kit (Cat. No. 218161; Qiagen) and protocol for RNA reverse transcription (RT) into complementary DNA (cDNA) as a part of miScript PCR system which uses total RNA that contains miRNA as the starting material for cDNA synthesis. miScript HiSpec buffer protocol was applied to facilitate selective RT of mature miRNAs into their cDNAs. In this step, the extracted RNA samples and miScript reverse transcriptase mix were allowed to thaw on ice, while the RNase-free water, miScript Nucleics Mix (10×), and miScript HiSpec Buffer (5×) were thawed at room temperature. The reverse RT mix was prepared on ice using 4 µL miScript HiSpec Buffer (5×), 2 µL miScript Reverse Transcriptase Mix, 2 µL miScript Nucleics Mix (10×), 7 µL RNase-free water, and 5 µL of the extracted RNA to yield a 20 µL final reaction volume. In order to synthesize the cDNAs, the RT mix was incubated for 60 min at 37°C, followed by 5 min incubation at 95°C. The yielded cDNA samples were stored undiluted at −80°C until performing qRT-PCR.
Quantification of mature miRNAs using qRT-PCR
miScript SYBR® Green PCR Kit (Cat. No. 218073; Qiagen) was used and protocol for mature miRNA quantitative detection was applied in this step. Target-specific miScript Primer Assay (forward primers) for the selected miRNAs was used in this step; Hs_miRNA-92a (Cat. No. MS00006594), Hs_miRNA-375 (Cat. No. MS00031829), Hs_miRNA-760 (Cat. No. MS00037331), in addition to the housekeeping gene (HK gene) Hs_SNORD68 (Cat. No. 00033712) which is used as an endogenous control for data normalization and relative quantification. Before constituting the qRT-PCR mix, the stored cDNA samples and miScript SYBR Green PCR and miScript Primer Assay Kits were allowed to thaw at room temperature. The thawed cDNA samples were diluted with 200 µL RNase-free water. Then, the qRT-PCR mix (20 µL final volume) for each miRNA in this study was composed of 10 µL of QuantiTect SYBR Green PCR Master Mix (2×), 2 µL of miScript Universal Primer (10×), 2 µL of miRNA-specific forward primer, miScript Primer Assay (10×), 4 µL of RNase-free water, and 2 µL of cDNA. The quantification reaction was performed using Rotor-Gene Q 72-well rotor (Qiagen, USA) which was programmed for the following conditions: incubation at 95°C for 15 min as a preliminary activation step for HotStarTaq DNA polymerase (included in 2× QuantiTect SYBR Green PCR Master Mix), followed by 40 amplification cycles, and each cycle is achieved by three consecutive steps of DNA denaturation at 94°C for 15 s, annealing at 55°C for 30 s, and extension at 70°C for 30 s.
Result calculation
After completing qRT-PCR cycles, specific amplification of each miRNA was ensured through analyzing the melting curves. Cycle threshold (Ct) value was defined as the cycle number in which there is the first detectable increase in fluorescence signals above a defined threshold. Ct values were automatically calculated using the Rotor Gene® Q software 2.1 (Qiagen).
According to the Ct value for each targeted miRNA, the data were normalized through relative expression to the reference gene SNORD-68 using ΔCt method, where Ct values of SNORD-68 were subtracted from Ct values of the target miRNAs. This was done for both patient and control groups. Then, ΔΔCt values were calculated by subtracting ΔCt values of control group from ΔCt values of the patient group. Then, the fold change (FC) of expression or relative quantitation for the targeted miRNAs was calculated using 2−ΔΔCt method. 45 The FC is the expression ratio: if the FC is positive, it means that the gene is upregulated; if the FC is negative, it means it is downregulated. So, the results were expressed as FC compared to the control sample which was considered the normal value and assumed to equal 1.
Statistical analysis
The data were analyzed and charts were built using Statistical Package for Social Sciences (SPSS) 22, Systat SigmaPlot 12.5, and GraphPad Prism 6.01. The values were presented as mean ± standard deviation (SD), median (interquartile range (IQR)), number, and percentage.
Data of the groups and subgroups were subjected to D’Agostino and Pearson omnibus normality test to determine the normal distribution pattern. The whole data of each miRNA passed the normality test, while the staging subgroup results were variable. So, Student’s t test and Man–Whitney U tests were used to detect the statistical differences regarding the expression FC of the studied miRNAs between the different groups and subgroups when appropriate.
The correlation coefficient (r) was calculated to determine the degree of relationship between different miRNAs and the clinicopathological data of the patients using Pearson product moment correlation. The significance of (r) was considered if p value < 0.05. The receiver operator characteristic (ROC) curve was constructed to obtain the diagnostic accuracy, cutoff values, sensitivity, and specificity for each miRNA. As an accuracy indicator, area under the curve (AUC) was used for assessment of the diagnostic and prognostic performance of the studied miRNAs.
Results
CRC patient demographic and clinical data
This study was carried out on 64 CRC patients aged (51.4 ± 12.2) years: 18 (28.125%) of them were younger than 40 years and the rest 46 (71.875%) were older. Male patients were 46 (71.9%), while women patients were 18 (28.1%). The most common presenting symptoms were constipation (46; 71.9%), abdominal pain (40; 62.5%), weight loss (29; 45.3%), and rectal bleeding (13; 20.3%), respectively (Table 1).
Characteristics of CRC patients.
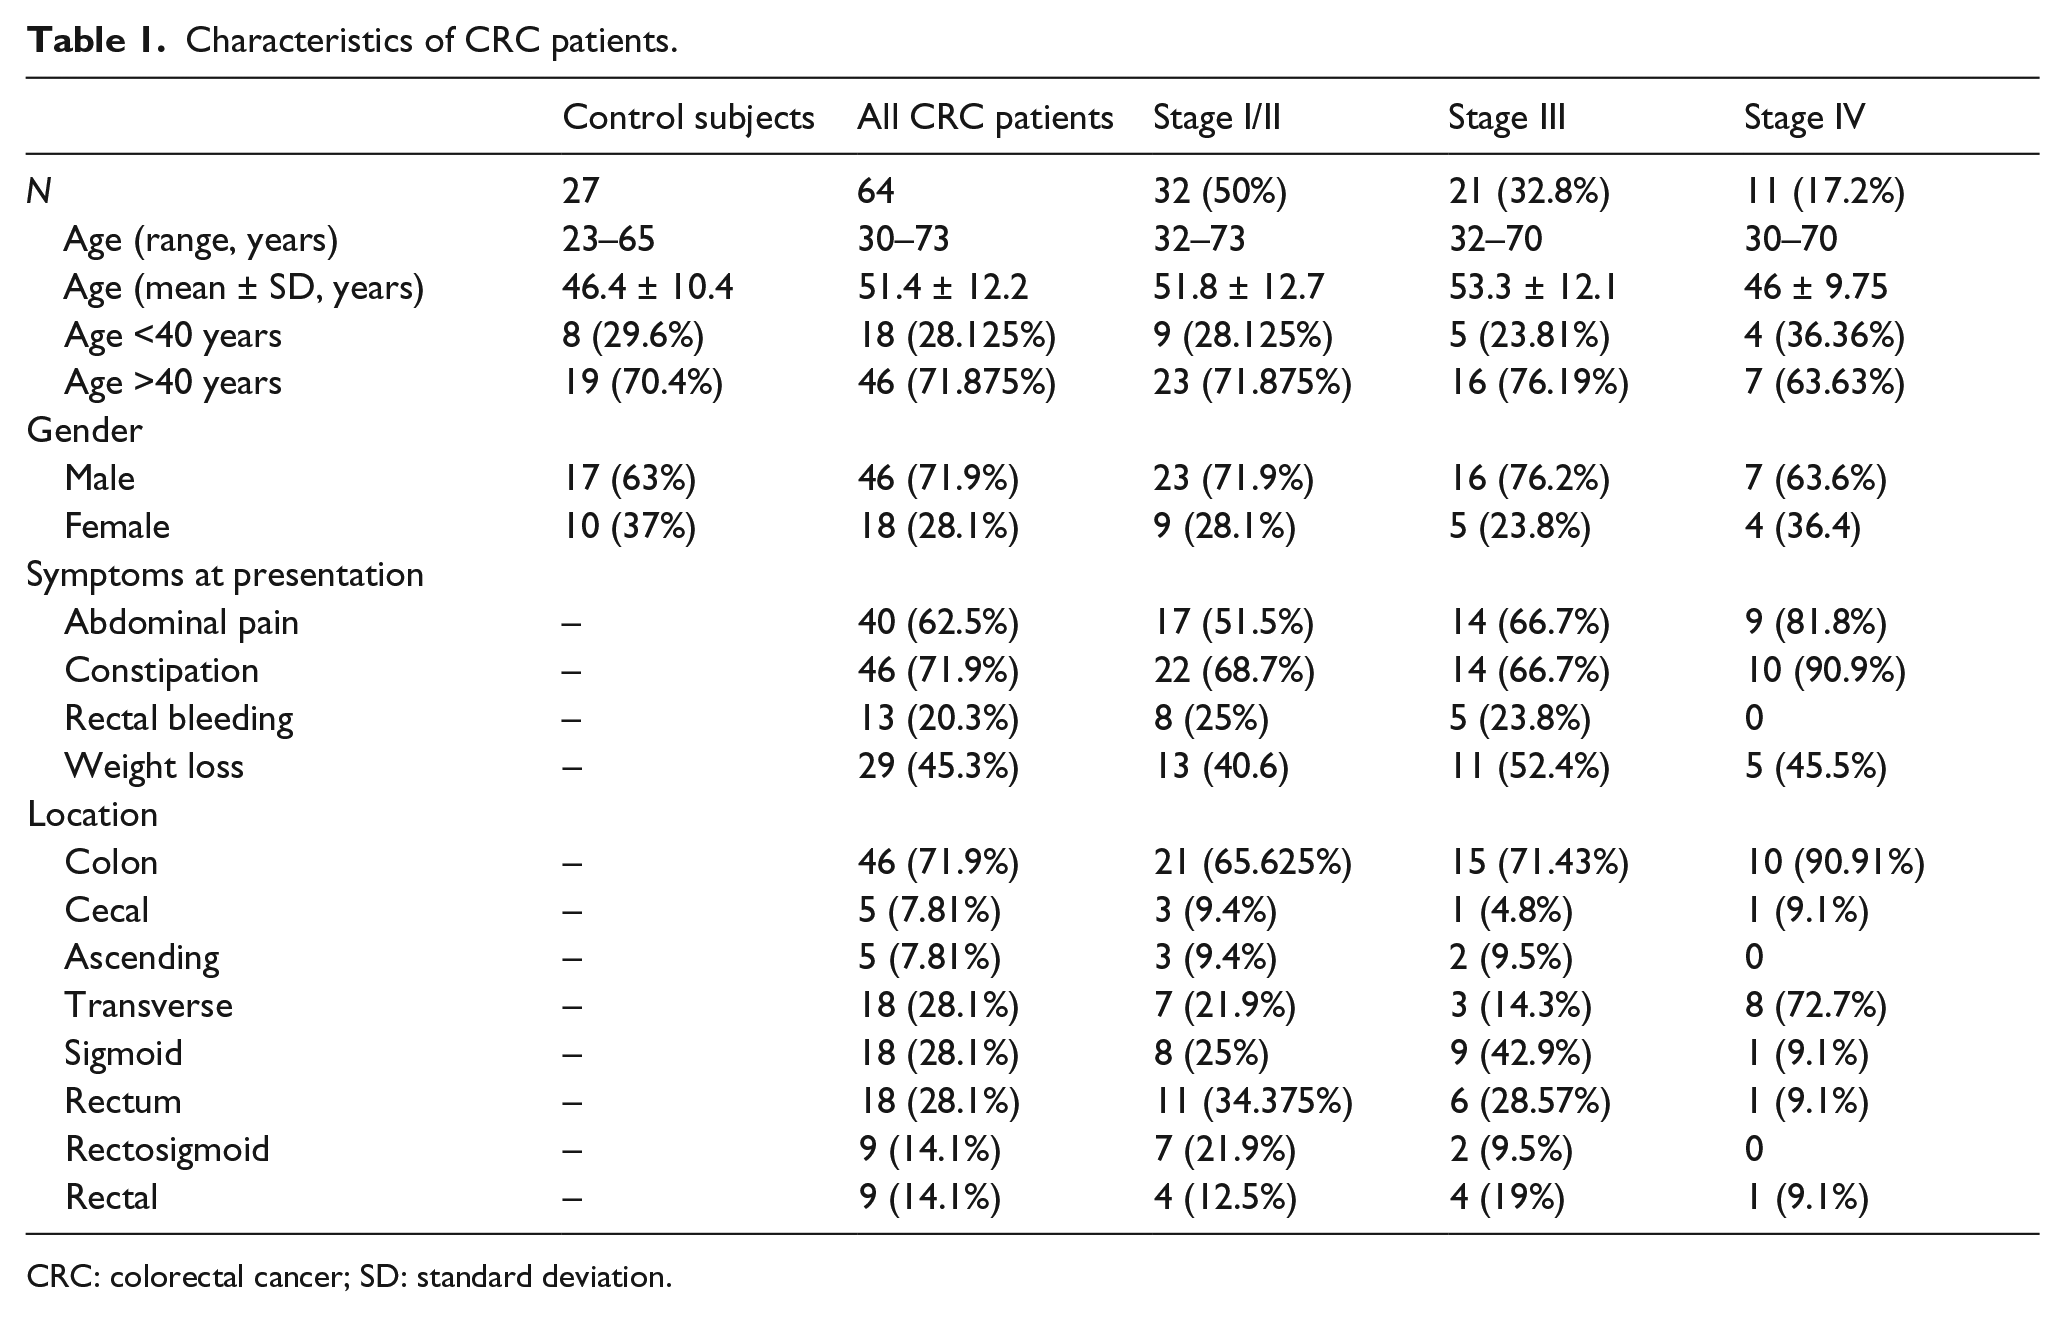
CRC: colorectal cancer; SD: standard deviation.
Based on the colonoscopic and radio-imaging findings, the most common CRC locations detected were transverse (18; 28.1%), sigmoid (18; 28.1%), rectosigmoid (9; 14.1%), rectal (9; 14.1%), and less commonly cecal (5; 7.81%) and ascending (5; 7.81%). Colonic locations were more common (46; 71.9%) than rectal locations (18; 28.1%). Also, the left-sided colonic cases were more common (36; 56.25%) than right-sided colon (28; 43.75%).
The recruited CRC patients were grouped into three stages: stage I/II (32; 50%), stage III (21; 32.8%), and stage IV (11; 17.2%). Their demographic and clinical findings are listed in Table 1.
Expression pattern of the investigated miRNAs
Three miRNAs were quantified in CRC patients’ sera: miR-92a, miR-375, and miR-760. It was found that miR-92a was predominantly upregulated (54; 84.375%; 3.38 ± 2.52), while both miR-375 and miR-760 were predominantly downregulated (50; 79.125%; −1.250 ± 1.80 and 59; 92.187%; −1.710 ± 1.88, respectively) with great statistical significance from control subjects (p < 0.0001). MiR-760 showed the most consistent expression pattern (Table 2 and Figure 1).
Expression pattern of the serum-targeted miRNAs regarding CRC stages.
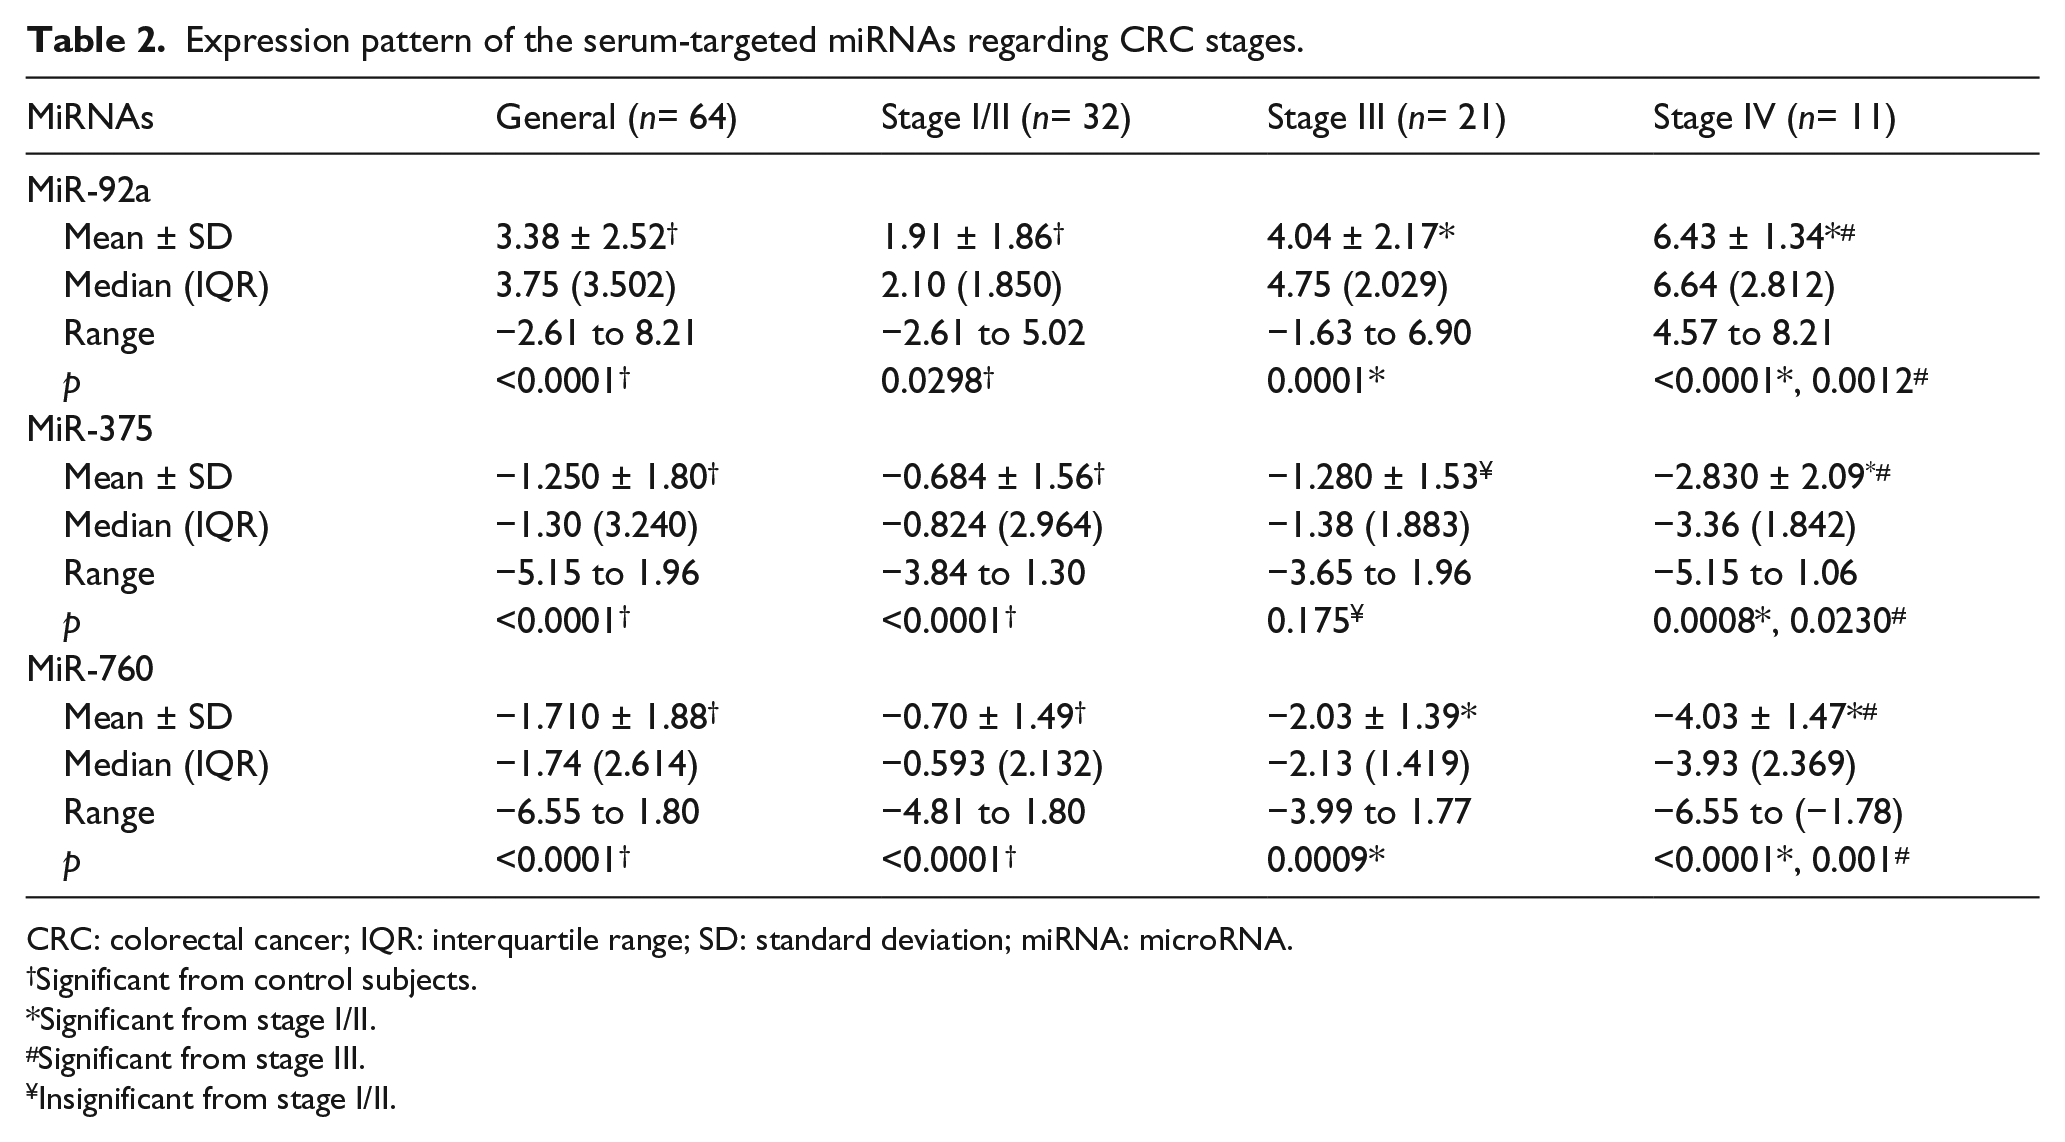
CRC: colorectal cancer; IQR: interquartile range; SD: standard deviation; miRNA: microRNA.
Significant from control subjects.
Significant from stage I/II.
Significant from stage III.
Insignificant from stage I/II.
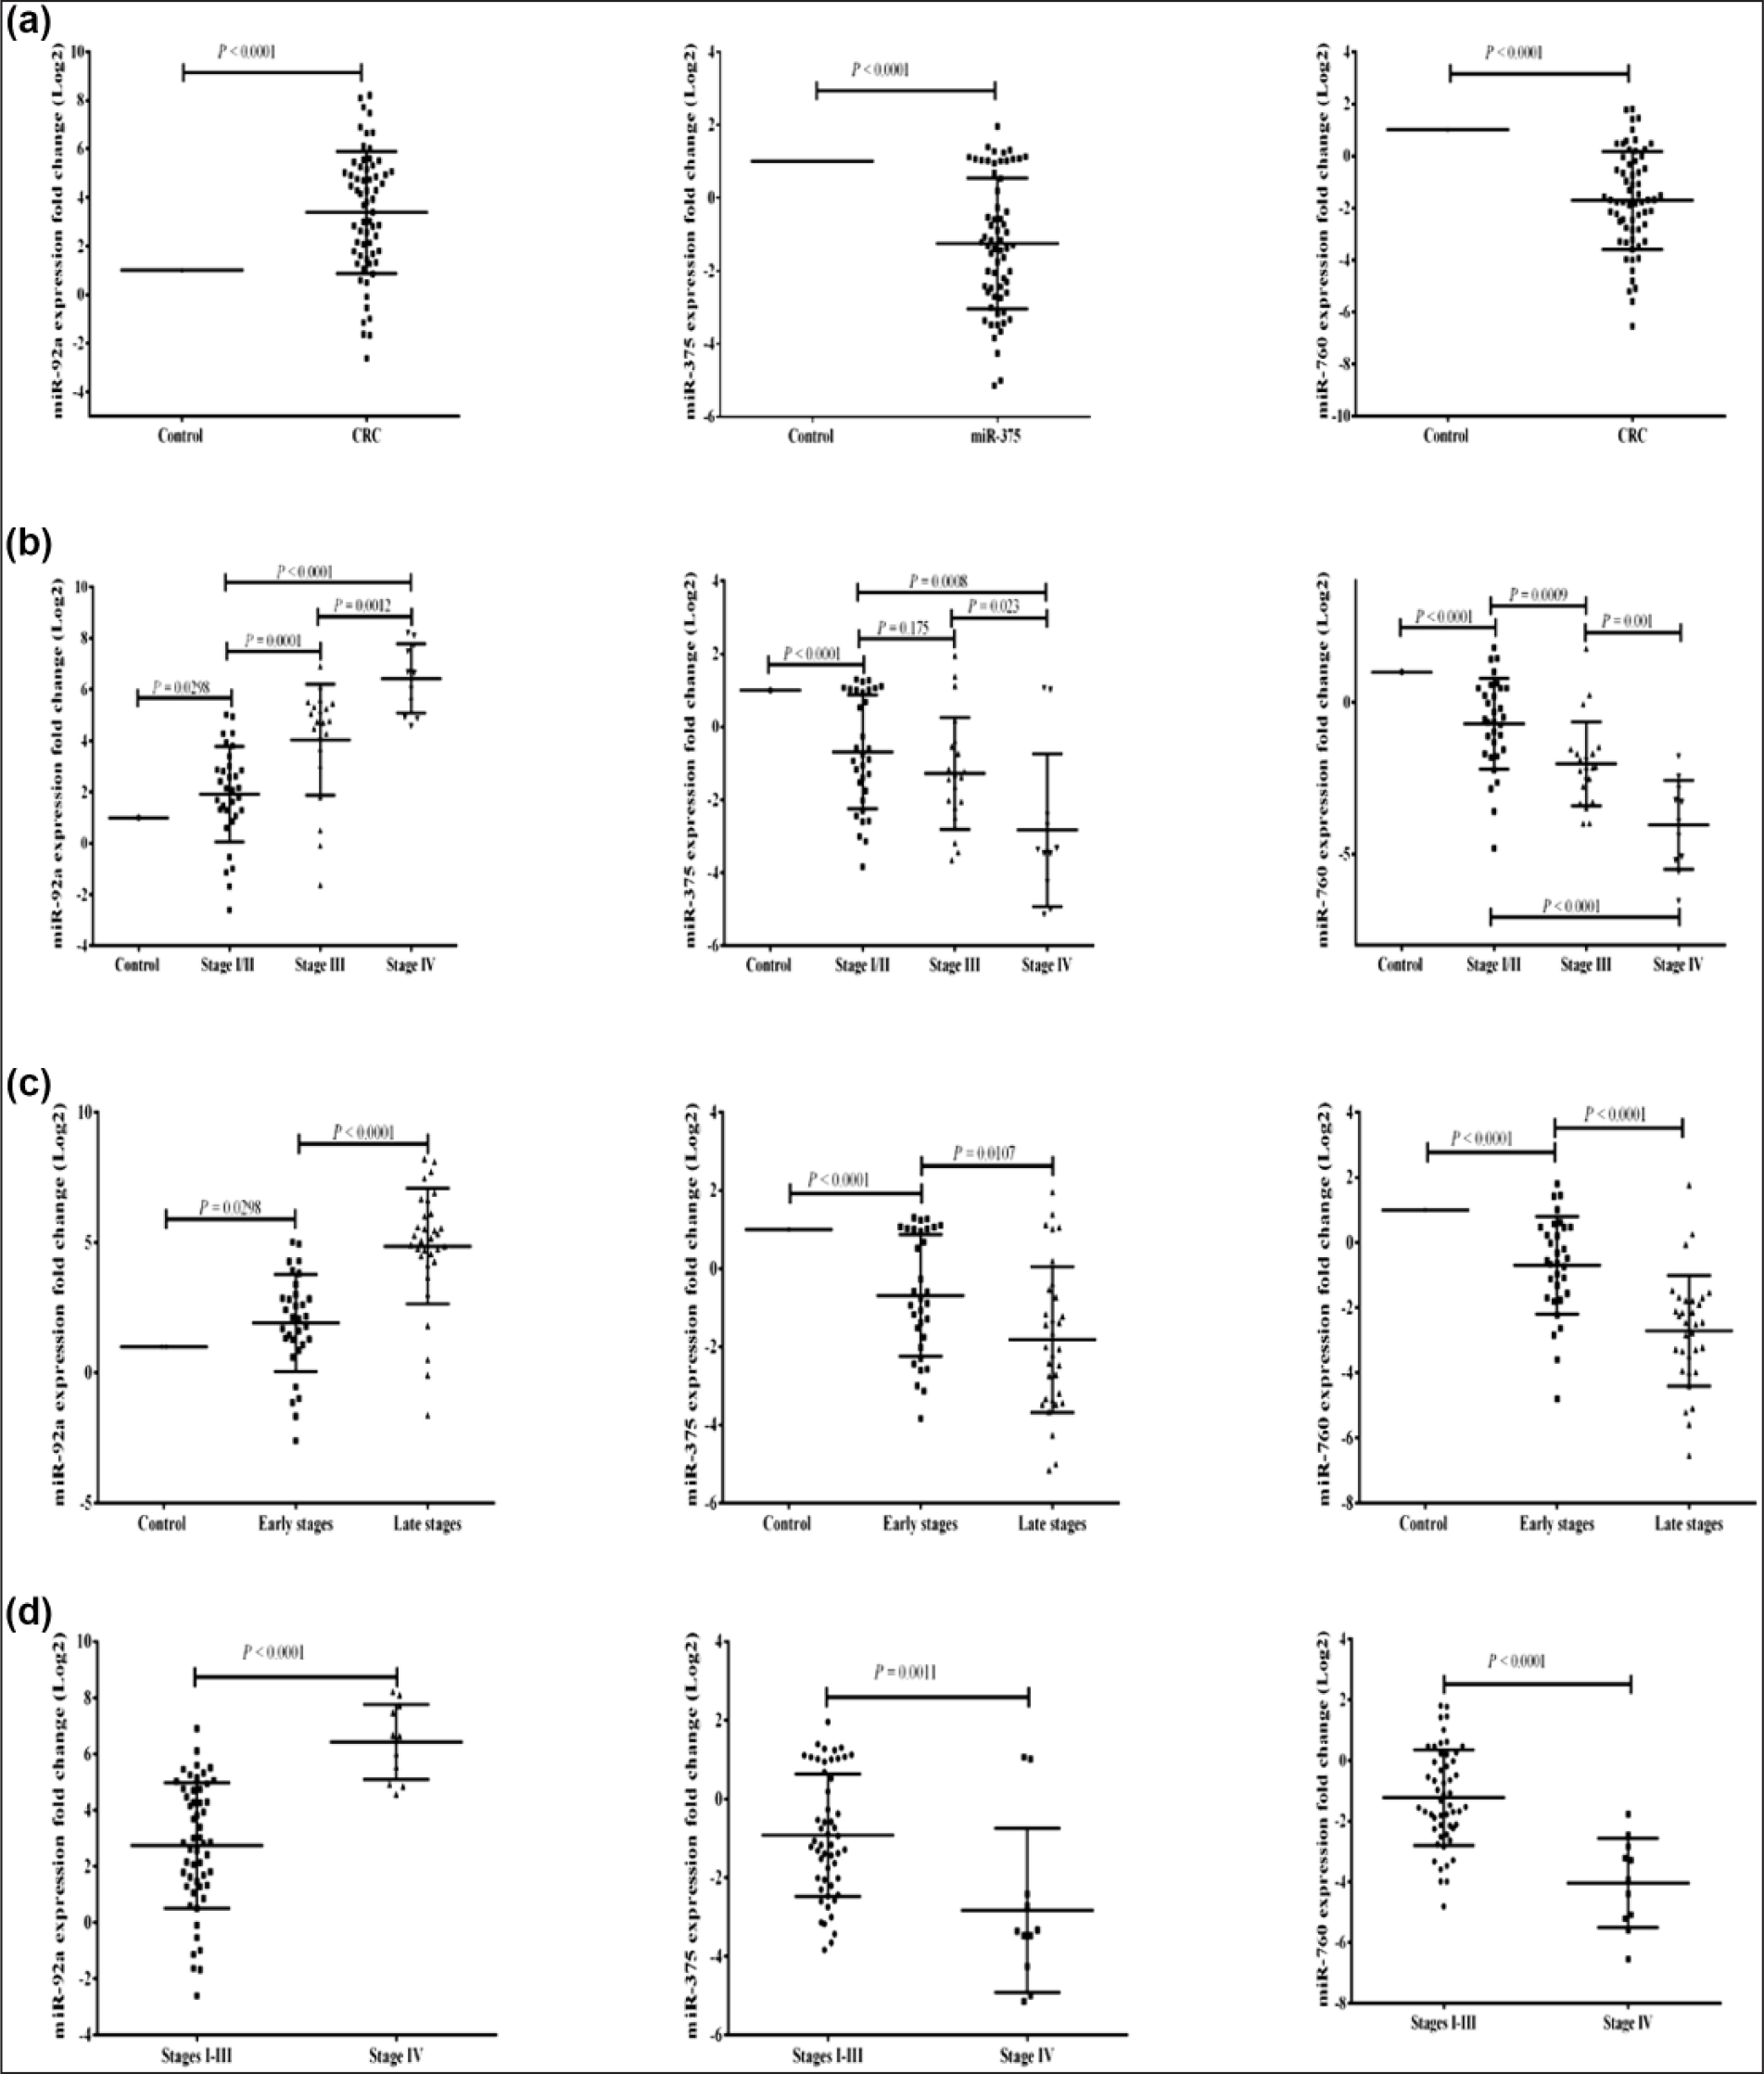
The expression pattern of serum-selected miRNAs. The expression fold change of miR-92a, miR-375, and miR-760 in CRC patients in (a) comparison to control, (b) comparison among CRC stages, (c) comparison between early- and late-stage CRC, and (d) comparison between stages I–III and stage IV. More details are listed in Table 1.
There was a statistically significant gradual increase in expression pattern of miR-92a among CRC patients’ stages. The highest expression pattern was in stage IV patients (6.43 ± 1.34) with great significance from stages I/II and III (p < 0.0001 and 0.0012, respectively).
Despite the gradual decrease in the expression pattern of miR-375 among CRC stages, there was no statistical differences in the expression between stages I/II and III (p = 0.175), while stage IV was the most downregulated group (−2.830 ± 2.09) with great statistical significance from stage I/II (p = 0.0008) and less statistical significance from stage III group (p = 0.023).
The most significant statistical differences in the expression pattern between CRC groups were found with miR-760 with significant gradual downregulation. Stage IV was the most downregulated group (−4.03 ± 1.47) than stages I/II and III (p < 0.0001 and 0.001, respectively).
The diagnostic and prognostic values of the investigated miRNAs
The diagnostic validity of the targeted miRNAs to differentiate between CRC patients and normal subjects was calculated using ROC curve analysis. Also, it was used to find the prognostic potential via the ability of these miRNA to discriminate the different stages of CRC (Table 3 and Figures 2 and 3).
The diagnostic accuracy of the targeted miRNAs in CRC diagnosis and stage discrimination.
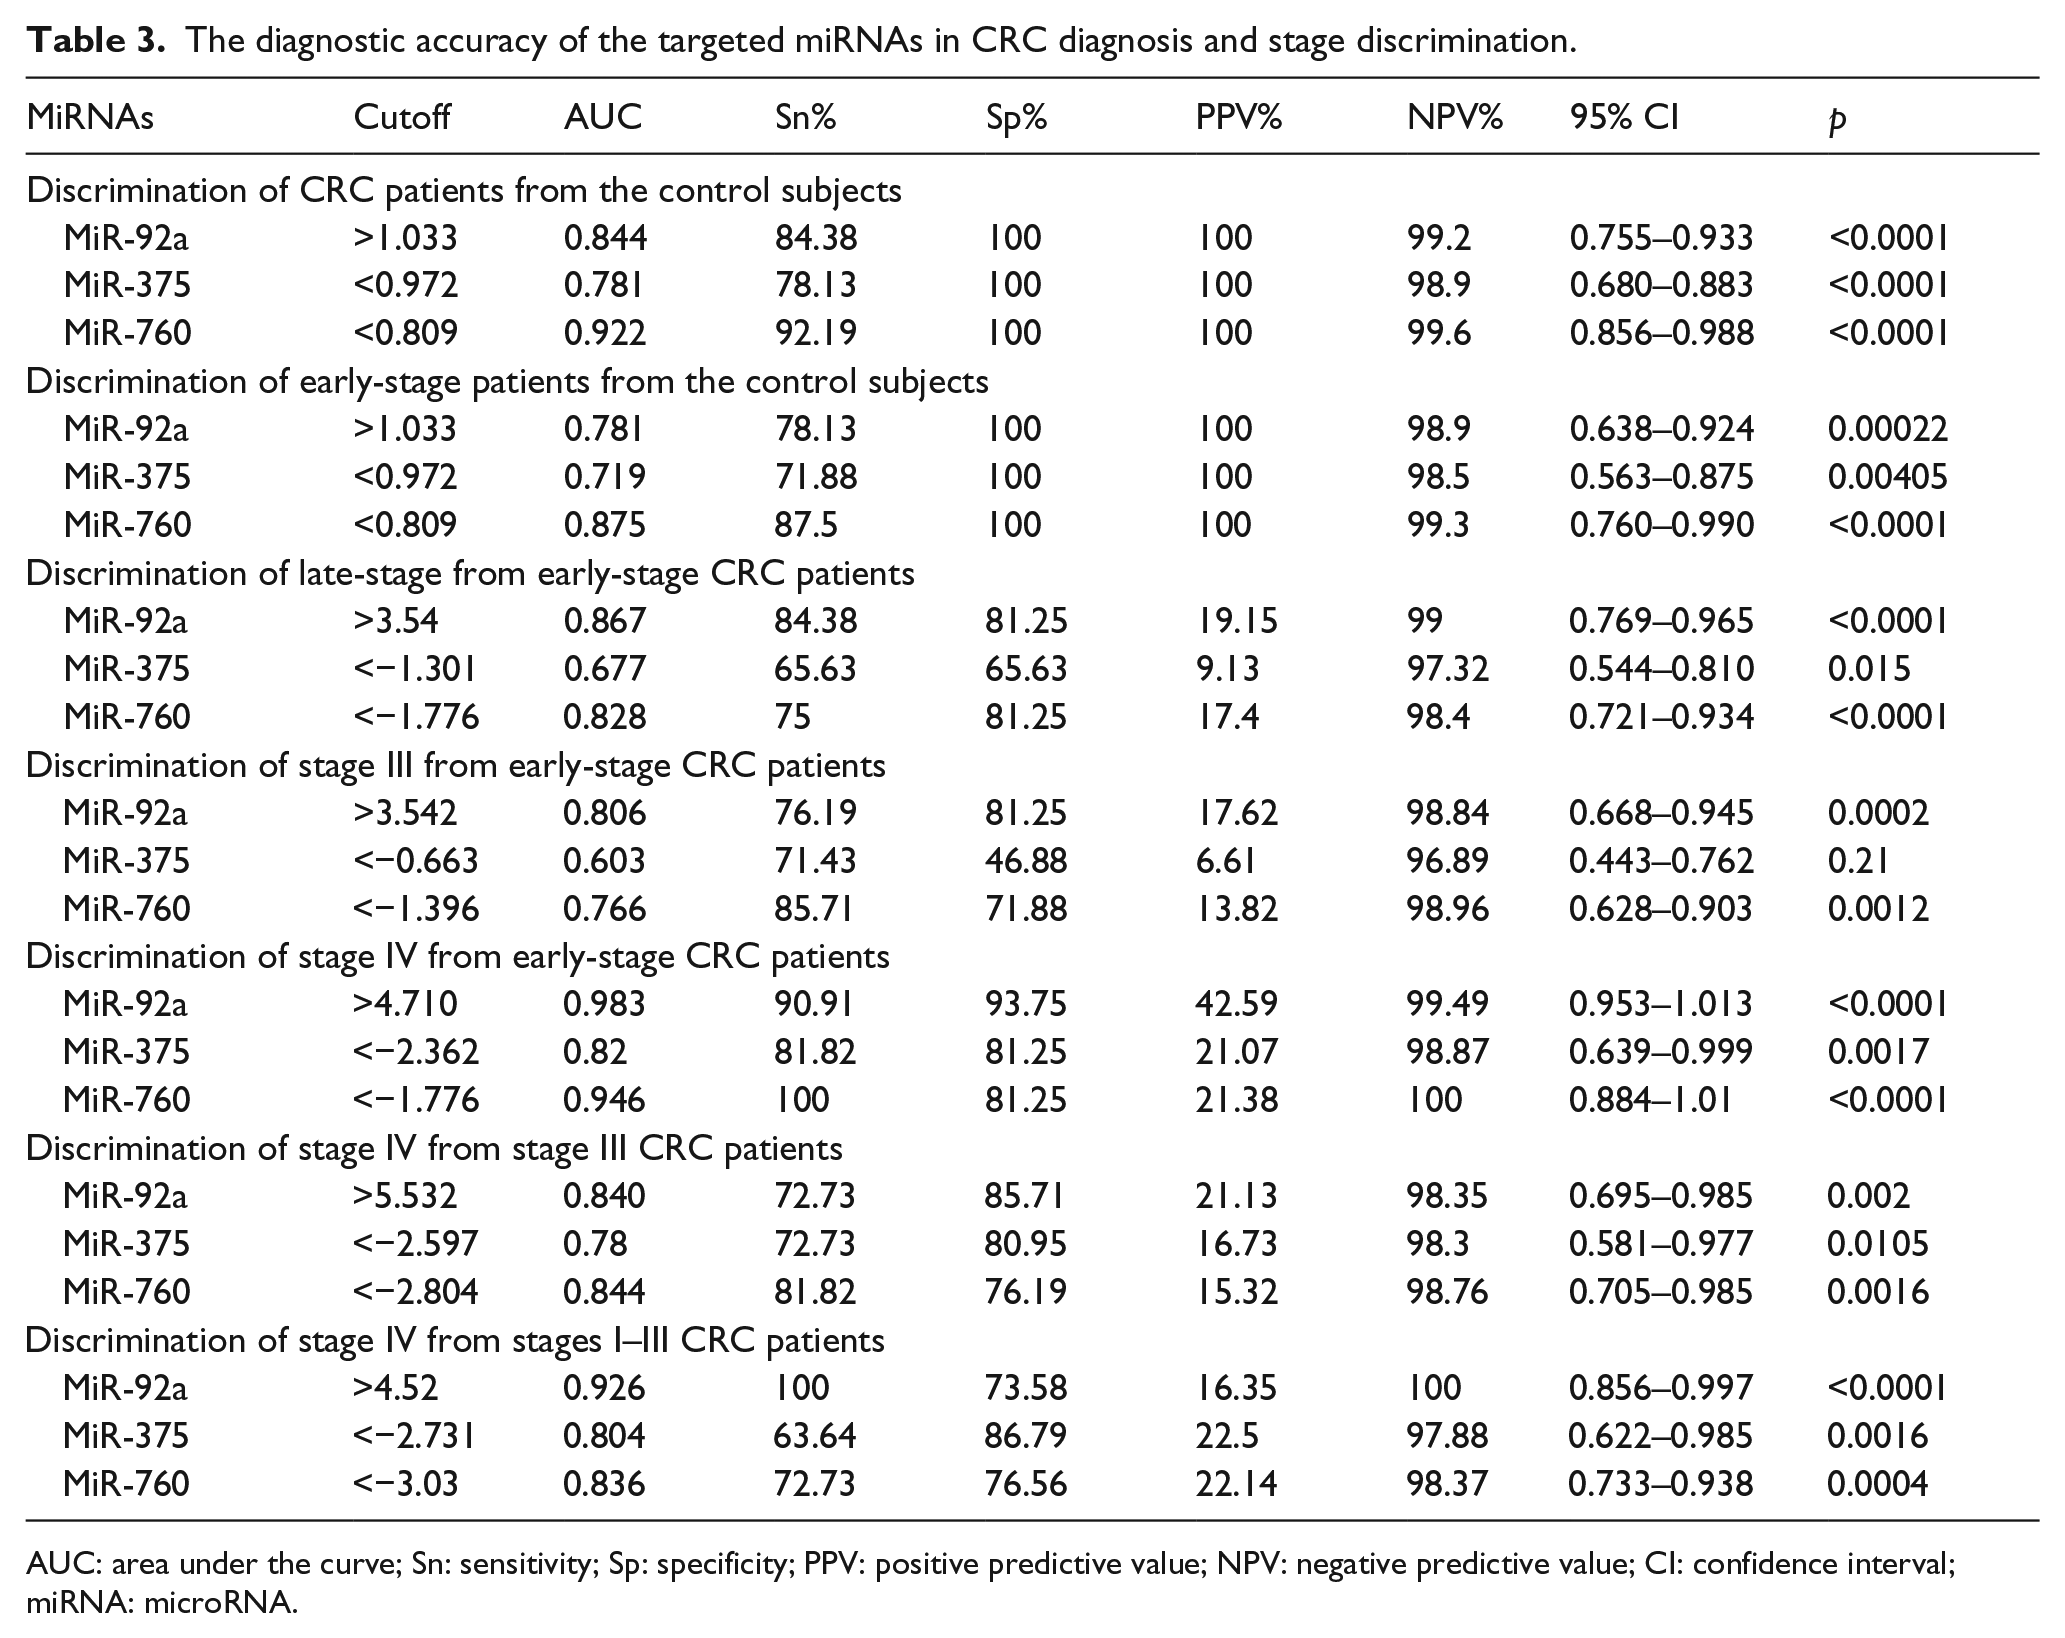
AUC: area under the curve; Sn: sensitivity; Sp: specificity; PPV: positive predictive value; NPV: negative predictive value; CI: confidence interval; miRNA: microRNA.

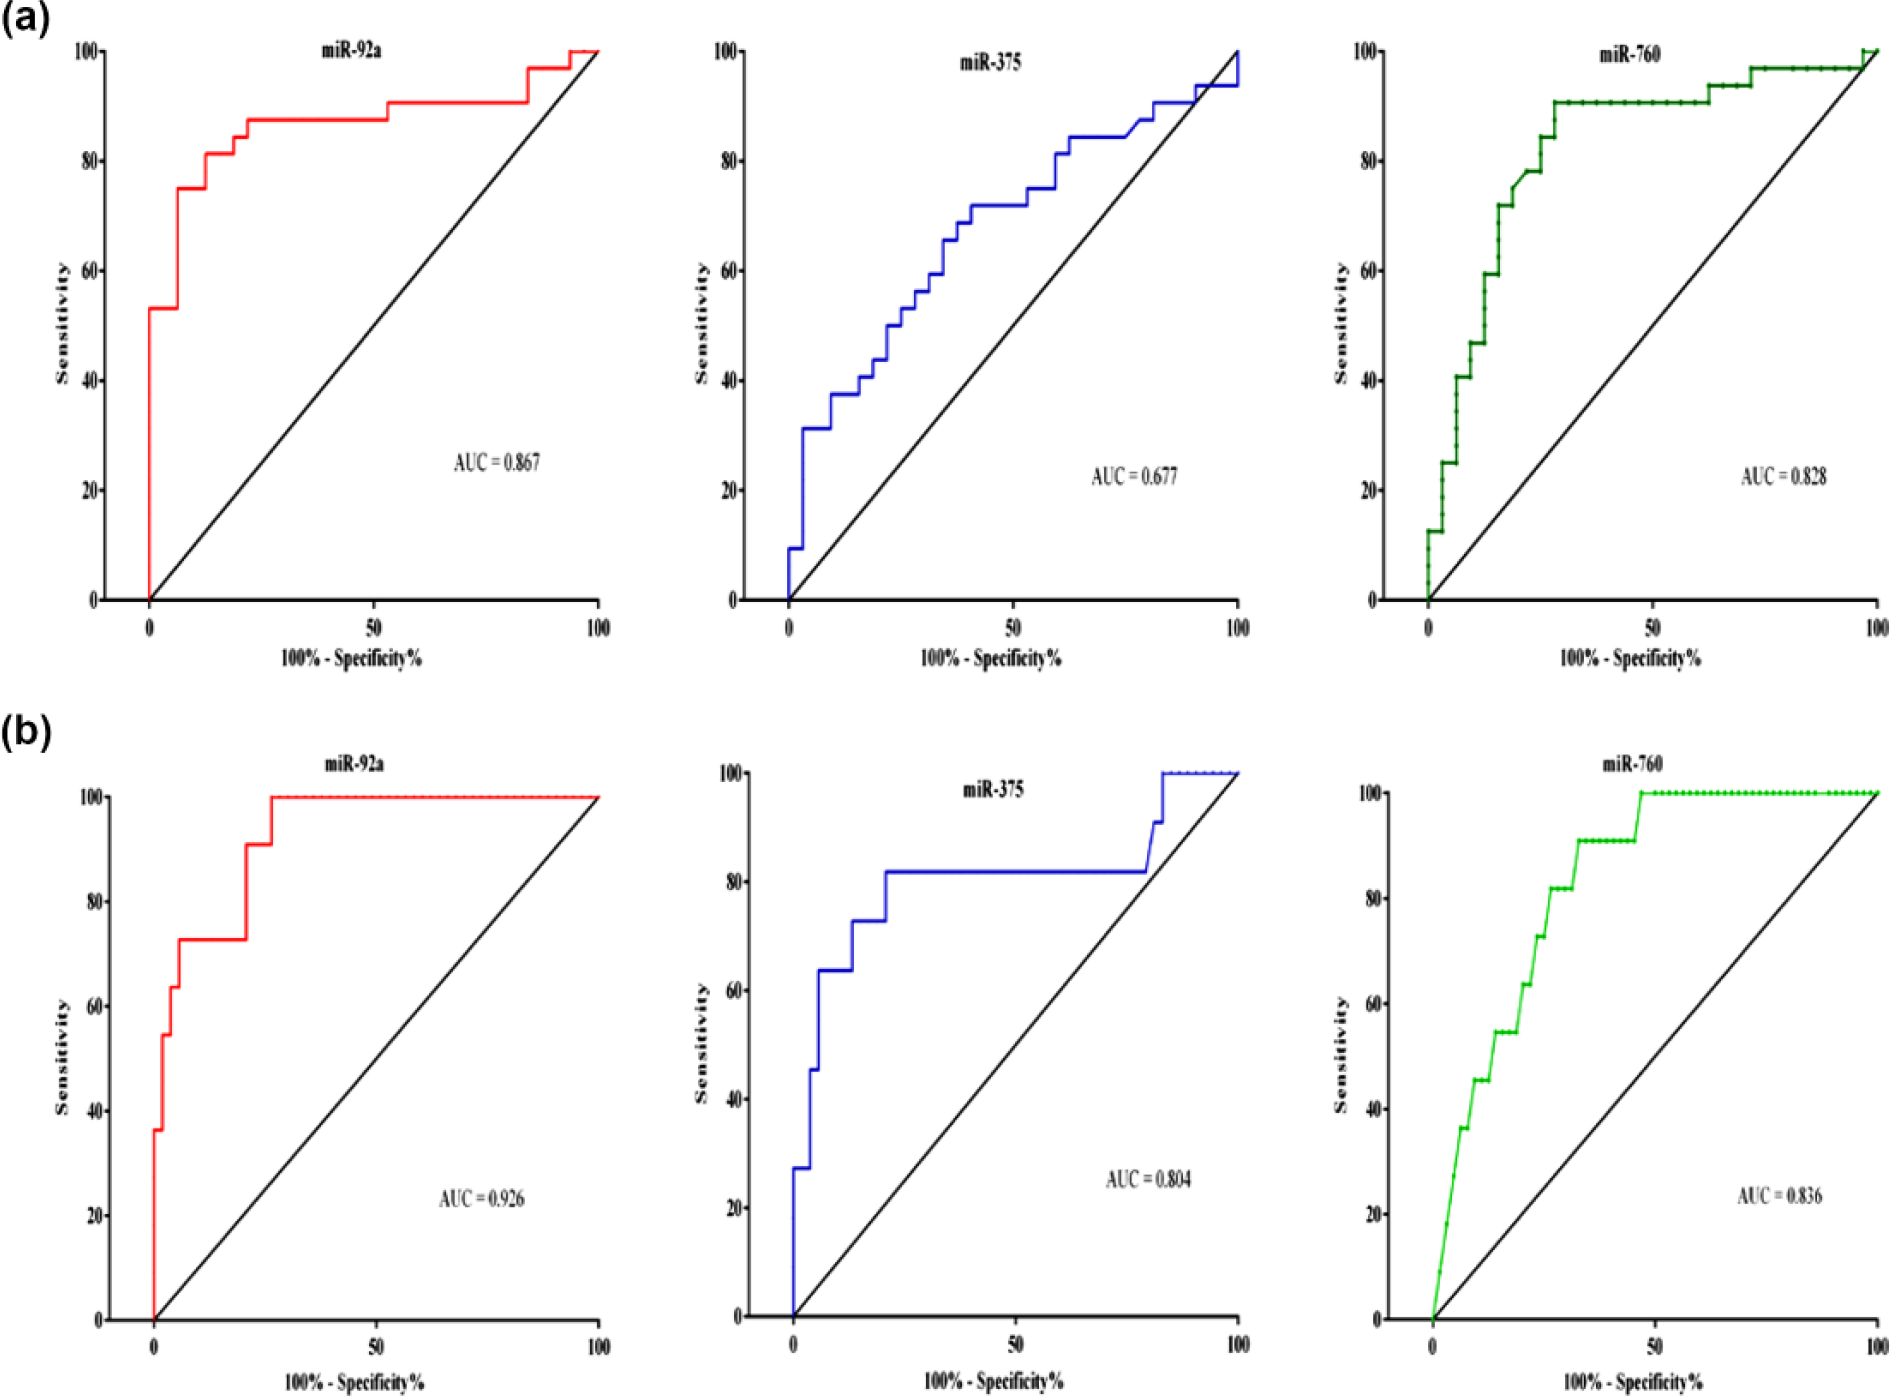
ROC curve analysis for the diagnostic value of serum-selected miRNAs. (a) ROC curve analysis for the diagnostic ability of miR-92a, miR-375, and miR-760 to discriminate between CRC patients and control subjects. (b) ROC curve analysis for the early-stage CRC differentiation from control subjects.
ROC curve analysis for the prognostic value of serum-selected miRNAs. (a) ROC curve analysis for the prognostic impact of miR-92a, miR-375, and miR-760 to discriminate between late and early CRC. (b) ROC curve analysis for the distant metastatic (stage IV) CRC differentiation from other stages.
MiR-760 showed the highest diagnostic accuracy for CRC diagnosis from control subjects (AUC = 0.92.19; Sn = 92.19%) and for detection of early-stage patients (AUC = 0.875; Sn = 87.5%), while miR-92a showed the highest diagnostic accuracy in staging and discrimination between CRC groups. It could discriminate late stages (III and IV) from early-stage patients (AUC = 0.86.7; Sn = 84.38%), stage III patients from early stages (AUC = 0.806; Sn = 76.19%), stage IV patients from early stages (AUC = 0.983; Sn = 90.91%), and stage IV from non-distant metastatic patients (stages I–III; AUC = 0.926; Sn = 100%).
For discrimination between stage IV and stage III patients, there was a similar diagnostic accuracy for both miR-92a and miR-760 (AUC = 0.84) with more sensitivity for miR-760 (81.82%), while more specificity for miR-92a (85.71%). The least diagnostic accuracy for diagnosis and patient staging was detected for miR-375 in comparison to miR-92a and miR-760.
Correlation coefficient between the investigated miRNAs
Pearson’s linear correlation coefficient was performed to assess the strength of linear correlation between the expression FC of miR-92a, miR-375, and miR-760 in CRC patients, where there was no significant linear correlation between miR-92a expression and miR-375 (r = −0.179 at p = 0.032) and also miR-760 (r = −0.185 at p = 0.1425). A significant positive correlation was found between miR-375 and miR-760 expression FC (r = 0.588 at p < 0.0001). No significant association was found between any of the studied miRNAs and the clinicopathological findings of CRC patients, except with stage development (Table 4).
Pearson correlation coefficient between the studied miRNAs and patients’ characteristics.

Significant linear correlation at p< 0.05 (two-tailed).
Discussion
CRC is the most common gastrointestinal neoplasm and the third cancer in mortality rates. 2 In Egypt, CRC has a great incidence among patients undergoing colonoscopic screening, with high rate in young patients (30% in patients < 40 years). 46 The 5-year survival rate for early diagnosed CRC cases is 90%, but approximately 14% only of CRC cases are early diagnosed. 47 So, there is an indeed need for a non-invasive biomarker with good diagnostic and prognostic potential.
The mean age of the enrolled patients was 51.4 years, and 28.125% of them were younger than 40 years. The increase in CRC incidence in young population is a characteristic demographic pattern for Egyptian CRC patients.4,46,48,49 This increase in the incidence may be secondary to westernization of the dietary pattern and changes in the life style.46,49 The major location for the diagnosed cases was colonic (71.9%), but regarding the colorectal anatomy, most of the cases were left-sided (56.25%) carcinomas which is in accordance with other Egyptian studies.4,46,48,49
MiRNAs are a class of regulating, non-protein-coding RNAs, with crucial impact on post-transcriptional regulation of gene expression of protein-coding genes, inducing a state of gene silencing. 50 A single short 18–22 nucleotides miRNA can regulate the expression of multiple messenger RNAs (mRNAs) through binding with 3′-untranslated region of the targeted protein-coding mRNA. It is thought that miRNAs can regulate up to 60% of total human protein producing transcriptome. 51 An aberrant expression of miRNAs has been reported to be involved in initiation, development, progression, angiogenesis, and metastasis of CRC because they can act as oncogenes, tumor suppressors, or mixed functions. 52 Secondary to their abundancy and stability in biofluids, they opened a new window in CRC research for diagnostic and prognostic purposes as non-invasive biomarkers. The aim of our work was to investigate the expression behavior of circulating miRNAs, their association with cancer progression, and their diagnostic and prognostic power in CRC early identification and staging.
MiR-92a is the most transcriptionally active product between the six products of the polycistronic miR-17-92 cluster, with a key oncogenic role in cancer.53,54 Several studies have reported the overexpression of miR-92a in many cancers such as leukemia, 11 breast, 12 hepatocellular, 13 and lung carcinomas, 55 as well as cardiovascular diseases. 56
In this study, no association or significant difference in serum miR-92a expression regarding patients’ age, gender, and tumor location was reported, which was in agreement with findings of Liu et al. 20 and Zhou et al. 22 Also, a strong positive correlation was found between miR-92a expression FC and stages of CRC patients. MiR-92a expression was found to be most frequently upregulated in comparison to control subjects with gradual increase in expression FC with lymph node involvement (stage III) and maximal increase with distant metastasis (stage IV), revealing its possible implication in CRC carcinogenesis and metastasis and its good potential for prognostic use as a non-invasive biomarker. Our findings were consistent with other previous studies.17–22
To investigate the diagnostic potential of miR-92a, the ROC curve was constructed, yielding a diagnostic accuracy (AUC = 84.4%) with sensitivity 84.38% in distinguishing CRC cases from control subjects which was close to the results of other studies.18,57,58 It showed a promising prognostic value in CRC staging due to its good ability to discriminate between the different stages of CRC.
Based on the fact that single miRNA can regulate a panel of protein-coding mRNAs, miR-92a was thought to be an oncogenic miRNA and assumed to exert its action via targeting multiple tumor-suppressing mRNAs in different signaling pathways affecting cell survival, apoptosis, proliferation, and angiogenesis.
The first targeted pathway for miR-92a in CRC pathogenesis is the phosphatidylinositol-3 kinase/protein kinase B (PI3K/Akt) pathway through targeting the mRNA of the inhibitory enzyme; phosphatase and tensin homolog (PTEN) which blocks PI3K/Akt pathway in normal conditions, resulting in an endless oncogenic signaling to promote epithelial–mesenchymal transition (EMT) in the colonic mucosa—which is a critical molecular step in tumorigenesis of the invasive phenotype of CRC—and further progression in cell proliferation and angiogenesis.19,55,59
Another reported target for miR-92a is the pro-apoptotic B-cell lymphoma 2 like 11 protein (BCL2L11) mRNA, which is also known as BCL2 interacting mediator of cell death (BIM) which interacts with the anti-apoptotic protein BCL2 to suppress the cell cycle. Its repression relives its tumor-suppressing action and thought to have an important role in enhanced angiogenesis and proliferation in CRC.27,60–62
The zinc finger transcription factor Krüppel-like factor 4 (KLF4) has crucial role in controlling the differentiation and proliferation of cells due to its bi-functional ability to be tumor suppressor or oncogenic protein according to the tissue in which it will be expressed. 63 Its expression was known to be downregulated in CRC and associated with early events of carcinogenesis. 64 Aberrant KLF4 expression was reported as well in CRC metastasis via regulation of matrix metalloproteinase 2 (MMP2) and E-cadherin expression. 65 In a recent cell-line-based study, Lv et al. 66 provided KLF4 mRNA as a novel direct target for miR-92a to negatively regulate KLF4 expression and consequently its downstream effector tumor suppressor protein p21.
The previously mentioned target genes for miR-92a may explain the underlying mechanisms beyond the role of miR-92a in CRC initiation, angiogenesis, progression, and metastasis and may answer why more miR-92a overexpression is strongly associated with poor prognosis.
While our results were promising and in agreement with the results of others, some conflicting studies concluded the lack of clinical value of miR-92a in CRC.23–27 These contrary results may be due to different reasons: first, the type of specimen such as whole blood, plasma, serum, and tissue may show different expression pattern. Regarding plasma, whole blood, and serum as samples, there is no enough data correlating the expression level in theses samples.3,67 Second, sample collection, processing, and total RNA extraction kit efficiency may result in controversies in miRNA expression.51,52 A third factor that should be considered is the internal control gene that will be used for data normalization. Until now, there is no consensus regarding selection of a standard internal control gene. Some studies utilized a spike in control genes to avoid the variabilities in internal control gene expression.24,68,69 Fourth, the technique used for miRNA detection and quantitation should be considered as the miRNAs differ in their sensitivities, as well as the data evaluation and interpretation methods.67,70 Fifth factor is the difference in ethnicity of subjects enrolled in these studies as most of the performed studies were carried out on Asian (Mongolian) race subjects, while few investigated the same miRNA in other ethnic people.23–25
In 2004, Poy et al. 28 identified miR-375 as a pancreatic β-cell-specific miRNA, regulating insulin secretion. Further studies confirmed the role of miR-375 in pancreatic β-cell genesis, maturation, and modulation of insulin release.71,72 However, multiple studies denoted to the association of miR-375 with non-pancreatic tissues and its predominant downregulation in the expression manner in many cancers such as hepatocellular, 29 esophageal squamous cells, 30 gastric, 31 head and neck, 73 non-small-cell lung 32 and cervical 74 carcinomas and brain glioma. 33 Like other miRNAs, despite the predominant downregulation in most of the cancers, it was reported to be upregulated and to be oncomiR in breast 35 and prostate 34 cancers.
The expression pattern of miR-375 in CRC patients in this study was significantly under-expressed in comparison to control subjects, which confirmed the other findings in tissue36–41 and plasma 42 as a frequent picture in CRC without significant correlation with patients’ characteristics and tumor location. But we reported a gradual underexpression in serum miR-375 with development of CRC stages to be the lowest with stage IV cases which was in accordance with Mao et al.’s 39 observation.
The tumor suppressor effect of miR-375 was thought to be attributed to its antiproliferative and pro-apoptotic action. As antiproliferative modulator, miR-375 inhibits genes of different signaling pathways involved in CRC metastasis. One of these pathways is the PI3K/Akt pathway, where Wang et al. 40 found PIK3CA gene encoding the catalytic p110a subunit of PI3K as a target for miR-375, resulting in disruption of PI3K/Akt signaling.
Mutation in Wnt/β-catenin signaling has been associated with 90% of CRC with prediction of poor survival and more aggression. 75 Frizzled receptors are upstream receptors mediating the signaling of Wnt/β-catenin pathway. A recent study presented Frizzled-8 (FZD-8) receptor gene as another substrate for the inhibitory action of miR-375. 41 Furthermore, Cui et al. 76 detected the ability of miR-375 to inhibit the process of EMT and its consecutive CRC invasiveness. This action was thought to be exerted by targeting EMT-related genes such as matrix metalloproteinase 2 (MMP2), vimentin, E-cadherin, N-cadherin, snail, and β-catenin.
On the other side, miR-375 exhibited an antiproliferative effect in CRC through enhancing the pro-apoptotic protein BCL2. This action may be mediated either indirectly via inhibition of yes-associated protein-1 (YAP-1) which has repressive action on BCL2 36 or directly through upregulating the expression level of the pro-apoptotic protein BCL2. 75 Based on these targeted genes and their related regulatory pathways, miR-375 may be a predictor of CRC aggression and higher mortality potential.
Among the studied miRNAs, miR-760 has the least research concern in oncology. Owing to the insufficient studies about circulating miR-760 in CRC, it gets our interest to investigate its expression behavior and diagnostic and prognostic potentials in CRC sera. We found two studies carried out on circulating miR-760 that indicated its significant downexpression in CRC patients and being a tumor suppressor miRNA, which was consistent with our results.43,44 No significant correlation was found between miR-760 expression modality and patients’ demographics and tumor location, which was in accordance with Wang et al. 43
The mechanisms beyond the tumor suppressor action of miR-760 in CRC are not fully clarified. Two in vitro studies proposed the molecular target of miR-760 in CRC. Kim et al. 77 reported the inhibitory action of miR-760 on the expression of the catalytic (α) subunit of protein kinase casein kinase 2 (CK2) through targeting the 3′ end of its mRNA. CK2 is a serine/threonine kinase that phosphorylates wide range of cytoplasmic and nuclear proteins. It’s overexpression was found to be involved in carcinogenesis and prevention of apoptosis. 78 So, suppression of its catalytic unit by miR-760 results in inhibition of tumorigenesis and induction of apoptosis.
Li et al. 44 identified transforming growth factor-β (TGF-β)/SMAD-3 pathway as another target for miR-760 through targeting SMAD-3 mRNA. SMAD-3 is one of the SMAD transcription factors which are downstream mediators of TGF-β cytokine superfamily signaling which is critical in cancer development. 79 These two mechanisms may explain the inhibitory action of miR-760 on CRC development and progression.
In the light of ROC curve analysis to identify the diagnostic and prognostic validity of the three studied miRNAs, miR-760 presented the best diagnostic potential because it showed the highest diagnostic accuracy for CRC patients from control subjects (AUC = 0.922, Sn = 92.19%) and highest ability to diagnose early-stage cases (stage I/II) from control subjects (AUC = 0.875, Sn = 87.5%). The prognostic power of miR-92a was obvious in distinguishing the different stages of CRC. It could discriminate late-stage (III–IV) from early-stage (I–II) cases (AUC = 0.867, Sn = 84.38%), stage III from early stages with higher accuracy and specificity but lower sensitivity than miR-760 (AUC = 0.806, Sn = 76.19%), and distant metastatic (stage IV) CRC from early stages (AUC = 0.983, Sn = 90.91%) and non-distant metastatic (stages I–III) cases (AUC = 0.926, Sn = 100%). For differentiation between stage IV and III, both of miR-92a and miR-760 exhibited the same AUC (0.84), but miR-760 was more sensitive (81.82%), while miR-92a showed higher specificity (85.71%). MiR-375 showed no diagnostic or prognostic potential superior or nearly comparable to the other miRNAs. Hence, miR-760 and miR-92a may be promising circulating biomarkers for early CRC diagnosis and diseases prognosis, respectively.
The definitive causes for dysregulation of miRNAs expression in cancers are not completely understood. Most of miRNAs genes (>50%) are located in fragile chromosomal loci which are cancer-associated genomic regions characterized by high chromosomal instability (gene deletion, amplification, translocation, and rearrangement). In addition, single-nucleotide polymorphisms (SNPs) in miRNAs’ genes or their target genes have been also identified. Other epigenetic, transcriptional, and post-transcriptional processing (maturation) of miRNAs are involved in their aberrant expression in cancers.80–82
Some limitations should be considered when interpreting this study results. First, the sample size of the selected patients is not large enough to give a bigger picture about the variability in the expression pattern of the studied miRNAs. So, further larger sample studies are recommended to verify these findings in Egyptian populations. Second, there is an inconsistency in the type of endogenous HK (control) gene. Third, the selected miRNAs were based on the scientific literature, and other miRNAs may be more prominently dysregulated in Egyptian ethnics. Fourth, the investigated miRNAs were only assessed in sera of CRC patients without matching with tissue samples to ensure the origin of miRNA expression and release as well as matching the expression pattern in both sera and tissues.
Regarding Egyptian population, as the best to our knowledge, this was the first serum-based study to determine the expression model of both miR-375 and miR-760. Generally, this study presented miR-375 as serum biomarker for the first time. Also, we presented a picture regarding the expression profile of these miRNAs in CRC patients of different race in comparison to other studies.
In conclusion, our study unveiled the significant overexpression of miR-92a and underexpression of both miR-375 and miR-760 in the serum of CRC patients and their association with stage development. MiR-760 showed higher diagnostic power for early detection of CRC, while miR-92 was the best in discriminating the different stages of CRC with great prognostic value. These results may promote the use of miRNAs as novel blood-based biomarkers for CRC clinical diagnosis and follow-up.
Footnotes
Declaration of conflicting interests
The author(s) declared no potential conflicts of interest with respect to the research, authorship, and/or publication of this article.
Funding
The author(s) received no financial support for the research, authorship, and/or publication of this article.