
Abstract
Background:
The THBS gene family plays key functions in various diseases; however, its specific roles in colorectal cancer (CRC) have not been systematically characterized.
Methods:
Multi-omics data and online databases were used to analyze the mRNA expression levels of the THBS gene family in CRC and their correlations with clinicopathological features and survival. This analysis identified THBS3 as a potential oncogene closely linked with CRC progression. Then, the relationship between THBS3 expression and the immune landscape was assessed. Single-cell RNA sequencing analyzed THBS3 distribution in CRC subtypes. Additionally, GO, KEGG, and GSEA enrichment analyses investigated the mechanisms of THBS3 in CRC. Molecular docking identified anticancer compounds with high affinity for THBS3. Lastly, in vitro experiments examined THBS3’s function in CRC.
Results:
THBS3 was significantly upregulated in CRC and correlated with poor prognosis. Elevated THBS3 correlated with increased infiltration of M2 macrophages and regulatory T cells (Treg cells), as well as higher expression of immune checkpoint molecules, suggesting its role in shaping an immunosuppressive microenvironment. THBS3 promoted CRC cell proliferation and metastasis, through activation of the PI3K-AKT and EMT pathways.
Conclusion:
THBS3 facilitates the progression of CRC and may serve as a novel prognostic biomarker and therapeutic target.
Introduction
Colorectal cancer (CRC) is the second leading cause of cancer-related mortality and the third most commonly diagnosed malignancy worldwide. 1 Accumulating evidence has demonstrated that the carcinogenesis and progression of CRC are typically accompanied by significant dysregulation in gene expression and a high mutational burden. 2 The growing emphasis on precision genomic medicine, along with the clinical application of next-generation sequencing, is uncovering an extensive array of molecular biomarkers. For instance, BRAF activating mutations and Mismatch repair (MMR) status can predict responses to therapies and patient prognosis in CRC.3,4 However, current findings remain insufficient; thus, there exists an unmet medical need to explore additional diagnostic, prognostic, and therapeutic biomarkers with greater specificity and clinical utility for CRC.
The thrombospondin (TSP or THBS) gene family comprises 5 extracellular matrix (ECM) proteins: thrombospondin 1 (THBS1), thrombospondin 2 (THBS2), thrombospondin 3 (THBS3), thrombospondin 4 (THBS4), and cartilage oligomeric matrix protein (COMP, also referred to as THBS5). 5 THBS genes (THBSs) are evolutionarily conserved calcium-binding glycoproteins that possess multiple receptor-binding domains. These ligands exert their respective functions by interacting with distinct domains. 6 Recent studies have increasingly indicated that THBS is involved in angiogenesis and the regulation of the immune microenvironment, in addition to being closely linked with the prognosis of CRC.7 -9 Specifically, THBS1 is upregulated in CRC and correlates with poor tumor outcomes and immune suppression. 10 Moreover, high levels of THBS2 promote cell proliferation, migration, and invasion, via activating the Wnt/β-catenin pathway in CRC. 11 Currently, reports on THBS3 are limited in CRC. Preliminary investigations suggest its potential relevance to the prognosis of clear cell renal carcinoma. 12 THBS4 has been shown to interact with PDGFRβ to enhance progression in CRC. 13 Additionally, COMP was found to promote M2 macrophage infiltration while inhibiting CD8+ T cells and anti-tumor responses, thereby affecting treatment efficacy in CRC. 14 Despite these findings, systematic and comprehensive investigations into the roles and mechanisms of the THBS gene family in CRC are still lacking. Therefore, further extensive research is needed to clarify the prognostic value of the THBS gene family and its influence on CRC development.
In this study, we analyzed the THBS gene family using multi-omics data to assess its expression levels in CRC and adjacent normal tissues (ANTs), and its correlation with clinicopathologic features and prognosis of CRC. We found that THBS3 is most strongly linked to disease progression and has significant prognostic value for CRC. Subsequently, we further investigated the potential cellular functions and molecular signaling pathways related to THBS3. Additionally, we analyzed its relationship with tumor immunity and the tumor microenvironment, identified its association with drug sensitivity, and calculated the affinity value. Finally, we experimentally validated the role of THBS3 in CRC. In summary, our integrative analysis and validation highlight the prognostic and immunotherapeutic significance of THBS3 in CRC, and lay an important foundation for clinical transformation.
Materials and Methods
The Flowchart of this Study
The flowchart of the comprehensive analysis of the THBSs gene family and identification of THBS3 as a novel biomarker for prognosis and immunotherapeutic response in CRC is illustrated in Figure 1.
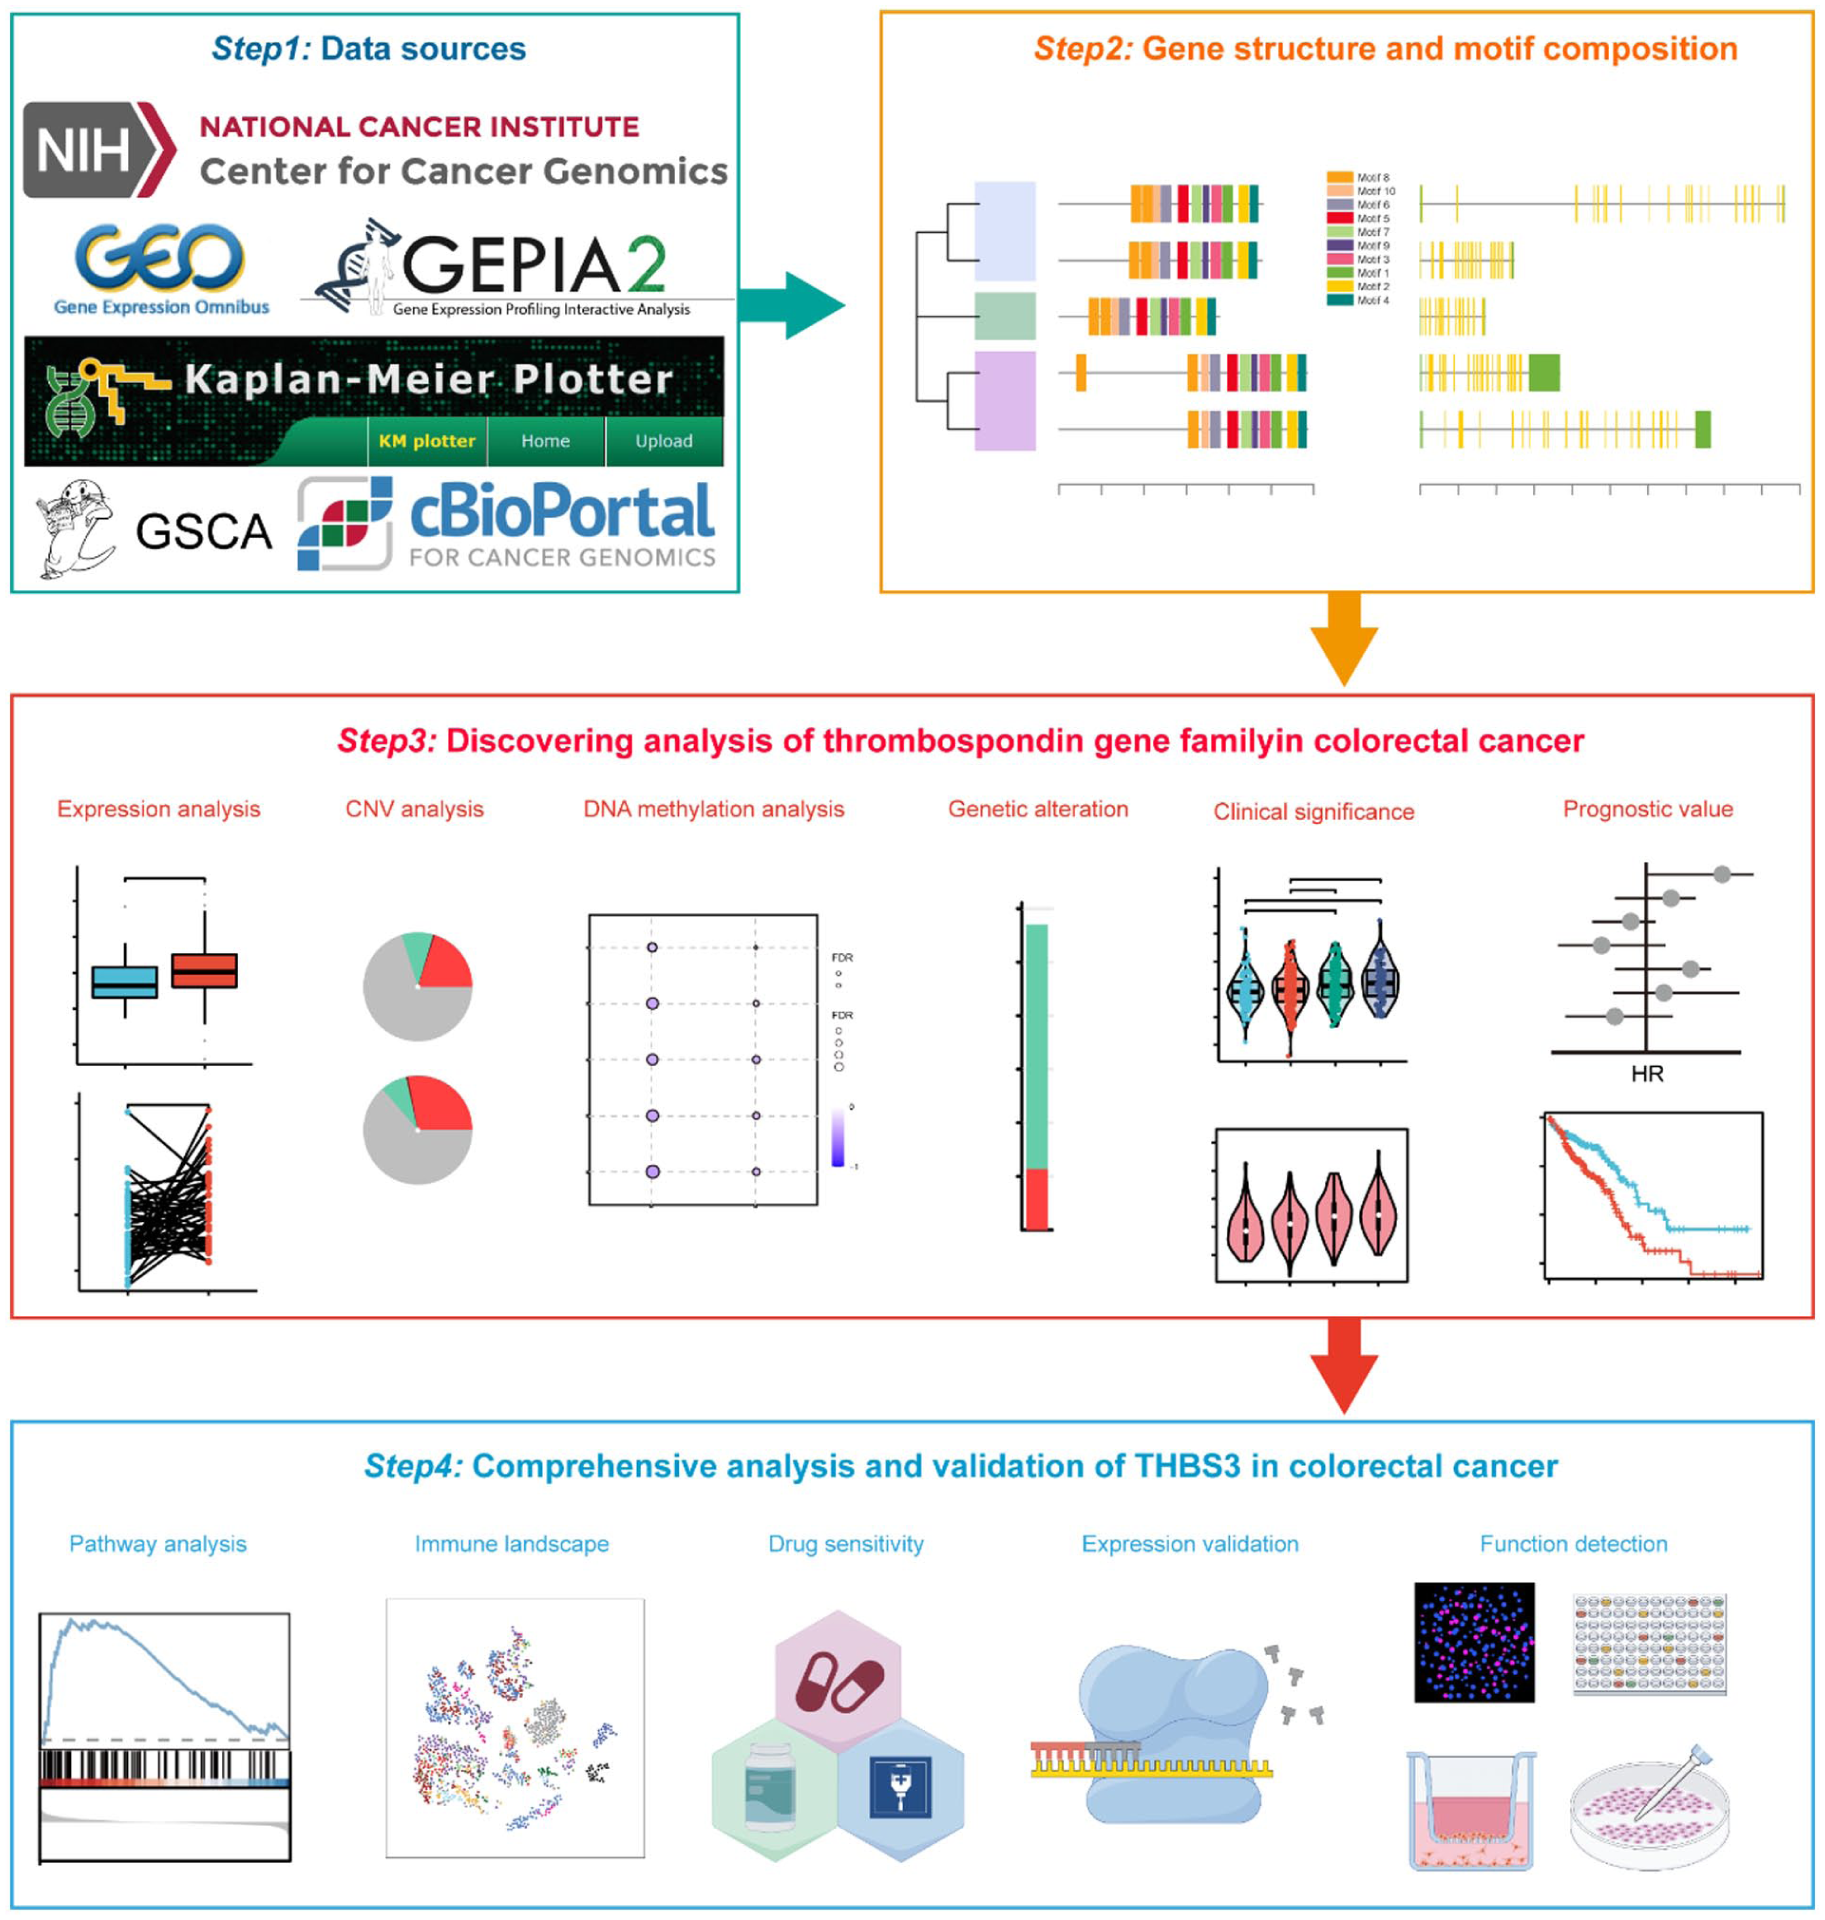
The flowchart illustrating this study. Certain images were created by Figdraw.
Analysis of the Key Characteristics of the THBS Gene Family in Homo sapiens
The phylogenetic tree of THBSs was constructed using MEGA 11.0 with the neighbor-joining (NJ) method and 1000 bootstrap replications, and visualized with the online tool TBtools. The GFF3 files (General Feature Format Version 3) were obtained from the Ensemble database (https://asia.ensembl.org/index.html) for conducting a structural analysis of THBSs. The characteristic motifs of THBSs were identified using MEME software (http://meme-suite.org/tools/meme). Additionally, TBtools were employed to analyze the gene structure of all THBSs. Moreover, the SWISS-MODEL Interactive Workshop was utilized for predicting the tertiary structure of THBS proteins.
Data Acquisition and Gene Expression Analysis
The mRNA transcriptome data, along with associated clinical information of CRC, were obtained from the TCGA (COAD and READ) database (https://portal.gdc.cancer.gov/). This dataset comprises 647 CRC tissue samples and 51 adjacent normal tissue samples. Furthermore, the GSE39582 dataset was sourced from the Gene Expression Omnibus (GEO) database (https://www.ncbi.nlm.nih.gov/geo/), which includes 566 CRC tissue samples and 19 adjacent normal tissue samples. The Wilcoxon rank sum test or t-test was employed for expression analysis utilizing the R package “ggplot2.” The reporting of this study conforms to the Reporting Recommendations for Tumor Marker Prognostic Studies (REMARK) statement of the EQUATOR Network reporting guidelines 15 (Table S6).
Clinical Significance Analysis
The Kruskal-Wallis test was used to analyze THBSs expression across different cancer TNM stages in the TCGA and GSE39582 database, and tumor N stages in the TCGA database, utilizing R packages “ggplot2.” Furthermore, the online database GEPIA 2 (http://gepia2.cancer-pku.cn/) was utilized to assess the expression levels of THBSs across groups categorized by tumor pathological stage. The Wilcoxon rank sum test was used to analyze THBSs expression across different tumor M stages in the TCGA database, utilizing R packages “ggplot2.”
Mutation and CNV Analysis of THBSs
The copy number variations (CNVs) and DNA methylation of the THBSs were analyzed using Gene Set Cancer Analysis (GSCA; https://guolab.wchscu.cn/GSCA/#/) database, which compiles tumor genome and immunogenomic data for CRC from TCGA. Additionally, the mutation frequency of THBSs in CRC was evaluated through the cBioPortal database (http://www.cbioportal.org), a comprehensive open resource tool for analyzing and visualizing cancer genomics data.
Univariate and Multivariate Cox Analysis
Univariate and multivariate Cox analyses were performed utilizing the R package “survival,” which incorporated THBSs expression, age, gender, and pathological stage.
Survival Analysis
The Kaplan–Meier (K–M) curve was generated using the R packages “survival” and “survminer” to assess the relationship between THBSs expression and CRC prognosis in the TCGA database, including Overall Survival (OS), Disease-Specific Survival (DSS), and Progression-Free Interval (PFI). Additionally, the Kaplan-Meier online database (https://kmplot.com/analysis/) was used to analyze the relationship between THBSs expression and patients’ OS, Recurrence-Free Survival (RFS), and Post-Progression Survival (PPS) in the GSE39582 dataset. The median expression value of THBS3 was utilized as the criteria for dividing patients into high and low expression groups.
Protein-Protein Interaction Network of THBS3 Analysis
The STRING database (https://string-db.org/) was used to analyze THBS3 with the protein name (“THBS3”) and organism (“Homo sapiens”). The parameters were set as follows: network type (“full STRING network”), the meaning of network edges (“evidence”), minimum interaction score (“medium confidence, 0.40”), and maximum display limit for interactors (“up to 10 interactors in the first shell”).
Gene Ontology (GO) and Kyoto Encyclopedia of Genes and Genome (KEGG) Analysis
Gene expression data for THBS3 and other mRNAs were obtained from TCGA (COAD and READ) database. Co-expressed genes with THBS3 were identified using the R package “limma” based on Pearson’s correlation coefficients (|r| > .3, P < .05). GO and KEGG analyses were performed on differentially expressed genes of THBS3 using the R packages “org.Hs.eg.db” and “clusterProfiler” to uncover potential biological functions and signaling pathways associated with THBS3.
Gene Set Enrichment Analysis (GSEA)
GSEA was conducted to identify significant functions and pathways between the high- and low-expression THBS3 groups, visualized using the R package “ggplot2.” Gene sets with adjusted P < .05 and |NES| > 1 were considered statistically significant.
Immune Characteristic Analysis
The relative abundance of immune cells was estimated using the R package “GSVA,” which integrates single-sample Gene Set Enrichment Analysis (ssGSEA). Subsequently, Immune Score, Stromal Score, and ESTIMATE Score were calculated utilizing the R package “ESTIMATE.” The TIMER2.0 database (http://timer.cistrome.org/) was employed to analyze the association between THBS3 and cancer-associated fibroblasts (CAFs), macrophages M2, and Regulatory T cells (Treg cells). Additionally, the correlation between THBS3 expression and immune checkpoints PD-1, PD-L1, and CTLA-4 in CRC was assessed via the GEPIA2 database.
Single-Cell RNA-Sequencing Analysis
The CRC_GSE166555 dataset was acquired from the Tumor Immune Single-cell Hub 2 (TISCH2; http://tisch.comp-genomics.org/home/) to investigate the distribution of THBS3 in CRC samples at a single-cell level. The analysis employed the following parameters: Gene (THBS3), Cell-type annotation (major lineages), and Cancer type (CRC cancers).
Drug Sensitivity Analysis and Molecular Docking
To investigate the drug sensitivity related to the potential therapeutic targeting of THBS3, we employed the GSCALite online database (https://guolab.wchscu.cn/GSCA/#/) to examine the correlations between THBS3 expression levels and the drug sensitivity represented by the 50% inhibitory concentration (IC50) for 39 small molecule drugs sourced from both the GDSC and CTRP databases.
In the molecular docking analysis, we identified the names, molecular weights, and 3-dimensional structures of small molecule drugs utilizing the PubChem database. Subsequently, all crystal structures were downloaded from the RCSB PDB database (https://www.rcsb.org/). The structures of THBS3 and the selected small molecule drugs were then docked using AutoDock 1.5.6 software to assess their binding interactions. The affinity value (kcal/mol) serves as an indicator of their binding strength; a lower affinity value reflects a more stable interaction between ligand and receptor. Finally, we visualized the lowest affinity for each drug using Pymol 1.8.
Human Tissue
Ten pairs of fresh CRC tissues and ANTs were collected from patients who underwent surgery at the Department of Gastrointestinal Surgery, Affiliated Hospital of Xuzhou Medical University. The tissues were preserved in a −80°C refrigerator for subsequent RNA extraction. All specimens were confirmed by pathology and all patients signed informed consent before study entry following the Declaration of Helsinki. The Medical Ethics Committee of the Affiliated Hospital of Xuzhou Medical University reviewed and approved this study (XYFY2023-KL229-01).
Cell Culture and Transient Transfection
The CRC cell lines HCT116, SW480, HT29, RKO, and DLD1 were obtained from the Cell Bank of the Chinese Academy of Sciences (Shanghai, China). HT29 cells were cultured in RPMI 1640 (Gibco, MA, USA) with 10% fetal bovine serum (FBS; BioChannel Biological Technology Co., Ltd.); HCT116 cells in McCoy’s 5A medium (Gibco, MA, USA); DLD1, RKO, and NCM460 and SW480 cells in DMEM/high-glucose medium (Gibco, MA, USA). For the knockdown experiments, specific siRNAs targeting THBS3 (si-THBS3) and non-targeting control (si-Ctrl) were designed and obtained from Gene Pharma Technology (Suzhou, China). Cells were evenly plated 1 day prior to transfection and subsequently transfected with either the si-Ctrl or the small interfering RNA specifically targeting THBS3 using jetPRIME® Polyplus Transfection (Polyplus-transfection S.A., Illkirch, France) following the manufacturer’s protocol. The concentration of siRNA is 0.02 μM and medium was replaced 6 h after transfection. The transfected CRC cells were subsequently used for related functional assays and western blot analysis. The sequences of oligonucleotides are as follows: si-THBS3#1, sense: GGAUGUCUGUGAUACUAAUTT, antisense: AUUAGUAUCACAGACAUCCTT; si-THBS3#2, sense: GGUCCAAUCUCCAGUAUCGTT, antisense: CGAUACUGGAGAUUGGACCTT.
Cell Counting Kit-8 (CCK-8) Assay
The CCK-8 assay was conducted using the Cell Counting Kit 8 (GIPBIO, CA, USA) in accordance with the manufacturer’s instructions. Transfected CRC cells were seeded into 96-well plates and cultured at 37°C in a humidified atmosphere containing 5% CO2 for durations of 0, 24, 48, and 72 hours. At each designated time point, the cells in each well received an addition of CCK-8 solution and were incubated for an additional period of 2 hours. Following this incubation period, absorbance was measured at a wavelength of 450 nm at the specified time points.
5-Ethynyl-2′-deoxyuridine (EdU) Assay
The EdU assay was conducted using an EdU Proliferation Kit (RIBOBIO, Guangzhou, China) in accordance with the manufacturer’s instructions. Transfected CRC cells were seeded in 96-well plates and cultured at 37°C in a humidified atmosphere containing 5% CO2 for 12 hours. Following this incubation period, the cells were treated with a 50 mM EdU solution at 37°C under the same CO2 conditions for an additional 2 hours before being fixed in 4% paraformaldehyde. Subsequently, the cells were stained with Apollo Dye Solution and Hoechst 33342. Imaging and counting of the stained cells were carried out using an Olympus FSX100 microscope (Olympus, Tokyo, Japan).
Transwell Assay
Transwell assay was conducted using an 8 μm pore size chamber (Corning, NY, USA) following the manufacturer’s instructions. For the invasion assay, the upper layer of chambers was treated with Matrigel (BD Biosciences, Mississauga, Canada), while it was not used in the migration assay. After overnight serum starvation, transfected CRC cells were seeded in the upper layer with a complete medium added to the bottom. Following incubation at 37°C with 5% CO2 for 24 to 48 hours, migrated and invaded cells were fixed and stained before enumeration.
Wound Healing Assay
In the wound healing assay, transfected CRC cells were seeded in 6-well plates and cultured to a density of approximately 80%. Subsequently, 200-μL pipette tips were employed to create artificial scratches in each well. The exfoliated cells were then washed away using PBS twice. The remaining suspended cells were cultured in an FBS-free medium. An inverted light microscope (Olympus, Tokyo, Japan) was utilized to capture images of cell migration at both 0 and 24 hours post-scratch formation.
RNA Extraction and Quantitative Real-Time PCR (qRT-PCR) Assays
Total RNA was extracted from transfected cells using the RNA Isolater Total RNA Extraction Reagent (Vazyme, Nanjing, China). qRT-PCR experiments were performed following the manufacturer’s protocol (Vazyme, Nanjing, China). The primer sequences used for qRT-PCR were as follows: GAPDH, 5ʹ-AGAAGGCTGGGGCTCATTTG-3ʹ and 5ʹ-AGGGGCCATCCACAGTCTTC-3ʹ; THBS3, 5ʹ-ATGGAGACGCAGGAACTTCG-3ʹ, and 5ʹ-AGGCTGTCCGGATCTTCTCT-3ʹ. The relative mRNA expression levels of the target genes were quantified using the 2−ΔΔCt method, with GAPDH serving as an internal loading control.
Western Blot Analysis
Total protein was extracted from transfected cells using pre-cooled RIPA buffer (Beyotime Biotechnology, Shanghai, China) with protease and phosphatase inhibitors. Protein quantification was performed using the BCA Protein Assay Kit (Beyotime Biotechnology, Shanghai, China). Equal amounts of protein samples were separated by SDS-PAGE (Yeasen Biotechnology, Shanghai, China) and transferred to 0.45 μm PVDF membranes (Millipore, MA, USA). Membranes were blocked in 5% skimmed milk and incubated overnight at 4°C with primary antibodies: THBS3 (1:200, Abmart, Shanghai, China), PI3K (1:1000, CST, Danvers, MA, USA), pPI3K (1:1000, CST, Danvers, MA, USA), AKT (1:1000, CST, Danvers, MA, USA), pAKT (1:1000, CST, Danvers, MA, USA), E-cadherin (1:5000, Proteintech, IL, USA), N-cadherin (1:5000, Proteintech, IL, USA), and GAPDH (1:10 000, Proteintech, IL, USA). After washing 3 times with TBST, they were incubated for 2 hours at room temperature with HRP-conjugated secondary antibodies. Immunoblots were detected using a Chemistar™ High-sig ECL Western Blot Substrate (Tanon, Shanghai, China) with an enhanced chemiluminescence detection kit.
Statistical Analysis
Statistical analyses were conducted using R (4.2.1) and GraphPad Prism version 9.5 (La Jolla, CA, USA). Correlation analysis was performed with the chi-square (χ2) test or Spearman’s correlation. The Wilcoxon rank sum test or t-test assessed differences in THBSs expression between tumor and normal tissues. Survival analysis utilized the Kaplan-Meier method, while univariate and multivariate Cox proportional hazard regression models evaluated the impact of THBSs expression and other clinicopathological parameters on survival and hazard ratio (HR). T-test, one/two-way ANOVA, or Kruskal-Wallis test determined group differences’ significance. A P value under .05 indicated statistical significance (*P < .05; **P < .01; ***P < .001).
Results
Gene Structure and Motif Composition of the THBS Gene Family in Homo sapiens
To elucidate the phylogenetic relationships among members of the THBS gene family in Homo sapiens, we constructed a phylogenetic tree based on the amino acid sequences of the THBSs investigated in this study. The results revealed that the THBS gene family can be categorized into 3 distinct groups. Group a includes THBS3 and THBS4, while Group c comprises THBS1 and THBS2; however, Group b contains only a single member, COMP (Figure S1A). To further understand the function of THBSs, we next illustrated the conserved motifs present in these 5 proteins. The results revealed that 10 conserved motifs were identified among members of the THBS family (Figure S1B). Notably, some members of the THBS gene family exhibited several shared motifs, suggesting that they may play similar roles in certain biological processes. Additionally, this study investigated the tertiary structures and exon-intron patterns of the THBSs, demonstrating that members of the THBS family are structurally distinct (Figure S1C).
Expression, Methylation, and Genetic Alteration Analysis of the THBS Gene Family in CRC
To evaluate the expression of the THBS family genes in CRC, we compared the mRNA levels of THBSs in the TCGA database. The results indicated that THBS2, THBS3, and COMP were significantly upregulated in CRC tissues, whereas the expression of THBS4 was lower in these tissues compared to adjacent normal ones; no significant difference was observed for THBS1 expression (Figure 2A). These findings were also corroborated by analysis of paired CRC and ANTs (Figure 2B). Furthermore, expression analysis in the GSE39582 dataset reinforced that THBS2, THBS3, and COMP exhibited substantial elevation in CRC tissues as well (Figure 2C). Moreover, investigation of co-expression patterns among the 5 members revealed a positive correlation between their respective gene expression levels in TCGA database (Figure 2D).

Expression, methylation, and genetic alteration analysis of the THBS gene family in CRC: (A-C) comparison of THBSs mRNA expression between CRC and normal tissues, utilizing data from TCGA (A, unpaired; B, paired) and GEO (C) databases, (D) co-expression analysis of THBSs in the TCGA database, (E) the heterozygous and homozygous copy number variations (CNV) of THBSs in CRC are illustrated in a pie chart, (F) the relationship between the expression levels and methylation status of THBSs in CRC is presented. The size of the dots reflects the statistical significance; larger dots indicate higher statistical relevance, and (G) comprehensive Overview of Genetic Alterations in THBSs Utilizing the TCGA Pan-Cancer Atlas Dataset from cBioPortal.
Next, the percentage of copy number variation (CNV) was evaluated across different cancers and relatively low percentages of the THBSs were observed in CRC. The heterozygous/homozygous CNV status, encompassing both deletions and amplifications, of THBS2, THBS3, and COMP exhibited a similar trend in alterations. In contrast, THBS1 and THBS4 demonstrated a comparable pattern of change (Figure 2E). Previous studies have suggested that gene-specific DNA hypomethylation events could contribute to the active expression of genes.16,17 We found that the mRNA levels of the THBSs in COAD and READ had negative correlations with respective DNA methylation levels (Figure 2F). Furthermore, genetic alterations affecting THBSs in CRC were analyzed utilizing data from the cBioPortal database. The results indicated that missense mutations were the most prevalent type of genetic alteration, followed by deep deletions observed within these gene families (Figure 2G).
Clinical Significance of the THBS Gene Family in CRC
To determine the clinical significance of THBSs expression in CRC, we explored the relationship between THBSs mRNA levels and various clinicopathological features of CRC in TCGA database. The results showed that THBS1 expression was significantly associated with age (P = .026; Table S1). In contrast, THBS2 expression was associated with age (P = .011), pathologic N stage (P = .002), perineural invasion (P = .001), and histological type (P = .017; Table S2). Furthermore, THBS3 expression was associated with pathologic T stage (P = .024), pathologic N stage (P < .001), pathologic M stage (P = .027), pathologic stage (P = .003), perineural invasion (P = .038) lymphatic invasion (P < .001), and histological type (P = .028; Table S3). However, THBS4 expression did not show obvious significance with clinicopathological features (Table S4). Lastly, COMP expression was associated with pathologic T stage (P = .033), pathologic N stage (P < .001), pathologic stage (P = .002), perineural invasion (P = .023) as well as lymphatic invasion (P < .001; Table S5).
Then, we analyzed the expression of the THBSs in groups classified by TNM stage, M stage, and N stage. The results indicate that the mRNA expression levels of THBSs tend to increase with advancing TNM stages (Figure 3A-C). In addition, that elevated expression of THBSs, particularly THBS1, THBS3, and THBS4, is associated with an increase in both lymph node and distant metastases in CRC (Figure 3D and E). Notably, the above data showed that THBS3 demonstrated a stronger association with the clinical significance of CRC compared to other members of the THBS gene family.

Clinical significance of the THBS gene family in CRC: (A-C) the expression of THBSs was assessed across various pathological stages using a violin plot, (D and E) the expression levels of THBSs were assessed across various groups stratified by clinical characteristics, specifically M classification (D) and N classification (E), utilizing a violin plot for visualization.
Prognostic Analysis of the THBS Gene Family Indicates THBS3 as a Significant Prognostic Indicator for CRC
To investigate the prognostic value of the THBS gene family, we initially performed univariate and multivariate Cox regression analyses of the 5 members in the TCGA database. The findings indicated that THBS3 emerged as the most significant independent prognostic marker for overall survival (OS), disease-specific survival (DSS), and progression-free interval (PFI; Figure 4A and S2). Next, we conducted a Kaplan-Meier analysis in the TCGA database and discovered that both THBS3 and COMP were significantly associated with OS, DSS, and PFI in CRC patients. Notably, the high-expression group exhibited a shorter survival time (Figure 4B and S3). Additionally, an analysis of GSE39582 revealed that only elevated levels of THBS3 correlated with poorer outcomes in terms of OS, recurrence-free survival (RFS), and post-progression survival (PPS; Figure 4C and S4). Furthermore, the R2 Genomic Analysis and Visualization Platform (http://r2.amc.nl) was employed to assess the expression levels of THBS3 mRNA across the 4 Consensus Molecular Subtypes (CMS) of CRC in the GSE39582 dataset. This analysis revealed that THBS3 expression varied among different CMS types, with notably the highest levels observed in CMS4 (Figure 4D), which is characterized by worse OS and RFS compared to other CMS types. To enhance the accuracy of prognostic predictions for CRC patients, we developed a nomogram prognostic model that integrates key variables including age, gender, pathologic stage, and THBS3 expression (Figure 4E). Furthermore, we noted a strong correlation between the calibration curves derived from the nomograms’ predicted survival rates and the observed 1-, 3-, and 5-year survival rates (Figure 4F). This finding suggests that our model has significant potential to provide precise guidance in forecasting the survival duration of CRC patients.
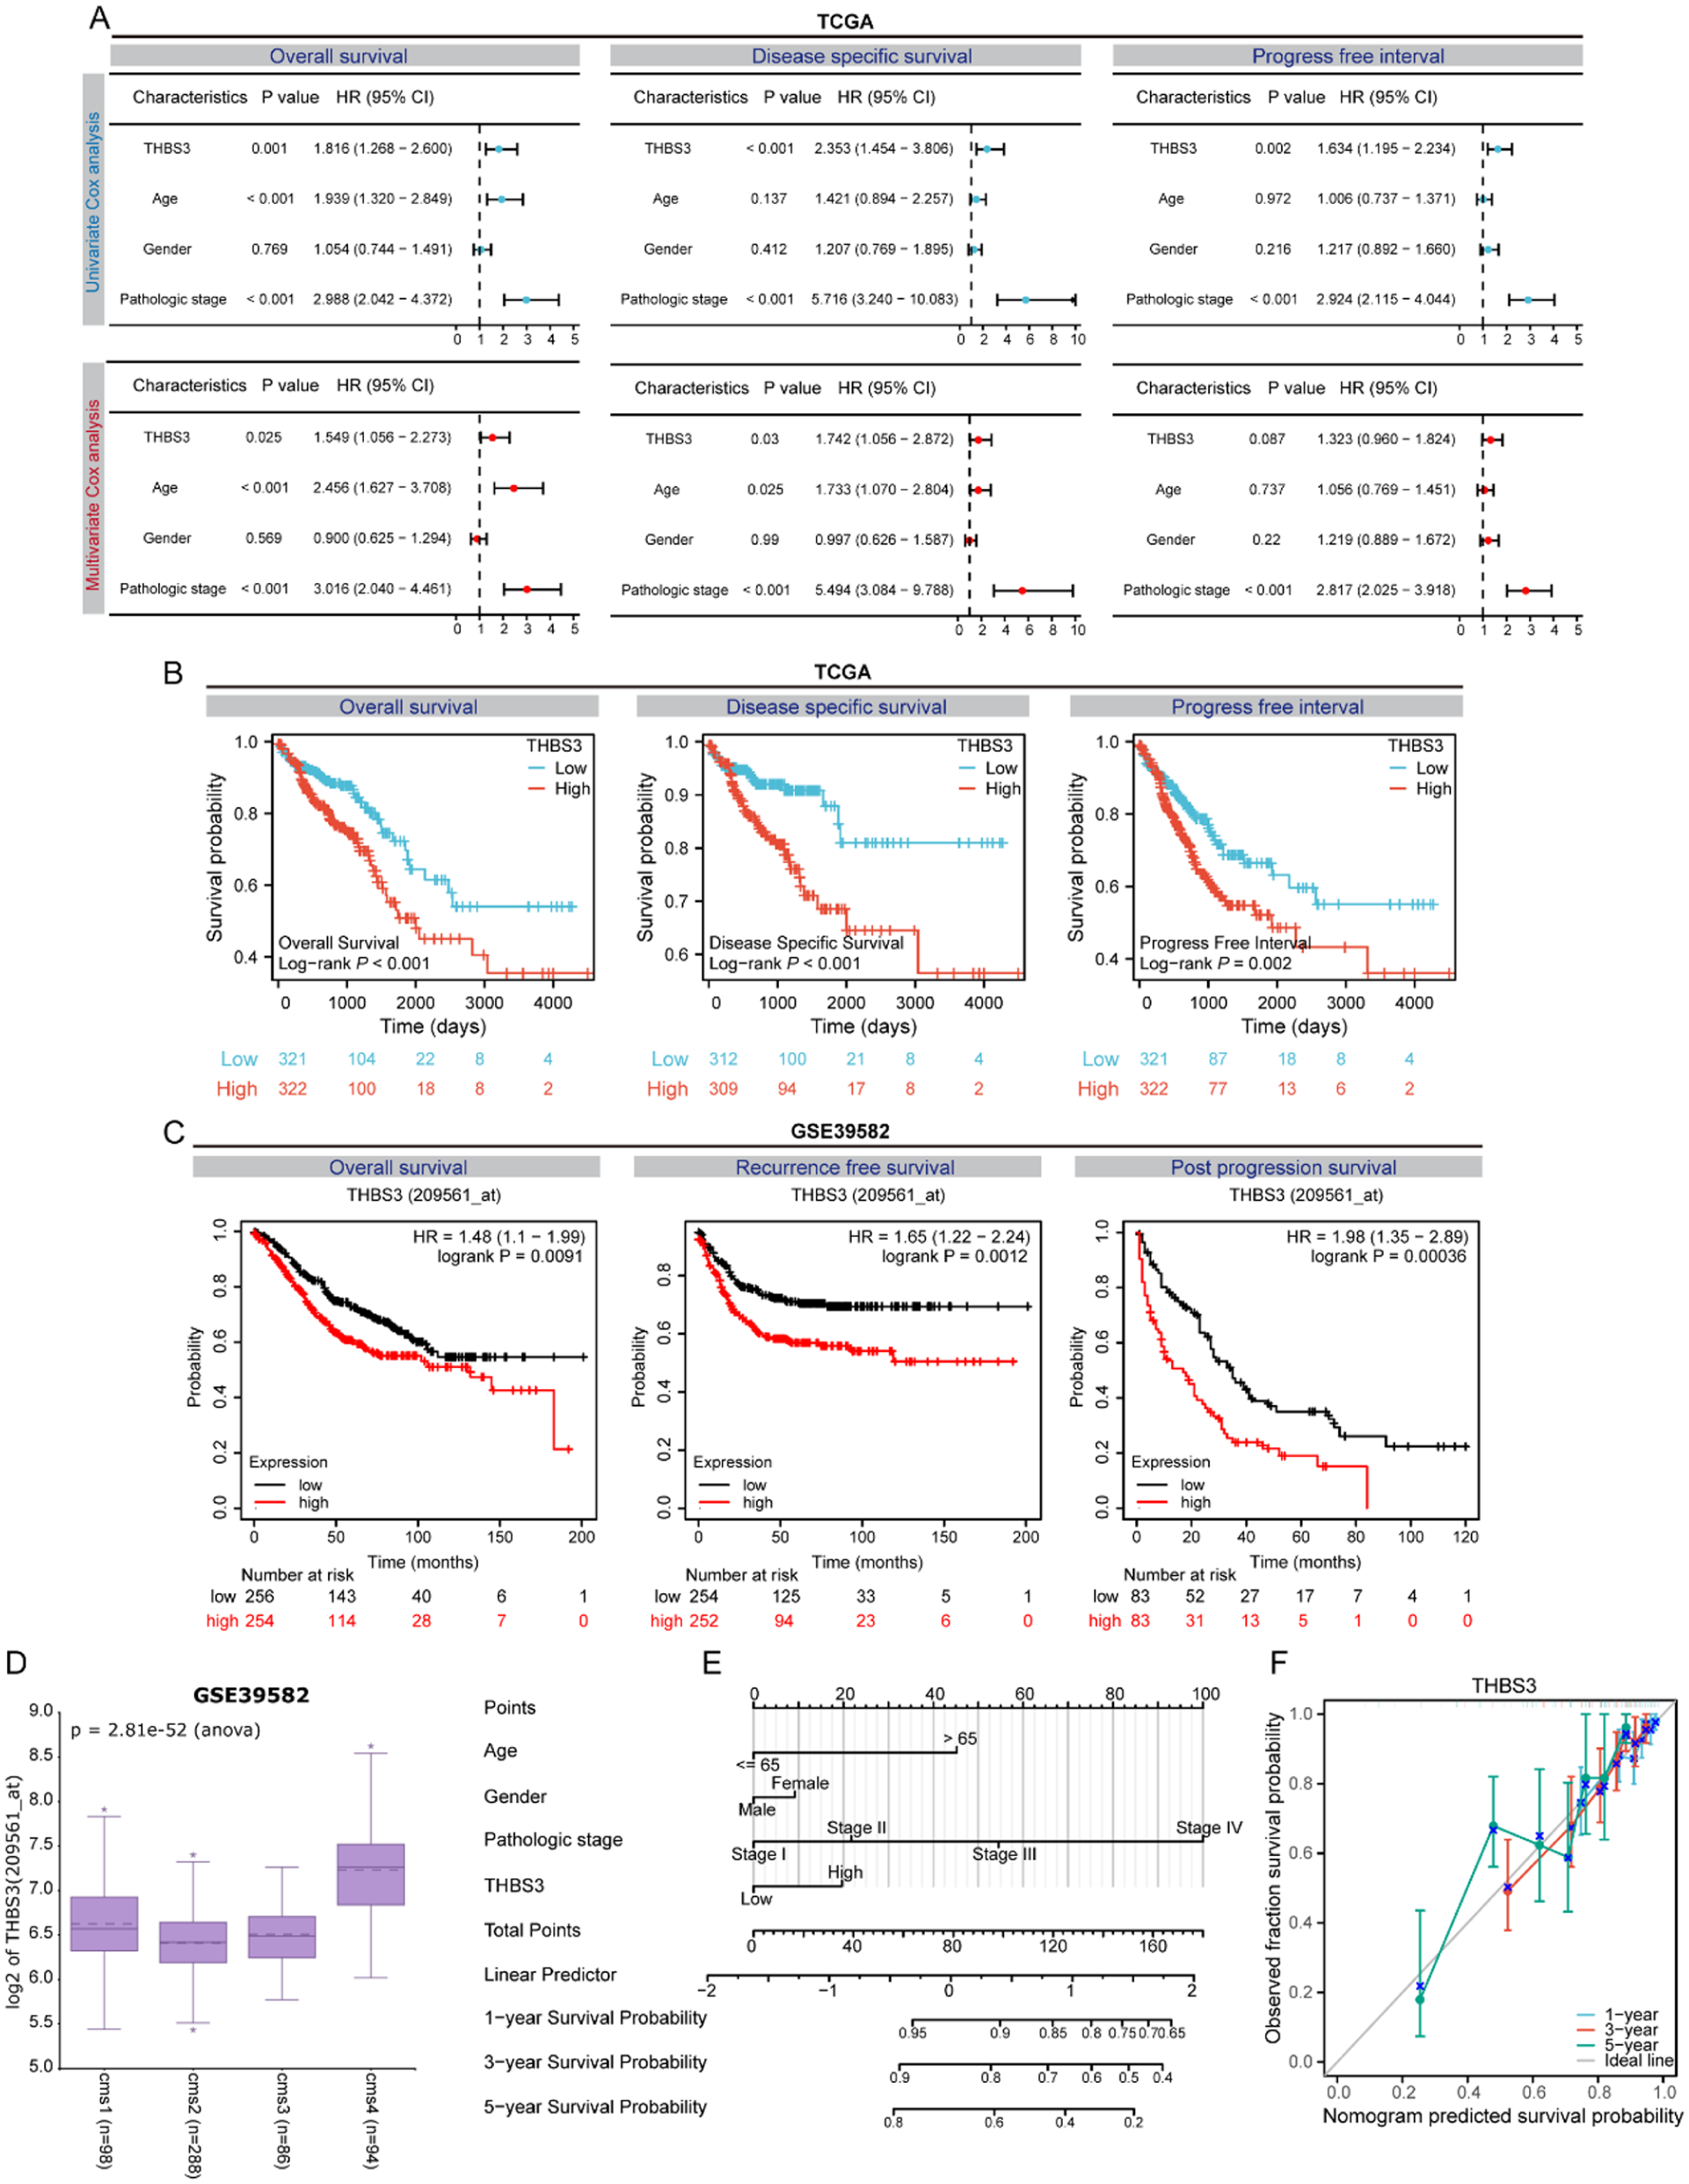
Prognostic analysis of the THBS gene family indicates THBS3 as a significant prognostic indicator for CRC: (A) Forest plot illustrating the univariate (up) and multivariate (down) cox regression analyses of THBS3 in the TCGA database, (B) the Kaplan-Meier survival analysis examining the correlation between THBS3 expression and OS, DSS, and PFI in CRC within the TCGA database, (C) the Kaplan-Meier survival analysis examining the correlation between THBS3 expression and OS, RFS, and PPS in CRC within the GSE39582 dataset, (D) THBS3 mRNA expression in the consensus molecular CRC subtypes, (E) a prognostic nomogram incorporating age, gender, pathological stage, and THBS3, and (F) calibration curves illustrating the correlation between predicted and observed survival rates at 1-, 3-, and 5-year intervals based on the nomogram.
Function Annotation and Pathway Enrichment of THBS3 in CRC
To identify the functional and physical interaction partners of THBS3, we utilized the STRING database to analyze protein-protein interactions. The analysis revealed a total of 10 THBS3 interaction proteins supported by experimental evidence (Figure 5A). A heatmap illustrated the top 15 genes positively and negatively associated with THBS3 in CRC, derived from the TCGA dataset (Figure 5B). Subsequently, we conducted KEGG and GO analyses on differentially expressed genes related to THBS3. The KEGG pathways were predominantly enriched in extracellular matrix-receptor interaction, cell adhesion molecules, PI3K-Akt, and Wnt signaling pathways, etc (Figure 5C). The GO annotation encompasses 3 categories: biological processes (BP), cellular components (CC), and molecular functions (MF), which serve to elucidate the biological characteristics of genes. The BP associated with THBS3 was primarily enriched in extracellular structure organization and extracellular matrix organization. In terms of CC, enrichment was predominantly observed in the collagen-containing extracellular matrix. MF revealed significant enrichment in constituents of the extracellular matrix structural constituent and signaling receptor activator activity (Figure 5D). In addition, we employed GSEA to preliminarily explore the potential biological functions of THBS3 in CRC and to identify the signaling pathways influenced by THBS3 expression. The results indicated that THBS3 was significantly enriched in various pathways, including B cell receptor signaling, epithelial-mesenchymal transition (EMT), extracellular matrix organization, etc (Figure 5E).

Function annotation and pathway enrichment of THBS3 in CRC: (A) the protein-protein interaction network for THBS3 was constructed using the STRING tool, (B) the heatmap illustrated the top 15 genes that are positively and negatively associated with THBS3 in the TCGA database, (C) KEGG pathway enrichment analysis of THBS3 and its co-expression genes in the TCGA database, (D) GO enrichment term for BP (left), CC (middle), and MF (right) of THBS3 and its co-expression genes, and (E) GSEA of THBS3 and its co-expression genes.
Correlation Between THBS3 Expression and Immune Landscape
Then, we analyzed the correlation between THBS3 expression and immune infiltration in CRC. Notably, THBS3 expression was positively correlated with NK cells, DCs, neutrophils, and Tregs infiltration, but negatively correlated with Th17 cells, T helper cells, and Th2 cells (Figure 6A and B). Similar results were noted in the group comparison of high and low THBS3 expression, as well as in the correlation analysis scatter plot (Figure S5A and B). Compared to the low-expression group of THBS3, the high-expression group demonstrates significantly higher scores in Stromal, Immune, and ESTIMATE (Figure 6C). These findings imply that elevated THBS3 expression may be linked to an increased presence of stromal components and a greater infiltration of immune cells within the tumor microenvironment. The scRNA-seq dataset CRC_GSE166555, comprising samples from 12 primary CRC patients, was utilized to examine the distribution of THBS3 across various cell types. The findings revealed that THBS3 is predominantly localized in malignant cells, fibroblasts, epithelial cells, and CD4/CD8 positive T cells (Figure 6D and E).
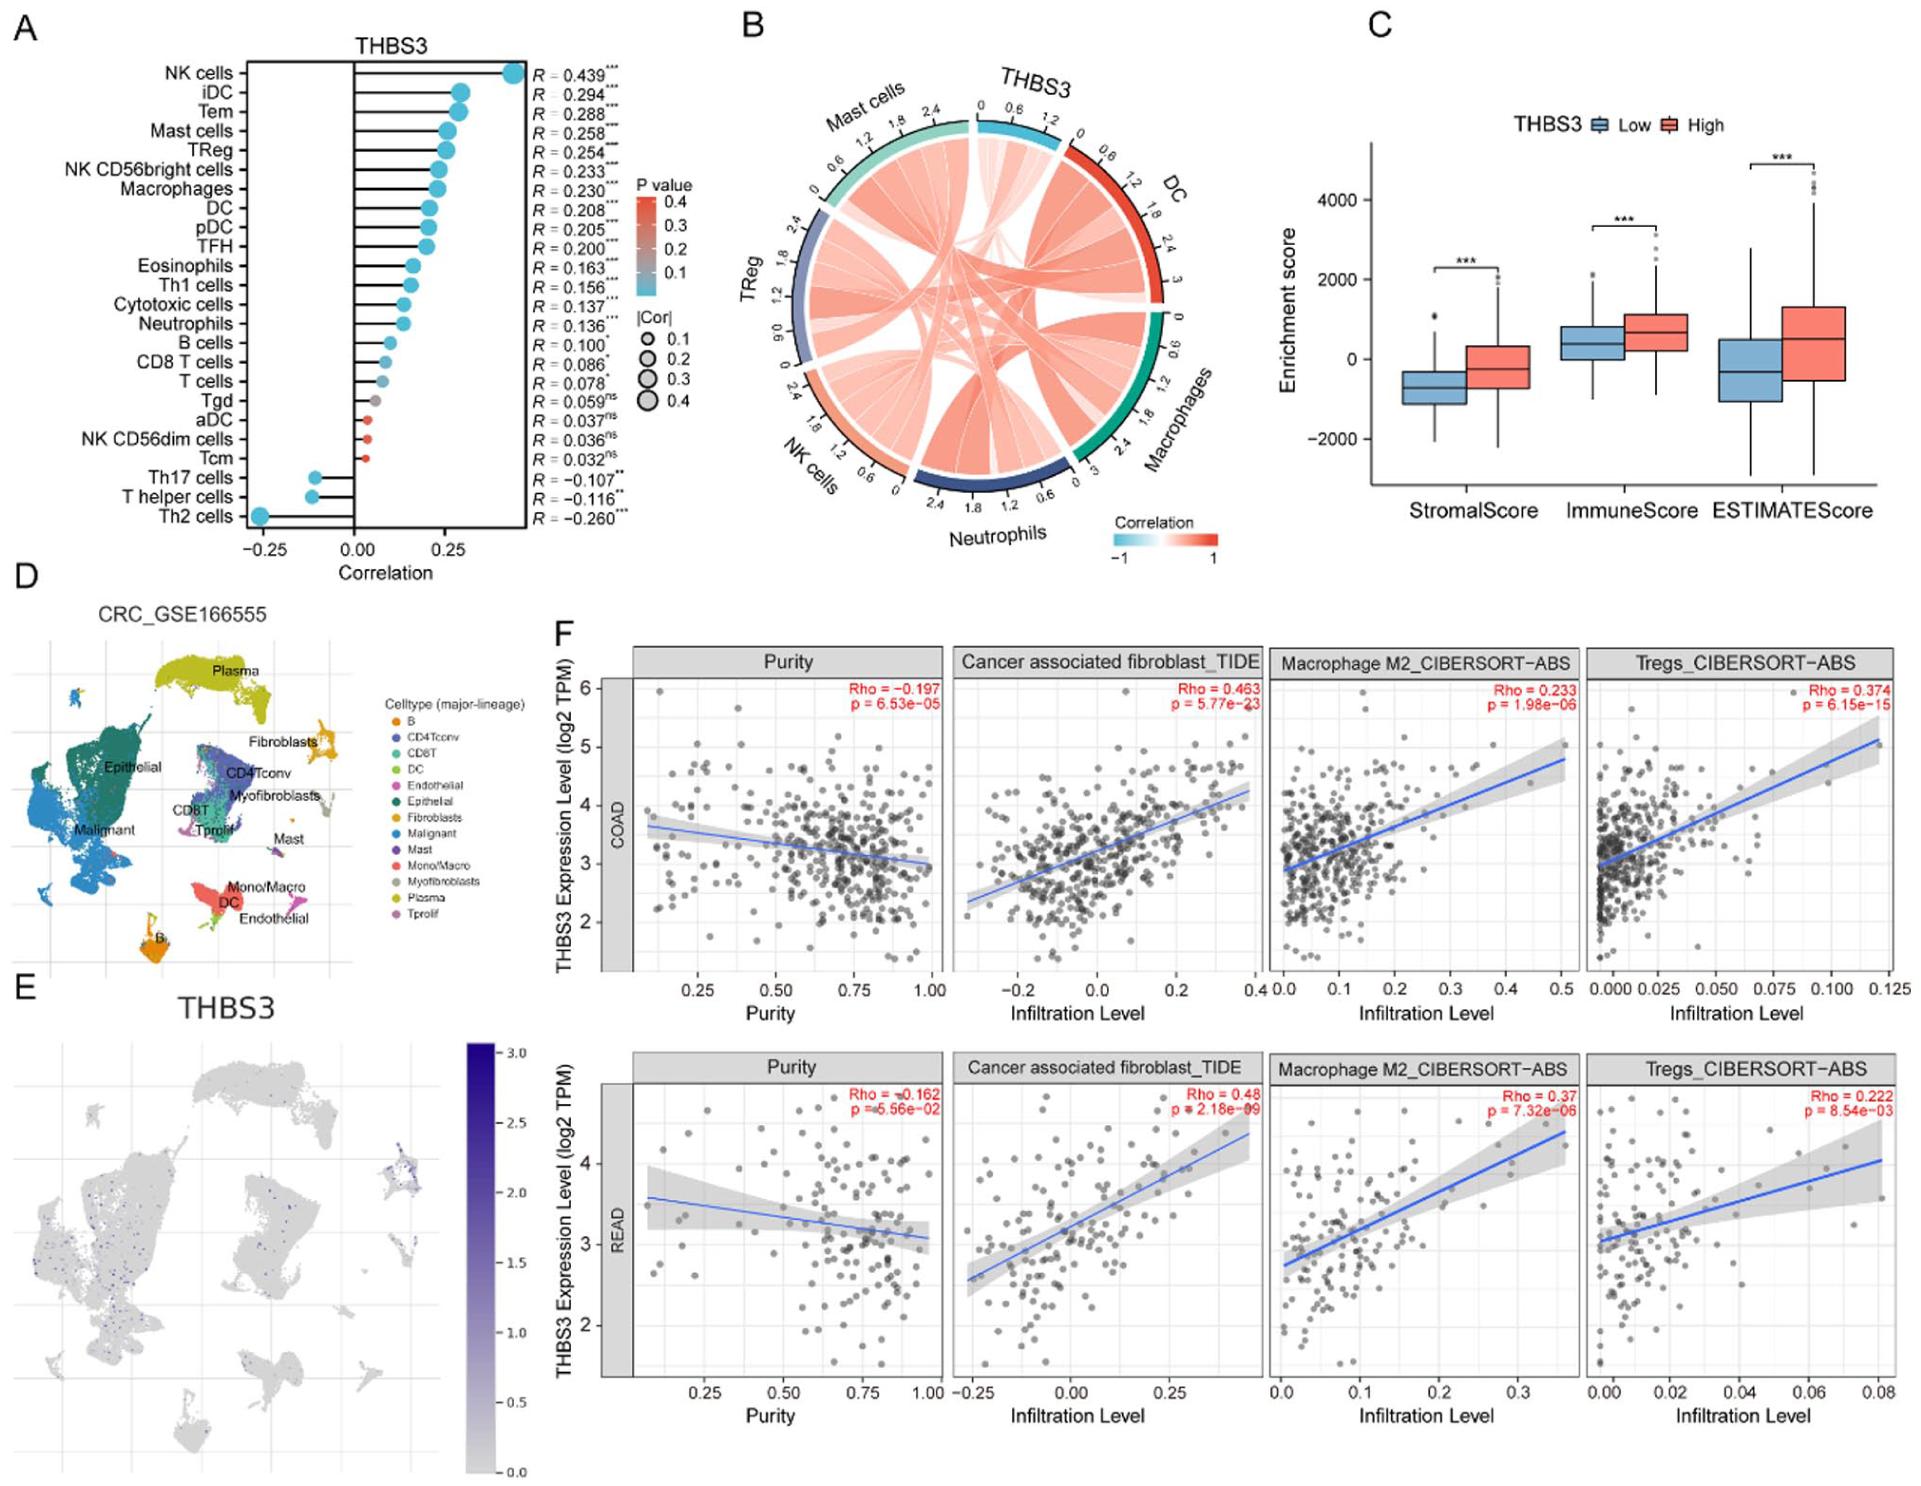
Correlation between THBS3 expression and immune landscape: (A) the Lollipop Chart illustrates the relationship between THBS3 expression and immune cell scores within the TCGA database, (B) chord diagram illustrating the correlation between THBS3 expression and the expression levels of Mast cells, Treg, NK cells, Neutrophils, Macrophages, and DC, (C) an analysis of THBS3 expression levels (high/low) in relation to Stromal Score, Immune Score, and ESTIMATE Score, (D) the cell types identified in CRC tissues based on the scRNA-seq GSE166555 dataset, (E) the distribution of THBS3 among the identified cell types in the GSE166555 dataset, and (F) the association of THBS3 expression with CAF, Macrophages M2, and Tregs in COAD and READ was analyzed from the TIMER2.0 dataset.
Additionally, the TIMER2.0 database was employed to investigate the correlation between THBS3 expression and various immune cell populations. The analysis revealed that THBS3 expression levels are positively associated with the infiltration of cancer-associated fibroblast (CAF), Macrophages M2, and Tregs (Figure 6F). Programed cell death protein 1 (PD-1), programed cell death ligand 1 (PD-L1), and cytotoxic T-lymphocyte-associated protein 4 (CTLA-4) are common inhibitory immune checkpoints. Antibodies targeting these molecules are called immune checkpoint inhibitors (ICIs). ICIs have been employed in the treatment of various cancers.18,19 Correlation analysis of the GEPIA 2 database revealed a significant positive correlation between THBS3 expression and PD-1, PD-L1, and CTLA-4 in CRC (Figure S5C). In summary, these data indicate that THBS3 may play a role in immune infiltration as well as in the expression of immune checkpoints within the CRC microenvironment.
Association Analysis of THBS3 Expression with Drug Sensitivity
To facilitate drug selection for targeted therapy, we analyzed the correlation between THBS3 gene expression and drug sensitivity by utilizing data from the GDSC and CTRP databases, as accessed through the GSCALite online platform. The findings indicated that THBS3 expression levels were negatively correlated with the half maximal inhibitory concentration IC50 of AG-014699, GSK1904529A, Midostaurin, Pazopanib, Lenvatinib, and ML162. Conversely, a positive correlation was observed with the IC50 values of most other drugs (Figure S6A and B). Furthermore, computer molecular docking simulations were performed for these anticancer drug libraries, which demonstrated a negative correlation with THBS3 expression levels. The results revealed the following affinity values: GSK1904529A (−10.8 kcal/mol), Pazopanib (−10.0 kcal/mol), Lenvatinib (−9.6 kcal/mol), Midostaurin (−9.5 kcal/mol), AG-014699 (−9.4 kcal/mol), and ML 162 (−7.7 kcal/mol; Figure S6C-H). Notably, these findings indicate good binding stability and robust interactions between the candidate compounds and THBS3.
Expression and Function Validation of THBS3 in CRC
Firstly, we assessed the mRNA levels of THBS3 in 10 pairs of CRC tissues and paired ANTs. The results indicated that THBS3 was significantly upregulated in the majority of CRC specimens (Figure 7A). Similar findings were observed in CRC cell lines, where THBS3 exhibited a significant upregulation in HCT116, SW480, HT29, RKO, and DLD1 cells when compared to NCM460 cells (human normal colorectal mucosal cells; Figure 7B). To elucidate the biological function of THBS3 in CRC cells, we designed 2 small interfering RNAs (siRNAs), namely si-THBS3#1 and si-THBS3#2, specifically targeting THBS3. Given that cell migration, invasion and proliferation are critical phenotypes in tumor progression, we initially conducted transwell and wound healing assays to assess the migration and invasion capabilities of CRC cells. The results revealed that the knockdown of THBS3 led to a significant reduction in the migration and invasion abilities of HCT116 and SW480 cells (Figure 7C-F). Furthermore, CCK-8 and EdU assays showed that the knockdown of THBS3 resulted in a decreased proliferation capacity of HCT116 and SW480 cells. (Figure 7G-J). We subsequently investigated the changes in the expression of PI3K-AKT and EMT related molecular markers in CRC cells following by THBS3 knockdown. The western blot analysis revealed a significant reduction in the protein levels of pPI3K, pAKT, and N-cadherin in HCT116 and SW480 cells upon knockdown of THBS3. Conversely, the expression of the epithelial marker E-cadherin was found to be increased (Figure 7K). Collectively, these findings provide strong evidence that THBS3 facilitates the progression of CRC and promotes the PI3K-AKT signaling pathway and EMT process.
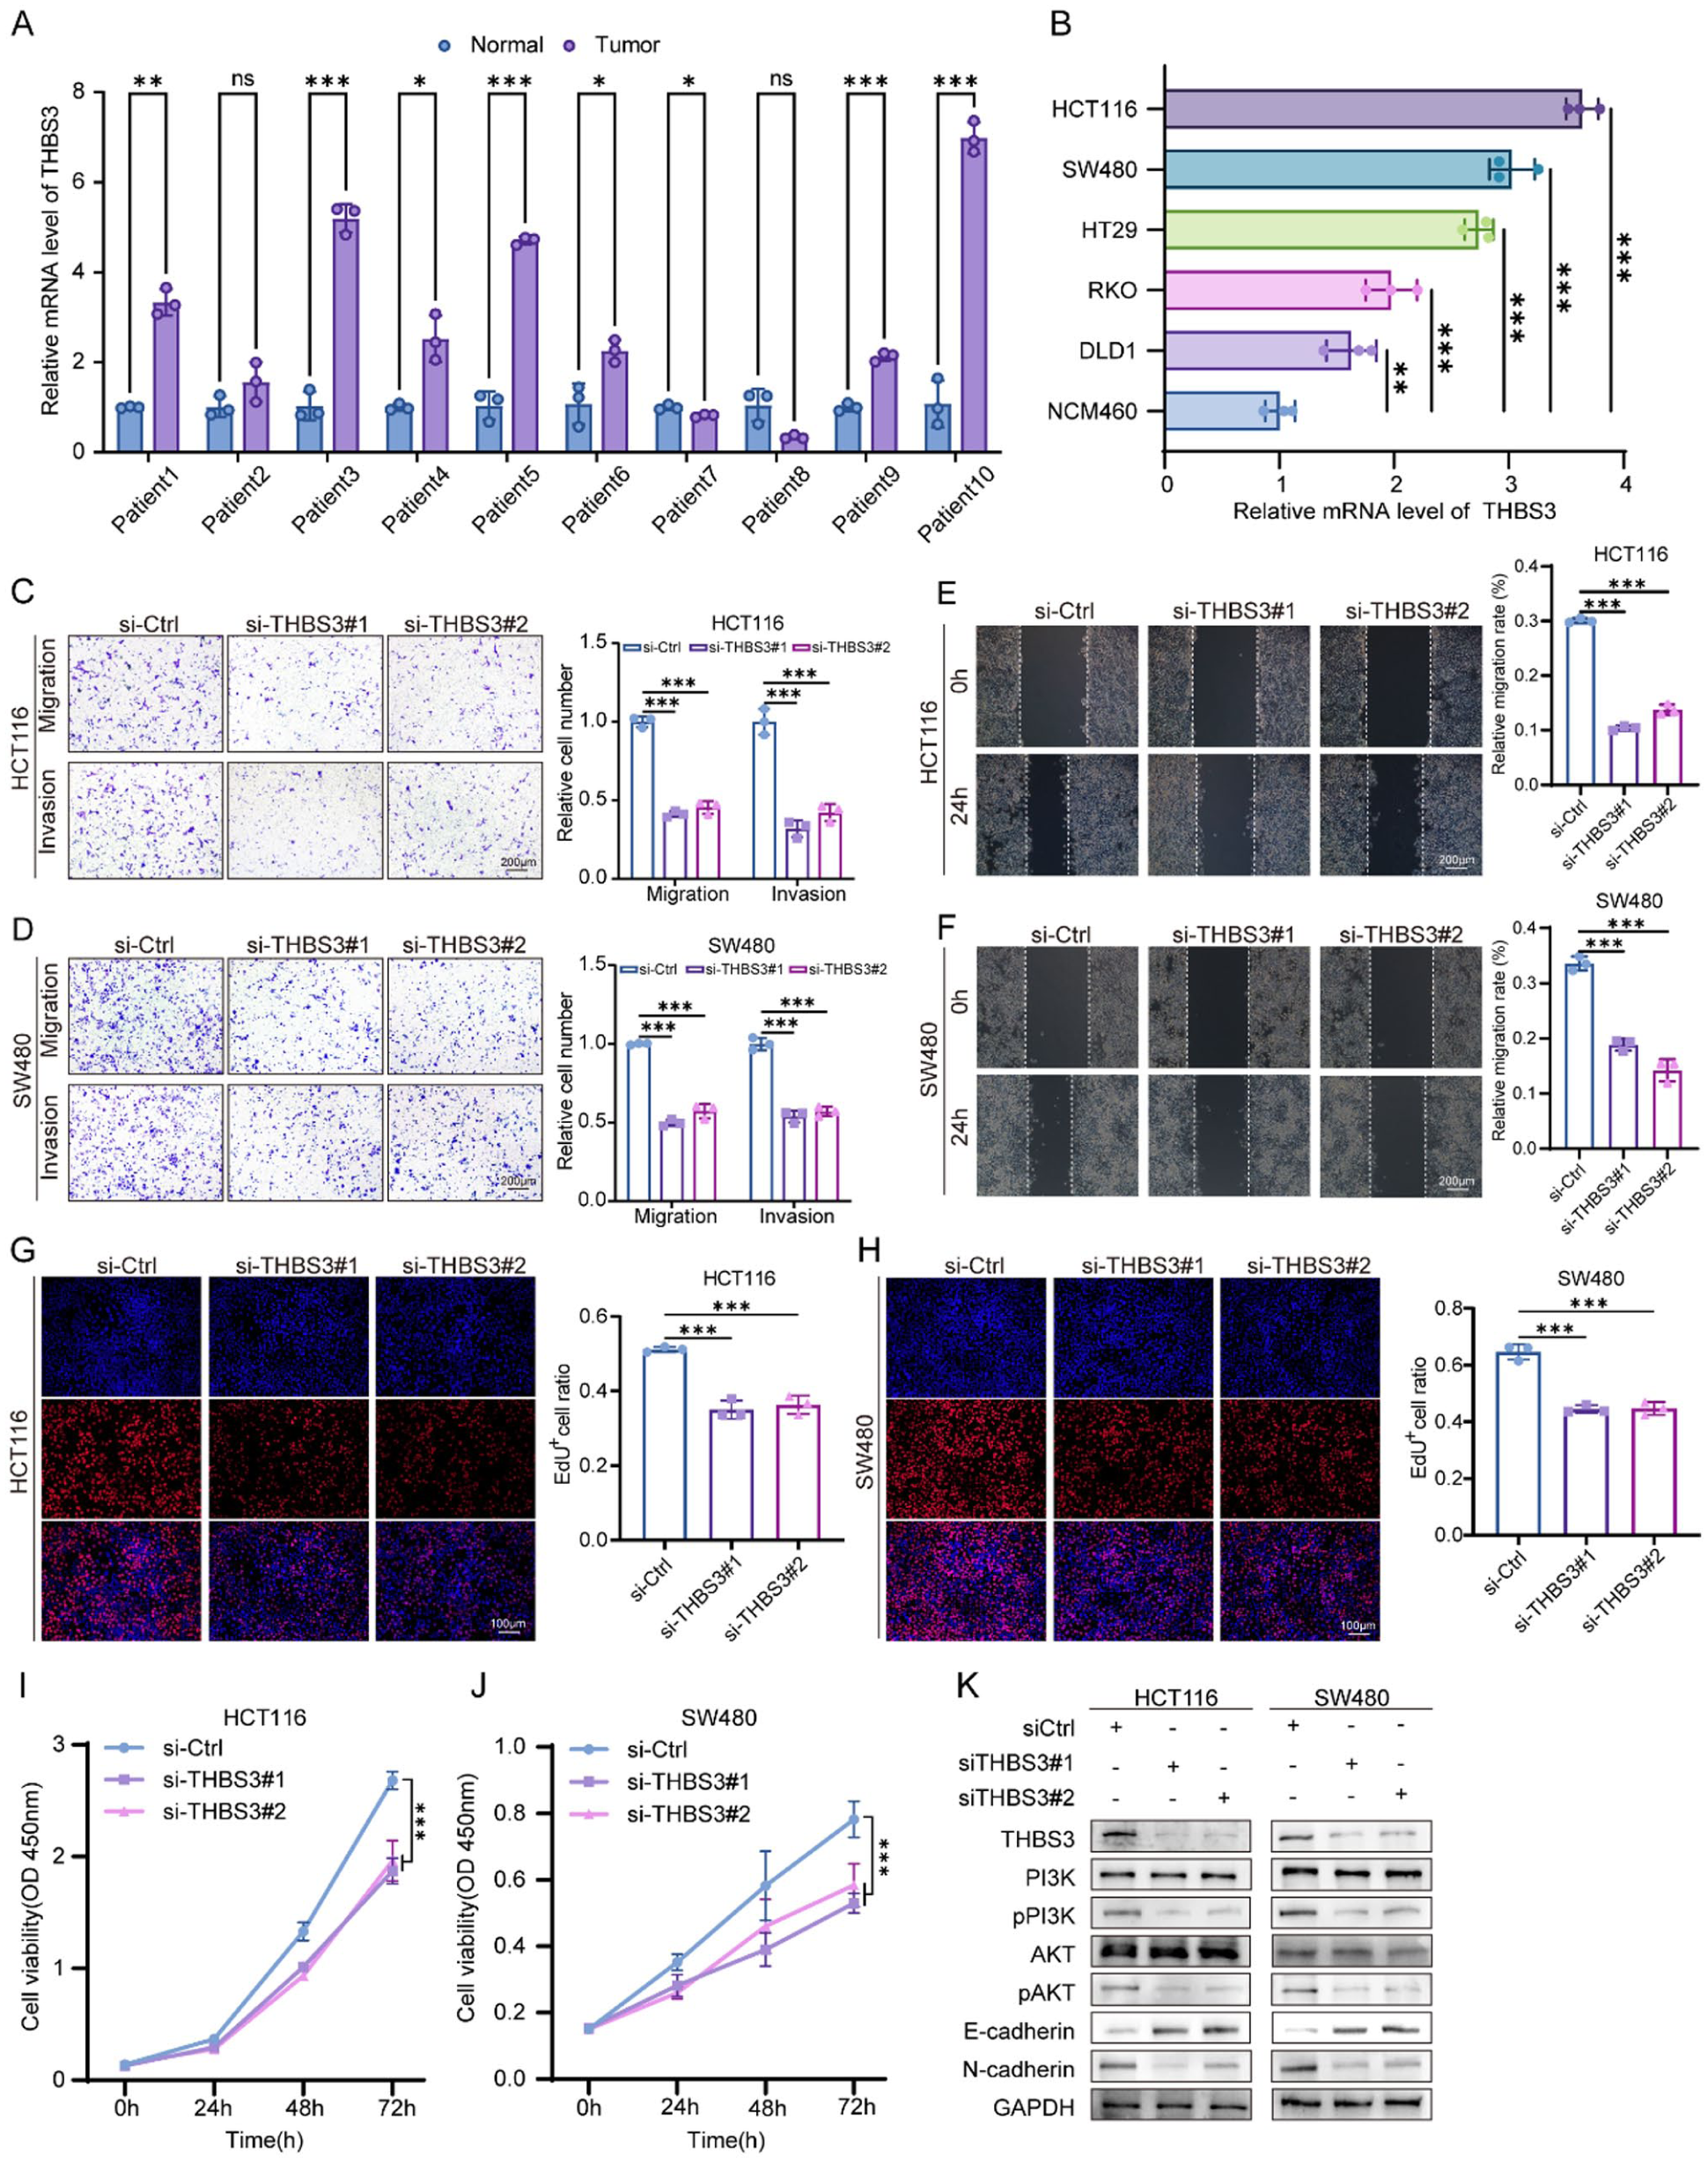
Expression and function validation of THBS3 in CRC: (A) the mRNA expression levels of THBS3 in 10 pairs of CRC tissues alongside their ANTs counterparts, (B) the mRNA expression level of THBS3 in CRC and normal human colonic mucosal cells. n = 3 independent biological replicates, (C-F) cell migration and invasion ability were detected following the knockdown of THBS3, as assessed by Transwell and Wound Healing assays. n = 3 independent biological replicates, (G-J) cell proliferation ability was detected following the knockdown of THBS3, as assessed by EdU and CCK-8 assays. n = 3 independent biological replicates, and (K) the expression of PI3K-AKT and EMT markers was evaluated following THBS3 knockdown using western blot analysis. The data are presented as the mean ± SD.
Discussion
Tumor prognosis is influenced not only by traditional clinical and pathological factors, such as TNM staging and histological type, but is also closely associated with molecular landscape.20,21 Advancements in multi-omics analyses utilizing both blood and tumor tissue sequencing have enabled the identification of tumor molecular landscapes. These insights contribute to the prediction of prognostic outcomes, enhance our understanding of biological characteristics, and reveal therapeutic vulnerabilities. 22 The exploration of gene families utilizing multi-omics data presents a promising avenue for the identification of tumor prognostic biomarkers. Zeng et al 23 analyzed the S100 gene family and found that high S100A1 levels are associated with poor prognosis in CRC. Similarly, a comprehensive analysis of the HOX gene family indicated that elevated HOXC6 expression also suggests a poor prognosis in CRC. 24 In this study, we conducted a comprehensive analysis of the expression, CNV, methylation, and mutation of the THBS gene family in CRC utilizing multi-omics databases. We also investigated their associations with clinicopathological features and survival outcomes. Among the 5 members of the THBS gene family, THBS3 demonstrated a more pronounced clinical significance in CRC. Subsequent univariate and multivariate Cox regression analyses, along with Kaplan-Meier curves, identified THBS3 as an independent risk factor for CRC; notably, high expression levels of THBS3 were correlated with poorer prognosis. Consequently, we concentrated our further research efforts on THBS3.
The tumor microenvironment (TME) is composed of various components, including tumor cells, immune cells (such as T cells, B cells, and macrophages), vascular cells, tumor-associated fibroblasts, and the extracellular matrix (ECM). 25 These components interact in a complex network that affects disease progression and therapy response. Studies indicate that immune cells have a multifaceted role in the TME, with changes in their infiltration significantly impacting overall survival outcomes. 26 However, research on the immune-regulatory roles of THBS3 in CRC remains limited. Hence, we investigated the correlation between THBS3 expression and immune infiltration, as well as the tumor immune microenvironment in CRC. The infiltration scores of 24 immune cell types revealed a significant correlation between most immune cells and THBS3. Patients with high THBS3 expression showed increased levels of immunosuppressive components in the tumor microenvironment, including M2 macrophages and regulatory T cells (Tregs). M2 macrophages play an immunosuppressive role by secreting anti-inflammatory cytokines, promoting angiogenesis, enhancing tumor cell survival and metastasis, and aiding tumor evasion of immune surveillance, thereby facilitating tumor progression. 27 Tregs, characterized by their potent immunosuppressive properties, possess the ability to evade immune surveillance through the inhibition of effector T cell activity and the modulation of other immune cells. 28 Furthermore, the results of scRNA-seq revealed that THBS3 is predominantly localized in fibroblasts within CRC. Fibroblasts are crucial stromal cells within the tumor microenvironment, playing a significant role in the synthesis and remodeling of the extracellular matrix. 29 Further analysis revealed a positive correlation between THBS3 expression and CAFs. As key components of the tumor microenvironment, CAFs secrete cytokines and chemokines that modify immune cell infiltration and promote immunosuppressive cells like Tregs and M2 macrophages, thereby enhancing the overall immunosuppressive environment. 30 The higher levels of immunosuppressive components in the TME may partly account for the progression in CRC with elevated THBS3 expression.
Chemotherapy, immunotherapy, and targeted therapy represent the principal treatment modalities for advanced CRC and have markedly enhanced patient survival rates.31,32 However, patients with CRC frequently develop resistance to these therapies. The loss of drug sensitivity and the ability to evade immune responses are critical factors contributing to this resistance. 33 Immune checkpoints, especially the PD-1/PD-L1 pathway, are key mechanisms through which tumor cells evade immune surveillance by inhibiting T cell function. 34 Immune checkpoint inhibitors, like anti-PD-1/PD-L1 antibodies, enhance T cell anti-tumor activity by blocking this pathway and have demonstrated significant therapeutic effects in CRC. The KEYNOTE-164 clinical trial assessed the PD-L1 inhibitor Pembrolizumab in MSI-H/dMMR CRC patients, showing significant anti-tumor efficacy. 35 In our research, we discovered that the expression of THBS3 in CRC is positively associated with the expression of immune checkpoint molecules, including PD-1, PD-L1, and CTLA-4. Tumors with high immune checkpoint molecule expression are expected to respond better to ICIs. 36 Our finding indicates that ICIs may exhibit enhanced responses in CRC patients with high levels of THBS3. However, the therapeutic efficacy of these agents largely relies on the tumor’s existing immune context. 37 High THBS3 expression often predicts a strongly immunosuppressive microenvironment in CRC, characterized by positive associations with CAFs, M2 macrophages, and Tregs. These immunosuppressive populations secrete substantial amounts of IL-10, TGF-β, and other inhibitory cytokines, which impair T cell priming, migration, and effector functions through multiple pathways independent of ICIs.38,39 Therefore, while it may be associated with increased expression levels of immune checkpoints, CRC exhibiting high THBS3 expression may experience limited benefits from ICIs.
Some clinical trials have suggested that the combination of targeted therapies and immune checkpoint inhibitors may enhance therapeutic efficacy. For example, the REGONIVO study demonstrated that the co-administration of regorafenib and PD-1 inhibitor Nivolumab exhibited promising antitumor activity in patients with CRC. 40 Similarly, the phase II multicohort clinical trial known as LEAP-005 demonstrated that the combination of lenvatinib and pembrolizumab contributed to an extension of OS in CRC patients. 41 Using structural biology techniques, we focused on THBS3 and sourced FDA-approved small molecules from the GSDC and CTRP databases. Through molecular docking studies, we identified 6 compounds with a strong affinity for THBS3, namely AG014699, GSK1904529A, Lenvatinib, Midostaurin, ML162, and Pazopanib. Among these agents, Midostaurin has been reported to modulate the tumor microenvironment in CRC, thereby enhancing the efficacy of PD-1 blockade when used in combination therapy. 42 Given this, we speculated that in CRC patients with high THBS3 expression, combination therapies using targeted drugs like Midostaurin and immune checkpoint inhibitors may offer a promising approach to treatment. However, further research is needed to establish a solid theoretical foundation for clinical application.
Based on gene-expression profiling, Guinney et al 43 proposed a novel molecular classification system for CRC, known as the consensus molecular subtypes (CMS). Our preliminary analysis indicated that THBS3 displays the highest expression level within the CMS4 subtype, which is characterized by EMT activation, substantial CAF enrichment, and matrix remodeling, etc.43,44 Intriguingly, as an ECM protein, GO analysis indicated that THBS3 is associated with multiple matrix-related phenotypes. Consistently, GSEA and western blot analyses revealed that THBS3 can activate the EMT process. This pattern implies a potential role for THBS3 in driving the distinct tumor biology of CMS4 CRC. Subsequent KEGG pathway enrichment analysis, supported by the WB results, indicated that the PI3K-AKT signaling axis may be a key pathway underlying the oncogenic effects driven by THBS3. Previous studies have reported that in CRC, CAFs expressing THBS2 secrete COL8A1, which binds to ITGB1 on the surface of CRC cells, thereby activating the PI3K-AKT pathway and inducing EMT. 45 Given that single-cell analysis revealed predominant localization of THBS3 in fibroblasts and correlation analysis showed a strong association between THBS3 and CAFs, we propose that CAF-derived THBS3 may further reinforce EMT, likely by engaging the PI3K-AKT pathway, thereby exacerbating the malignant progression of CRC.
Although the present study provides comprehensive evidence that THBS3 serves as a novel prognostic biomarker and a potential therapeutic target for CRC, several limitations warrant consideration. First, the prognostic significance of THBS3 was primarily derived from retrospective analyses of public cohorts, large-sample prospective multicenter clinical trials are essential to fully validate its independent prognostic value. Second, this investigation has focused on the biological functions of THBS3 in cellular proliferation and metastasis, but its effects on other malignancy indicators like apoptosis, cell cycle, and metabolic reprograming have yet to be evaluated. A broader exploration will help us gain a more comprehensive understanding of the function of THBS3 in CRC. Finally, although the relationship between THBS3 and the immune landscape was analyzed in this study, basic experiments continue to be carried out to verify its role in immune regulation and elucidate the underlying molecular mechanisms.
Conclusion
In this study, we analyzed the differential expression and prognostic value of the THBS gene family in CRC through bioinformatics analyses, identifying THBS3 as the most relevant member. Further investigation showed a strong association between THBS3 and immune responses, as well as the tumor microenvironment. Experimental validation confirmed that knockdown of THBS3 inhibits the proliferation, migration, and invasion of CRC cells. This study employs a multi-omics approach to investigate the significance of THBS3 as a prognostic biomarker and therapeutic target, laying a foundation for future clinical transformation.
Supplemental Material
sj-doc-7-cix-10.1177_11769351251412614 – Supplemental material for THBS3 Functions as a Novel Biomarker for Prognosis and Immunotherapeutic Response in Colorectal Cancer: An Integrative Analysis and Validation of the Thrombospondin Gene Family
Supplemental material, sj-doc-7-cix-10.1177_11769351251412614 for THBS3 Functions as a Novel Biomarker for Prognosis and Immunotherapeutic Response in Colorectal Cancer: An Integrative Analysis and Validation of the Thrombospondin Gene Family by Tao Jiang, Sichao Zhu, Hengyi Zhou, Ningning Zhang, Long Zhang, Changwen Zou and Hu Song in Cancer Informatics
Supplemental Material
sj-docx-1-cix-10.1177_11769351251412614 – Supplemental material for THBS3 Functions as a Novel Biomarker for Prognosis and Immunotherapeutic Response in Colorectal Cancer: An Integrative Analysis and Validation of the Thrombospondin Gene Family
Supplemental material, sj-docx-1-cix-10.1177_11769351251412614 for THBS3 Functions as a Novel Biomarker for Prognosis and Immunotherapeutic Response in Colorectal Cancer: An Integrative Analysis and Validation of the Thrombospondin Gene Family by Tao Jiang, Sichao Zhu, Hengyi Zhou, Ningning Zhang, Long Zhang, Changwen Zou and Hu Song in Cancer Informatics
Supplemental Material
sj-docx-2-cix-10.1177_11769351251412614 – Supplemental material for THBS3 Functions as a Novel Biomarker for Prognosis and Immunotherapeutic Response in Colorectal Cancer: An Integrative Analysis and Validation of the Thrombospondin Gene Family
Supplemental material, sj-docx-2-cix-10.1177_11769351251412614 for THBS3 Functions as a Novel Biomarker for Prognosis and Immunotherapeutic Response in Colorectal Cancer: An Integrative Analysis and Validation of the Thrombospondin Gene Family by Tao Jiang, Sichao Zhu, Hengyi Zhou, Ningning Zhang, Long Zhang, Changwen Zou and Hu Song in Cancer Informatics
Supplemental Material
sj-docx-3-cix-10.1177_11769351251412614 – Supplemental material for THBS3 Functions as a Novel Biomarker for Prognosis and Immunotherapeutic Response in Colorectal Cancer: An Integrative Analysis and Validation of the Thrombospondin Gene Family
Supplemental material, sj-docx-3-cix-10.1177_11769351251412614 for THBS3 Functions as a Novel Biomarker for Prognosis and Immunotherapeutic Response in Colorectal Cancer: An Integrative Analysis and Validation of the Thrombospondin Gene Family by Tao Jiang, Sichao Zhu, Hengyi Zhou, Ningning Zhang, Long Zhang, Changwen Zou and Hu Song in Cancer Informatics
Supplemental Material
sj-docx-4-cix-10.1177_11769351251412614 – Supplemental material for THBS3 Functions as a Novel Biomarker for Prognosis and Immunotherapeutic Response in Colorectal Cancer: An Integrative Analysis and Validation of the Thrombospondin Gene Family
Supplemental material, sj-docx-4-cix-10.1177_11769351251412614 for THBS3 Functions as a Novel Biomarker for Prognosis and Immunotherapeutic Response in Colorectal Cancer: An Integrative Analysis and Validation of the Thrombospondin Gene Family by Tao Jiang, Sichao Zhu, Hengyi Zhou, Ningning Zhang, Long Zhang, Changwen Zou and Hu Song in Cancer Informatics
Supplemental Material
sj-docx-5-cix-10.1177_11769351251412614 – Supplemental material for THBS3 Functions as a Novel Biomarker for Prognosis and Immunotherapeutic Response in Colorectal Cancer: An Integrative Analysis and Validation of the Thrombospondin Gene Family
Supplemental material, sj-docx-5-cix-10.1177_11769351251412614 for THBS3 Functions as a Novel Biomarker for Prognosis and Immunotherapeutic Response in Colorectal Cancer: An Integrative Analysis and Validation of the Thrombospondin Gene Family by Tao Jiang, Sichao Zhu, Hengyi Zhou, Ningning Zhang, Long Zhang, Changwen Zou and Hu Song in Cancer Informatics
Supplemental Material
sj-docx-6-cix-10.1177_11769351251412614 – Supplemental material for THBS3 Functions as a Novel Biomarker for Prognosis and Immunotherapeutic Response in Colorectal Cancer: An Integrative Analysis and Validation of the Thrombospondin Gene Family
Supplemental material, sj-docx-6-cix-10.1177_11769351251412614 for THBS3 Functions as a Novel Biomarker for Prognosis and Immunotherapeutic Response in Colorectal Cancer: An Integrative Analysis and Validation of the Thrombospondin Gene Family by Tao Jiang, Sichao Zhu, Hengyi Zhou, Ningning Zhang, Long Zhang, Changwen Zou and Hu Song in Cancer Informatics
Supplemental Material
sj-docx-8-cix-10.1177_11769351251412614 – Supplemental material for THBS3 Functions as a Novel Biomarker for Prognosis and Immunotherapeutic Response in Colorectal Cancer: An Integrative Analysis and Validation of the Thrombospondin Gene Family
Supplemental material, sj-docx-8-cix-10.1177_11769351251412614 for THBS3 Functions as a Novel Biomarker for Prognosis and Immunotherapeutic Response in Colorectal Cancer: An Integrative Analysis and Validation of the Thrombospondin Gene Family by Tao Jiang, Sichao Zhu, Hengyi Zhou, Ningning Zhang, Long Zhang, Changwen Zou and Hu Song in Cancer Informatics
Footnotes
Acknowledgements
We would like to thank all individuals, including the patients, who participated in this work. We also appreciate the team that provided access to the GEO database, enabling boundaryless scientific research.
Ethical Considerations
All specimens were confirmed by pathology and all patients signed informed consent before study entry following the Declaration of Helsinki. The Medical Ethics Committee of the Affiliated Hospital of Xuzhou Medical University reviewed and approved this study (XYFY2023-KL229-01).
Consent to Participate
Not applicable.
Consent for Publication
Not applicable.
Author Contributions
HS and TJ contributed to the conception and design of this study. TJ, CSZ, and YHZ prepared the figures and drafted the manuscript. HS reviewed and revised the manuscript. CSZ, YHZ, NNZ, and LZ conducted in vitro cell experiments. WCZ, CSZ, and YHZ performed bioinformatics analyses. All authors have read and approved the final manuscript.
Funding
The authors disclosed receipt of the following financial support for the research, authorship, and/or publication of this article: Our study was funded by grants from the Jiangsu Province Youth Science and Technology Talent Lifting Project (JSTJ-2024-384), Preventive Medicine Research Project of Jiangsu Commission of Health (Y12023049), Advanced Program of The Affiliated Hospital of Xuzhou Medical University (PYJH2024205), Paired Assistance Scientific Research Project by The Affiliated Hospital of Xuzhou Medical University (FXJDBF2024201), Construction Project of High Level Hospital of Jiangsu Province (LCZX202508), and Postgraduate Research & Practice Innovation Program of Jiangsu Province (SJCX24_1570).
Declaration of Conflicting Interests
The authors declared no potential conflicts of interest with respect to the research, authorship, and/or publication of this article.
Data Availability Statement
The publicly available datasets utilized in this study can be accessed through online repositories. All datasets pertinent to the present research are available from the corresponding author upon reasonable request.
Supplemental Material
Supplemental material for this article is available online.
Footnotes
The abbreviations and the full names are provided in Table S7.
References
Supplementary Material
Please find the following supplemental material available below.
For Open Access articles published under a Creative Commons License, all supplemental material carries the same license as the article it is associated with.
For non-Open Access articles published, all supplemental material carries a non-exclusive license, and permission requests for re-use of supplemental material or any part of supplemental material shall be sent directly to the copyright owner as specified in the copyright notice associated with the article.