
Abstract
The study was designed to explore the mechanism of tunicamycin-induced endoplasmic reticulum stress in human esophageal cancer EC9706 cells and EC109 cells, as well as its effects on cell autophagy, apoptosis, and chemoresistance. Tunicamycin-induced endoplasmic reticulum stress model was established in EC9706 and EC109 cell lines. Western blotting was employed to detect the expression of endoplasmic reticulum stress iconic protein GRP78. 3-(4,5-Dimethylthiazol-2-yl)-2,5-diphenyltetrazolium bromide assay was used to evaluate the effect of different cisplatin and tunicamycin concentrations on survival rate of EC9706 cells and EC109 cells. Autophagy was monitored using monodansylcadaverin and apoptosis was detected by flow cytometry. Western blotting was used to detect the expressions of endoplasmic reticulum stress–related proteins (PERK, eIF2α, and CHOP), PI3K/Akt/mTOR signaling pathway–related proteins, autophagy-related proteins (LC3-I/LC3-II, Beclin-1, and p62), and apoptosis-related proteins (Bcl-2, Bax, and cleaved caspase-3). Tunicamycin led to increased expression of GRP78. With tunicamycin treatment, phosphorylation of PERK and eIF2α and CHOP expression increased. Meanwhile, the increase in cytolysosome was concentration and time dependent. With the increased tunicamycin concentration, there were increased expressions of Bax and cleaved caspase-3, decreased expression of Bcl-2, and lower phosphorylation of PI3K/Akt/mTOR signaling pathway–related proteins. Therefore, it can be concluded that the combination of tunicamycin and cisplatin could improve the sensitivity of EC9706 cells and EC109 cells to cisplatin; PI3K inhibitor BEZ235 could enhance cell autophagy and apoptosis and increase cell sensitivity to cisplatin.
Keywords
Introduction
Human esophageal cancer (HEC), a prevalent gastrointestinal malignant, is one of the top 10 cancers worldwide and with relatively high morbidity and mortality in the public. 1 International Agency for Research on Cancer (IARC) statistics revealed that there were 456,000 new cases and 4000,000 deaths in 2012 globally, and nearly 80% of the total cases occur in developing areas, among which China has high incidence and mortality of esophageal cancer showing 22.4/100,000 and 16.77/100,000, respectively. 2 Currently, surgery is the most recommended treatment for esophageal cancer, while postoperative local recurrence and metastasis still hold some clinical challenges. 3 Chemoradiotherapy is the most preferred and dependent regimen for patients with unresectable esophageal cancer, in which cisplatin is most commonly applied; yet, unfavorable effects such as drug resistance of tumor cells to cisplatin need to be investigated and resolved. 4
Endoplasmic reticulum stress (ERS) is defined as the damaged morphology and function of endoplasmic reticulum (ER) resulting from endogenous or exogenous stimulations that may lead to disorders of ER folding proteins, which initiate the cells for corresponding responses to restore normal ER function. 5 ERS usually activates unfolded protein response (UPR) to remove misfolded proteins in ER so as to maintain ER homeostasis, while apoptosis occurs when ER receives prolonged pressure or duration which leads to insufficient cell responses and apoptosis pathway switching.6,7 In addition, phosphatidylinositol-3 kinase (PI3K)/Akt/mechanistic target of rapamycin (mTOR) pathway widely distributed in cells is recognized as an important signaling pathway involved in diverse metabolisms like cell growth, proliferation, apoptosis, and differentiation regulation. 8 Activated PI3K/Akt/mTOR pathway plays a key role in the development of chemotherapy drugs and chemoresistance, and some regimens for pathway-related protein regulation have been discovered. 9 It is reported that tumor cell proliferation, like hepatocellular carcinoma cells, can be inhibited by blocking PI3K/Akt/mTOR pathway during the use of some anti-cancer drugs. 10 It is reported that ERS could be induced by inhibiting PI3K/Akt/mTOR signaling pathway, 11 and Baicalein has been shown to induce apoptosis and autophagy via ERS in hepatocellular carcinoma cells. 12 However, whether the PI3K/Akt/mTOR pathway was implicated in the ERS-induced apoptosis and autophagy in esophageal cancer remains unclear. Therefore, this study aims to explore the role of ERS induced by tunicamycin (Tm) in autophagy, apoptosis, and chemotherapy resistance of HEC EC9706 cells and EC109 cells by regulating the PI3K/Akt/mTOR signaling pathway.
Materials and methods
Cell culture
Human EC9706 cells and EC109 cells purchased from American Type Culture Collection (ATCC, Manassas, VA, USA) were incubated in Dulbecco’s Modified Eagle’s Medium (DMEM) high-glucose medium containing 10% fetal bovine serum (FBS), 100 U/mL penicillin, and 100 µg/mL streptomycin and then cultured in a 5% CO2 incubator with saturated humidity at 37°C. Cell growth was observed daily and cell passage was conducted every 3 days. Cell passage process was as follows: the medium was discarded and the incubator containing the cells was rinsed twice with phosphate-buffered saline (PBS). With the addition of 1–2 mL trypsin for digestion in the incubator for 2–3 min, the cell digestion was observed under an inverted microscope, and once most of the cells were round and dispersed, the digestion was completed. After that, 6–8 mL DMEM medium containing 10% FBS was added and mixed with the cells. Cells were then transferred into new plates and subcultured at 1:3–1:6. After the cell passage, drugs were added when cells were adherent to the plates and the cell fusion reached about 80%.
Cell grouping
EC9706 cells and EC109 cells in logarithmic phase were assigned into the control group (with no drug), Tm group (concentration gradient of Tm: 0, 1.25, 2.5, 5, and 10 µg/mL), cisplatin group (concentration gradient of cisplatin: 0, 1.25, 2.5, 5, and 10 µg/mL), Tm + cisplatin group (1.25 µg/mL Tm for 24 h and then cisplatin with concentration gradient of 0, 1.25, 2.5, 5, and 10 µg/mL), BEZ235 (a PI3K inhibitor) group (concentration gradient of BEZ235: 0, 5, 10, 20, and 40 nM), and BEZ235 + cisplatin group (concentration of BEZ235: 40 nM; concentration of cisplatin: 2.5 µg/mL).
3-(4,5-Dimethylthiazol-2-yl)-2,5-diphenyltetrazolium bromide assay
EC9706 cells and EC109 cells in logarithmic phase were selected and inoculated in 96-well plates with 1 × 10⁴ cells per well, with the plates cultured in a 5% CO2 incubator at 37°C for 24 h. In order to figure out the effects of different concentrations of Tm on cell viability, cells were treated with different concentrations of Tm (0, 1.25, 2.5, 5, and 10 µg/mL) for 24 h, and 20 µL 3-(4,5-dimethylthiazol-2-yl)-2,5-diphenyltetrazolium bromide (MTT) solution (5 mg/mL) was added into each well. In order to figure out the effects of different concentrations of cisplatin on cell viability before and after the Tm treatment, after being treated with 1.25 µg/mL Tm for 24 h, the cells were treated with different concentrations of cisplatin (0, 1.25, 2.5, 5, and 10 µg/mL) for another 24 h with 20 µL MTT solution (5 mg/mL) in each well. The EC9706 cells and EC109 cells were assigned into the control group, cisplatin group (2.5 µg/mL), BEZ235 group (40 nM), and BEZ235 + cisplatin group (concentration of BEZ235: 40 nM; concentration of cisplatin: 2.5 µg/mL), and cells were treated with corresponding drugs for 24 h with 20 µL MTT (5 mg/mL) in each well. Afterwards, cells were cultured in a 5% CO2 incubator at 37°C for 4 h, followed by the discard of the supernatant. A volume of 200 µL dimethyl sulfoxide (DMSO) was then added into each well and vibrated for 10 min in the dark. Optical density (OD) at 545 nm (which is positively correlated with living cells) in each well was determined by microplate reader. The OD value of the well with only DMSO was regarded as A value (background value), based on which the cell viability was calculated. Cell viability = (A value in the test groups − A value)/(A value in the control group − A value) × 100%, and the test was repeated at least three times.
Western blotting
EC9706 cells in logarithmic phase were collected and treated with Tm, while EC9706 cells and EC109 cells in logarithmic phase were digested with 0.4% trypsin and then rinsed twice with pre-cooled PBS. Cells were suspended in DMEM to achieve a concentration of 2 × 10⁴ cells/mL, and 2 mL diluted cells were incubated in six-well plates overnight to make cells adherent to plates. Afterwards, the collected cells were digested with trypsin (ethylenediaminetetraacetic acid (EDTA) free) and then rinsed with pre-cooled PBS twice. The total cellular proteins were extracted from above cell pellet, 1× sodium dodecyl sulfate (SDS) loading buffer was added for 10 min at 95°C, the cell sap was centrifuged at 10,000×g for 20 min, and the supernatant was certified as the total cellular proteins. The cytoplasmic protein was extracted as follows: the cell pellet was mixed with cytoplasmic extraction buffer for 10 min, during which the cells were vibrated. Cell solution was then centrifuged (700×g) for 10 min, from which the obtained supernatant was centrifuged at 10,000×g for 30 min, with the cytoplasmic proteins being the final supernatant. The extracted total proteins and cytoplasmic proteins were analyzed by SDS polyacrylamide gel electrophoresis (SDS-PAGE) electrophoresis (separation gel concentration was chosen based on different protein molecules, generally ranging from 12% to 15%) at 100 V for 3 h. Afterwards, the proteins were transferred to polyvinylidene fluoride (PVDF) membrane, and 5% skimmed milk powder was utilized to block the non-specific binding sites on the PVDF. Afterwards, the specific primary antibodies of murine PERK, eIF2α, p-ERK, p-eIF2α, CHOP, Akt, p-Akt, p-mTOR, mTOR, Atg5, Atg7, LC3I/II, Beclin-1, p62, Bcl-2, Bax, and cleaved caspase-3 were diluted at 1:5000 and added to culture the protein overnight at 4°C. Afterwards, the cells were rinsed with phosphate-buffered saline with Tween 20 (PBST; 3 times × 10 min). The membranes were incubated with the second antibody of horseradish peroxidase (HRP)-labeled goat anti-mouse at room temperature for 1 h and then rinsed with PBST (3 times × 10 min). Finally, the targeted bands were filmed with chemiluminescence kit X-rays. The β-actin was selected as internal reference protein to display the same protein sample.
Flow cytometry
Targeted cells were digested with trypsin (EDTA free), and 1 × 10⁵ cells were collected after they were rinsed twice with PBS and centrifuged at 2000 r/min for 5 min. A volume of 500 µL Annexin V-Binding Buffer, 5 µL Annexin V–fluorescein isothiocyanate (FITC), and 5 µL propidium iodide were then mixed with cells successively for reaction at room temperature for 10 min in dark. Flow cytometry (FCM) was applied to detect cell apoptosis.
Monodansylcadaverin staining and fluorescence microscopy
Monodansylcadaverin (MDC), a fluorochrome, was used as a tracer of autophagic vesicles, while MDC staining combined with fluorescence microscopy was utilized for autophagy detection. EC9706 cells were inoculated into 96-well plates, and the completed medium containing serum was removed before staining. The cells were rinsed twice using 0.01 M PBS and then they were incubated with 0.05 mmol/L MDC at less than 37°C for 10 min. After being rinsed twice with PBS, cells were lysed using lysis buffer (0.50% Triton X-100, pH 7.5). Fluorescence microscope (Olympus Optical Co., Ltd, Tokyo, Japan) was used to observe the cells at the length of 356 nm and the cells were photographed. The positive cells were found to be colored in perinuclear region by fluorescence staining.
Statistical analysis
The statistical analyses were conducted with SPSS 17.0 software. All measurement data were presented as mean ± standard deviation (SD). Differences among groups were analyzed using one-way analysis of variance (ANOVA). Pairwise comparisons were analyzed using Dunnett’s t-test; p < 0.05 was considered statistically different.
Results
The cytotoxic effects of different Tm concentration on EC9706 cells and EC109 cells detected by MTT assay
Tm is considered as the common regent in inducing ERS, while large doses of Tm with long duration on cells can lead to apoptosis. A low concentration of Tm was first selected in the study to induce ERS only and avoid cell apoptosis. Tm (1.25–10 µg/mL) was adopted to treat EC9706 cells and EC109 cells for 24 h, followed by the detection of cell inhibition rate by MTT assay. The effect of Tm (1.25 µg/mL) resulted in a cell inhibition rate of only about 3% with no obvious apoptosis occurrence (Figure 1(a)). Therefore, 1.25 µg/mL Tm was selected in this study to induce ERS to EC9706 cells and EC109 cells. Moreover, after cell treatment with 1.25 µg/mL Tm for 24 h, the result of western blotting revealed that expression of ERS marker protein GRP78 was upregulated significantly compared with the 0 µg/mL group (Figure 1(b)–(d)), which indicated that 1.25 µg/mL Tm with an action time of 24 h was preferred for EC9706 cells and EC109 cells to induce ERS.

Cytotoxic effects of different Tm concentration on EC9706 cells and EC109 cells detected by MTT assay. (a) Inhibition rate of EC9706 cells and EC109 cells after being treated with different concentrations of Tm for 24 h. (b) Expression of GRP78 protein in EC9706 cells and EC109 cells after the treatment of 0 and 1.25 µg/mL Tm. (c) Cartograms: expressions of GRP78 protein in EC9706 cells after the treatment of 0 µg/mL and 1.25 µg/mL Tm. (d) Cartograms: expressions of GRP78 protein in EC109 cells after the treatment of 0 and 1.25 µg/mL.
Expression of ERS and PI3K/Akt/mTOR signaling pathway–related proteins with the treatment of different Tm concentrations
ERS pathway–related proteins (PERK, eIF2α, and CHOP) and PI3K/Akt/mTOR pathway–related proteins were detected by western blotting after EC9706 cells and EC109 cells were treated with different concentrations of Tm (Figure 2). The phosphorylated proteins of PERK, eIF2α, and CHOP elevated significantly with the increase in Tm concentrations. The expressions of p-PEAK, p-eIF2α, and CHOP distinctly increased when the Tm concentrations were 2.5, 5, and 10 µg/mL compared with the 0 µg/mL group (all p < 0.05). Without Tm, phosphorylated proteins of Akt and mTOR in PI3K/Akt/mTOR signaling pathway exhibited a certain expression, and the expressions of the two proteins were downregulated with Tm of 5 and 10 µg/mL (all p < 0.05). Moreover, the increase in Tm concentration resulted in the decrease in Akt and mTOR expressions. Total proteins of PERK, eIF2α, Akt, and mTOR were unaffected by different Tm concentrations (all p > 0.05).

Expressions of ERS and PI3K/Akt/mTOR signaling pathway–related proteins with the treatment of different Tm concentrations. (a) Expressions of PI3K/Akt/mTOR signaling pathway–related proteins in EC9706 cells detected by western blotting. (b) Expressions of PI3K/Akt/mTOR signaling pathway–related proteins in EC109 cells detected by western blotting. (c) Cartograms: expressions of PI3K/Akt/mTOR signaling pathway–related proteins in EC9706 cells. (d) cartograms: expressions of PI3K/Akt/mTOR signaling pathway–related proteins in EC109 cells (**p < 0.05, compared with the cells treated with 0 µg/mL Tm; Tm: tunicamycin).
Autophagy and apoptosis of EC9706 cells and EC109 cells with the treatment of different Tm concentrations
MDC staining was employed to detect Tm-induced cell autophagy. In comparison with the concentration of 0 µg/mL, there was no increased intracellular green fluorescent found with the Tm concentration of 1.25 and 2.5 µg/mL (all p > 0.05), while green fluorescent augmented significantly with the Tm concentration of 5 and 10 µg/mL (all p < 0.05), which indicated that Tm induction resulted in cell autophagy (Figure 3(a)). Electron microscope was used to observe cytolysosome after the treatment of Tm (Figure 3(b)), and the result showed that there was no significant difference in cytolysosome between the cells treated with 0 µg/mL Tm and those with 1.25 and 2.5 µg/mL Tm (all p > 0.05), while a remarkably increased cytolysosome could be observed (all p < 0.05) when cells were treated with 5 and 10 µg/mL, suggesting that Tm induced cell autophagy. Cell apoptosis at different concentrations of Tm was monitored using FCM (Figure 3(c) and (d)). It suggested that Tm-induced EC9706 cells and EC109 cells apoptosis was concentration-dependent. The proportion of apoptotic cells treated with 1.25, 2.5, 5, and 10 µg/mL Tm elevated evidently compared with those treated with 0 µg/mL Tm. To further confirm the incidence of autophagy and apoptosis, western blotting was used to detect expression of autophagy-related proteins (Atg5, Atg7 and Beclin-1, LC3, and p62; Figure 3(e)) and apoptosis-related proteins (Bcl-2, Bax, and cleaved caspase-3; Figure 3(f)). The result demonstrated that expressions of Beclin-1 and LC3II increased distinctly when Tm was 1.25 µg/mL in comparison with 0 µg/mL, and the expressions remains high with the Tm concentration of 1.25, 2.5, 5, and 10 µg/mL (p < 0.05), but p62 expression increased at first, before decreasing. According to the statistical analysis, cells treated with 1.25, 2.5, 5, and 10 µg/mL Tm exhibited much lesser expression of anti-apoptosis protein Bcl-2 (p < 0.05) compared to those treated with 0 µg/mL Tm. Meanwhile, the expressions of cleaved caspase-3 and Bax in cells treated with 1.25 µg/mL Tm showed no increase compared with those treated with 0 µg/mL Tm, while expressions of the two pro-apoptotic proteins were upregulated significantly when treated with Tm whose concentrations were 2.5, 5, and 10 µg/mL (p < 0.05).

Expressions of autophagy and apoptosis-related proteins after treatment of different Tm concentrations. (a) Cytophagosome in EC9706 cells and EC109 cells under fluorescence microscope after treatment of different Tm concentrations for 24 h. (b) Cytophagosome in EC9706 cells and EC109 cells under electron microscope after treatment of different Tm concentrations for 24 h. (c) Apoptosis of EC9706 cells after the treatment of different Tm concentrations detected by flow and corresponding cartograms. (d) Apoptosis of EC109 cells after the treatment of different Tm concentrations detected by flow and corresponding cartograms. (e) Expression of autophagy and apoptosis-related proteins in EC9706 cells after treatment of different Tm concentrations and corresponding cartograms. (f) Expression of autophagy and apoptosis-related proteins in EC109 cells after treatment of different Tm concentrations and corresponding cartograms (**p < 0.05, compared with the cells treated with 0 µg/mL Tm; Tm: tunicamycin).
The viability of EC9706 cells and EC109 cells with different cisplatin concentrations after Tm-induced ERS
Cells were treated with cisplatin alone for 24 h or they were treated with 1.25 µg/mL Tm for 24 h before being treated with cisplatin for another 24 h. It turned out that cell activity was negatively correlated with cisplatin concentration, namely, the activity of EC9706 cells and EC109 cells decreased with increasing concentrations of cisplatin. Moreover, cells treated with both Tm and cisplatin were more sensitive to cisplatin compared with those treated with cisplatin only. When cells were treated with only cisplatin for 24 h, IC50 of EC9706 cells and EC109 cells to cisplatin was (5.94 ± 0.92) µg/mL, while IC50 of those treated with both Tm and cisplatin was (4.78 ± 0.86) µg/mL (p < 0.05) (Figure 4(a) and (b)). Our results suggested that EC9706 and EC109 cells performed stronger sensitivity to chemotherapeutic cisplatin after Tm-induced ERS, which could reduce the chemoresistance incidence.
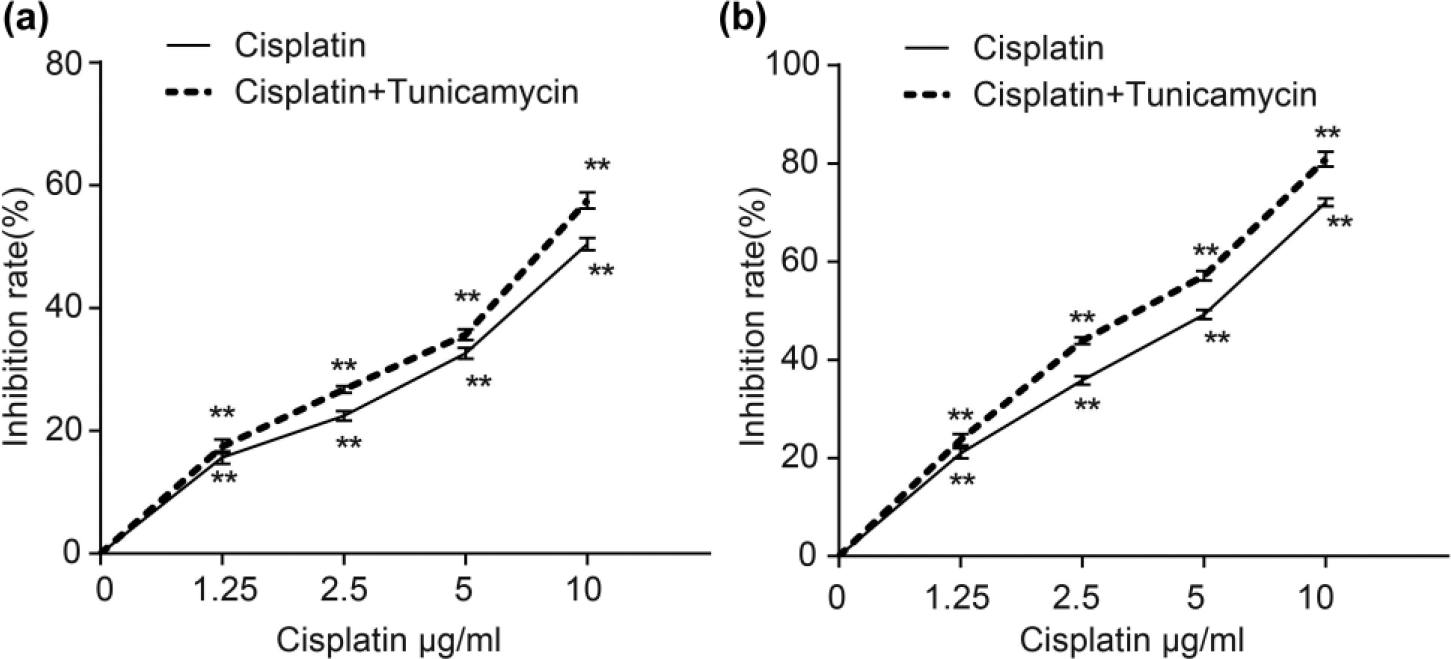
Inhibitory effect of cisplatin on cell proliferation before and after Tm treatment. (a) Inhibitory effect of cisplatin on EC9706 cell proliferation before and after Tm treatment. (b) Inhibitory effect of cisplatin on EC109 cell proliferation before and after Tm treatment (**p < 0.05 compared with the cells treated with 0 µg/mL cisplatin; Tm: tunicamycin).
The autophagy and apoptosis of EC9706 cells and EC109 cells with different cisplatin concentrations after Tm induced ERS
MDC staining and fluorescence microscopy were used to detect cell autophagy after different concentration treatments of cisplatin (Figure 5(a)). Compared with cells treated with 0 µg/mL cisplatin, the green fluorescence in those treated with 1.25 and 2.5 µg/mL cisplatin presented no increase, while green fluorescence was greatly increased in cells treated with 5 and 10 µg/mL cisplatin, suggesting the possibility of autophagy occurrence with the increase in cisplatin concentration. In order to confirm whether Tm could affect the sensitivity of EC9706 cells and EC109 cells to cisplatin, cells were first treated with 1.25 µg/mL Tm for 24 h, followed by the use of FCM to detect the effects of different concentrations of cisplatin (0, 1.25, 2.5, 5, and 10 µg/mL) on cell apoptosis (Figure 5(b)). It was found that before and after 1.25 µg/mL Tm treatment, the effect of cisplatin on EC9706 cells and EC109 cells apoptosis presented concentration dependence. Compared to cells treated with 0 µg/mL cisplatin, those treated with 1.25 µg/mL cisplatin showed no difference before and after the Tm treatment (p > 0.05). After cells were treated with 1.25 µg/mL Tm for 24 h, western blotting was used to figure out the effect of different concentrations of cisplatin on cell autophagy–related pathway (Figure 5(c)). Expression of autophagy pathway–related proteins (Beclin-1, LC3II, and p62) in cells treated with different concentrations of cisplatin turned out to be significantly higher than those treated with 0 µg/mL cisplatin, and they exhibited extremely higher level with the 5 µg/mL and 10 µg/mL cisplatin (p < 0.05). Meanwhile, the activity of pro-apoptotic proteins (cleaved caspase-3c and Bax) enhanced and anti-apoptotic protein Bcl-2 declined in cells treated with different concentrations of cisplatin in comparison to those with 0 µg/mL cisplatin (all p < 0.05).

Autophagy and apoptosis of EC9706 cells and EC109 cells with different cisplatin concentrations after Tm-induced ERS. (a) Effects of different cisplatin concentrations on cell autophagy detected by monodansylcadaverin. (b) Effects of different cisplatin concentration on cell apoptosis detected by flow cytometry. (c) Effect of different cisplatin concentration on expression of autophagy and apoptosis-related proteins after Tm treatment (**p < 0.05, compared with the cells treated with 0 µg/mL cisplatin; Tm: tunicamycin).
Expressions of ERS and PI3K/Akt/mTOR signaling pathway–related proteins with the treatment of different BEZ235 concentrations
With treatments of different concentrations of BEZ235, expressions of ERS pathway and PI3K/Akt/mTOR pathway–related proteins in EC9706 cells and EC109 cells were detected by western blotting. It showed that the expressions of p-PEAK, p-eIF2α, and CHOP proteins were increased in cells treated with 5, 10, 20, and 40 nM BEZ235 compared to those treated with 0 nM (all p < 0.05) (Figure 6(a)), while total protein expression of PEAK and eIF2α showed no evident difference, indicating that BEZ235 induced ERS in EC9706 cells and EC109 cells. When BEZ235 was at low concentrations, there were no significant differences in total protein expressions of PI3K, Akt, and mTOR. However, when BEZ235 concentration increased from 5 nM, the expression of p-PI3K, p-Akt, and p-mTOR showed a concentration-dependent decrease and reached the lowest at 20 and 40 nM (all p < 0.05; Figure 6(b)), which indicated that BEZ235 suppressed the PI3K/Akt/mTOR signaling pathway. It brought to light that BEZ235 enabled EC9706 cells and EC109 cells to have ERS and inhibit the PI3K/Akt/mTOR signaling pathway.

Expressions of ERS and PI3K/Akt/mTOR signaling pathway–related proteins with the treatment of different BEZ235 concentrations. (a) Cartograms: expression of ERS and PI3K/Akt/mTOR signaling pathway–related proteins in EC9706 cells after treatment of different BEZ235 concentrations. (b) Cartograms: expression of ERS and PI3K/Akt/mTOR signaling pathway–related proteins in EC109 cells after treatment of different BEZ235 concentrations (ERS: endoplasmic reticulum stress; **p < 0.05 compared with the cells treated with 0 nM BEZ235).
Effects of the treatment of different BEZ235 concentrations on autophagy and apoptosis of EC9706 cells and EC109 cells
According to western blotting, expressions of LC3II and Beclin-1 in cells treated with 5, 10, 20, and 40 nM BEZ235 increased with the increasing inhibitor concentrations compared with those treated with 0 µM BEZ235 (all p < 0.05). Anti-apoptotic protein Bcl-2 had less expression and pro-apoptotic proteins (cleaved caspase-3 and Bax) exhibited higher expression in cells treated with 5, 10, 20, and 40 nM BEZ235 compared to those with 0 µM BEZ235 (all p < 0.05; Figure 7(a)). According to the result detected by FCM, apoptotic cells increased along with increasing BEZ235 concentration (Figure 7(c, d)), and when compared to cells treated with 0 nM BEZ235, the proportion of apoptotic cells treated with 5,10, 20, and 40 nM BEZ235 became larger (all p < 0.05; Figure 7(b)). It could be asserted that BEZ235 could induce autophagy and apoptosis in EC9706 cells and EC109 cells.

Effects of different concentrations of BEZ235 treatments on autophagy and apoptosis of EC9706 cells and EC109 cells. (a) Expression of autophagy and apoptosis-related proteins in EC9706 cells and EC109 cells after the treatment of different BEZ235 concentrations. (b) Cartograms of cell apoptosis. (c) Cell apoptosis conditions in EC9706 cells after the treatment of different BEZ235 concentrations detected by flow cytometry . (d) Cell apoptosis conditions of EC109 cells after the treatment of different BEZ235 concentrations detected by flow cytometry. (**p < 0.05, compared with the cells treated with 0 nM BEZ235).
Effects of BEZ235 and cisplatin on the autophagy and apoptosis of EC9706 cells and EC109 cells
After EC9706 cells were treated with cisplatin (2.5 µg/mL) and BEZ235 (40 µM) for 24 and 48 h, MTT was applied to detect the cell viability in the control group, the cisplatin group, the BEZ235 group, and the cisplatin combined with BEZ235 group. It was found that the combination of cisplatin with BEZ235 could result in significantly decreased cell viability in a time-dependent manner compared with the treatment of cisplatin only (p < 0.05; Figure 8(a, b)), promoting lower cell viability due to combined effects, and BEZ235 enhanced cell sensitivity to cisplatin. The result of western blotting revealed that expressions of autophagy-related proteins (Beclin-1, LC3II, and p62) increased distinctly in the cisplatin + BEZ235 group compared with the cisplatin group. Additionally, anti-apoptotic protein Bcl-2 presented significantly lower expression, and pro-apoptotic proteins (Bax and cleaved caspase-3) manifested distinctly higher expression in cisplatin + BEZ235 group than the cisplatin group (Figure 8(c, d) and (e, f)).

Effects of BEZ235 combined with cisplatin on cell survival rate, autophagy, and apoptosis. (a) Comparison of survival rate among the EC9706 cells treated with cisplatin, with BEZ235 and with both cisplatin and BEZ 235 at 24 and 48 h, respectively. (b) Comparison of survival rate among the EC109 cells treated with cisplatin, with BEZ235 and with both cisplatin and BEZ 235 at 24 and 48 h, respectively. (c) Expression of autophagy and apoptosis-related proteins in EC9706 cells. (d) Expression of autophagy and apoptosis-related proteins in EC109 cells. (e) Cartogram: expression of autophagy and apoptosis-related proteins in EC9706 cells. (f) Cartogram: expression of autophagy and apoptosis-related proteins in EC109 cells (**p < 0.05 compared with the cells treated with only cisplatin).
Discussion
Esophageal cancer as a common malignancy still remains as a severe challenge in clinical chemoresistance. 13 According to reports, cisplatin is viewed as the main chemotherapy drug, and cisplatin resistance may result from autophagy and apoptosis caused by ERS. 14 Therefore, Tm was utilized to establish ERS model, and the mechanism of cisplatin resistance in therapy of esophageal cancer was pursued from the point of ERS in this article.
It indicated that expression of p-PERK, p-eIF2α, and CHOP significantly elevated with increasing concentrations of Tm, leading to occurrence of autophagy and apoptosis as well as the enhanced cell sensitivity to cisplatin. Tm, an N-glycosylation inhibitor, causes UPR and is widely used as pharmacological inducer of ERS. 15 When Tm exceeds the tolerance capacity of UPR, ERS leads to apoptosis. 16 PERK is an ER type I transmembrane protein kinase that binds with GRP78 in an inactive state. When ERS occurs, PERK separates from GRP78 and lowers its transcription by eIF2α phosphorylation to reduce proteins from Golgi apparatus to ER, maintaining ER homeostasis. 17 However, signaling molecules (CHOP and Bcl-2) in the downstream activated by PERK can facilitate apoptosis when ERS is intensive. 18 It also verified that ERS activation could result in high CHOP expression and Bcl-2 changes, thereby promoting apoptosis. 19 Meanwhile, ERS is also confirmed to stimulate the accumulation of autophagosome former structure, 20 regulating autophagy. This article also demonstrates the distinctly increased expressions of Beclin-1, LC3II, and p62, as well as an enhancement in cleaved caspase-3 and Bax activity and anti-apoptotic protein Bcl-2 attenuated with Tm pretreatments and cisplatin application. It was reported that LC3 presented the transition from LC3-I to LC3II, and the expression of LC3II increased significantly when Tm was used to induce mouse embryo to arouse ERS, indicating autophagy incidence. 21 Evidence also supported that cisplatin was shown to induce activation of caspase-12 and upregulate the expression of another ER stress marker, GRP78. 22
According to our findings, BEZ235 enabled EC9706 cells and EC109 cells to elevate ERS, which suppressed the PI3K/Akt/mTOR signaling pathway and induced autophagy and apoptosis. BEZ235 as a PI3K inhibitor with antitumor activity has been used in clinical trials. 23 BEZ235 is involved in the regulation of PI3K/Akt/mTOR signaling pathway through a combination of adenosine triphosphate (ATP) of PI3K and mTOR kinase to regulate the enzyme activity, thus regulating autophagy and apoptosis. 24 Simultaneously, BEZ235 combined with cisplatin was adopted in EC9706 cells in this article, demonstrating that expressions of Beclin-1, LC3II, and P62 increased a lot, while Bcl-2 lessened evidently and Bax and cleaved caspase-3 increased significantly in cisplatin + BEZ235 group compared to the single cisplatin group. It was noted that downregulation of mTOR activity would evoke autophagy. 25 Therefore, it could be speculated that the combination of BEZ235 with cisplatin could regulate PI3K/Akt/mTOR signaling pathway in a more effective and direct manner to trigger autophagy and apoptosis than cisplatin alone. In addition, BEZ235 could improve efficacy of drug treatments with increased apoptosis, 26 which illuminated the fact that anti-apoptotic protein Bcl-2 had decreased expression, and pro-apoptotic proteins (cleaved caspase-3 and Bax) presented increased expression when cells were treated with BEZ235 and cisplatin.
In conclusion, Tm can induce ERS and consequent autophagy and apoptosis in EC9706 cells and EC109 cells, which makes them more sensitive to cisplatin, providing references and approaches for tumor chemoresistance in HEC. However, our results still need to be confirmed in future studies.
Footnotes
Acknowledgements
The authors would like to acknowledge the helpful comments on this paper received from the reviewers.
Declaration of conflicting interests
The author(s) declared no potential conflicts of interest with respect to the research, authorship, and/or publication of this article.
Funding
The author(s) disclosed receipt of the following financial support for the research, authorship, and/or publication of this article: This study was supported by Henan Provincial Department of Science and Technology Research Project (162102310080).