
Abstract
Insulin-like growth factor 2 messenger RNA-binding proteins have been described to associate with malignant process in many cancers. However, the role of insulin-like growth factor 2 messenger RNA-binding protein family has not been thoroughly elucidated in non–small cell lung cancer. This study was to investigate the expression profile, clinical significance, and biological function of insulin-like growth factor 2 messenger RNA-binding proteins family in non–small cell lung cancer. The expression levels of IGF2BP1–IGF2BP3 in tumor and adjacent normal tissues were determined, and association with clinicopathological features and overall survival was investigated by analyzing The Cancer Genome Atlas lung cancer database. Proliferation, migration, invasion assays, and flow-cytometry analysis were used to investigate the biological function in vitro. Insulin-like growth factor 2 messenger RNA-binding protein expression levels were significantly increased in non–small cell lung cancer compared to adjacent normal lung tissues. Chi-square test indicated that IGF2BP1 and IGF2BP3 expressions correlated with some meaningful clinical characteristics in non–small cell lung cancer. Kaplan–Meier analysis showed that high-level expression of IGF2BP1 or IGF2BP3 predicted poor overall survival in lung adenocarcinoma patients. Multivariate regression analysis showed that high level of IGF2BP3 was an independent risk factor for poor prognosis in lung adenocarcinoma patients (hazard ratio = 1.616, p = 0.017). In vitro, knockdown of IGF2BP3 inhibited lung adenocarcinoma cell proliferation by inducing cell cycle arrest and apoptosis, and undermined abilities of migration and invasion, and overexpression of IGF2BP3 could promote malignant phenotypes in lung adenocarcinoma cells. Our study revealed that expression of insulin-like growth factor 2 messenger RNA-binding proteins was widely upregulated and correlated with some certain clinicopathological features in non–small cell lung cancer. Especially, in insulin-like growth factor 2 messenger RNA-binding protein family, IGF2BP3 might play the most important role in tumor aggressiveness and prognosis in lung adenocarcinoma, and IGF2BP3 might serve as a potential therapeutic target and a novel prognostic biomarker in lung adenocarcinoma patients.
Keywords
Introduction
Lung cancer is the most common malignancy worldwide, and it also acts as the leading cause of cancer-related death. 1 Two main histological subtypes are included: non–small cell lung cancer (NSCLC) and small cell lung cancer. NSCLC contributes to about 85% of all lung cancers, and lung adenocarcinoma (LUAD) has become the most common type of NSCLC in recent years.1,2 In spite of advances in lung cancer therapies, prognosis of NSCLC is still unfavorable, with an overall 5-year survival rate less than 15%. 3 Therefore, effective prognostic biomarkers and potential drug targets are eagerly needed.
RNA-binding proteins (RBPs) bind to specific motifs in RNA structures to exert their roles in various biological processes. 4 Dysfunction of RBPs causes diseases, such as neural disease, metabolic disease, and cancer.5,6 Insulin-like growth factor 2 messenger RNA-binding proteins (IGF2BPs), also known as IMPs, are evolutionally conserved RBPs in metazoan genomes. These proteins contain evolutionally conserved RNA recognition motif 1 domains and K homology domains. 7 IGF2BP1 is the best-studied IGF2BP. IGF2BP1 acts in various important biological pathways, such as RNA location, translation, and stability.8–10 IGF2BP1 was reported to promote proliferation,11,12 invasion,11,13 and chemoresistance 14 in various cancers, and overexpression of IGF2BP1 predicts poor prognosis.15,16 IGF2BP3 shows a high identity (73%) with IGF2BP1, and the two proteins share similar biological functions. 7 IGF2BP3 has also been proposed as a oncofetal protein in a variety of cancers including LUAD. 17 Moreover, IGF2BP3 overexpression also predicts poor prognosis in endometrial carcinoma, 18 ovarian cancer, 19 oral squamous cell carcinoma, 20 and colorectal cancer. 21 As for IGF2BP2, the clinical role has also been investigated in several cancers, such as colorectal cancer, 22 hepatocellular carcinoma, 23 breast cancer, 24 and embryonal rhabdomyosarcoma. 25 Although IGF2BPs have been widely investigated in a variety of cancers, comprehensive analysis on IGF2BP family in NSCLC has never been performed.
In this study, for the first time, we performed systematic analysis of IGF2BP family in NSCLC. Results indicated that IGF2BPs are widely upregulated in NSCLC, and IGF2BP3 overexpression is the only independent risk factor for poor prognosis in LUAD patients. In addition, we also explore biological significance of IGF2BP3 in LUAD cells. Our findings suggest that IGF2BPs, especially IGF2BP3, play a significant role in LUAD progression and predict poor prognosis for LUAD patients.
Materials and methods
Data sources and bioinformatics
TCGA_LUAD_exp_HiSeqV2-2015-02-24 and TCGA_LUSC_exp_HiSeqV2-2015-02-24 were downloaded at the website of the UCSC cancer browser (http://genome-cancer.ucsc.edu).26,27 These data were obtained using the next-generation sequencing IlluminaHiSeq platform, containing 511 and 502 pathologically diagnosed lung cancer tissue samples with corresponding 58 and 51 paired normal lung tissue samples, respectively. A total of 400 out of 511 LUAD patients and 409 out of 502 lung squamous cell carcinoma (LUSC) patients with full-scale clinical data and follow-up information were chosen for further investigation. Values for IGF2BP expression were obtained from the “genomicMatrix” file, and all messenger RNA (mRNA) expression values were normalized. Then, in order to pick out appropriate cell lines for functional research, the Cancer Cell Line Encyclopedia (http://www.broadinstitute.org/ccle/home) 28 was used, and the expression of IGF2BP3 in LUAD cells was evaluated.
Tissue collection and immunohistochemistry
In this study, paired samples of NSCLC tissues and adjacent normal tissues from patients who underwent surgical resection at the Affiliated Cancer Hospital of Nanjing Medical University (Nanjing, China) from 2013 to 2015. Informed written consent for scientific use of biological material was obtained from each patient, and this study was approved by the Ethics Committee of Cancer Institute of Jiangsu Province. Immunohistochemistry (IHC) for IGF2BP expression in samples was performed using standard methods. Briefly, tissue sections were deparaffinized and rehydrated through graded alcohol. Endogenous peroxidase activity was blocked by incubation in 3% H2O2. Antigen retrieval was carried out with 0.01 M citrate buffer (pH 6.0) and microwave heat induction. Staining was scored by blinded observers (including a pathologist) according to intensity and percentage of positive cells.
Cell lines, cell culture, and transfection
H1299, H1975, and A549 cells were obtained from American Type Culture Collection (ATCC, USA), and human bronchial epithelial cell (HBE) was gifted by Dr Zhibin Hu. All cells were grown in RPMI 1640 media (KeyGEN, Nanjing, China) supplemented with 10% fetal bovine serum (FBS) and penicillin/streptomycin and cultured at 37°C in a humidified incubator containing 5% CO2. Transfection was performed following the small-interfering RNA (siRNA) sequences transfection protocol for Lipofectamine RNAiMAX (Invitrogen, USA). Nonsense RNA (nsRNA) was used as a negative control for IGF2BP3 siRNA. Transfection efficiency was evaluated by quantitative real-time polymerase chain reaction (PCR) and western blot. Two siRNAs were designed: The sequences were as follows: siRNA-1 for IGF2BP3: 5′-GCUGCUGAGAAGUCGAUUATT-3′ (sense), 5′-UAAUCGACUUCUCAGCAGCTT-3′ (antisense); siRNA-2 for IGF2BP3: 5′-CUUUGUUAGUCCUAAAGAATT-3′ (sense), 5′-UUCUUUAGGACUAACAAAGTT-3′ (antisense). And the following nonsense siRNA was used as negative control: 5′-UUCUCCGAACGUGUCACGUTT-3′ (sense), 5′-ACGUGACACGUUCGGAGAATT-3′ (antisense). IGF2BP3 complementary DNA (cDNA) was cloned into a pEGFP-N1 vector (purchased from Genechem) to construct overexpression plasmid, and an empty vector (EV) was used as a negative control.
RNA preparation, reverse transcription, and quantitative real-time polymerase chain reaction
Total RNA was extracted from cultured cells using TRIzol reagent (Invitrogen, Carlsbad, CA, USA), according to the manufacturer’s instruction. For real-time polymerase chain reaction (RT-PCR), 1000 ng total RNA was reverse-transcribed to a final volume of 20 µL cDNA using a Reverse Transcription Kit (Takara, Dalian, China; cat: RR036A). Quantitative real-time polymerase chain reaction (qRT-PCR) analysis was performed with SYBR Select Master Mix (Applied Biosystems, Foster City, CA, USA; cat: 4472908). The primers for IGF2BP3 and β-actin are as follows: IGF2BP3 forward, 5′-CACATCAAGCAGCTTTCTCG-3′, and reverse, 5′-CCTCTGGTGGTCCAGTGATAA-3′; β-actin forward, 5′-TGACGTGGACATCCGCAAAG-3, and reverse, 5′-CTGGAAGGTGGACAGCGAGG-3. The qRT-PCR data collection was performed using a QuantStudio™ 6 Flex Real-Time PCR System (Applied Biosystems, Foster City, CA, USA), and the qRT-PCR reaction included an initial denaturation step at 95°C for 10 min, followed by 40 cycles of 92°C for 15 s and 60°C for 1 min. Each sample was run in triplicate, and the relative expression was calculated and normalized using the 2−ΔΔCt method.
Cell proliferation assay
The cell proliferation was monitored using a Cell Counting Kit-8 (CCK-8; KeyGEN). Cells were plated in 96-well plates at a density of 2000 cells in 100 µL/well, and the absorbance was measured at 450 nm with an ELx-800 Universal Microplate Reader (BioTek, Winooski, VT, USA). Each experiment was repeated in quadruplicate independently.
For colony formation assay, a total of 100 transfected cells were placed in a fresh six-well plate and maintained in media containing 10% FBS, replacing medium every 3 or 4 days. After 2 weeks, cells were fixed with 4% paraformaldehyde and stained with 0.1% crystal violet. Visible colonies were then counted. For each treatment group, wells were assessed in triplicate.
Flow-cytometry analysis
Flow-cytometry analysis was performed to detect cell cycle distribution and cell apoptosis. For cell cycle distribution, cells were transferred and fixed in centrifuge tubes containing 4.5 mL of 70% ethanol on ice. The cells were kept in ethanol for at least 2 h at 4°C. Then, the ethanol-suspended cells were centrifuged for 5 min at 300g. Cell pellets were re-suspended in 5 mL of phosphate-buffered saline (PBS) for approximately 30 s and centrifuged at 300g for 5 min, and then re-suspended in 1 mL of propidium iodide (PI) staining solution and kept in the dark at 37°C for 10 min. Samples were analyzed using a FACSCalibur flow cytometer. The percentage of the cells in G0/G1, S, and G2/M phase were counted and compared.
For apoptosis analysis, cells were washed and re-suspended at a concentration of 1 × 10⁶ cells/mL. Then, an Annexin V-FITC Apoptosis Detection Kit (BD Biosciences) was used following the manufacturer’s protocol. After incubation at room temperature in dark for 20 min, the cells were immediately analyzed by a FACScan flow cytometer (Becton Dickinson, Franklin Lakes, NJ, USA). All samples were assayed in triplicate.
Cell invasion and migration assay
For migration assay, transfected cells (40,000 cells in 100 µL per well) were plated in the upper chamber of transwell assay inserts (8 mm pores; Millipore, Billerica, MA, USA) containing 200 µL of serum-free RPMI 1640 media. The lower chambers were filled with RPMI 1640 containing 10% FBS. After 24 h of incubation, cells on the filter surface were fixed with methanol, stained with crystal violet, and photographed. Migration was assessed by counting the number of stained cell nuclei from five random fields per filter in each group.
For invasion assay, transfected cells (40,000 cells in 100 µL per well) were plated in the top chamber with a Matrigel-coated membrane (BD Biosciences) in 300 µL serum-free RPMI 1640. The bottom chambers were filled with RPMI 1640 containing 10% FBS. Invasion was determined after 48 h of incubation.
Statistical analysis
All statistical analyses were performed using SPSS Statistics (version 20.0, Chicago, IL, USA) and GraphPad Prism 6 software (GraphPad Software, Inc., La Jolla, CA, USA). The results were presented as mean ± standard deviation (SD). Relative quantification of mRNA expression level was calculated with the 2−ΔΔCt method. Student’s t test was used to analyze difference between the two groups. Association of IGF2BP expression with clinicopathological parameters was analyzed using chi-square test. Cox univariate and multivariate regression was used to evaluate prognostic value of each parameter. Association of IGF2BP3 expression with other mRNAs was analyzed using Pearson’s correlation test. A p value <0.05 was considered statistically significant.
Results
IGF2BPs are widely upregulated in NSCLC
By analyzing TCGA_LUAD_exp_HiSeqV2-2015-02-24 and TCGA_LUSC_exp_HiSeqV2-2015-02-24 datasets, compared with normal tissues, IGF2BPs were found to be widely upregulated in NSCLC tissues. All data were presented as mean ± SD in Table 1. We observed that except IGF2BP2 in LUAD tissues (fold change: 1.022, p = 0.4040), each IGF2BP was significantly overexpressed in both LUAD and LUSC tissues compared with normal tissues. In LUAD, IGF2BP1 is 3.95-fold upregulated and IGF2BP3 is 1.50-fold upregulated. In LUSC, IGF2BP1 is 4.33-fold, IGF2BP2 is 1.24-fold, and IGF2BP3 is 1.86-fold with all the p values <0.0001 (Figure 1(a)–(f)).
Expression profile of IGF2BP family in LUAD and LUSC.

IGF2BP: insulin-like growth factor 2 mRNA-binding proteins; LUAD: lung adenocarcinoma; LUSC: lung squamous cell carcinoma; TCGA: The Cancer Genome Atlas.

IGF2BPs are significantly upregulated in LUAD and LUSC. (a) IGF2BP1 in LUAD (FC = 3.954, p < 0.0001). (b) IGF2BP2 in LUAD (FC = 1.022, p = 0.4040). (c) IGF2BP3 in LUAD (FC = 1.496, p < 0.0001). (d) IGF2BP1 in LUSC (FC = 4.332, p < 0.0001). (e) IGF2BP2 in LUSC (FC = 1.241, p < 0.0001). (f) IGF2BP3 in LUSC (FC = 1.863, p < 0.0001). (g) IHC analysis showed that IGF2BP levels were significantly increased in tumor tissues compared with adjacent normal tissues.
IHC was performed to evaluate the IGF2BP expression in the tumor tissues and adjacent normal tissues. As shown in Figure 1(g), IGF2BP levels were found to be significantly increased in the tumor tissues compared with adjacent normal tissues.
Correlation between IGF2BP expression with clinicopathological features in LUAD and LUSC
After further analyzing the file “clinical_data” in TCGA_LUAD_exp_HiSeqV2-2015-02-24 and TCGA_LUSC_exp_HiSeqV2-2015-02-24 datasets, 400 LUAD patients and 409 LUSC patients with full-scale clinical data were picked out. Among the 400 LUAD patients and 409 LUSC patients, we chose median expression values of IGF2BPs as the cutoff value, and 400 LUAD patients were divided into two groups each time: high-level IGF2BP (1–3) and low-level IGF2BP (1–3), so were the 409 LUSC patients. Then, we explored relationship between IGF2BP expression and clinicopathological features in both LUAD and LUSC. The most meaningful founding is that high-level IGF2BP3 was significantly correlated with bigger primary tumor size (p = 0.0445), lymph node metastasis (p = 0.0093), and advanced tumor stage (p = 0.0187) in LUAD (Table 2). In addition, IGF2BP1 overexpression was found to be significantly correlated with bigger tumor size (p = 0.0032) in LUAD and younger age (p = 0.0070) in LUSC (Table 3). However, no significant correlation of IGF2BP2 was observed with any clinical feature in LUAD or LUSC (Table 4).
Correlation between IGF2BP3 expression and clinical characteristics in TCGA datasets.
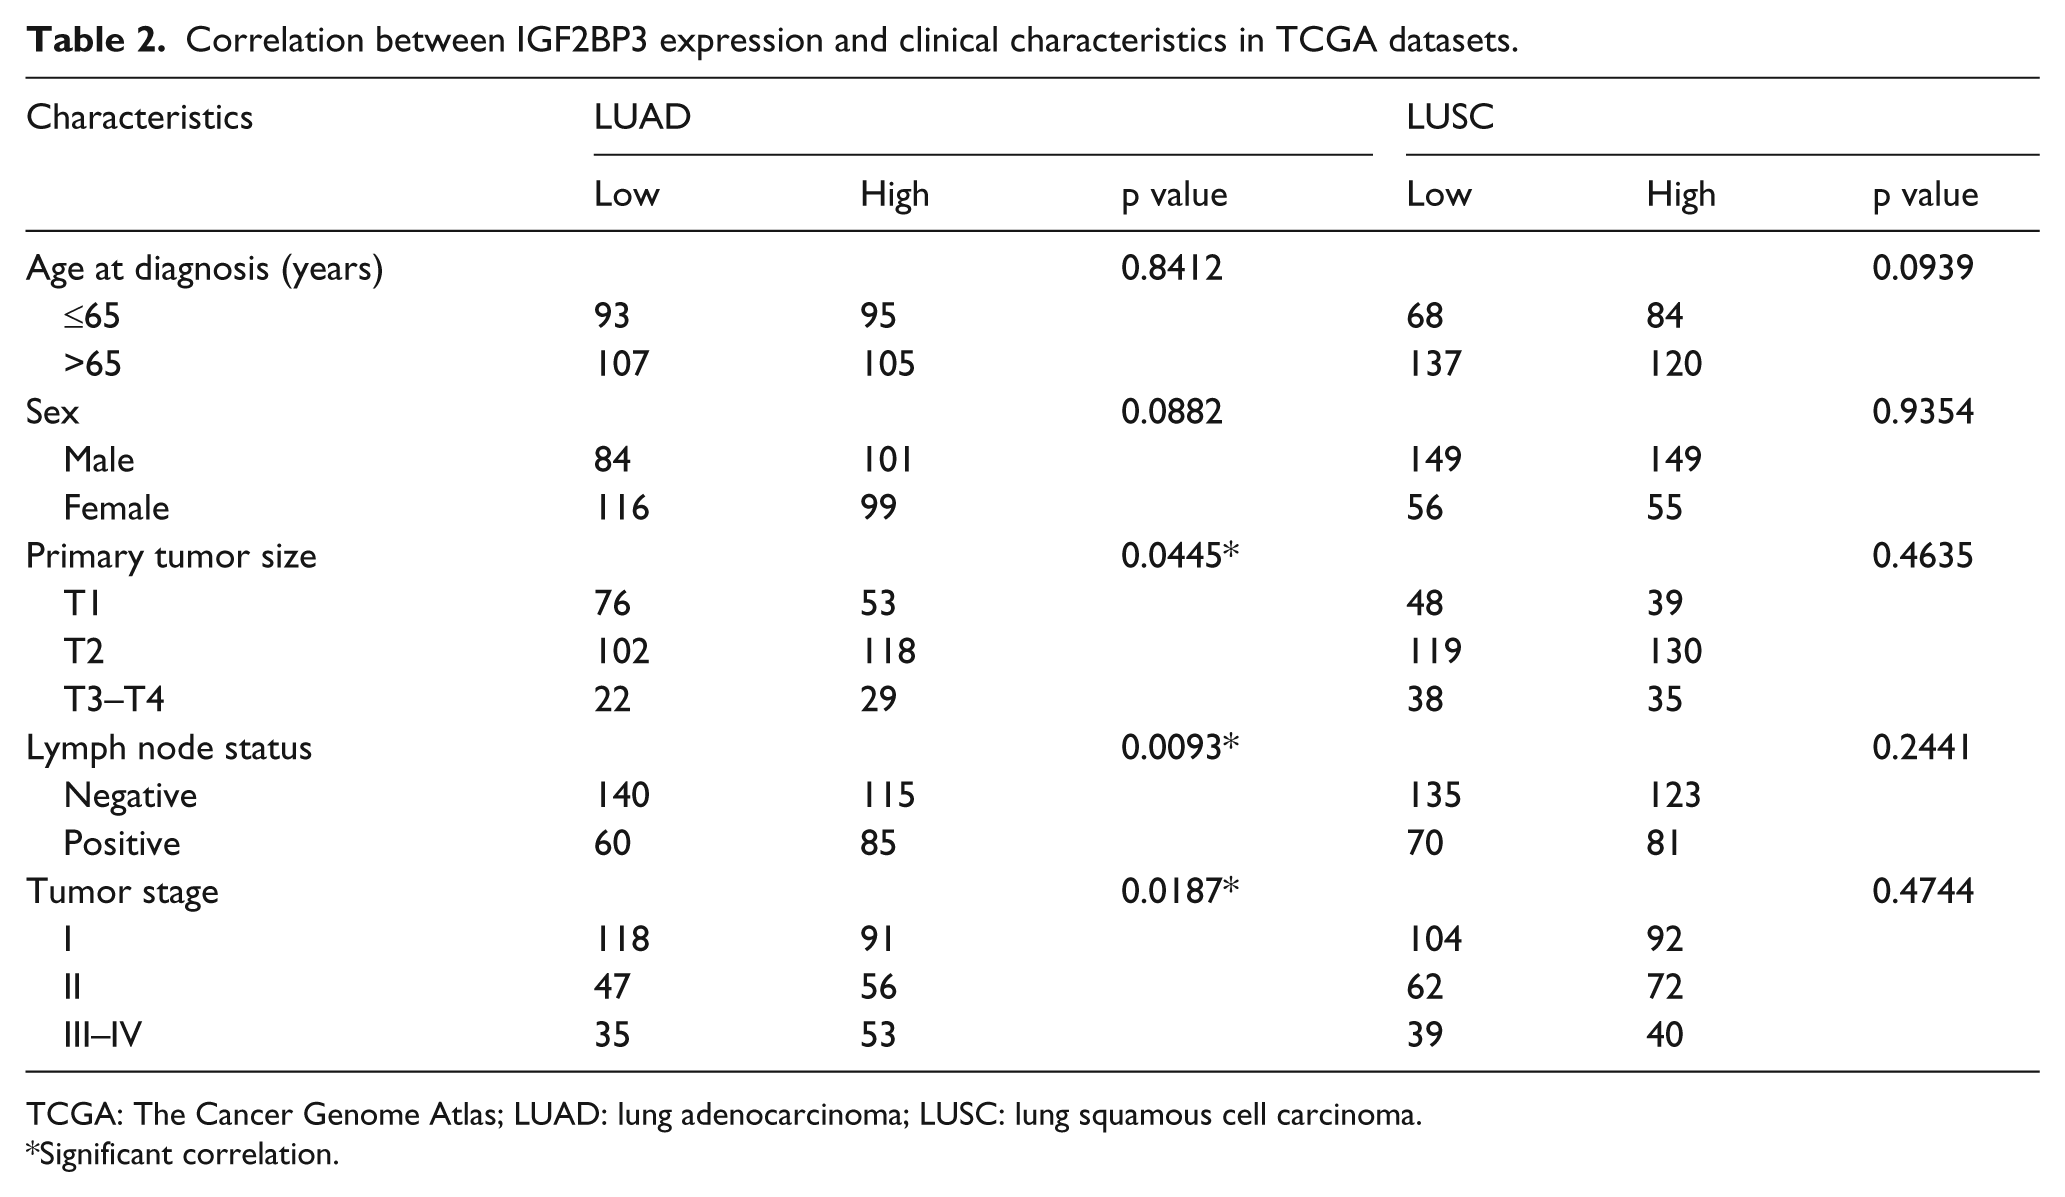
TCGA: The Cancer Genome Atlas; LUAD: lung adenocarcinoma; LUSC: lung squamous cell carcinoma.
Significant correlation.
Correlation between IGF2BP1 expression and clinical characteristics in TCGA datasets.

TCGA: The Cancer Genome Atlas; LUAD: lung adenocarcinoma; LUSC: lung squamous cell carcinoma.
Significant correlation.
Correlation between IGF2BP2 expression and clinical characteristics in TCGA datasets.

TCGA: The Cancer Genome Atlas; LUAD: lung adenocarcinoma; LUSC: lung squamous cell carcinoma.
Prognostic significance of IGF2BPs in LUAD and LUSC patients
As shown above, mRNA expression of IGF2BPs was upregulated in lung cancer tissues compared with normal tissues, and only IGF2BP1 and IGF2BP3 exhibited clinically meaningful correlation in LUAD patients. To evaluate the clinical utility of IGF2BPs in prognosis of NSCLC patients, we used Kaplan–Meier analysis and log-rank test to evaluate overall survival (OS) for IGF2BPs in LUAD and LUSC patients, respectively. As shown in Figure 2(a)–(c), LUAD patients with higher IGF2BP1 or IGF2BP3 expression exhibited poor OS (IGF2BP1-high: hazard ratio (HR) = 1.544, p = 0.0137; IGF2BP3-high: HR = 1.898, p = 0.0003), but no significant level was reached in higher IGF2BP2 patients (HR = 1.299, p = 0.2375). However, no significant association with OS was found in LUSC patients when comparing each IGF2BP-high and IGF2BP-low group (IGF2BP1-high: HR = 0.8125, p = 0.1772; IGF2BP2-high: HR = 0.9609, p = 0.7958; IGF2BP3-high: HR = 0.8448, p = 0.2746; Figure 2(d)–(f)).

High-level expression of IGF2BP1 and IGF2BP3 predicts poor prognosis in LUAD patients. (a) High-IGF2BP1 in LUAD (HR = 1.544, p = 0.0137). (b) High-IGF2BP2 in LUAD (HR = 1.299, p = 0.2375). (c) High-IGF2BP3 in LUAD (HR = 1.898, p = 0.0003). (d) High-IGF2BP1 in LUSC (HR = 0.8125, p = 0.1772). (e) High-IGF2BP2 in LUSC (HR = 0.9609, p = 0.7958). (f) High-IGF2BP3 in LUSC (HR = 0.8448, p = 0.2746).
To further evaluate the prognostic value of IGF2BPs in LUAD, we performed univariate and multivariate regression analysis. Univariate analysis revealed that in LUAD patients, advanced T status (p = 0.042), positive lymph node status (p < 0.001), advanced tumor, lymph node, metastasis (TNM) stage (p < 0.001), higher IGF2BP1 (p = 0.014), and higher IGF2BP3 (p < 0.001) were significantly associated with poor OS. After multivariate regression analysis, we found that only advanced TNM stage (HR = 2.275, p = 0.007) and high-expression level of IGF2BP3 (HR = 1.616, p = 0.017) were two independent risk factors for OS in LUAD patients. The resulting data were shown in Table 5.
Cox regression analysis of overall survival in LUAD patients in TCGA dataset.

LUAD: lung adenocarcinoma; TCGA: The Cancer Genome Atlas; HR: hazard ratio; CI: confidence interval; TNM: tumor, lymph node, metastasis.
Significant correlation.
Knockdown of IGF2BP3 inhibits LUAD cell proliferation and motility, and induces cell cycle arrest and apoptosis in vitro
In consideration of the most clinically meaningful value of IGF2BP3 in LUAD, we next explored its biological function in LUAD cells. In order to choose appropriate cellular model for further investigation, we compared the expression of IGF2BP3 in different LUAD cell lines. H1299 and A549 cell lines were picked out because of highest expression (Figure 3(a) and (b)). The Cancer Cell Line Encyclopedia website also exhibited similar results. To investigate the biological function of IGF2BP3 in vitro, two different effective siRNAs (siRNA-1 and siRNA-2) were constructed and used to knockdown IGF2BP3. Knockdown efficiency was determined by qRT-PCR and western blot (Figure 3(c) and (d)).

Knockdown of IGF2BP3 inhibits LUAD cell proliferation and motility, and induces cell cycle arrest and apoptosis in vitro. (a and b) IGF2BP3 mRNA expression was increased in LUAD cell lines, and H1299 and A549 were chosen as appropriate cellular models due to their highest expression. (c and d) Two different effective siRNAs (siRNA-1 and siRNA-2) were used to knockdown IGF2BP3 in H1299 and A549 cells. The transfection efficiency was determined by qRT-PCR and western blot. (e and f) Knockdown of IGF2BP3 inhibited both H1299 and A549 cells proliferation. (g and h) Colony numbers of H1299 and A549 cells transfected with si-IGF2BP3 were less than those transfected with si-NC. (i–l) Migration and invasion abilities of H1299 or A549 cells transfected with si-IGF2BP3 was inhibited compared with NC group. (m and n) H1299 and A549 cells transfected with si-IGF2BP3 exhibited more arrest at G1 phase than those transfected with si-NC. (o and p) Knockdown of IGF2BP3 induced apoptosis of both H1299 and A549 cells after 48 h of transfection.
As shown in Figure 3(e) and (f), CCK-8 assay revealed that knockdown of IGF2BP3 inhibited proliferation of both H1299 and A549 cells. Moreover, si-IGF2BP3 transfected cells had fewer colonies than those transfected with negative control siRNA (si-NC; Figure 3(g) and (h)). The transwell assay showed that migration ability of H1299 and A549 cells was inhibited by siRNA-mediated knockdown of IGF2BP3 (Figure 3(i) and (j)), and the Matrigel invasion assay also yielded similar results (Figure 3(k) and (l)). Finally, the effects of IGF2BP3 on cell cycle distribution and apoptosis were evaluated by flow-cytometry analysis. As shown in Figure 3(m) and (n), si-IGF2BP3 treatment increased more H1299 and A549 cells arrest in G1 phase compared to si-NC. Furthermore, knockdown of IGF2BP3 also induced more apoptosis of the two cell lines after 48 h of transfection (Figure 3(o) and (p)).
Overexpression of IGF2BP3 promotes LUAD cells malignant phenotypes in vitro
We chose H1975 cell line to perform overexpression experiment because of its lowest expression in LUAD cell lines (Figure 3(a) and (b)). As shown in Figure 4(a), CCK-8 assay showed that overexpression (OE) of IGF2BP3 promoted H1975 cells proliferation compared with empty vector (EV) group. Transfection efficiency was determined by western blot (Figure 4(b)). Moreover, more colonies were observed in OE group compared with EV group (Figure 4(c) and (d)). The migration and invasion assays showed that motility of H1975 cells was significantly increased by enforced overexpression of IGF2BP3 (Figure 4(e) and (f)). Flow-cytometry analysis showed that OE-IGF2BP3 could promote H1975 cells G1/S transition (Figure 4(g) and (h)), while no difference in apoptosis was observed between EV and OE group (Figure 4(i) and (j)).

Overexpression of IGF2BP3 promotes malignant phenotypes of H1975 cells in vitro. (a) CCK-8 assay showed that overexpression (OE) of IGF2BP3 promoted H1975 cells proliferation compared with empty vector (EV) group. (b) Transfection efficiency was determined by western blot. (c and d) More colonies were observed in OE group compared with EV group. (e and f) Migration and invasion assays showed that motility of H1975 cells was significantly increased by enforced overexpression of IGF2BP3. (g and h) Flow-cytometry analysis showed that OE-IGF2BP3 could promote H1975 cells G1/S transition. (i and j) No difference in apoptosis was observed between EV and OE group.
Discussion
IGF2BPs were originally discovered in embryos and in transformed cells.8,29 Although the fetal expression is prominent, some studies also indicated that the proteins are also present in mature tissues.30,31 From a phylogenetic point of view, IGF2BP1 and IGF2BP3 are closely related, whereas IGF2BP2 diverged from the two other members at an earlier stage and may have acquired a distinct pattern of expression. 32 Furthermore, IGF2BPs were demonstrated to enhance tumor growth, invasiveness, and chemoresistance, and closely associate with poor prognosis in various cancers.
In this study, we performed a systematic analysis on IGF2BP family in NSCLC. TCGA datasets and IHC analysis showed that IGF2BPs were significantly upregulated in LUAD and LUSC. In LUAD, the most meaningful founding was that IGF2BP3 overexpression was significantly associated with some important clinicopathological parameters such as bigger primary tumor size, lymph node metastasis, and advanced tumor stage. In addition, IGF2BP1 overexpression was also associated with bigger tumor size in LUAD. As for LUSC, IGF2BP1 overexpression was found to be associated with younger age. Except for these, no more significant association was detected.
Then, we analyzed prognostic value of IGF2BPs family in both LUAD and LUSC. Kaplan–Meier analysis and log-rank test were used to evaluate OS for IGF2BPs in LUAD and LUSC patients, respectively. As matched with clinical association analysis before, LUAD patients with higher IGF2BP1 or IGF2BP3 expression exhibited poor OS (IGF2BP1-high: HR = 1.544, p = 0.0137; IGF2BP3-high: HR = 1.898, p = 0.0003), and no significant level was reached in higher IGF2BP2 patients (HR = 1.299, p = 0.2375). However, no significant association with OS was found in LUSC patients when comparing each IGF2BP-high and IGF2BP-low group. Then, we performed univariate and multivariate regression analyses to further evaluate prognostic significance of IGF2BPs in LUAD. Multivariate analysis revealed that only higher expression level of IGF2BP3 and advanced TNM stage were proved to be two independent risk factors for OS in LUAD patients.
Consistent with clinical findings of IGF2BP3 in LUAD, experiments on LUAD cell lines showed that suppression of IGF2BP3 inhibited proliferation by inducing cell cycle arrest and apoptosis, and undermined abilities of migration and invasion, and overexpression of IGF2BP3 could promote malignant phenotypes in vitro.
In conclusion, IGF2BP1–IGF2BP3 were widely upregulated in NSCLC. Especially, in IGF2BP family, IGF2BP3 might play the most important role in tumor aggressiveness and prognosis in LUAD, and IGF2BP3 might serve as a potential therapeutic target and a novel prognostic biomarker in LUAD patients.
Footnotes
Acknowledgements
R.S., X.Y., and Y.W. contributed equally.
Declaration of conflicting interests
The author(s) declared no potential conflicts of interest with respect to the research, authorship, and/or publication of this article.
Funding
This work was supported by the Natural Science Foundation of Jiangsu Province (NO. BK2012482), National Natural Science Foundation of China (NO. 81472702), and Jiangsu Provincial Special Program of Medical Science (NO. BL2012030).