
Abstract
MicroRNAs have been reported to be involved in various biological processes. Here, we performed a systematic analysis to explore the clinical value and potential molecular mechanism of miR-145-5p in non-small cell lung cancer. First, a meta-analysis was performed with eligible literature, followed by microRNA microarrays in the Gene Expression Omnibus database, to verify the diagnostic and prognostic values of miR-145-5p. A cohort of 125 clinical paired non-small cell lung cancer samples was next used to detect the level of miR-145-5p and to explore the relationship of miR-145-5p with clinicopathological parameters. The Cancer Genome Atlas database was additionally applied to investigate the role of miR-145-5p in non-small cell lung cancer. The potential targets of miR-145-5p were predicted using 12 online prediction databases to explore the prospective molecular mechanism of miR-145-5p in non-small cell lung cancer. The expression of miR-145-5p in non-small cell lung cancer was significantly lower than that in healthy tissues. And miR-145-5p tended to show better diagnostic performance in lung squamous cell carcinoma than in lung adenocarcinoma. Furthermore, the expression of miR-145-5p was closely associated with lymph node metastasis in non-small cell lung cancer. Gene ontology enrichment and Kyoto Encyclopedia of Genes and Genomes pathway analysis revealed that the target genes were mainly enriched with enzyme-linked receptor protein signaling pathways, SH3 domain binding, cell leading edge, and adherens junction. The protein–protein interaction network showed that eight hub genes (SMAD4, SMAD2, IRS1, FOXO1, ERBB4, NRAS, ACTB, and ACTG1) might be the key target genes of miR-145-5p in non-small cell lung cancer. The information we obtained might offer new perspectives for clinical diagnosis and treatment for non-small cell lung cancer.
Keywords
Introduction
Lung cancer remains the second and third most common cancer in males and females, respectively, and the associated mortality continues to be poorest both in males and females.1–4 Non-small cell lung cancer (NSCLC) is one class of lung cancer that is responsible for almost 80% lung cancer–associated deaths. NSCLC is divided into three subgroups: lung adenocarcinoma (LUAD), lung squamous cell carcinoma (LUSC), and large-cell carcinoma (LC). The majority of patients are diagnosed at an incurable stage. Current historical reference standards for the diagnosis of advanced-stage patients are invasive methods such as biopsy. Additionally, current standard treatment options involve surgery, chemotherapy, radiation therapy, and targeted therapy.5–10 In recent decades, the biological behaviors of NSCLC and molecular targeting therapies for diagnosis and treatment have undergone remarkable developments.11–14 Despite these efforts and improvements, the diagnosis and prognosis of patients remain unsatisfactory. The 5-year survival rates for NSCLC are only 10%–15%.15–17 The molecular mechanism leading to the development of NSCLC is largely unknown. Therefore, it is urgent to elucidate the molecular mechanism underlying NSCLC and to explore innovative methods for clinical diagnosis and treatment.
MicroRNAs (miRNAs), which are approximately 19–24 nucleotides long, belong to a class of endogenous small non-coding RNAs. MiRNAs can regulate several biological processes (BPs), including growth, differentiation, proliferation, apoptosis necrosis, and invasion by targeting sets of messenger RNAs.18–21 Reports have demonstrated that miRNAs play a potentially significant role in identifying markers for the diagnosis, prognosis, and treatment strategies for numerous human cancers, including oral cancer, 22 breast cancer, 23 pancreatic cancer, 24 testicular cancer, 25 and lung cancer,26–31 among others.
Recently, miRNA-145-5p has been reported to be involved in several cancers such as gastric cancer, 32 breast cancer, 33 renal cell carcinoma, 34 colorectal cancer, 35 and pancreatic cancer. 36 In NSCLC, miR-145-5p has been reported to be downregulated and to exert tumor-suppressor functions. Some targets of miR-145-5p in NSCLC have been reported, such as c-Myc, 37 mucin 1, 38 and FSCN1. 39 Despite these discoveries, the precise molecular mechanisms of miRNA-145-5p in NSCLC remain largely unknown and require further exploration. Therefore, in this study, we aimed to explore the clinical value and potential molecular mechanisms of miR-145-5p in NSCLC. To accomplish this goal, we utilized previously reported literature and Gene Expression Omnibus (GEO) microarray data to retrospectively verify the clinical utility of miR-145-5p in NSCLC. Using our 125 clinical NSCLC samples and The Cancer Genome Atlas (TCGA) database data (495 LUAD; 387 LUSC), the clinical value of miR-145-5p in NSCLC was further verified. Through online prediction databases, we identified potential target genes of miR-145-5p. Further bioinformatics analyses, including gene ontology (GO) enrichment, the Kyoto Encyclopedia of Genes and Genomes (KEGG) pathway, and the protein–protein interaction (PPI) network, were assessed to reveal enrichment pathways and hub genes.
In summary, we hope this article may provide additional information about the clinical value of miR-145-5p in NSCLC and elucidate part of the underlying molecular mechanisms. The obtained information may shed light on the clinical diagnosis and treatment of miR-145-5p in NSCLC.
Materials and methods
Selection of studies and microarrays in GEO datasets
PubMed, CNKI, Wanfang, and VIP databases were used to search for studies evaluating miR-145-5p and lung cancer. Literature published up to July 2016 was retrieved. The search terms used in PubMed were as follows: (lung OR pulmonary OR respiratory OR bronchi OR bronchioles OR alveoli OR pneumocytes OR “air way”) AND (cancer OR carcinoma OR tumor OR neoplas* OR malignan* OR adenocarcinoma) AND (miR-145 OR miRNA-145 OR microRNA-145 OR miR145 OR miRNA145 OR microRNA145 OR “miR 145” OR “miRNA 145” OR “microRNA 145” OR miR-145-5p OR miRNA-145-5p OR microRNA-145-5p OR miR-145-3p OR miRNA-145-3p OR microRNA-145-3p). The microarrays published up to July 2016 were searched in PubMed and GEO datasets. The terms used for the microarray in the GEO datasets were as follows: (lung OR pulmonary OR respiratory OR bronchi OR bronchioles OR alveoli OR pneumocytes OR “air way”) AND (cancer OR carcinoma OR tumor OR neoplas* OR malignan* OR adenocarcinoma) AND (MicroRNA OR miRNA OR “Micro RNA” OR “Small Temporal RNA” OR “non-coding RNA” OR ncRNA OR “small RNA”). For the microarrays, the inclusion criteria were the following: (1) patients were diagnosed with lung cancer and (2) expression of miR-145-5p was detected. For non-microarray studies, in addition to the two above-mentioned criteria, a third criterion was a reported association between miR-145-5p with the clinical diagnosis or prognosis. All analyses were conducted with STATA 12.0.
Clinical NSCLC tissue samples
In this study, 125 formalin-fixed, paraffin-embedded (FFPE) NSCLC tissues, including their adjacent healthy non-tumorous lung tissues, were collected from the Department of Pathology, First Affiliated Hospital of the Guangxi Medical University (Nanning, Guangxi, China), from January 2012 to February 2014. The research protocol for this study was approved by the Ethics Committee of the First Affiliated Hospital of Guangxi Medical University. Informed consent was obtained from all participants. All cases were diagnosed and confirmed by two independent pathologists (Z.-y.L. and G.C.). The clinical pathological parameters for all NSCLC patients are summarized in Table 1.
Relationships between the expression of miR-145-5p and clinicopathological parameters in NSCLC.
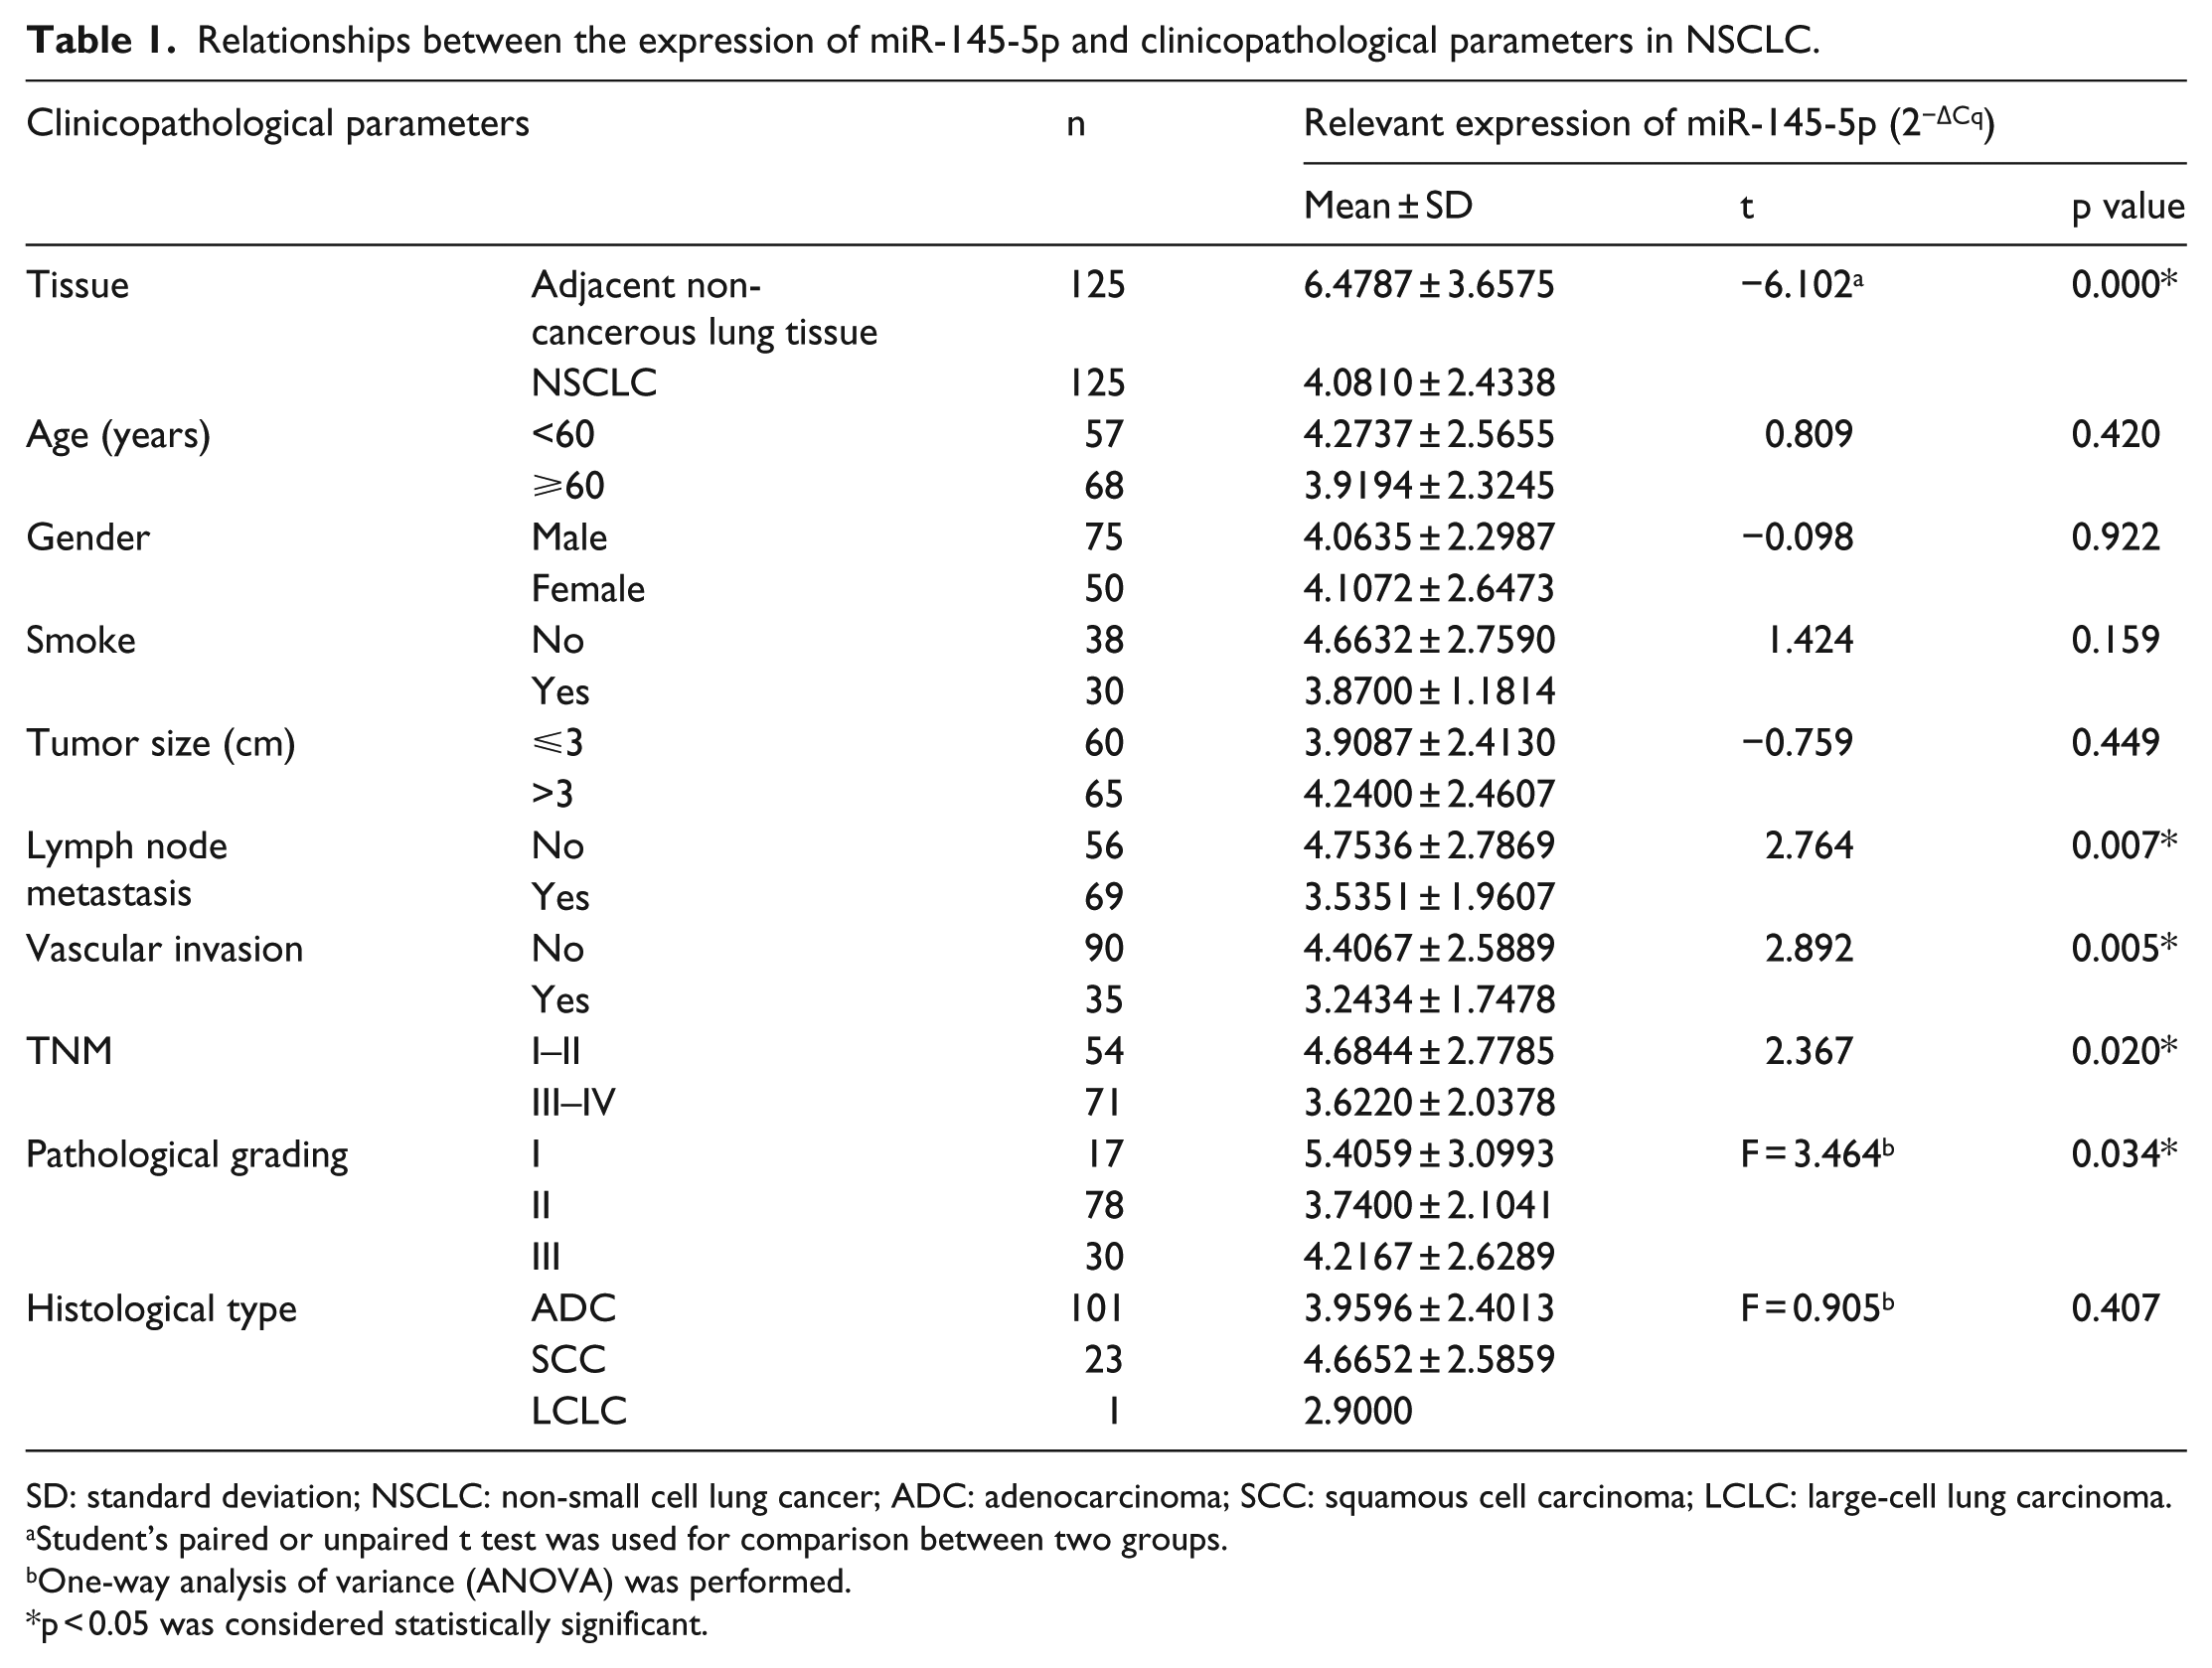
SD: standard deviation; NSCLC: non-small cell lung cancer; ADC: adenocarcinoma; SCC: squamous cell carcinoma; LCLC: large-cell lung carcinoma.
Student’s paired or unpaired t test was used for comparison between two groups.
One-way analysis of variance (ANOVA) was performed.
p < 0.05 was considered statistically significant.
Results from real-time quantitative polymerase chain reaction
According to previous reports, 40 the miRNeasy Kit (QIAGEN, Venlo, the Netherlands) was utilized to extract RNA from FFPE tissue. The NanoDrop 2000 (Wilmington, DE, USA) was adopted to assure the concentration and purity of the extracted RNA. MiR-191 and miR-103 were used as the housekeeping miRNAs for the miR-145-5p expression. The primers for miR-191, miR-103, and miR-145-5p were provided by the TaqMan® MicroRNA Assays. The sequences of the related miRNAs were as follows: miR-145-5p (Applied Biosystems, 4427975-002278): GUCCAGUUUUCCCAGGAAUCCCU; miR-191 (Applied Biosystems, 4427975-000490): CAACGGAAUCCCAAAAGCAGCU; and miR-103 (Applied Biosystems, 4427975-000439): AGCAGCAUUGUACAGGGCUAUGA. quantitative Real-time polymerase chain reaction (qRT-PCR) for miRNAs was performed with the Applied Biosystems PCR7900 (Foster city, CA, USA). The expression level of miR-145-5p was calculated using the formula of 2−Δcq.
Significance of miR-145-5p expression in lung cancer analysis using TCGA database
We extracted the miR-145-5p expression data in LUAD and LUSC from the TCGA database and collected the clinical parameters of the patients. The correlation between miR-145-5p expression and the clinical features was determined using SPSS 24.0.
Statistical analysis
Statistical analyses were carried out with Stata 12.0, SPSS 24.0 (SPSS, Inc., Chicago, IL), and GraphPad Prism 5 (GraphPad Software, Inc., La Jolla, CA, USA). Stata 12.0 was applied to analyze the pooled diagnostic and prognostic value of miR-145-5p in NSCLC. A p < 0.05 or I2 > 50% was regarded as heterogeneous. Sensitivity and subgroup analyses were performed to identify the source of heterogeneity. SPSS 24.0 and GraphPad Prism 5 were used to analyze the data for the clinical samples, GEO and TCGA. For the paired or unpaired groups, Student’s t test was adopted to assess significant differences. For comparisons of two groups, one-way analysis of variance (ANOVA) was applied. Receiver operating characteristic (ROC) curve analyses were used to assess the diagnostic significance of miR-145-5p in NSCLC. Kaplan–Meier curves and the log-rank test were applied to analyze the impact of miR-145-5p on the survival of NSCLC patients. Spearman’s correlation was adopted to analyze the association between miR-145-5p expression and clinical pathological features; p < 0.05 was regarded to be statistically significant.
Prediction of miR-145-5p target genes
Prospective target genes of miR-145-5p were gathered using 12 prediction databases: DIANA-microTv4.0, miRDB, miRWalk, PicTar-vert, PITA, RNA22, TargetScan, miRNA.org, TarBase, mirTarBase, TargetMiner, and PolymiRTS. After integrating the results and removing repetitions, the frequency of each gene predicted by the 12 prediction databases was counted. Only those predicted by five databases were screened out as candidate target genes for further analysis.
Bioinformatics analysis of miR-145-5p target genes
Database for Annotation, Visualization and Integrated Discovery (DAVID) was applied to perform GO enrichment and KEGG pathway analysis. The predicted target genes were uploaded to DAVID, and only pathways with p < 0.05 were regarded to be statistically significant. BiNGO (a plugin of Cytoscape) was used to construct the GO enrichment networks, which revealed associations among GO items. The STRING database was utilized to construct the PPI network for the hub gene identification. Hub genes suggest that they are the key target genes of miR-145-5p in lung cancer. Associations among proteins were assessed by adopting a confidence score threshold >0.4.
Clinical validation of the expression of the hub genes and their correlations with miR-145-5p based on TCGA database
To further verify the role of the hub genes in NSCLC and their correlations with miR-145-5p, we adopted the expression data of the eight hub genes in NSCLC from TCGA database. The expression of the eight hub genes in NSCLC and their control tissues was analyzed. Diagnostic ROC curves were further constructed. Furthermore, Spearman’s correlation analysis was performed to explore the correlations between the eight hub genes and miR-145-5p.
Results
Meta-analysis of studies and microarrays in the GEO datasets
Meta-analysis for evaluating the diagnostic value of miR-145-5p
A total of four eligible studies containing six different experimental groups were included in this study. The diagnostic sensitivity and specificity of miR-145-5p for NSCLC patients were shown in the forest plot (Figure 1). The pooled diagnostic sensitivity and specificity were 0.74 (95% confidence interval (CI): 0.62–0.84) and 0.68 (95% CI: 0.57–0.78), respectively. Moreover, the overall positive likelihood ratio (PLR), negative likelihood ratio (NLR), and diagnostic odds ratio (DOR) were 2.3 (95% CI: 1.6–3.5), 0.38 (95% CI: 0.23–0.61), and 6 (95% CI: 3–15), respectively. However, the heterogeneity was significant among the included studies. The I2 for the pooled sensitivity and specificity were 83.9% and 80.4%, respectively. The threshold effect analysis revealed no threshold effect (p > 0.05). The ROC curve showed that the AUC was 0.77 (95% CI: 0.73–0.81; Figure 2).
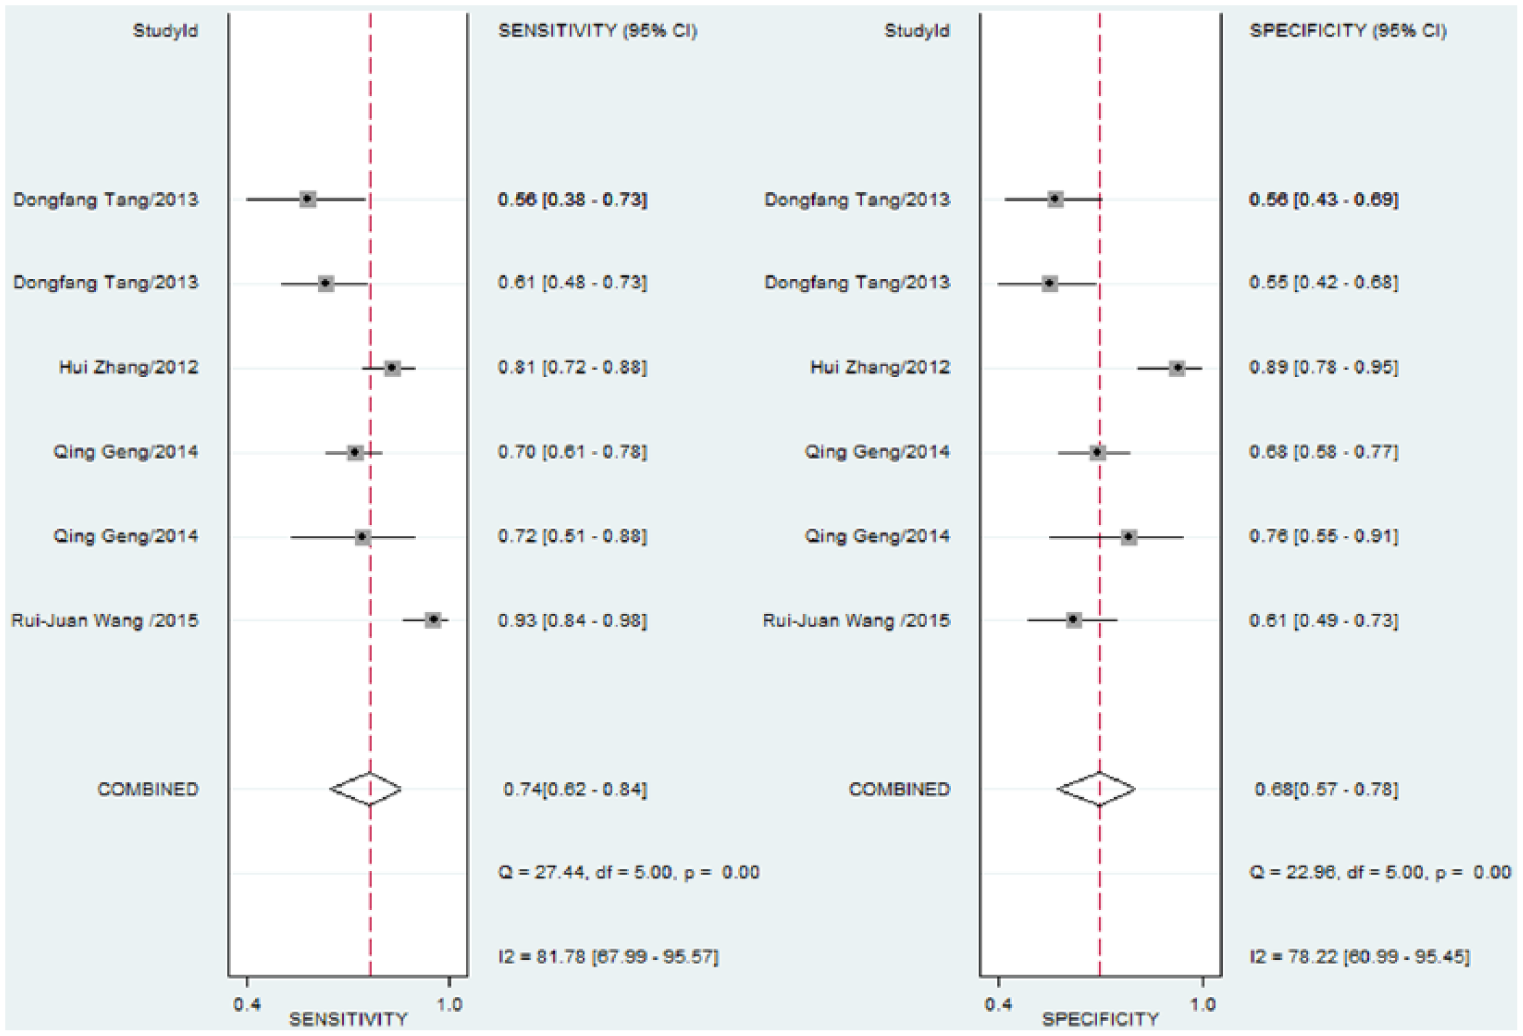
Sensitivity and specificity of miR-145-5p in the diagnosis of NSCLC.

Summary of the receiver operating characteristic (sROC) curve (AUC) of miR-145-5p in the diagnosis of NSCLC.
Meta-analysis to evaluate the prognostic value of miR-145-5p
Six eligible studies were included in this study. The pooled hazard ratio (HR) was 2.21 (95% CI: 1.72–2.83). No significant heterogeneity was found (I2 = 37.4%, p = 0.131; Figure 3). Thus, the results implied that low levels of miR-145-5p were significantly related to the prognosis of NSCLC. Low miR-145-5p suggested poor survival of NSCLC.

Forest plot evaluating the prognostic value of miR-145-5p in NSCLC. Low miR-145-5p expression was regarded as the experimental group. High miR-145-5p expression was regarded as the control group.
Meta-analysis to evaluate the diagnostic value of microarray in the GEO dataset
In all, 20 eligible microarrays were finally identified for further analysis. The standard mean difference (SMD) with 95% CI was used to evaluate continuous outcomes. The heterogeneity test showed significant heterogeneity among the microarrays (I2 = 93.8%, p < 0.05). Therefore, the random-effects model was applied to assess the pooled SMD and 95% CI. The pooled SMD (95% CI) was −1.03 (−1.53 to −0.54; Figure 4), which suggested that the expression of miR-145-5p in NSCLC was lower than that in the healthy tissue. We further generated funnel plots to evaluate the publication bias in this meta-analysis (Figure 5). The funnel plots were basically symmetric. Begg’s and Egger’s tests were adopted as the indices of publication; p < 0.05 was used to determine the publication bias. The tests provided a p value larger than 0.05 (Begg’s p = 0.626 and Egger’s p = 0.409). Taken together, there was no significant publication bias among these studies. A sensitivity analysis was performed to evaluate differences among the included studies, revealing no significant differences (Figure 6).

Forest plot evaluating differences in miR-145-5p expression between NSCLC and healthy tissues. Low miR-145-5p expression was regarded as the experimental group. High miR-145-5p expression was regarded as the control group.
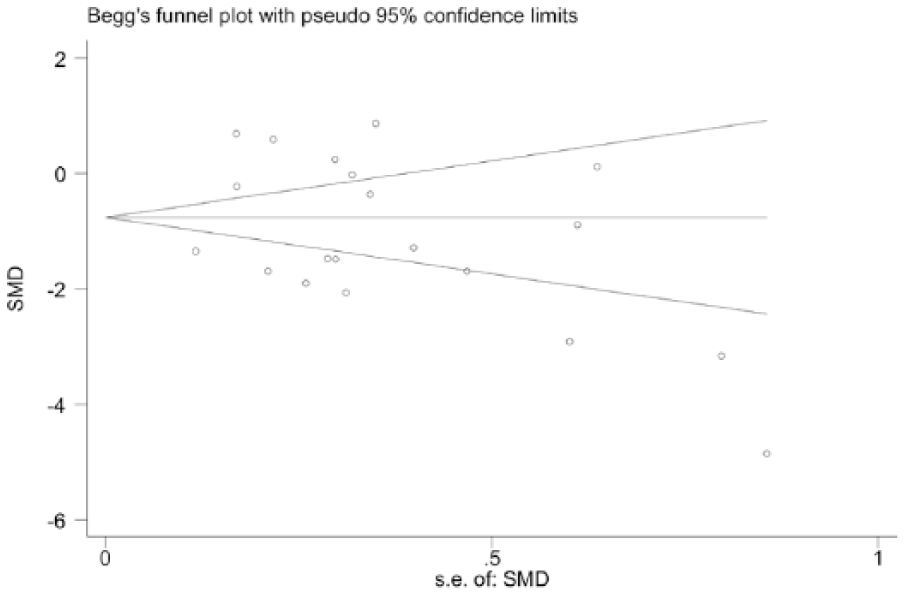
Funnel plot for the publication bias test of GEO microarrays. Each point represents a single microarray.

Sensitivity analysis of HRs. The results were calculated by omitting each microarray in turn.
RT-qPCR detection in clinical NSCLC samples
The diagnostic significance of miR-145-5p in NSCLC
As shown in Figure 7(a) and Table 1, the expression of miR-145-5p in NSCLC was pronouncedly lower than that in non-cancerous lung tissue (4.0810 ± 2.4338 vs 6.4787 ± 3.6575, p < 0.001). In Figure 7(b), the ROC curve was utilized to determine the diagnostic value in NSCLC. The AUC was 0.697 (95% CI: 0.6302–0.7627, p < 0.001), with a sensitivity of 0.688 (95% CI: 0.5990–0.7678) and specificity of 0.696 (95% CI: 0.6074–0.7751). To further identify the expression of miR-145-5p in different histological types of diagnosed NSCLC, we divided the clinical NSCLC sample into LUAD and LUSC to separately identify the diagnostic value of miR-145-5p. As presented in Figure 7(c), the expression of miR-145-5p in LUAD was remarkably lower than that in non-cancerous lung tissue (3.9596 ± 2.4013 vs 6.6689 ± 3.5586, p < 0.001). The ROC curve analysis showed that the AUC was 0.732 (95% CI: 0.6620–0.8017, p < 0.001) with a sensitivity of 0.723 (95% CI: 0.628–0.809) and specificity of 0.68 (95% CI: 0.5907–0.7606; Figure 7(d)). Regarding LUSC, there was no statistically obvious difference in miR-145-5p expression between LUSC and the adjacent non-cancerous lung tissue. However, it still showed a trend that miR-145-5p expression was relatively lower in LUSC (4.6652 ± 2.5859 vs 5.8426 ± 4.0367), even the p value was 0.260.
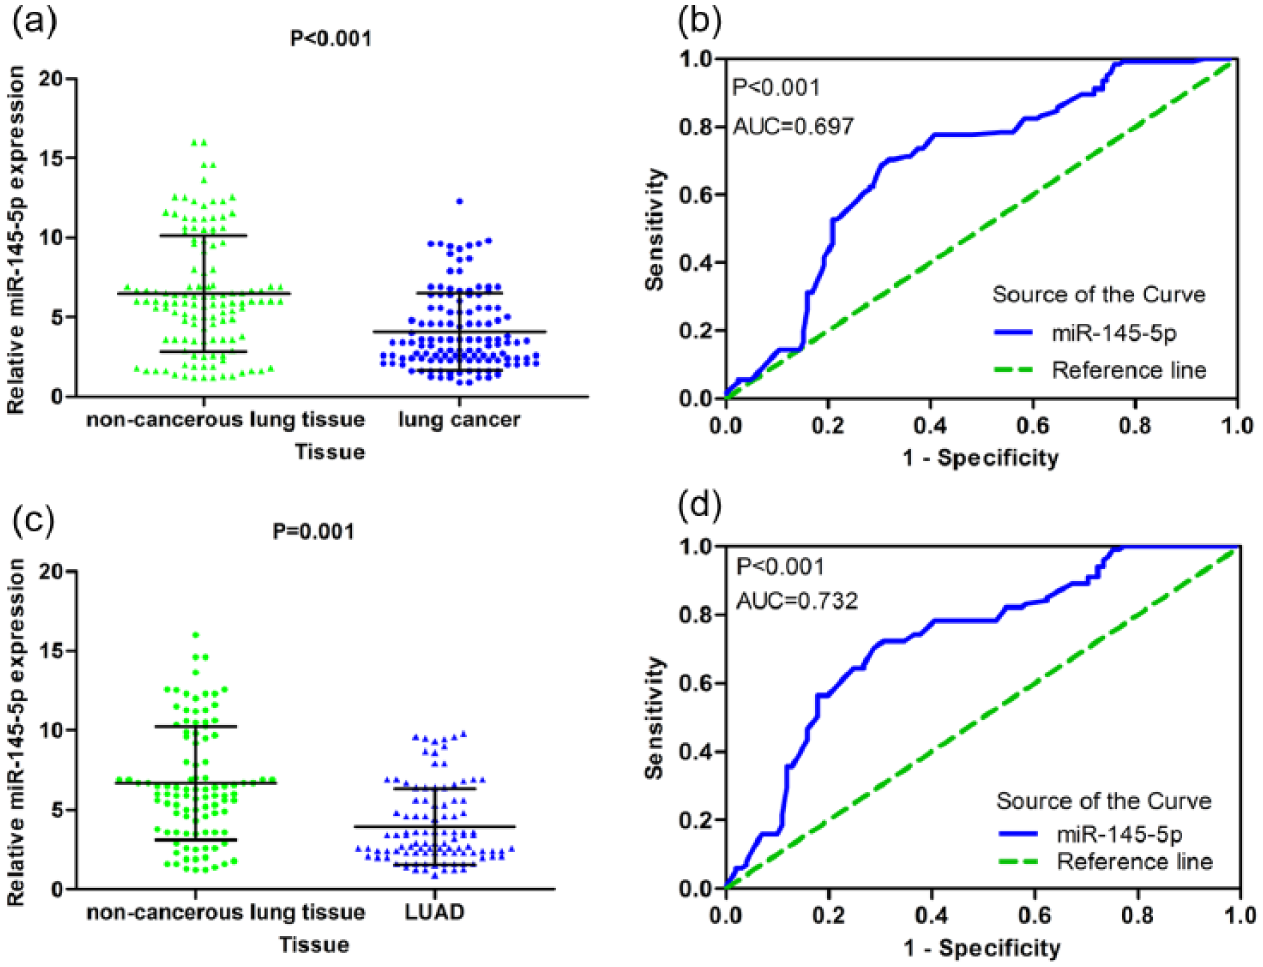
The expression of miR-145-5p was decreased in clinical NSCLC and the LUAD subgroup and its diagnostic values. (a) The expression of miR-145-5p in 125 NSCLC and paired non-cancerous lung tissues. (b) The ROC curve for evaluating the diagnostic performance of miR-145-5p in 125 NSCLC and paired non-cancerous lung tissues. The AUC was 0.679 (95% CI: 0.6302–0.7627, p < 0.001). (c) The expression of miR-145-5p in 101 LUAD and paired non-cancerous lung tissues. (d) The ROC curve for evaluating the diagnostic performance of miR-145-5p in 101 LUAD and paired non-cancerous lung tissues. The AUC was 0.706 (95% CI: 0.6381–0.7745, p < 0.001).
The correlation between miR-145-5p expression and the clinicopathological aspects of NSCLC
The statistical analyses revealed significant differences between miR-145-5p and lymph node metastasis, vascular invasion, TNM, or pathological grading (Table 1). Samples with lymph node metastasis versus without lymph node metastasis had lower miR-145-5p expression (3.5351 ± 1.9607 vs 4.7536 ± 2.7869, p = 0.007; Figure 8(a)). Regarding vascular invasion, miR-145-5p levels were reduced in samples with vascular invasion versus without vascular invasion (3.2434 ± 1.7478 vs 4.4067 ± 2.5889, p = 0.005; Figure 8(b)). Among the different TNM stages, the expression of miR-145-5p in stages III–IV was markedly lower than that in stages I–II (3.6220 ± 2.0378 vs 4.6844 ± 2.7785, p = 0.020; Figure 8(c)). The ANOVA test revealed significantly different miR-145-5p expression levels among pathological grades I, II, and III (F = 3.464, p = 0.034; Figure 8(d)). Additionally, according to Spearman’s correlation analyses, the expression of miR-145-5p was negatively related to lymph node metastasis (r = −0.212, p = 0.018) and TNM (r = −0.211, p = 0.018). However, there was no noted association between miR-145-5p and age, gender, smoking, size, or pathological grading.

Relationships between miR-145-5p and several clinical parameters in clinical NSCLC samples. (a) MiR-145-5p expression in patients with lymph node metastasis and in patients without lymph node metastasis. (b) MiR-145-5p expression in patients with vascular invasion and in patients without vascular invasion. (c) MiR-145-5p expression in stage-I and -II patients and stage-III and -IV patients. (d) MiR-145-5p expression in pathological stage-I, -II, and -III patients.
The ROC curve was employed to assess the diagnostic performance of miR-145-5p for different clinical features of NSCLC. In lymph node metastasis, the AUC was 0.615 (95% CI: 0.5123–0.7173, p = 0.028), with a sensitivity of 0.725 (95% CI: 0.6038–0.8254) and a specificity of 0.536 (95% CI: 0.3974–0.6701; Figure 9(a)). However, in the presence of vascular invasion and in the TNM stages, there were no significant differences in AUC.
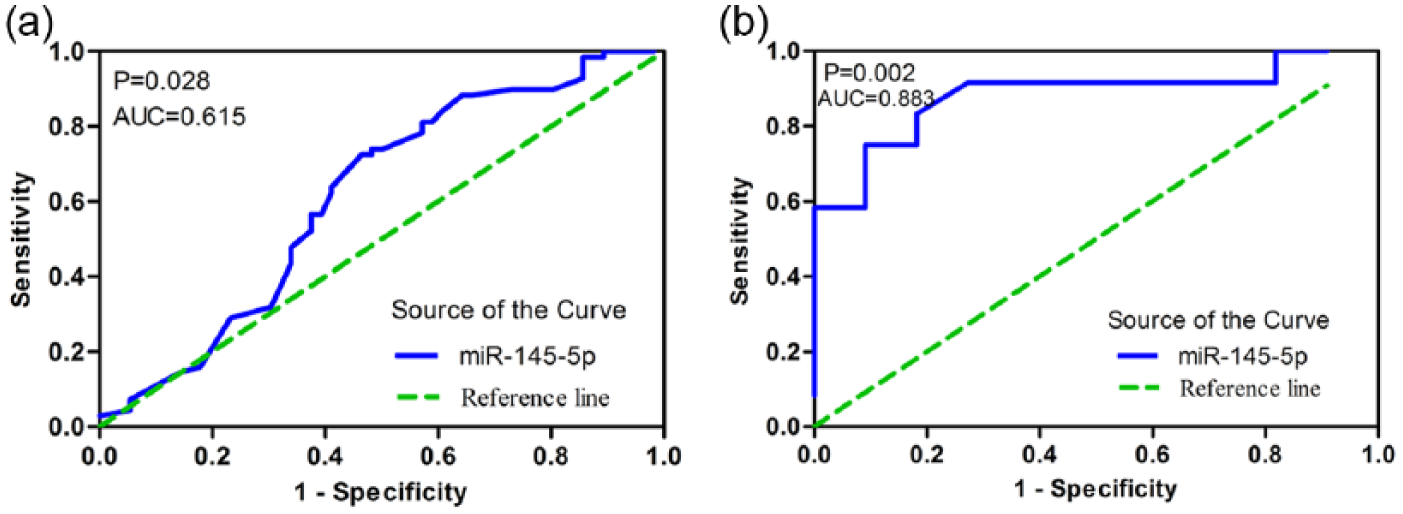
ROC curve analysis of miR-145-5p for some clinical parameters in clinical NSCLC samples and the subgroup LUSC. (a) ROC curve of miR-145-5p for lymph node metastasis in NSCLC. The AUC was 0.615 (95% CI: 0.5123–0.7173, p = 0.028). (b) ROC curve of miR-145-5p for lymph node metastasis in LUSC. The AUC was 0.883 (95% CI: 0.7347–1.030, p = 0.002).
The clinical NSCLC samples were further divided into LUAD and LUSC to separately verify the relationship of miR-145-5p and their clinical parameters. For LUAD, the expression of miR-145-5p exhibited differences in vascular invasion, TNM, and pathological grading (Table 2). As shown in Figure 10(a), the expression of miR-145-5p in samples with vascular invasion was statistically lower than that in samples without vascular invasion (3.6004 ± 2.0415 vs 4.2600 ± 2.5703, p = 0.028). However, the ROC curve analysis showed no significant difference in AUC. In the TNM pathological stages, the miR-145-5p expression level in stages I–II was lower than that in stages III–IV (3.5045 ± 1.9809 vs 4.5355 ± 2.7597, p = 0.039; Figure 10(b)). However, there were no significant differences in the AUC of TNM. In the pathological grading, ANOVA revealed that miR-145-5p expression was significantly different among pathological stages I, II, and III (F = 4.052, p = 0.020; Figure 10(c)). Spearman’s correlation analyses were furthered performed. However, no statistically significant correlation was found. Regarding LUSC, statistical significance was observed only in lymph node metastasis (Table 3). Samples with lymph node metastasis displayed much lower miR-145-5p expression compared with those without lymph node metastasis (3.2250 ± 1.5563 vs 6.2364 ± 2.6158, p = 0.003; Figure 10(d)). Moreover, the AUC was 0.883 (95% CI: 0.7347–1.030, p = 0.002), with a sensitivity of 0.750 (95% CI: 0.4281–0.9451) and specificity of 0.909 (95% CI: 0.5872–0.9977; Figure 9(b)). The Spearman’s correlation analyses showed that miR-145-5p was negatively correlated with lymph node metastasis (r = −0.652, p = 0.001).
Relationships between the expression of miR-145-5p and clinicopathological parameters in LUAD.

SD: standard deviation; LUAD: lung adenocarcinoma.
Student’s paired or unpaired t test was used for comparison between two groups.
One-way analysis of variance (ANOVA) was performed.
p < 0.05 was considered statistically significant.

Relationship between miR-145-5p and several clinical parameters in clinical LUAD and LUSC samples. (a) MiR-145-5p expression in LUAD patients with vascular invasion and in LUAD patients without vascular invasion. (b) MiR-145-5p expression in stage-I and -II LUAD patients and in stage-III and -IV LUAD patients. (c) MiR-145-5p expression in pathological stage-I, -II and -III LUAD patients. (d) MiR-145-5p expression in LUSC patients with lymph node metastasis and in LUSC patients without lymph node metastasis.
Relationships between the expression of miR-145-5p and clinicopathological parameters in LUSC.

LUSC: lung squamous cell carcinoma; SD: standard deviation.
Student’s paired or unpaired t test was used for comparison between two groups.
One-way analysis of variance (ANOVA) was performed.
p < 0.05 was considered statistically significant.
Evaluation of the prognostic value of miR-145-5p in NSCLC
Kaplan–Meier curves and the log-rank test were used to assess the prognostic significance of miR-145-5p in NSCLC. As shown in Figure 11(a), the median survival of LUAD patients with high miR-145-5p expression was 14.3 months, while in patients with low miR-145-5p expression, the median survival was 7.15 months (p = 0.706).

Evaluating the prognosis of NSCLC with Kaplan–Meier curves of the (a) clinical LUAD patients, (b) TCGA LUAD patients, and (c) TCGA LUSC patients.
Verification of miR-145-5p in lung cancer using the TCGA database
The diagnostic significance of miR-145-5p in lung NSCLC
The expression of miR-145-5p was extracted from 387 cases of LUSC (342 cancer and 45 adjacent tissues) and 495 cases of LUAD (456 cancer and 39 adjacent tissues) patients in the TCGA database. For LUSC, the expression of miR-145-5p was significantly reduced compared with adjacent healthy tissue (10.3760 ± 0.9793 vs 11.5188 ± 0.4430, p < 0.001; Figure 12(a) and Table 4). Furthermore, the ROC curve revealed an AUC of 0.845 (95% CI: 0.7544–0.9364, p < 0.001), with a sensitivity of 0.689 (95% CI: 0.5335–0.8183) and a specificity of 0.956 (95% CI: 0.8485–0.9946; Figure 12(b)). With regard to LUAD, the expression of miR-145-5p in LUAD was significantly lower than that in adjacent healthy tissue (9.3104 ± 0.7878 vs 9.9497 ± 0.4843, p < 0.001; Figure 12(c) and Table 5). And the ROC showed that the AUC was 0.775 (95% CI: 0.6702–0.8788) with sensitivity of 0.692 (95% CI: 0.5243–0.8298) and specificity of 0.667 (95% CI: 0.4978–0.8091; Figure 12(d)). We pooled the data from LUSC and LUAD to find more diagnostic information on miR-145-5p and NSCLC. As shown in Figure 13(a) and Table 6, the expression of miR-145-5p was significantly lower in NSCLC compared with adjacent non-cancerous lung tissue (10.1676 ± 0.9988 vs 10.7903 ± 0.9117, p = 0.013). The AUC was 0.569 (95% CI: 0.5312 to 0.6604, p = 0.004), with a sensitivity of 0.556 (95% CI: 0.5211–0.5912) and a specificity of 0.643 (95% CI: 0.5308–0.7445; Figure 13(b)).

The expression of miR-145-5p was decreased in TCGA LUAD and LUSC and its diagnostic value. (a) The expression of miR-145-5p in 90 LUSC samples (45 cancer and 45 adjacent tissues). (b) ROC curve for evaluating the diagnostic performance of miR-145-5p in 90 LUSC samples (45 cancer and 45 adjacent tissues). The AUC was 0.845 (95% CI: 0.7544–0.9364, p < 0.001). (c) The expression of miR-145-5p in 78 LUAD samples (39 cancer and 39 adjacent tissues). (d) ROC curve for evaluating the diagnostic performance of miR-145-5p in 78 LUSC samples (39 cancer and 39 adjacent tissues). The AUC was 0.775 (95% CI: 0.6702–0.8788, p < 0.001).
Relationships between the expression of miR-145-5p and clinicopathological parameters in LUSC analyzed by data from the TCGA database.

LUSC: lung squamous cell carcinoma; SD: standard deviation.
Student’s paired or unpaired t test was used for comparison between two groups.
One-way analysis of variance (ANOVA) was performed.
p < 0.05 was considered statistically significant.
Relationships between the expression of miR-145-5p and clinicopathological parameters in LUAD analyzed by data from the TCGA database.

SD: standard deviation; LUAD: lung adenocarcinoma.
Student’s paired or unpaired t test was used for comparison between two groups.
One-way analysis of variance (ANOVA) was performed.
p < 0.05 was considered statistically significant.
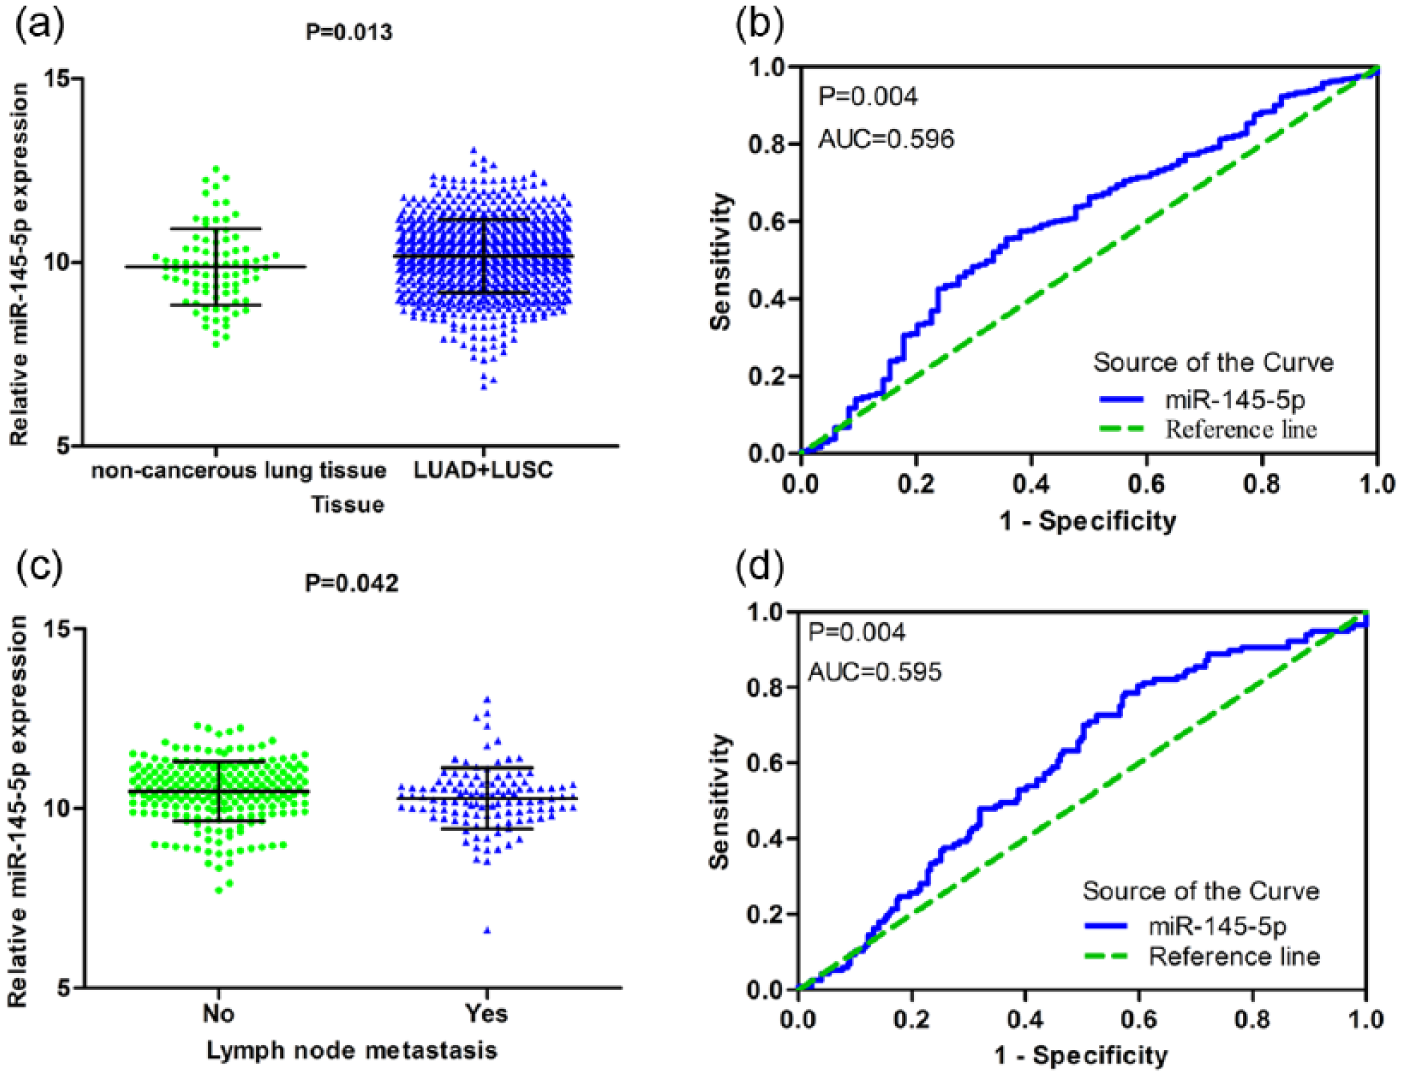
The expression of miR-145-5p was decreased in TCGA NSCLC and its relationship with lymph node metastasis in TCGA LUSC. (a) The expression of miR-145-5p in 882 NSCLC samples (798 cancer and 84 adjacent tissues). (b) ROC curve for evaluating the diagnostic performance of miR-145-5p in 882 NSCLC samples (798 cancer and 84 adjacent tissues). The AUC was 0.569 (95% CI: 0.5312–0.6604, p = 0.004). (c) MiR-145-5p expression in patients with lymph node metastasis and in patients without lymph node metastasis from the TCGA database. (d) ROC curve of miR-145-5p for lymph node metastasis in LUSC. The AUC was 0.595 (95% CI: 0.5328–0.6575, p = 0.004).
Relationships between the expression of miR-145-5p and clinicopathological parameters in LUAD and LUSC analyzed by data from the TCGA database.

SD: standard deviation; LUAD: lung adenocarcinoma; LUSC: lung squamous cell carcinoma.
Student’s paired or unpaired t test was used for comparison between two groups.
One-way analysis of variance (ANOVA) was performed.
p < 0.05 was considered statistically significant.
Association between miR-145-5p and clinicopathological parameters of lung cancer as assessed using clinical data from the TCGA database
As shown in Tables 4 and 5, the information obtained for miR-145-5p and the clinical features of 387 cases of LUSC and 195 cases of LUAD were obtained from the TCGA database. For LUSC, we observed a noteworthy difference of the expression of miR-145-5p in lymph node metastasis. The samples with lymph node metastasis versus without lymph node metastasis had reduced miR-145-5p expression (10.2789 ± 0.8462 vs 10.4747 ± 0.8306, p = 0.042; Figure 13(c)). ROC curve analysis further showed the predictive value of miR-145-5p in lymph node metastasis. The AUC was 0.595 (95% CI: 0.5328–0.6575, p = 0.004), with a sensitivity of 0.786 (95% CI: 0.7009–0.8567) and a specificity of 0.425 (0.3583–0.4931; Figure 13(d)). Spearman’s correlation analysis was also performed. The expression of miR-145-5p was negatively related to lymph node metastasis (r = −0.136, p = 0.013). Regarding LUAD, the expression of miR-145-5p was significantly different in pathologic T (F = 5.285, p = 0.001; Figure 14). Spearman’s correlation analysis revealed no statistically significant correlations between miR-145-5p and clinical parameters. For further verification, we pooled the data for LUAD and LUSC from the TCGA database. As displayed in Table 6, the statistical analysis showed that the expression of miR-145-5p was significant for age, pathologic T, and lymph node metastasis. Patients aged ⩽60 years had lower miR-145-5p expression compared with those aged >60 years (Figure 15(a)). The expression of miR-145-5p was also remarkably different in different pathological T stages (Figure 15(b)). Patients with lymph node metastasis had lower miR-145-5p expression (Figure 15(c)). Additionally, the AUC was 0.552 (95% CI: 0.5098–0.5941, p = 0.018), with a sensitivity of 0.727 (95% CI: 0.6693–0.7801) and a specificity of 0.388 (95% CI: 0.3453–0.4311; Figure 15(d)). For LUAD, Spearman correlation analysis again did not show any significant correlations between miR-145-5p and clinical parameters.

The relationship between miR-145-5p and pathological T in LUAD from the TCGA database.

Relationship between miR-145-5p and some clinical parameters in NSCLC (LUAD + LUSC) from the TCGA database and ROC curve analysis. (a) MiR-145-5p expression in pathological stage T1, T2, T3, and T4 patients. (b) MiR-145-5p expression in patients aged ⩽60 and >60 years. (c) MiR-145-5p expression in patients with lymph node metastasis and in patients without lymph node metastasis. (d) ROC curve of miR-145-5p for lymph node metastasis. The AUC was 0.552 (95% CI: 0.5098–0.5941, p = 0.018).
Evaluation of the prognostic significance of miR-145-5p in LUAD and LUSC from the TCGA database
Kaplan–Meier curves and the log-rank test were used to assess the prognostic value of miR-145-5p in LUAD and LUSC from the TCGA database. The Kaplan–Meier curve of LUAD was shown in Figure 11(b). The LUAD patients with low versus high miR-145-5p showed a trend to indicate poorer survival (p = 0.065). The median survival of patients with high and low miR-145-5p expression was 105.6 and 59.7 months, respectively. And Figure 11(c) displayed the Kaplan–Meier curve of LUSC, which showed the median survival of patients with high miR-145-5p expression as 28.7 months and low miR-145-5p expression as 28.1 months.
Bioinformatics analysis
Prediction of miR-145-5p target genes
After integrating the target gene prediction data for the 12 prediction databases, we chose those target genes that were predicted by five databases as candidate target genes of miR-145-5p in lung cancer. A total of 101 target genes were selected (Supplementary file 1).
GO enrichment and KEGG pathway analysis
Those 101 candidate target genes were input into DAVID to perform GO and KEGG pathway analysis. As shown in Figure 16, the GO enrichment analysis comprised three categories: BP, molecular function (MF), and cellular component (CC). Based on BP, the target genes were mainly involved in 34 GO terms, such as enzyme-linked receptor protein signaling pathway, transmembrane receptor protein tyrosine kinase signaling pathway, and regulation of glucose import. Regarding CC, they were mainly enriched in 14 GO items, including cell leading edge, cell fraction, and Golgi apparatus. For MF, the target genes were related to the following four GO terms: SH3 domain binding, transcription activator activity, protein complex binding, and enzyme binding. Additionally, the GO enrichment networks were shown in Figures 17–19. The colored nodes represented statistical significance. For KEGG pathway analysis, the adherens junction remained prominent (Figure 15).

The bar chart for enriched GO and KEGG items.

Biological process (BP) network for the predicted target genes. Each node represents a GO item. The larger nodes indicate genes with greater involvement in the GO item. Colored nodes indicate statistical significance (p < 0.025). White nodes only participate in connecting GO items, with no statistical significance.
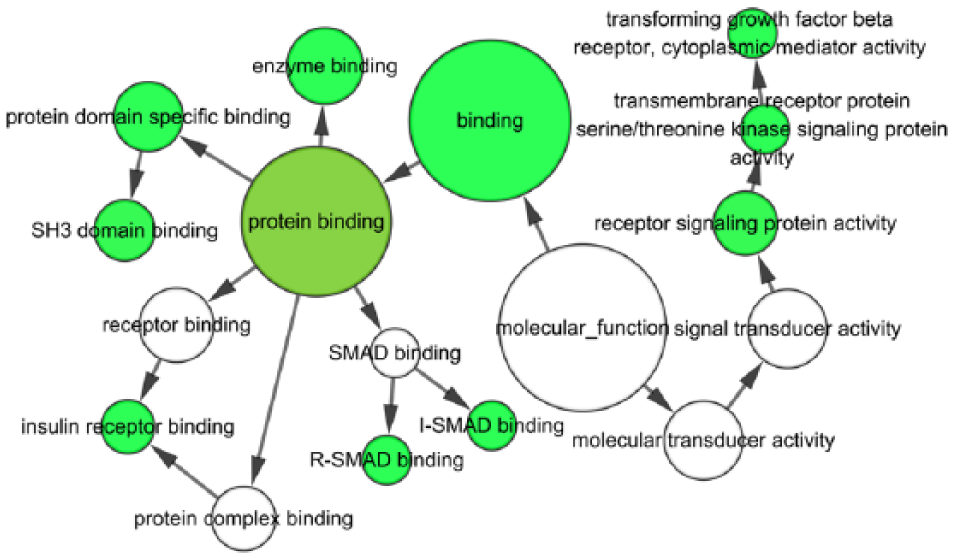
Molecular function (MF) network for the predicted target genes. Each node represents a GO item. The larger nodes indicate genes with more involvement in the GO item. Colored nodes indicate statistical significance (p < 0.06). White nodes only participate in connecting the GO items, with no statistical significance.
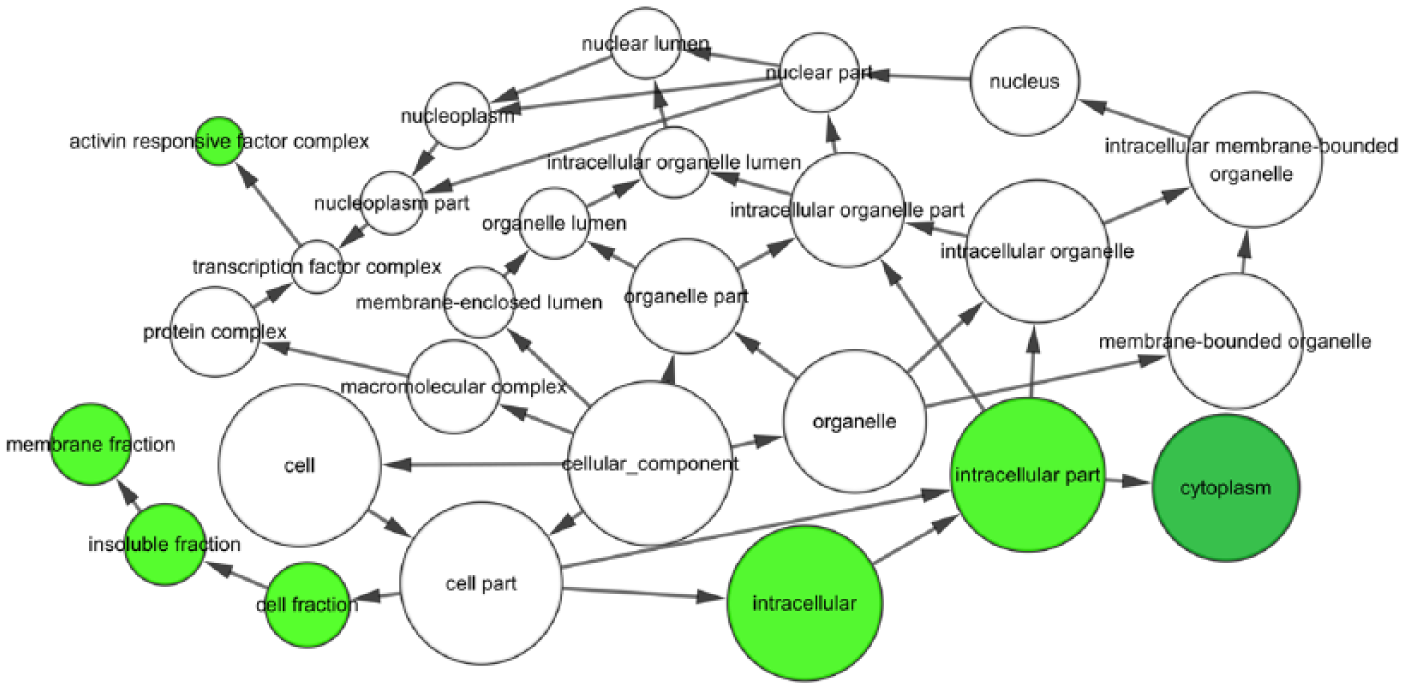
Cellular component (CC) network for the predicted target genes. Each node represents a GO item. The larger nodes indicate genes with more involvement in the GO item. Colored nodes indicate statistical significance (p < 0.01). White nodes only participate in connecting the GO items, with no statistical significance.
PPI network construction
The PPI network was shown in Figure 20. Eight hub genes (SMAD4, IRS1, FOXO1, ERBB4, SMAD2, ACTG1, NRAS, and ACTB) were found in the PPI, which have connections with more than nine other genes. These hub genes indicate that they are key target genes of miR-145-5p in lung cancer.
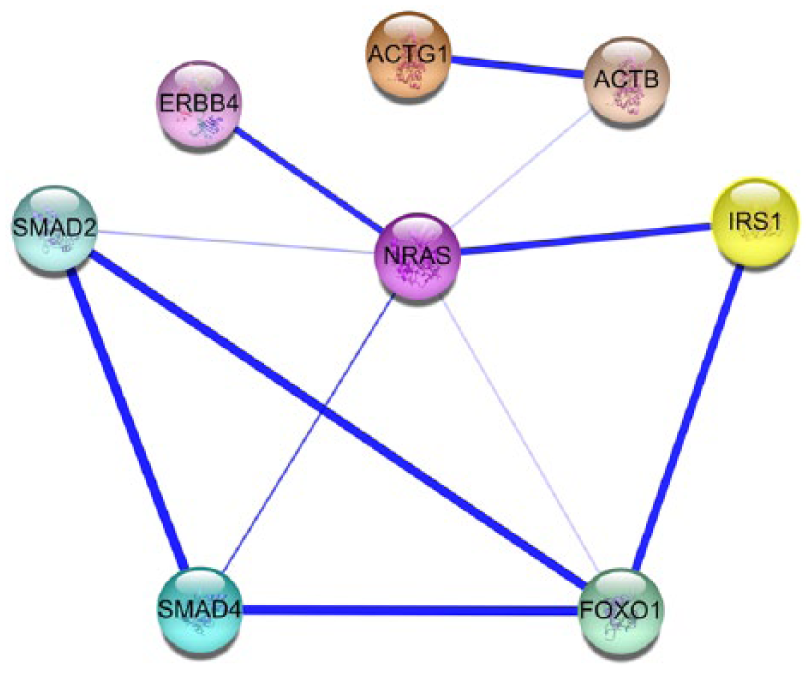
Hub genes from the STRING PPI network. Each node represents one gene-encoded protein. The lines among the nodes represent the protein associations. The line thickness indicates the confidence level.
Clinical validation of the expression of the hub genes and their correlations with miR-145-5p based on TCGA database
Among the eight hub genes, we discovered that the expression of SMAD4, SMAD2, FOXO1, ERBB4, and ACTB was decreased in NSCLC. And the expression of IRS1, NRAS, and ACTG1 was increased. Since miR-145-5p was decreased in NSCLC, the genes that have increased expression, namely, IRS1, NRAS, and ACTG1, gain more possibility to be the target genes of miR-145-5p. Therefore, IRS1, NRAS, and ACTG1 were decided for further analysis. As displayed in Figure 21 and Table 7, the expression of the hub genes IRS1, NRAS, and ACTG1 in LUAD was analyzed based on TCGA database. The expression of IRS1, NRAS, and ACTG1 in LUAD was significantly higher in LUAD than that in non-cancerous lung tissues (Figure 21(a)–(c)). Furthermore, ROC curve analysis also implied the diagnostic value of these three hub genes. The AUCs of IRS1, NRAS, and ACTG1 were 0.639 (95% CI: 0.5870–0.6900, p = 0.01), 0.579 (95% CI: 0.5188–0.6393, p = 0.048), and 0.697 (95% CI: 0.6420–0.7513, p < 0.001), respectively (Figure 21(d)–(f)). In parallel, the expression of IRS1, NRAS, and ACTG1 was also analyzed in LUSC (Figure 22 and Table 7). In accordance with LUAD, the expression of IRS1, NRAS, and ACTG1 was significantly higher compared with that in non-cancerous lung tissues (Figure 22(a)–(c)). Besides, ROC curve analysis further showed that the diagnostic AUCs of IRS1, NRAS, and ACTG1 were 0.599 (95% CI: 0.5456–0.6529, p = 0.020), 0.736 (95% CI: 0.6842–0.7871, p < 0.001), and 0.742 (95% CI: 0.6908–0.7931, p < 0.001; Figure 22(d)–(f)). For the purpose of investigating the correlation between miR-145-5p and the hub genes, Spearman’s correlation analysis was performed (Figure 23). From Figure 23(a)–(c), we could observe that the expression of IRS1, NRAS, and ACTG1 had a slight trend to be negatively correlated to miR-145-5p in LUAD; however, the correlation did not reach to be statistically significant (IRS1: r = −0.06288, p = 0.1936; NRAS: r = −0.02086, p = 0.6666; and ACTG1: r = −0.03419, p = 0.4800). Regarding to LUSC, we could find that the expression of NRAS also had a trend to be negatively correlated to miR-145-5p (r = −-0.02659, p = 0.6335; Figure 23(e)). However, the expression of IRS1 was positively correlated to miR-145-5p (r = 0.1238, p = 0.0258). And the expression of ACTG1 was similarly significantly correlated to miR-145-5p (r = 0.05948, p = 0.2858; Figure 23(d) and (f))

The expression of hub genes was increased in TCGA LUAD samples and ROC curve analysis. (a) The expression of IRS1 in TCGA LUAD samples. (b) The expression of NRAS in TCGA LUAD samples. (c) The expression of ACTG1 in TCGA LUAD samples. (d) ROC curve for evaluating the diagnostic performance of IRS1 in TCGA LUAD samples. The AUC was 0.639 (95% CI: 0.5870–0.6900, p = 0.01). (e) ROC curve for evaluating the diagnostic performance of NRAS in TCGA LUAD samples. The AUC was 0.579 (95% CI: 0.5188–0.6393, p = 0.048). (f) ROC curve for evaluating the diagnostic performance of ACTG1 in TCGA LUAD samples. The AUC was 0.697 (95% CI: 0.6420–0.7513, p < 0.001).

The expression of hub genes was increased in TCGA LUSC samples and ROC curve analysis. (a) The expression of IRS1 in TCGA LUSC samples. (b) The expression of NRAS in TCGA LUSC samples. (c) The expression of ACTG1 in TCGA LUSC samples. (d) ROC curve for evaluating the diagnostic performance of IRS1 in TCGA LUSC samples. The AUC was 0.599 (95% CI: 0.5456–0.6529, p = 0.020). (e) ROC curve for evaluating the diagnostic performance of NRAS in TCGA LUSC samples. The AUC was 0.736 (95% CI: 0.6842–0.7871, p < 0.001). (f) ROC curve for evaluating the diagnostic performance of ACTG1 in TCGA LUSC samples. The AUC was 0.742 (95% CI: 0.6908–0.7931, p < 0.001).

Correlation between hub genes and miR-145-5p in TCGA LUAD and LUSC samples. (a) Correlation between IRS1 and miR-145-5p in TCGA LUAD samples. (b) Correlation between NRAS and miR-145-5p in TCGA LUAD samples. (c) Correlation between ACTG1 and miR-145-5p in TCGA LUAD samples. (d) Correlation between IRS1 and miR-145-5p in TCGA LUSC samples. (e) Correlation between NRAS and miR-145-5p in TCGA LUSC samples. (f) Correlation between ACTG1 and miR-145-5p in TCGA LUSC samples.
The expression of the three hub genes in LUAD and LUSC from TCGA.
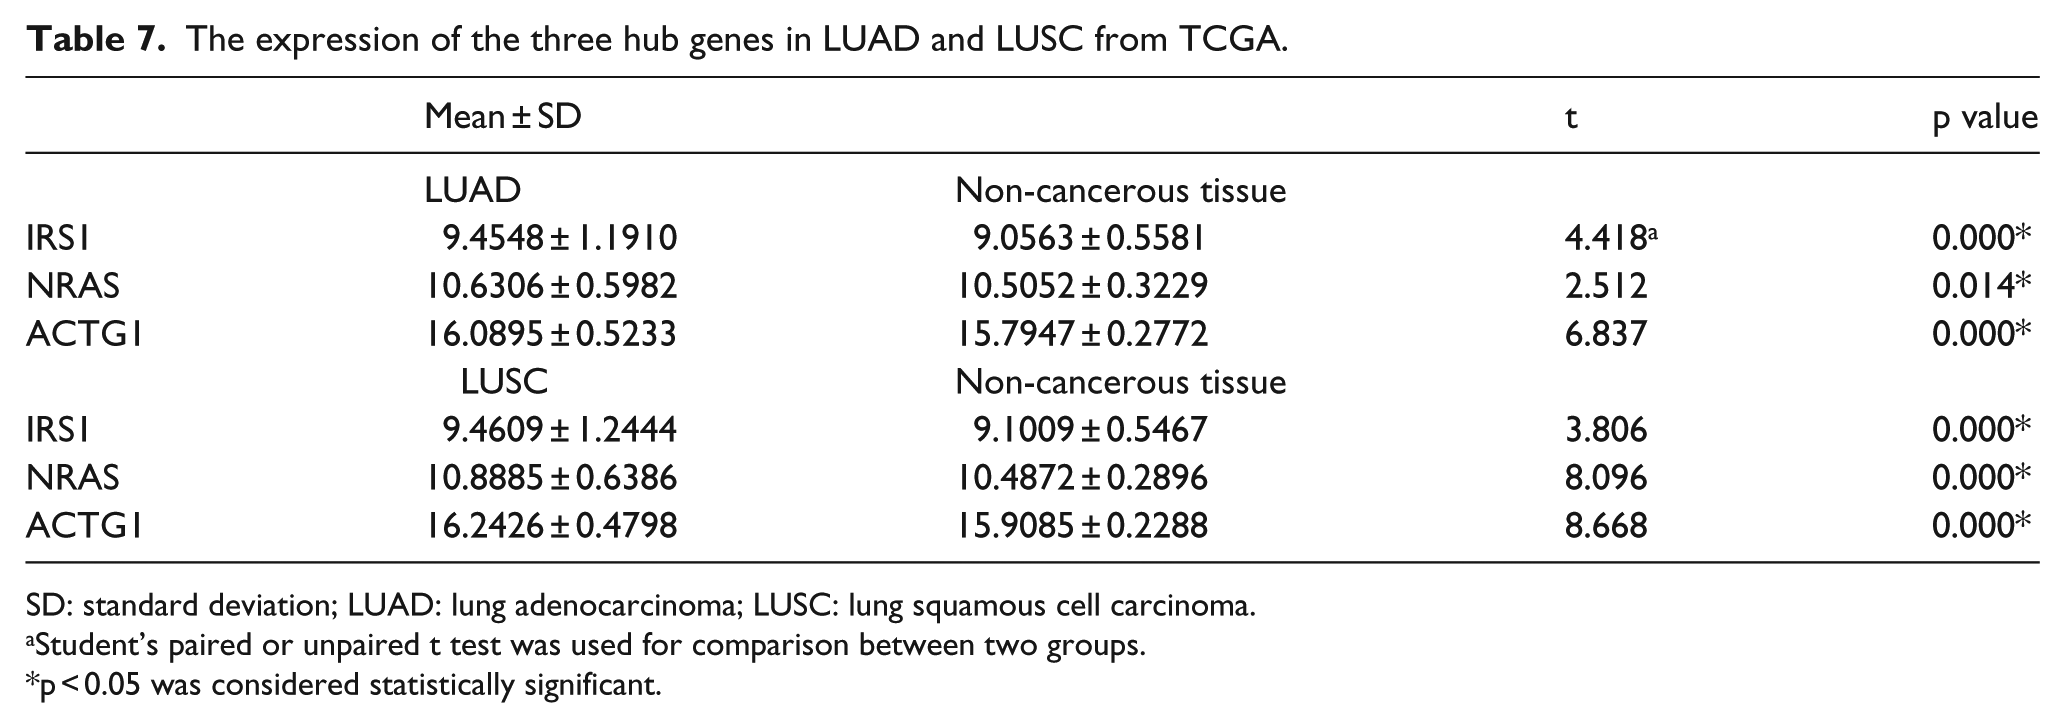
SD: standard deviation; LUAD: lung adenocarcinoma; LUSC: lung squamous cell carcinoma.
Student’s paired or unpaired t test was used for comparison between two groups.
p < 0.05 was considered statistically significant.
Discussion
In this study, we first systemically retrieved previous studies for the meta-analysis to retrospectively verify the role of miR-145-5p in the diagnosis and prognosis of NSCLC. Both eligible literature and GEO microarray data were included in the analysis. We then used our own 125 paired clinical NSCLC samples to further investigate the association between miR-145-5p and diagnosis, clinical parameters, or prognosis. RT-qPCR was used to examine the expression of miR-145-5p in NSCLC and paired non-tumor lung tissue. We further mined the data for miR-145-5p expression and clinical parameters in LUAD and LUSC from the TCGA database. The role of miR-145-5p in diagnosis, clinical features, and prognosis was further analyzed using the TCGA data. To explore potential targets and molecular mechanisms, we adopted 12 prediction tools to predict the targets of miR-145-5p. The bioinformatics analyses, including GO enrichment, KEGG pathway, and PPI network analysis, were also performed. Statistically significant GO terms, KEGG pathway, and hub genes were selected for detailed studies.
Our meta-analysis showed satisfactory performance of miR-145-5p in diagnosis (AUC = 0.77, sensitivity = 0.74, specificity = 0.68) and prognosis (HR = 2.21). Low miR-145-5p expression indicated poor survival. According to our clinical samples, the expression of miR-145-5p in NSCLC was lower than that in healthy tissues. The AUC was 0.697. Additionally, the expression of miR-145-5p was related to lymph node metastasis, vascular invasion, the TNM stage, and pathological grading. The AUC for lymph node metastasis was 0.615. Additionally, Spearman’s correlation analyses demonstrated that the expression of miR-145-5p was negatively correlated with lymph node metastasis (r = −0.212, p = 0.018) and TNM stage (r = −0.211, p = 0.018). When the NSCLC samples were divided into LUAD and LUSC, we noted that the expression of miR-145-5p in LUAD was pronouncedly downregulated than that in healthy tissues and that the AUC was 0.732. Moreover, miR-145-5p was related to vascular invasion, TNM stage, and pathological grading in LUAD. For LUSC, the expression of miR-145-5p tended to be slightly lower in LUSC than that in adjacent healthy tissue (p = 0.260). However, miR-145-5p was related to lymph node metastasis, and the AUC was 0.595. Spearman’s correlation analyses revealed that miR-145-5p was negatively related to lymph node metastasis (r = −0.652, p = 0.001). The TCGA data showed that the expression of miR-145-5p was decreased in LUAD and the AUC was 0.775. Besides, miR-145-5p was related to the pathological T. For LUSC, miR-145-5p expression was reduced in LUSC compared with healthy tissue, and the AUC was 0.898. Additionally, miR-145-5p was related to lymph node metastasis, and the AUC was 0.595. Spearman’s correlation analyses also found that miR-145-5p is negatively related to lymph node metastasis (r = −0.136, p = 0.013). We pooled the data for LUAD and LUSC, which is also an innovative method that is used to address public data. We discovered that the expression of miR-145-5p in cancer was markedly lower than that in adjacent healthy tissue, and the AUC was 0.569. In addition, miR-145-5p was related to age, pathological T, and lymph node metastasis. The AUC for lymph node metastasis was 0.552. Taken together, the expression of miR-145-5p showed better diagnostic value in LUSC than in LUAD, and it was closely related to lymph node metastasis. The cause for this alteration remains to be explored. However, it is noteworthy that in this study, the LUSC samples were smaller than the LUAD samples (clinical samples: LUAD: 101 and LUSC: 23; TCGA: LUAD: 495 and LUSC: 387). Thus, more studies with larger LUSC samples are needed to further verify the relationship between miR-145-5p and LUSC. Moreover, studies with larger LUAD samples are needed to study the role of miR-145-5p in LUAD. According to our PCR and TCGA results, there was a trend that low miR-145-5p expression could imply poorer prognosis in LUAD and LUSC patients, but this did not reach statistical significance. Therefore, it still needs more relative researches to verify the speculation.
GO and KEGG analyses showed the enriched items and pathways. In BP, the most commonly enriched target genes participated in the enzyme-linked receptor protein signaling pathway. We found that the hub genes SMAD2, IRS1, and NRAS were involved in this pathway. In MF, SH3 domain binding was mainly enriched. Regarding CC, the cell leading edge was prominently enriched. However, there are no related reports investigating NSCLC or miR-145-5p with the above enriched GO items. Thus, further studies are needed. The adherens junction remained prominent in the KEGG metabolic pathway. We also found that the hub genes SMAD4, SMAD2, ACTG1, and ACTB were related to the adherens junction. Additionally, the adherens junction has been found to be associated with one subtype of LUAD: adenocarcinoma in situ. 41 Thus, the adherens junction might also be of great importance in NSCLC. The STRING database was used to identify the hub gene of the target genes. Eight hub genes were finally screened out: SMAD4, SMAD2, IRS1, FOXO1, ERBB4, NRAS, ACTB, and ACTG1. These genes have a high likelihood of being key target genes of miR-145-5p in NSCLC. We further mined more details about these hub genes in NSCLC.
SMAD4 belongs to the SMAD family of signal transduction proteins, which can be phosphorylated and then activated by transmembrane serine–threonine receptor kinases. Recently, it has been reported that it is common to observe reduced SMAD4 expression in human NSCLC. The underlying mechanisms include mutation, homozygous deletion, and heterozygous loss. 42 Downregulation of SMAD4 gene expression may lead to lung carcinogenesis. 43 Bian et al. 44 found that decreased SMAD4 was important for LUAD occurrence and development and predicted a poor prognosis. Consequently, SMAD4 has an important role in NSCLC, which is in agreement with our predictions. However, no report was found for SMAD4 and miR-145-5p, and thus, further studies are required.
SMAD2, a protein belonging to the SMAD family, can regulate cell proliferation, apoptosis, and differentiation by mediating the signal of transforming growth factor (TGF)-beta. Tang et al. 45 found that SMAD2, along with SMAD3, is regulated by profilin-2 and can promote growth and metastasis in lung cancer. Another study showed that a high expression level of SMAD2 predicted poor survival in clinical NSCLC. 46 SMAD2 has been confirmed to be a direct target of miR-136 and to result in decreased migration and invasion of LUAD. 47 Taken together, SMDA2 plays an important role in NSCLC. However, there are no reports of miR-145-5p and SMAD2 in NSCLC, necessitating further study.
IRS1 (insulin receptor substrate 1) encodes a protein that is phosphorylated by insulin receptor tyrosine kinase A. McGarry Houghton et al. 48 identified IRS1 as an important regulator of PI3K in malignant lung cells. Additionally, IRS1 has been found to be a target of miR-23a in NSCLC. Low expression levels of IRS1 lead to shorter survival in NSCLC. 49 Although no studies have examined IRS1 and miR-145-5p in NSCLC, the role of IRS1 in NSCLC should not be overlooked.
FOXO1 (forkhead box O1) belongs to the forkhead family of transcription factors. Jun Ma et al. 50 found that FOXO1 interacts with KDM6B, inhibiting apoptosis and metastasis in NSCLC. FOXO1 has been found to be a target of miR-411, which can promote cell proliferation in lung cancer. 51 Additionally, FOXO1 is also inhibited by miR-183, promoting NSCLC cell growth. 52 The reduced FOXO1 levels might play a vital part in lung cancer progression and metastasis. 53 Taken together, FOXO1 clearly has an effect in NSCLC; however, its association with miR-145-5p requires further research.
ERBB4 (erb-b2 receptor tyrosine kinase 4), which is also known as HER4, is a member of the Tyr protein kinase family and the epidermal growth factor receptor (EGFR) subfamily. In a study by Hsuan-Yu Chen, 54 high levels of ERBB4, ERBB1, and ERBB3 could significantly shorten the overall survival of LUAD patients. Downregulation of ERBB4 by miR-193a-3p inhibited proliferation and invasion and promoted apoptosis in lung cancer cells. 55 According to these findings, ERBB4 has important functions in NSCLC. However, no reports have found a relationship between ERBB4 and miR-145-5p in NSCLC. Further studies may uncover a relationship between ERBB4 and miR-145-5p in NSCLC.
NRAS (neuroblastoma RAS viral oncogene homolog) is an N-ras oncogene encoding a membrane protein that shuttles between the Golgi apparatus and the plasma membrane. NRAS has been found to be mutated in NSCLC.56–59 Ma et al. 60 found that increased NRAS may lead to acquired resistance to EGFR inhibition in NSCLC patients. In summary, mutated NRAS may play a role in NSCLC, but its precise interaction with miR-145-5p requires further study.
ACTB (actin beta) encodes highly conserved actin proteins, which are involved in cell structures, integrity, and motility. ACTB was identified as an ideal reference gene in qRT-PCR research of lung cancer. 61 Thus, ACTB may be involved in NSCLC, but additional research is needed to explore the relationship between ACTB and miR-145-5p.
ACTG1 (actin gamma 1) belongs to the actin family of highly conserved proteins. These proteins are involved in many classes of cell motility and maintenance of the cytoskeleton. However, ACTG1 and NSCLC or miR-145-5p have not been reported. Therefore, further studies are urgently needed.
Interestingly, we further found that the expression of IRS1, NRAS, and ACTG1 was relatively higher in LUAD and LUSC based on the TCGA profile data. Since miR-145-5p was downregulated in NSCLC and exerted biological function via specifically binding to its targets, the finding further suggested that IRS1, NRAS, and ACTG1 could gain great potential to be the target genes of miR-145-5p. We then used Spearman’s correlation to analyze their correlation with miR-145-5p. And we found that IRS1, NRAS, and ACTG1 showed a trend to negatively correlate to miR-145-5p in LUAD. And in LUSC, NRAS also tended to be negatively related to miR-145-5p, but IRS1 and ACTG1 did not. To sum up, it is obvious that NRAS was negatively correlated to miR-145-5p, which provides a better evidence to indicate that NRAS could be the target gene of miR-145-5p, which is planned to be validated via in vitro experiments in the future.
In conclusion, the hub genes SMAD4, SMAD2, IRS1, FOXO1, ERBB4, NRAS, and ACTB have great potential to be the target genes of miR-145-5p in NSCLC especially NRAS based on the current evidence for their involvement in lung cancer. Regarding ACTG1, although no study has demonstrated a role in lung cancer, it is possible that this information will be revealed in future analyses.
This study has some limitations. First, the clinical NSCLC samples were small, especially LUSC (23 paired samples). Although we used the TCGA database to expand our data, studies with larger clinical samples are needed for validation. Additionally, based on this meta-analysis of previous studies, we found that low miR-145-5p was related to a poor prognosis. However, based on our clinical PCR data and TCGA data, it still showed a trend that low expression of miR-145-5p could imply poor survival, but it did not reach statistical significance. Thus, the role of miR-145-5p in prognosis remains unverified and requires additional analysis. Finally, we did not perform luciferase assays to further verify the hub genes. Consequently, the precise roles of these genes remain unknown. However, we plan to accomplish this goal in future studies.
Conclusion
In this study, we find that the expression of miR-145-5p in NSCLC is significantly lower than that in adjacent non-cancerous tissue. The diagnostic value of miR-145-5p seems better in LUSC than in LUAD. Additionally, the expression of miR-145-5p is closely associated with lymph node metastasis in NSCLC. There is no statistically significant prognostic value of miR-145-5p in NSCLC, but it showed a trend that low miR-145-5p could be related to poor prognosis. Bioinformatics analysis revealed that eight hub genes (SMAD4, SMAD2, IRS1, FOXO1, ERBB4, NRAS, ACTB, and ACTG1), especially NRAS, might be key target genes of miR-145-5p in NSCLC. This information might offer new perspectives for clinical diagnosis and treatment.
Footnotes
Acknowledgements
T.-q.G. and Z.-c.X. contributed equally as co-first authors, and Z.-y.L. and G.C. contributed equally as co-corresponding authors of this paper. The authors thank GEO and TCGA for the valuable public data.
Declaration of conflicting interest
The author(s) declared no potential conflicts of interest with respect to the research, authorship, and/or publication of this article.
Funding
The author(s) disclosed receipt of the following financial support for the research, authorship, and/or publication of this article: This study was supported by funds of the Guangxi Provincial Health Bureau Scientific Research Project (Z2013201); the National Natural Science Foundation of China (NSFC81360327 and NSFC81560469); the Natural Science Foundation of Guangxi, China (2015GXNSFCA139009 and 2016GXNSFAA380255); and the Scientific Research Project of the Basic Ability Promoting for Middle Age and Youth Teachers of Guangxi Universities (KY2016YB077). The funders had no role in the study design, the data collection and analysis, the decision to publish, or the preparation of the manuscript.
References
Supplementary Material
Please find the following supplemental material available below.
For Open Access articles published under a Creative Commons License, all supplemental material carries the same license as the article it is associated with.
For non-Open Access articles published, all supplemental material carries a non-exclusive license, and permission requests for re-use of supplemental material or any part of supplemental material shall be sent directly to the copyright owner as specified in the copyright notice associated with the article.