
Abstract
Background
Myocardial infarction (MI) is a leading cardiovascular disease worldwide, with high mortality.
Purpose
The study aimed to observe the mechanism of catalpol inhibiting apoptosis and autophagy in H9c2 cells after ischemia/reperfusion (I/R) injury.
Materials and Methods
We grouped H9c2 cells into 4 groups: control, I/R injury, catalpol (I/R injury +1 ug/mL catalpol treatment), and wortmannin (I/R injury + 1 ug/mL catalpol +150 nM wortmannin treatment) groups. Both catalpol and wortmannin group cells were given drug treatment 30 min before I/R injury. At 2h post-I/R insult, we used flow cytometry for detecting cellular apoptosis and reactive oxygen species (ROS) levels. We identified p-PI3K, p-Akt, PI3K, Akt, p53, Bcl-2, Caspase-3, Bax, beclin1, LC3II, and LC3I protein expression levels.
Results
I/R significantly increased the apoptosis rate and ROS level of H9c2 cells, increased expression levels of p53, LC3II/LC3I, and Caspase-3, and decreased p-Akt/Akt, beclin1, Bcl-2/Bax, and p-PI3K/PI3K expression levels. Catalpol can reduce the expressions of p53, Caspase-3, and LC3II/LC3I (p < 0.5). Catalpol can increase the expression levels of Akt/ p-Akt, Bax/ Bcl-2, and beclin1. Also, it can inhibit apoptosis and autophagy levels of H9c2 cells (p < 0.5). Wortmannin, a PI3 K-specific inhibitor, was able partially to block the catalpol’s and anti-autophagic and anti-apoptotic effects.
Conclusion
Catalpol can inhibit apoptosis, reduces excessive autophagy, and alleviates the effects of myocardial ischemia-reperfusion through PI3K/Akt/p53 pathway.
Introduction
Myocardial infarction (MI) is a leading cardiovascular disease worldwide (Liu et al., 2022; Pluijmert et al., 2021; Wang et al., 2021). Timely restoration of blood perfusion by drug thrombolysis or interventional surgery is the key to the clinical rescue of patients with MI (Pluijmert et al., 2021; Wang et al., 2017). Large parts of studies have revealed that after blood reperfusion, reactive oxygen species (ROS) will be largely released and induce myocardial cell apoptosis and autophagy, thus seriously affecting the prognosis of patients with MI (Arab et al., 2007; Constantinou et al., 2020; Dlamini et al., 2015; Schiattarella & Hill, 2016; Zhang et al., 2017). Either autophagy or apoptosis is a highly regulated biological event that deeply influences tissue homeostasis, development, and disease (Eisenberg-Lerner et al., 2009; Fuchs & Steller, 2011). Apoptosis and autophagy act in cardiomyocyte reperfusion injury. Thus, screening effective drugs which can reduce myocardial apoptosis and autophagy after ischemia/reperfusion (I/R) injury shows us crucial clinical significance in treating MI.
Catalpol, one main active components of Rehmannia glutinosa, is an iridoid glycoside compound (Eisenberg-Lerner et al., 2009; Fuchs & Steller, 2011). Catalpol can exert anti-oxidative and anti-apoptotic stress-reducing properties in different cells and tissues, such as neuronal cells and kidney tissue (Hu et al., 2016; Liu et al., 2022; Wang et al., 2021; Yan et al., 2018). Our previous research found that catalpol can inhibit apoptosis in H2O2-induced endothelium by starting up Akt/ PI3K signaling pathway and Bax and Bcl-2 expression regulation (Hu et al., 2010). We have also demonstrated that catalpol has a pro-proliferative effect on cardiomyocytes, which can attenuate apoptosis in H2O2-induced cardiac myocytes by means of a mitochondrial-dependent caspase pathway (Hu et al., 2016). However, whether the protective role of myocardial I/R injury of catalpol is through regulating apoptosis and autophagy and the underlying mechanism has not yet been clearly clarified.
We aimed to: (a) examine catalpol’s effects on alleviating myocardial I/R injury, (b) reveal potential mechanisms underlying catalpol’s cardio-protective effects, which refers to whether catalpol exerts autophagy and apoptosis inhibition’s effects by the PI3K/Akt/p53 pathway.
Materials and Methods
Bioinformatic Analysis
Source of data
The GSE profiles (GSE6381) were downloaded from the GEO database. GSE6381 was based on GPL96 and was uploaded from Arab et al. (2007). In our study, we select 8 right ventricular samples from two different stages from GSE6381, which are “Immediately post-cardioplegic arrest” and “Reperfusion” for identifying DEGs.
Extraction of Differentially Expressed Genes (DEGs)
We performed background correction, standardization, and expression value calculation on the GEO datasets, using the package BiocManager of R software (version: 4.0.3). Limma package in R software was applied for data analyses, which conducted student’s t-test (Bolger et al., 2014). We defined |log(FC)|≥ 1.5 and p < 0.05 as the threshold for screening DEGs. Then, heat maps and volcano plots of DEGs were constructed by R software.
Analysis of DEG’s Functional Enrichment
We performed KEGG pathway and GO enrichment analyses for DEGs’ functions analysis.
Determination of Catalpol Administration Concentration
We inoculated H9C2 cells (BNCC33726, Beina Bio, China) in a 96-well culture plate (100 µL per well) and allocated them into blank control, I/R model, and catalpol group. H9C2 cells were subcloned by KIMES B and BRANDT B from a clonal cell line of BD1X rat embryonic heart tissue and can exhibit many skeletal muscle properties. Both model group and catalpol group H9c2 cells suffered simulated I/R injury and were cultured with low serum (2.5% FBS) medium for 24 hours. Moreover, we treated catalpol group cells with different catalpol concentrations (HY-N0820/CS-4170, MCE) (1, 10, 100, 1000 ug/mL) for intervention and were cultured for 24, 48, and 72 hours. We added 10 ul CCK-8 detection reagent (KGA317, Keygen Biotechnology) to each well and cultivated for 2 h at 37°C. The most suitable catalpol administration was based on the survival rate of H9c2 cells, which was calculated through the way that the microplate reader detects the OD value (450 nm) of each well.
Establishment of I/R Injury Model and Experimental Grouping
I/R Injury Model:
Hypoxia process: After the subculture of normal cells, we discarded the culture, and 100 µl added hypoxic solution to each well, and then transferred to an airtight anoxic box with pure nitrogen continuously passing through for 10 minutes to remove the remaining oxygen. Then the airtight anoxic box was placed in a CO2 incubator for 6 h. Reoxygenation Process: The hypoxia cell solution was discarded, we added 100 µl reoxygenation solution to each well and placed culture plates in a 5% CO2 incubator for 18 h for reoxygenation.
Cell grouping:
Control group; I/R injury group; catalpol group: H/R injury +catalpol treatment (1 ug/mL); wortmannin group: H/R injury + catalpol (1 ug/mL) + wortmannin (150 nM) treatment. Both catalpol and wortmannin groups were given drug treatment 30 min before I/R injury.
Determination of Catalpol and Wortmannin Dosing Concentrations
We inoculated H9C2 cells (BNCC33772, Beina Bio, China) in a 96-well culture plate (100 µL per well) and divided them into blank control, model, catalpol, and wortmannin groups. I/R group, catalpol group, and wortmannin group H9c2 cells were cultured with low serum (2.5% FBS) medium for 24 hours, catalpol group was treated with different concentrations of catalpol (HY-N0820/CS-4170, MCE) (1, 10, 100, 1000 ug/mL) for intervention, wortmannin group was intervened with different concentrations of PI3K antagonist wortmannin (HY-10197/CS-5073, MCE) (0nM, 25nM, 50nM, 75nM, 100nM, and 150nM). Continued to culture for 24, 48, and 72 h, add 10 ul of CCK-8 detection reagent (KGA317, Keygen Biotechnology) to each well, incubate at 37°C for 2 hours; microplate reader detects the OD value of each well at 450nm wavelength to calculate the survival rate, select catalpol, and wortmannin dosing concentration.
Detection of Cell Apoptosis and ROS Level
Based on the instructions of Annexin V-FITC/PI apoptosis kit, we added single-cell suspension cells with the diluted binding buffer to resuspend the cells, which were collected by centrifugation. We added 5 µL Annexin V-FITC. Then, we added PI staining solution (10 µL) dropwise. We homogenized cells and incubated them for 15 min (dark condition was maintained). After adding 400 µL of PBS to resuspend the cells, we detected apoptosis level by flow cytometry within 1 hour. Then, we analysed the data using FlowJo software.
For ROS detection using ROS Assay Kit (Beyotime, China), we added 3 mL PBS o 1 ml single cell suspension (3×10⁶cells) to cells (resuspend). We centrifuged the cells at 350 rpm at 4°C for 5 min. We then discarded the supernatant. One ml serum-free medium was taken to the cell pellet to dilute the DCFH-DA solution (final concentration, ten µmol/L). We incubated the cultivated samples at 37°C (time; 30 min). We centrifuged the cells and washed them 3 times with a medium (serum-free medium), which did not enter the cells by centrifugation at 350 rpm at 4°C. Next, after adding 300 ul PBS to resuspend the cells, we detected the cellular ROS level through flow cytometry. We analysed the data using FlowJo software (Version 10.8.1).
Western Blot Analysis
We added the cells of each group to the lysis buffer. After lysis for 30min, we centrifuged lysates (10,000 rpm; 10 min; 4°C). We performed protein quantification by means of a bicinchoninic acid assay kit. We separated proteins through SDS-PAGE gels. After that, and then we transported them to PVDF membranes. We blocked blots with 5% nonfat dry milk in TBS at 25°C, and were then cultured with PI3K, Akt, p-PI3K, Bcl-2, p-Akt, p53, Caspase-3, Bax, beclin1, LC3II, or LC3I (primary antibodies), and GAPDH for 24 h at 4°C. We washed these three times and incubated the blots with secondary antibodies (1 hour, 25°C). We dropped the ECL exposure solution on the membrane and exposed it to a gel imaging system. “ImageJ” software was applied for examining each antibody band’s grey value.
Statistical Processing
Statistical processing was conducted using SPSS software (version 24). We repeated all experiments three times. The quantitative result was expressed as mean ±SD (standard deviation) (X ± S). We applied quantitative numerical comparison between groups by an independent sample t-test. We have made a quantitative numerical comparison between multiple groups through ANOVA. We performed pairwise comparisons using by S-N-K method. Inspection level (α = 0.05).
Results
Identification of DEGs and Functional Analysis
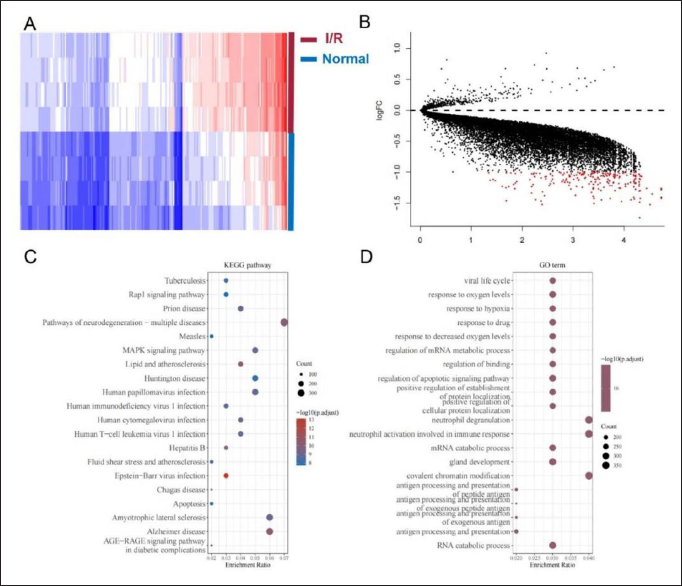
According to filter criteria, 4119 DEGs were identified, which consisted of 12 up-regulated and 4107 down-regulated genes. These are several anti-apoptosis genes, such as MCL-1 and Bcl-2, among the down-regulated genes. Figure 1 shows the heatmap and volcano of these DEGs significantly expressed in GSE6381. As shown in Figure 1, GO annotation of 4119 DEGs was performed involving three categories, such as BP (biological processes), MF (molecular functions), and CC (cellular components). Main KEGG pathways enriched in consisted of “Epstein-Barr virus infection,” “Pathways of neurodegeneration—multiple diseases,” and “MAPK signaling pathway,” and so on (Figure 1C). Additionally, GO analysis results showed the main GO terms consisted of “viral life cycle,” “response to oxygen levels,” and “response to hypoxia,” and so on (Figure 1D).
The Identification of Differentially Expressed Genes (DEGs) and Functional Enrichment Analysis of DEGs. A-B, the Top 20 Heatmaps and Volcano Plots of DEGs; C-D, the Top 20 KEGG Pathways and GO Terms of DEGs.
Catalpol and Wortmannin’s Effects on H9c2 Cells
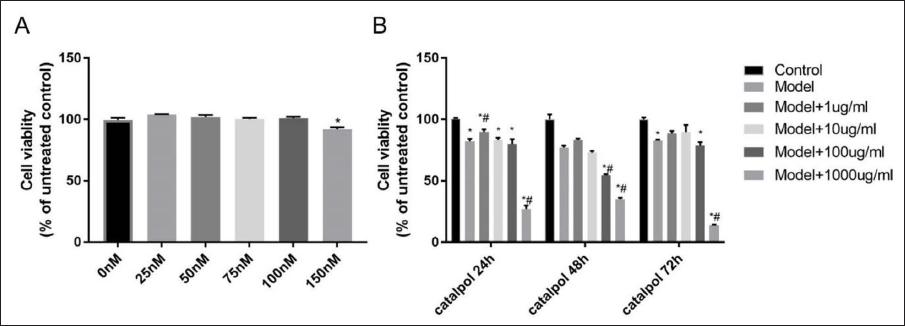
The proliferation level of H9c2 cells decreased significantly when being treated with wortmannin at 150 nM. The H9c2 cell proliferation level significantly increased when being treated with 1μg/ml catalpol for 24 h (Figure 1). Thus, the concentration of 150nM wortmannin and 1μg/ml catalpol were selected for subsequent experiments (Figure 2).
The Effect of Different Concentrations of Catalpol and Wortmannin on the Proliferation of H9c2 Cells. A, Exploring the Concentration of Wortmannin. *p < 0.05 vs. 0nM; B, Exploring the Concentration and Treatment Time of Catalpol.*p < 0.05 vs. Control; #p < 0.05 vs. Model.
ROS Expressive Levels and Apoptosis in H9c2 Cells
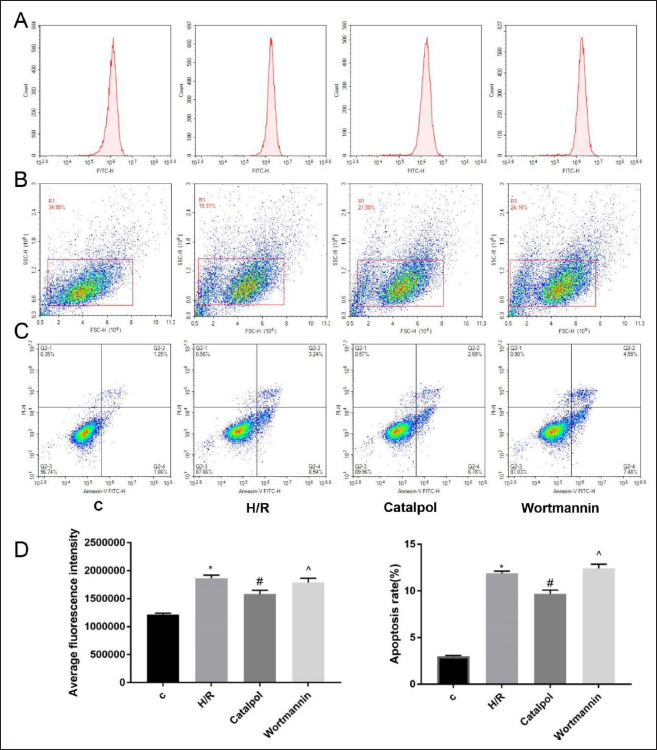
HR group’s apoptosis and ROS expression levels of H9c2 cells were significantly larger comparing with the control group. But, catalpol group’s expressive level was lesser comparing with the I/R group. Catalpol could down-regulate the ROS level and apoptosis of cardiomyocytes after HR (p < 0.05) (Figure 3). ROS and apoptosis expression levels of the wortmannin group were larger when comparing with the catalpol group (p < 0.05).
The Effects of Catalpol and Wortmannin on the Level of Reactive Oxygen Species (ROS) and Apoptosis in H9c2 Cells. A D, the Average Fluorescence Intensity of ROS Among Different Groups; B-C, Apoptosis Level of Different Groups *p < 0.05 vs. C; #p < 0.05 vs. H/R; ˆp < 0.05 vs. Catalpol.
Detection of Caspase-3 and Bcl-2/Bax Expression Levels of H9c2 Cells
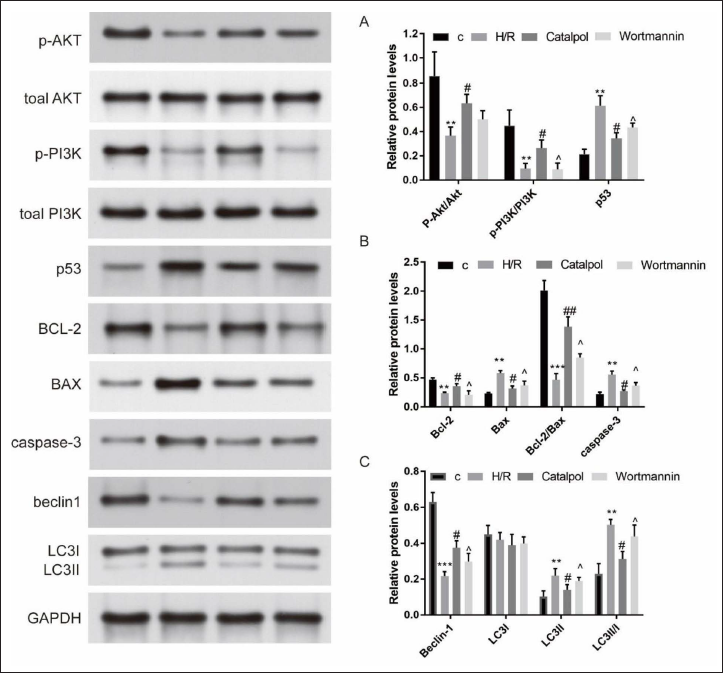
While comparing with the control group, the H/R group’s Bcl-2/Bax expression level was down-regulated (p < 0.001, Figure 4). Expression level Bcl-2/Bax in the catalpol group was higher compared with the H/R group (p < 0.01). When we compared the Bcl-2/Bax expression level with the catalpol group, the level in the wortmannin group was down-regulated (p < 0.05) (Figure 4). The H/R group’s caspase 3 protein expression was increased (p < 0.01) compared with the control group, which was also markedly larger than that of the catalpol group. wortmannin group’s caspase 3 protein was larger compared with the catalpol group (p < 0.05) (Figure 4).
The Expressive Levels of Protein, Akt, p-Akt, PI3K, p-PI3K, and P53 (A), Bcl-2, Bax, and Caspase-3 (B), Beclin1, LC3I, and LC3II(C) via Western Blot **p < 0.05,***p < 0.001 vs. C; #p < 0.05,##p < 0.01 vs. H/R; ˆp < 0.05 vs. Catalpol.
Detecting Beclin1 and LC3II/LC3I Expression Levels in H9c2 Cells
The expression of LC3II and the ratio of LC3II/I protein in the H/R group were better while compared with the control group (p < 0.01). The catalpol group’ ratio of LC3II/I protein; was lower compared with the H/R group (p < 0.05) (Figure 4). Compared with catalpol group, the ratio of LC3II/LC3I protein in the wortmannin group was up-regulated (p < 0.05) (Figure 4).
The beclin1 expression of the H/R group was lower when compared with the control group (p < 0.001) and was lesser than that of the Catapol group (p < 0.05) (Figure 4). At the same time, when comparing with the catalpol group, the wortmannin group’s beclin1 expression was down-regulated (p < 0.05) (Figure 4).
Detecting of the Expressive Level of PI3K/Akt /p53 Singling
The ratio of p-Akt/Akt and p-PI3K/PI3K protein expressions in the H/R group was lesser when comparing with the control group (p < 0.01). Comparing with the H/R group, the ratio of p-Akt/Akt and p-PI3K/PI3K protein expressions in the catalpol group was improved (p < 0.05). Meanwhile, the ratio of p-PI3K/PI3K protein expression in the wortmannin group was down-regulated when comparing with the catalpol group (p < 0.05, Figure 4).
p53 expression level in the H/R group was greater than that in the control group (p < 0.01). The p53 expression in the catalpol group was lesser than that in the H/R group (p < 0.05). The wortmannin group’s p53 expression was significantly larger compared with the catalpol group (p < 0.05) (Figure 4).
Discussion
Acute and persistent ischemia and hypoxia of the coronary artery can cause acute MI (Dlamini et al., 2015; Wang et al., 2017). The standard treatment for acute coronary syndrome is to restore the coronary blood supply timely. Although the restoration of blood supply to the ischemic area can alleviate myocardial necrosis, it is also accompanied by the aggravation of damage to the ischemic area (Dlamini et al., 2015; Wang et al., 2017).
Numerous studies have confirmed that apoptosis and autophagy play important roles in cardiomyocyte reperfusion injury (Dlamini et al., 2015; Lee & Gustafsson, 2009; Nakai et al., 2007; Rubinstein et al., 2011; Wang et al., 2017). In our study, we have conducted bioinformatics analysis of the transcriptional signature differences between “Immediately post-cardioplegic arrest” and “Reperfusion” right ventricular samples. Both GO, and KEGG analysis of DEGs have revealed apoptosis is the most crucial molecular process in reperfusion injury. In fact, apoptosis is a key pathological mechanism of myocardial injury and myocardial cell loss caused by I/R and is considered to be the cellular basis for the development of the heart from compensatory changes to pathological changes (Dlamini et al., 2015; Lee & Gustafsson, 2009; Nakai et al., 2007; Rubinstein et al., 2011; Wang et al., 2017). Ischemia and reperfusion, if persistent, can accelerate irreversible apoptosis. As important messenger molecules in apoptosis signal transduction, ROS and calcium ions in the cytoplasm can directly stimulate the caspase cascade. The activation of Caspase-3 is caused by numerous apoptosis stimulators (Dlamini et al., 2015; Lee & Gustafsson, 2009; Nakai et al., 2007; Rubinstein et al., 2011; Wang et al., 2017). The key proteases in the caspase family are the only way for the caspase cascade reaction. The main target of Bcl-2 family proteins is situated on the mitochondrial membrane. In the apoptosis process, it plays an important role (Scorrano, 2014).
Autophagy can maintain normal cardiac metabolism and repair damage (Buckley et al., 2014; Frank et al., 2015; Higgins et al., 2011). Autophagy mainly includes major processes such as autophagosome formation, the fusion of autophagosome and lysosome, followed by degradation (Frank et al., 2015; Higgins et al., 2011). Autophagy is in a dynamic equilibrium under physiological conditions, but changes in any link in pathological conditions may break the balance of autophagy and cause cell and tissue damage and organ dysfunction (Eisenberg-Lerner et al., 2009; Fuchs & Steller, 2011). Beclin-1 is the first gene to be identified that mediates autophagy in mammals. LC3, a key protein in the formation of autophagic vacuoles, has 2 forms: LC3I and its proteolytic derivative LC3II. The LC3II/LC3I ratio can reflect the enhanced autophagic activity (Fuchs & Steller, 2011).
PI3K/Akt is a signaling pathway closely related to autophagy and apoptosis (Fuchs & Steller, 2011; Rubinstein et al., 2011). Akt is the core of this pathway, which the most important upstream regulatory gene is PI3K, and downstream regulatory genes include p53, Caspase, Bcl-2, Bax, and so on, p53 induces apoptosis through transcriptional activation of other pro-apoptotic genes, such as Caspase-3, Bax, and death factor (Fas) (Fuchs & Steller, 2011; Rubinstein et al., 2011). P53 can participate in the mitochondria-mediated apoptosis pathway by inhibiting anti-apoptotic protein and inducing factor (PI3K, Akt1, etc.) release (Zhang et al., 2017). There is increasing evidence that p53 promotes and inhibits autophagy at different subcellular localizations, and p53 in the nucleus can promote autophagy, while p53 in the cytoplasm inhibits autophagy (Rahman et al., 2022).
Our study showed that the expressions of p53, Caspase-3, beclin1, and LC3II/LC3I were significantly improved, while the Akt/ p-Akt and Bax/ Bcl-2 expressions were significantly reduced after H9c2 cells were treated with H/R injury. The highly expressive Caspase-3 and p53 act in the occurrence of cardiomyocyte apoptosis. In addition, the highly expressive beclin1 and LC3II/LC3I act in the occurrence of autophagy. We also identified the effect of catalpol on alleviating myocardial I/R injury here.
We have studied potential mechanisms underlying catalpol-associated protection (Bao et al., 2016; Han et al., 2018). Catalpol is an iridoid glycoside with biological functions, indicating anti-inflammatory, hepato-protective, and reduction of insulin resistance in type 2 diabetes (Huang et al., 2013; Yan et al., 2018; Zhu et al., 2010). Moreover, catalpol’ cardioprotective effects against I/R injury are also identified (Huang et al., 2013; Jia et al., 2015). It is noteworthy that catalpol was also found to promote apoptosis in tumor cells, which may be related to the fact that catalpol acts on different signaling pathways or targets. In our study, catalpol could significantly increase the expressions of p-Akt/Akt and Bcl-2/Bax proteins after H/R injury and reduce p53, Caspase-3, beclin1, and LC3II/LC3I expressions. The specific inhibitor of PI3K, wortmannin, partially blocked the anti-apoptotic and autophagic effects of catalpol. These findings indicate that PI3K/Akt/p53 is located upstream of Bcl-2 and LC3 families, and activated Akt can impact the phosphorylation level of various downstream molecules and plays the role of anti-apoptosis and autophagy. However, our experiments have only explored the PI3K/AKT/p53 signaling pathway, and we need to investigate the key role of other pathways in catalppol anti-apoptosis and autophagy for cardiomyocyte.
Conclusion
In summary, our study reveals that catalpol inhibits apoptosis, reduces excessive autophagy, and alleviates the effects of myocardial ischemia-reperfusion through PI3K/Akt/p53 pathway. These findings help us further understand mechanisms associated with the catalpol’s myocardial-protective effects on inhibiting apoptosis and autophagy on I/R injury.
Abbreviations
MI: myocardial infarction; ROS: reactive oxygen species; I/R: ischemia/reperfusion; DEGs: differentially expressed genes
Authors ’ Contribution
LGH wrote the manuscript; YKS and HSZ collected the data; YC and JGZ analysed the data. All authors approved the manuscript.
Footnotes
Declaration of Conflicting Interests
The authors declared no potential conflicts of interest with respect to the research, authorship and/or publication of this article.
Funding
This study was supported by Traditional Chinese Medicine Science and technology Development Program of Shandong Province (2019-0487).