
Abstract
Objective
For cost-effectiveness comparison of child vision and hearing screening programmes, methods and data should be available. We assessed the current state of data collection and its availability in Europe.
Methods
The EUSCREEN Questionnaire, conducted in 2017–2018, assessed paediatric vision and hearing screening programmes in 45 countries in Europe. For the current study, its items on data collection, monitoring and evaluation, and six of eleven items essential for cost-effectiveness analysis: prevalence, sensitivity, specificity, coverage, attendance and loss to follow-up, were reappraised with an additional questionnaire.
Results
The practice of data collection in vision screening was reported in 36% (N = 42) of countries and in hearing screening in 81% (N = 43); collected data were published in 12% and 35%, respectively. Procedures for quality assurance in vision screening were reported in 19% and in hearing screening in 26%, research of screening effectiveness in 43% and 47%, whereas cost-effectiveness analysis was performed in 12% for both. Data on prevalence of amblyopia were reported in 40% and of hearing loss in 77%, on sensitivity of screening tests in 17% and 14%, on their specificity in 19% and 21%, on coverage of screening in 40% and 84%, on attendance in 21% and 37%, and on loss to follow-up in 12% and 40%, respectively.
Conclusions
Data collection is insufficient in hearing screening and even more so in vision screening: data essential for cost-effectiveness comparison could not be reported from most countries. When collection takes place, this is mostly at a local level for quality assurance or accountability, and data are often not accessible. The resulting inability to compare cost-effectiveness among screening programmes perpetuates their diversity and inefficiency.
Introduction
How should the cost-effectiveness of vision and hearing screening programmes be compared? When the methods and data of paediatric vision and hearing screening programmes are known in detail, and software is available to calculate their cost-effectiveness, it should be possible to compare the cost-effectiveness of screening programmes. This was the premise of the EUSCREEN Study (https://www.euscreen.org). At the end of the EUSCREEN Study, the EUSCREEN Cost-Effectiveness Model (https://miscan.euscreen.org) was made available in the public domain to calculate the cost-effectiveness of screening programmes and compare the cost-effectiveness of screening programmes across borders. 1 Users can enter a variety of variables in the model, such as screening test, screening age, screening frequency, location, screening professional etcetera, to calculate the cost-effectiveness of a vision or hearing screening programme.
To collect data on these variables from all countries in Europe, the EUSCREEN Questionnaire was conducted in 2017–2018. Representatives of 45 European countries (including Israel and Turkey) provided data on demography, existing screening programmes, coverage and attendance, screening tests used, follow-up, diagnosis, treatment, benefit and adverse effect of screening.
The questionnaire consisted of three parts concerning vision screening (126 questions), hearing screening (191 questions) and general screening (82 questions). The questions had been formulated by a focus group consisting of ophthalmologists, orthoptists, otolaryngologists, audiologists and public health experts specialised in cost-effectiveness analysis.
In almost all countries in Europe, three Country Representatives (CRs) had been recruited: one for vision, one for hearing and one for general screening, each to answer their own part of the questionnaire. The EUSCREEN Questionnaire and its results have been described in detail by Mackey et al., 2 Bussé et al. 3 and Carlton et al. 4
The EUSCREEN Questionnaire accurately mapped the large differences between vision and hearing screening programmes in Europe. However, when we attempted to put the EUSCREEN Cost-Effectiveness Model to use in 2020, 1 we found that input data essential for cost-effectiveness analysis, on prevalence, sensitivity, specificity, coverage, attendance and loss to follow-up, were insufficiently available to be able to perform model simulations in most countries.
For the Cost-Effectiveness Model to run, data are needed on more variables than the variables that have been defined as quality indicators. For newborn hearing screening, the American Academy of Paediatrics Joint Committee on Infant Hearing defined coverage, referral rate and follow-up rate as essential quality indicators. 5 In vision screening, the prevalence of persistent amblyopia at age seven (amblyopia not detected, insufficiently treated or not responsive to treatment) is sometimes used as an overall quality indicator to describe how effective a national vision screening programme and subsequent treatment are. 6 However, this is not an indicator that has been formally defined as such by an organisation like the American Academy of Paediatrics.
For comparative cost-effectiveness analysis, data are needed on prevalence, sensitivity, specificity, coverage, attendance and loss to follow-up. In the present study, we assessed the state of data collection, monitoring and quality control in vision and hearing screening. We determined to what extent data essential for cost-effectiveness analysis were available in all countries in Europe.
Methods
First, in the EUSCREEN Questionnaire data set, we reappraised the items pertaining to data collection, monitoring and quality control, and those pertaining to variables essential for cost-effectiveness analysis (the relevant questions in the EUSCREEN Questionnaire can be found in Supplemental file 1).
For the additional questionnaire, circulated in September 2021, all vision and hearing screening CRs who had completed the EUSCREEN Questionnaire in 2017–2018 were asked to review their answers to items concerning monitoring and data collection; checking, for instance, whether new data had become available. To this end, they were asked to answer or update twelve questions, a repeat of the relevant questions in the EUSCREEN Questionnaire. In addition, they were given the option to state that screening was not yet implemented in their country to an extent that monitoring was opportune and, if it was the case that monitoring was not opportune, whether they could estimate the coverage of screening in their country. They were also asked, in the case that data were collected in their country, whether these were published. The questions can be found in Supplemental file 1.
The items in the reappraisal and in the additional questionnaire about the processes of data collection dealt with the collection of information on screening, quality assurance, research on screening programmes, cost-effectiveness analysis of countries’ screening programmes and revisions of screening programmes.
The answers to the additional questionnaire were checked and verified in the same way as the answers to the EUSCREEN Questionnaire, following the procedure as described by Carlton et al. 4 and Bussé et al. 2 The answers were checked based on the additional information provided by the CRs and by consulting independent sources such as publicly accessible databases and published papers and reports. In cases where answers could not be independently verified but the CRs provided an acceptable reason for this, for example that they retrieved the data from a database that was not publicly accessible or from unpublished research, the answers were also accepted. Finally, the answers were checked for consistency with the answers in the EUSCREEN Questionnaire.
When the EUSCREEN Cost-Effectiveness Model was developed in 2019–2020, the variables that were essential for cost-effectiveness analysis of vision and hearing screening programmes were identified by sensitivity analysis. 7 These were prevalence, age at screening, test used, test threshold, sensitivity, specificity, coverage, attendance, loss to follow-up, professional and costs. These variables often depended upon each other, as illustrated in Figure 1.
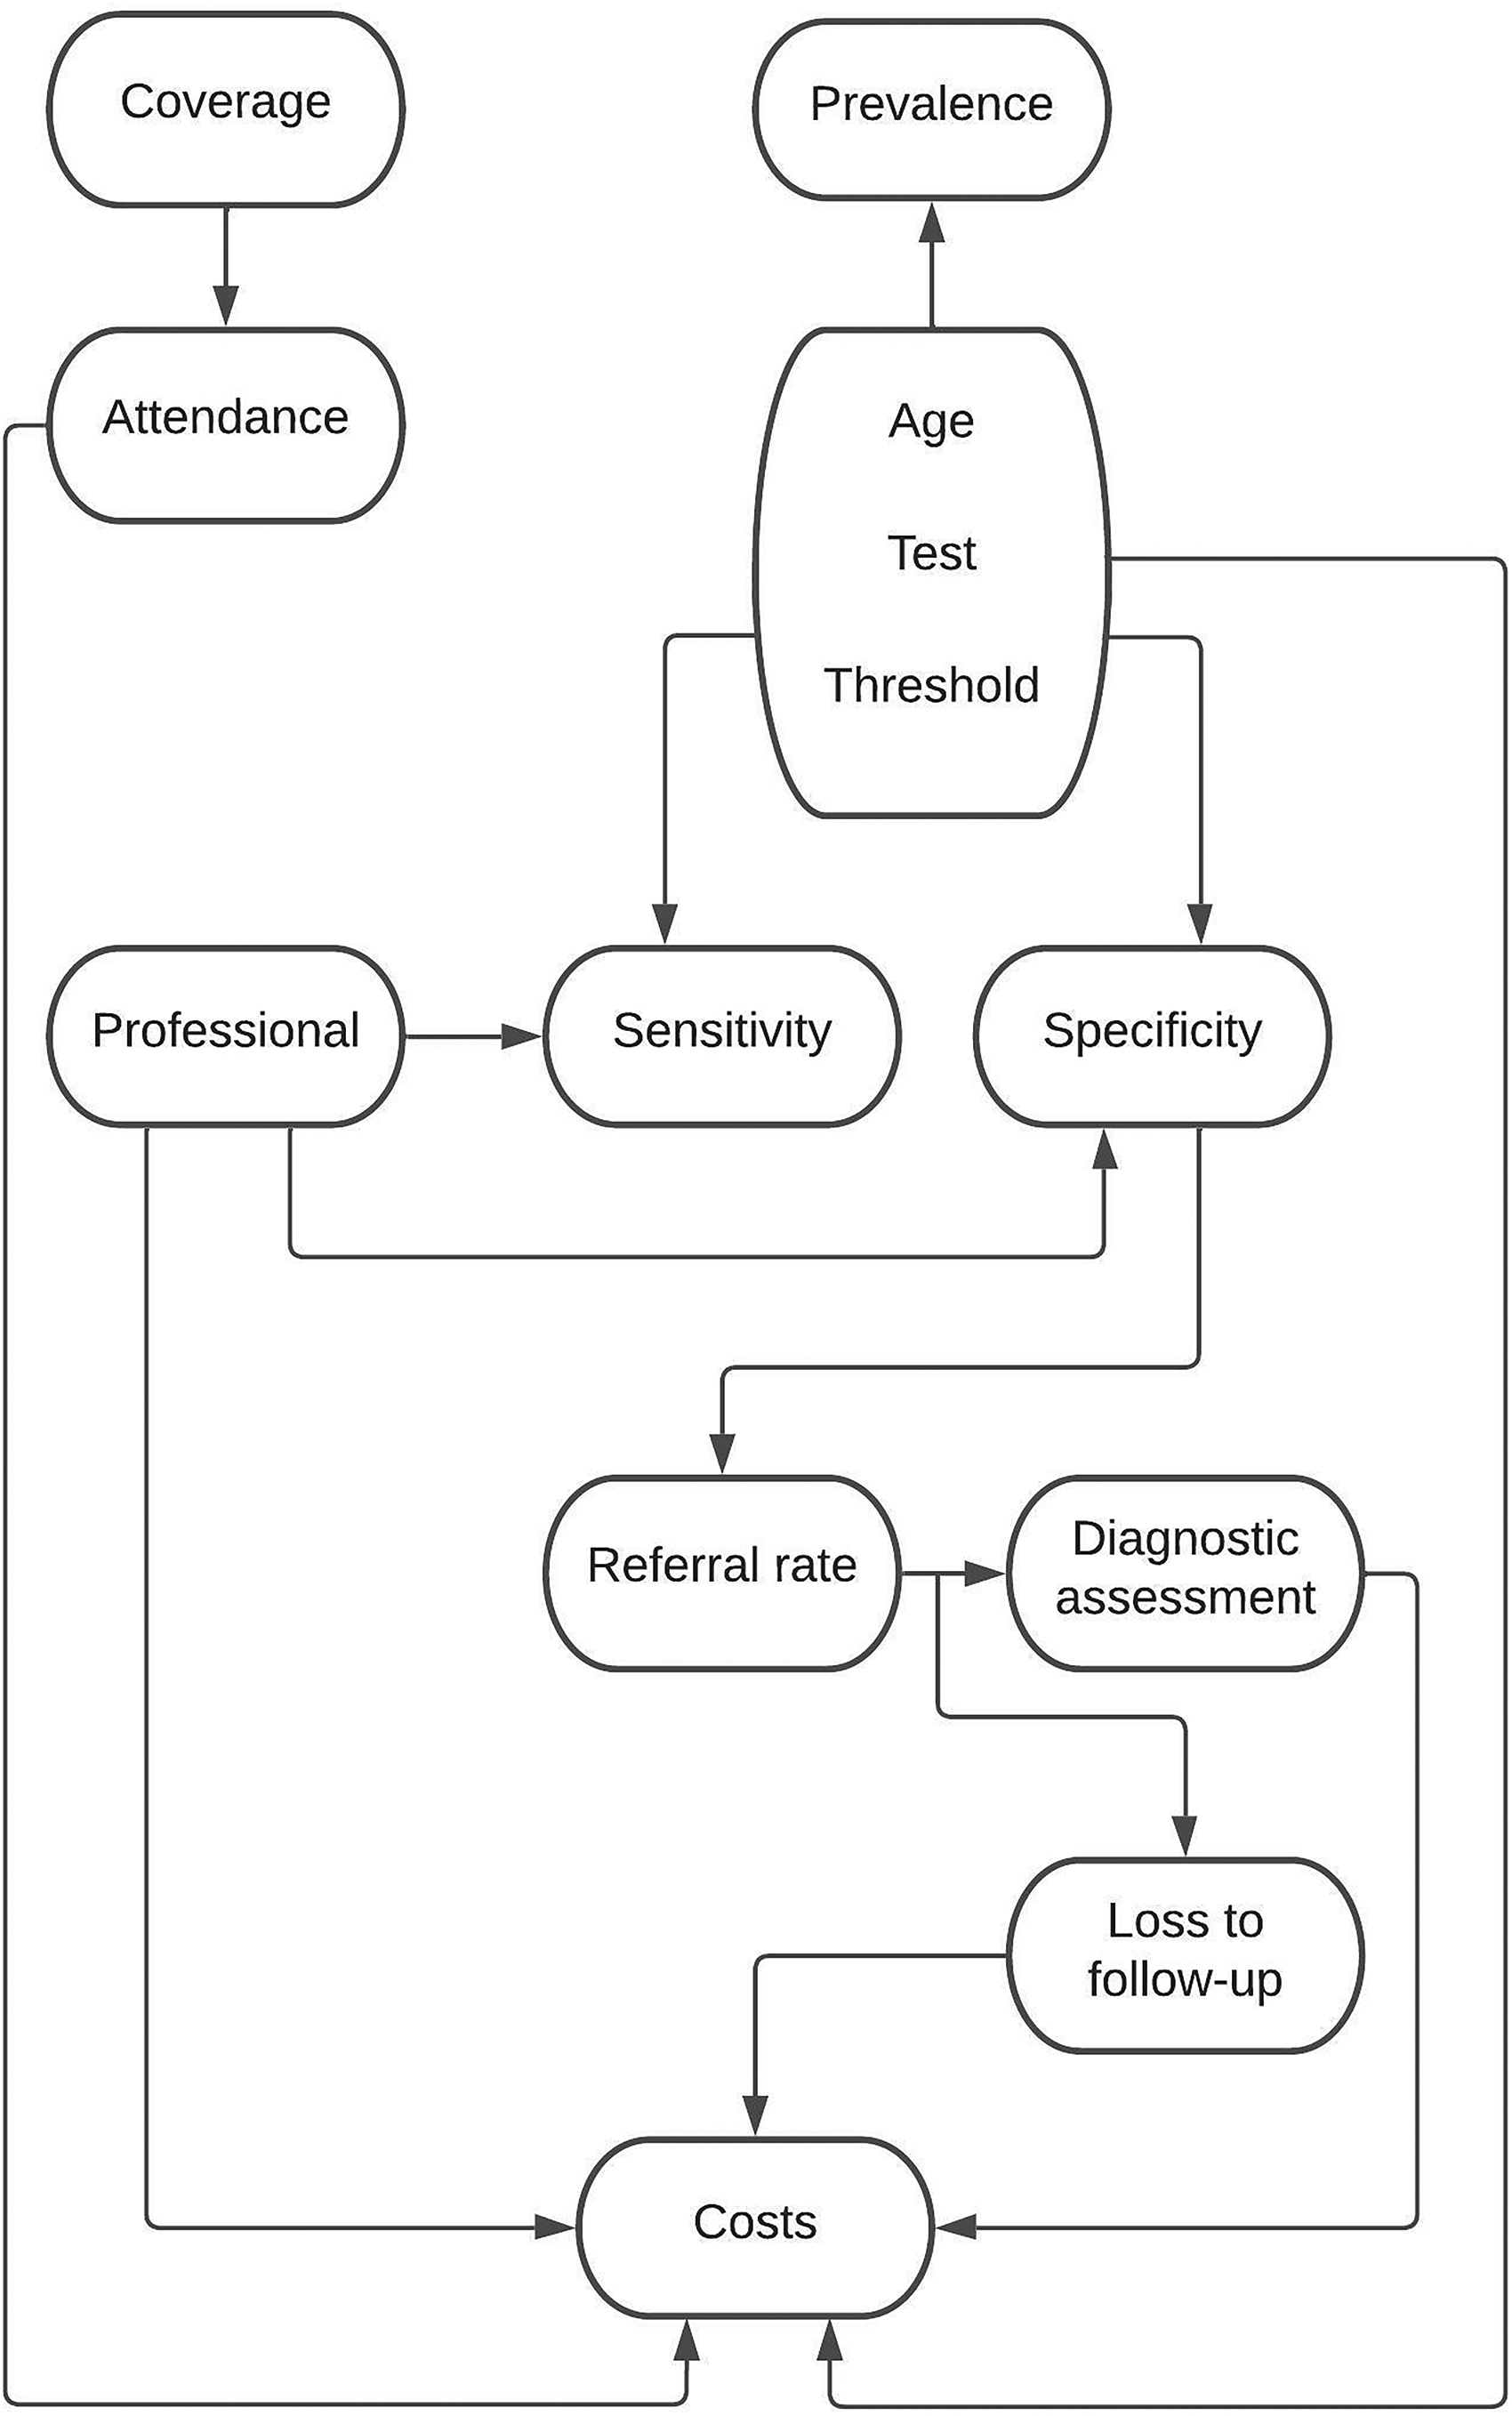
When the EUSCREEN cost-effectiveness model was developed in 2019–2020, the variables that were essential for cost-effectiveness analysis of vision and hearing screening programmes were identified by sensitivity analysis. The arrows indicate which variables affect each other. A brief explanation of these variables can be found in Supplemental file 2.
Five of these eleven variables essential for cost-effectiveness analysis need not be collected during screening: age at screening, test used, test threshold, professional and costs. The first four of these variables are determined in the screening protocol while costs can be calculated with relative ease.
The items that were assessed in the reappraisal and in the additional questionnaire were those pertaining to the variables: prevalence, sensitivity, specificity, coverage, attendance and loss to follow-up. We do not report on the content of these items, such as the reported prevalence of amblyopia or coverage of hearing screening, but on whether these variables were known and available. It should be noted that prevalence and sensitivity cannot be obtained by solely collecting data within the screening programme itself, but require large prospective cohort studies (more detailed information on this subject can be found in Supplemental file 2).
Included were countries with a EUSCREEN CR who had answered the EUSCREEN Questionnaire in 2017–2018. Excluded were countries whose CRs answered insufficient questions to enable drafting of a Country Report in 2018–2019 and countries whose CRs did not verify the Country Report that was drafted based on their answers. For this study, the assessment was limited to countries in Europe, because almost all countries in Europe participated whereas only four countries outside Europe participated.
We restricted our assessment to vision screening by measurement of visual acuity in childhood and to neonatal hearing screening of well babies, because the effectiveness of these screening examinations has been established.8–10 We assessed the collected quantitative data through descriptive statistics. Percentage responses were calculated for all items. The collected qualitative data were categorised and subsequently similarly assessed.
Results
In the EUSCREEN Questionnaire, the questions on data collection and monitoring had been completed by 56 CRs for 42 countries or regions for vision screening and 47 CRs for 43 countries or regions for hearing screening (Supplemental file 3), in Europe, and Israel and Turkey.
For vision screening in the United Kingdom, data were provided separately by England, Northern Ireland, Scotland and Wales. For hearing screening, only England provided data. The Russian Federation only provided data for hearing screening. Data from Portugal for vision screening were not included because the drafted Country Report was not verified by the CR. Data from Norway for hearing screening were not included because not enough information was provided to enable drafting of a Country Report.
For 3 countries, vision screening was reported for a large region instead of the entire country. For 13 countries, hearing screening was reported for one or two large regions instead of the entire country: Belgium and Spain both provided data separately for two regions. Note that the EUSCREEN Questionnaire preferred detailed data for a large region over incomplete data for an entire country. CRs from two countries reported that hearing screening was performed in some regions but not in others.
For vision screening, 43 CRs answered the additional questionnaire for 35 countries and for hearing screening, 37 CRs for 35 countries. This means that 78% of CRs reviewed and, if applicable, updated their answers. For the remaining countries we checked for possible updates ourselves by re-checking the sources provided in 2017–2018. Small discrepancies between the data presented here and previously published EUSCREEN Questionnaire data4,5 are explained by the updated information in the data presented here.
CRs reported that in their country screening was not practised on a large enough scale for monitoring to be opportune in 14% of vision (N = 42) and 19% of hearing (N = 43) screening programmes. For three vision screening programmes, coverage was estimated at around 10% or lower. In two hearing screening programmes screening was only performed in private hospitals and in one programme only infants admitted to neonatal intensive care were screened.
Of vision screening programmes, 36% reportedly collected data and of hearing screening programmes, 81% (Figure 2). Of vision screening programmes, 12% published collected data and of hearing screening programmes, 35%.
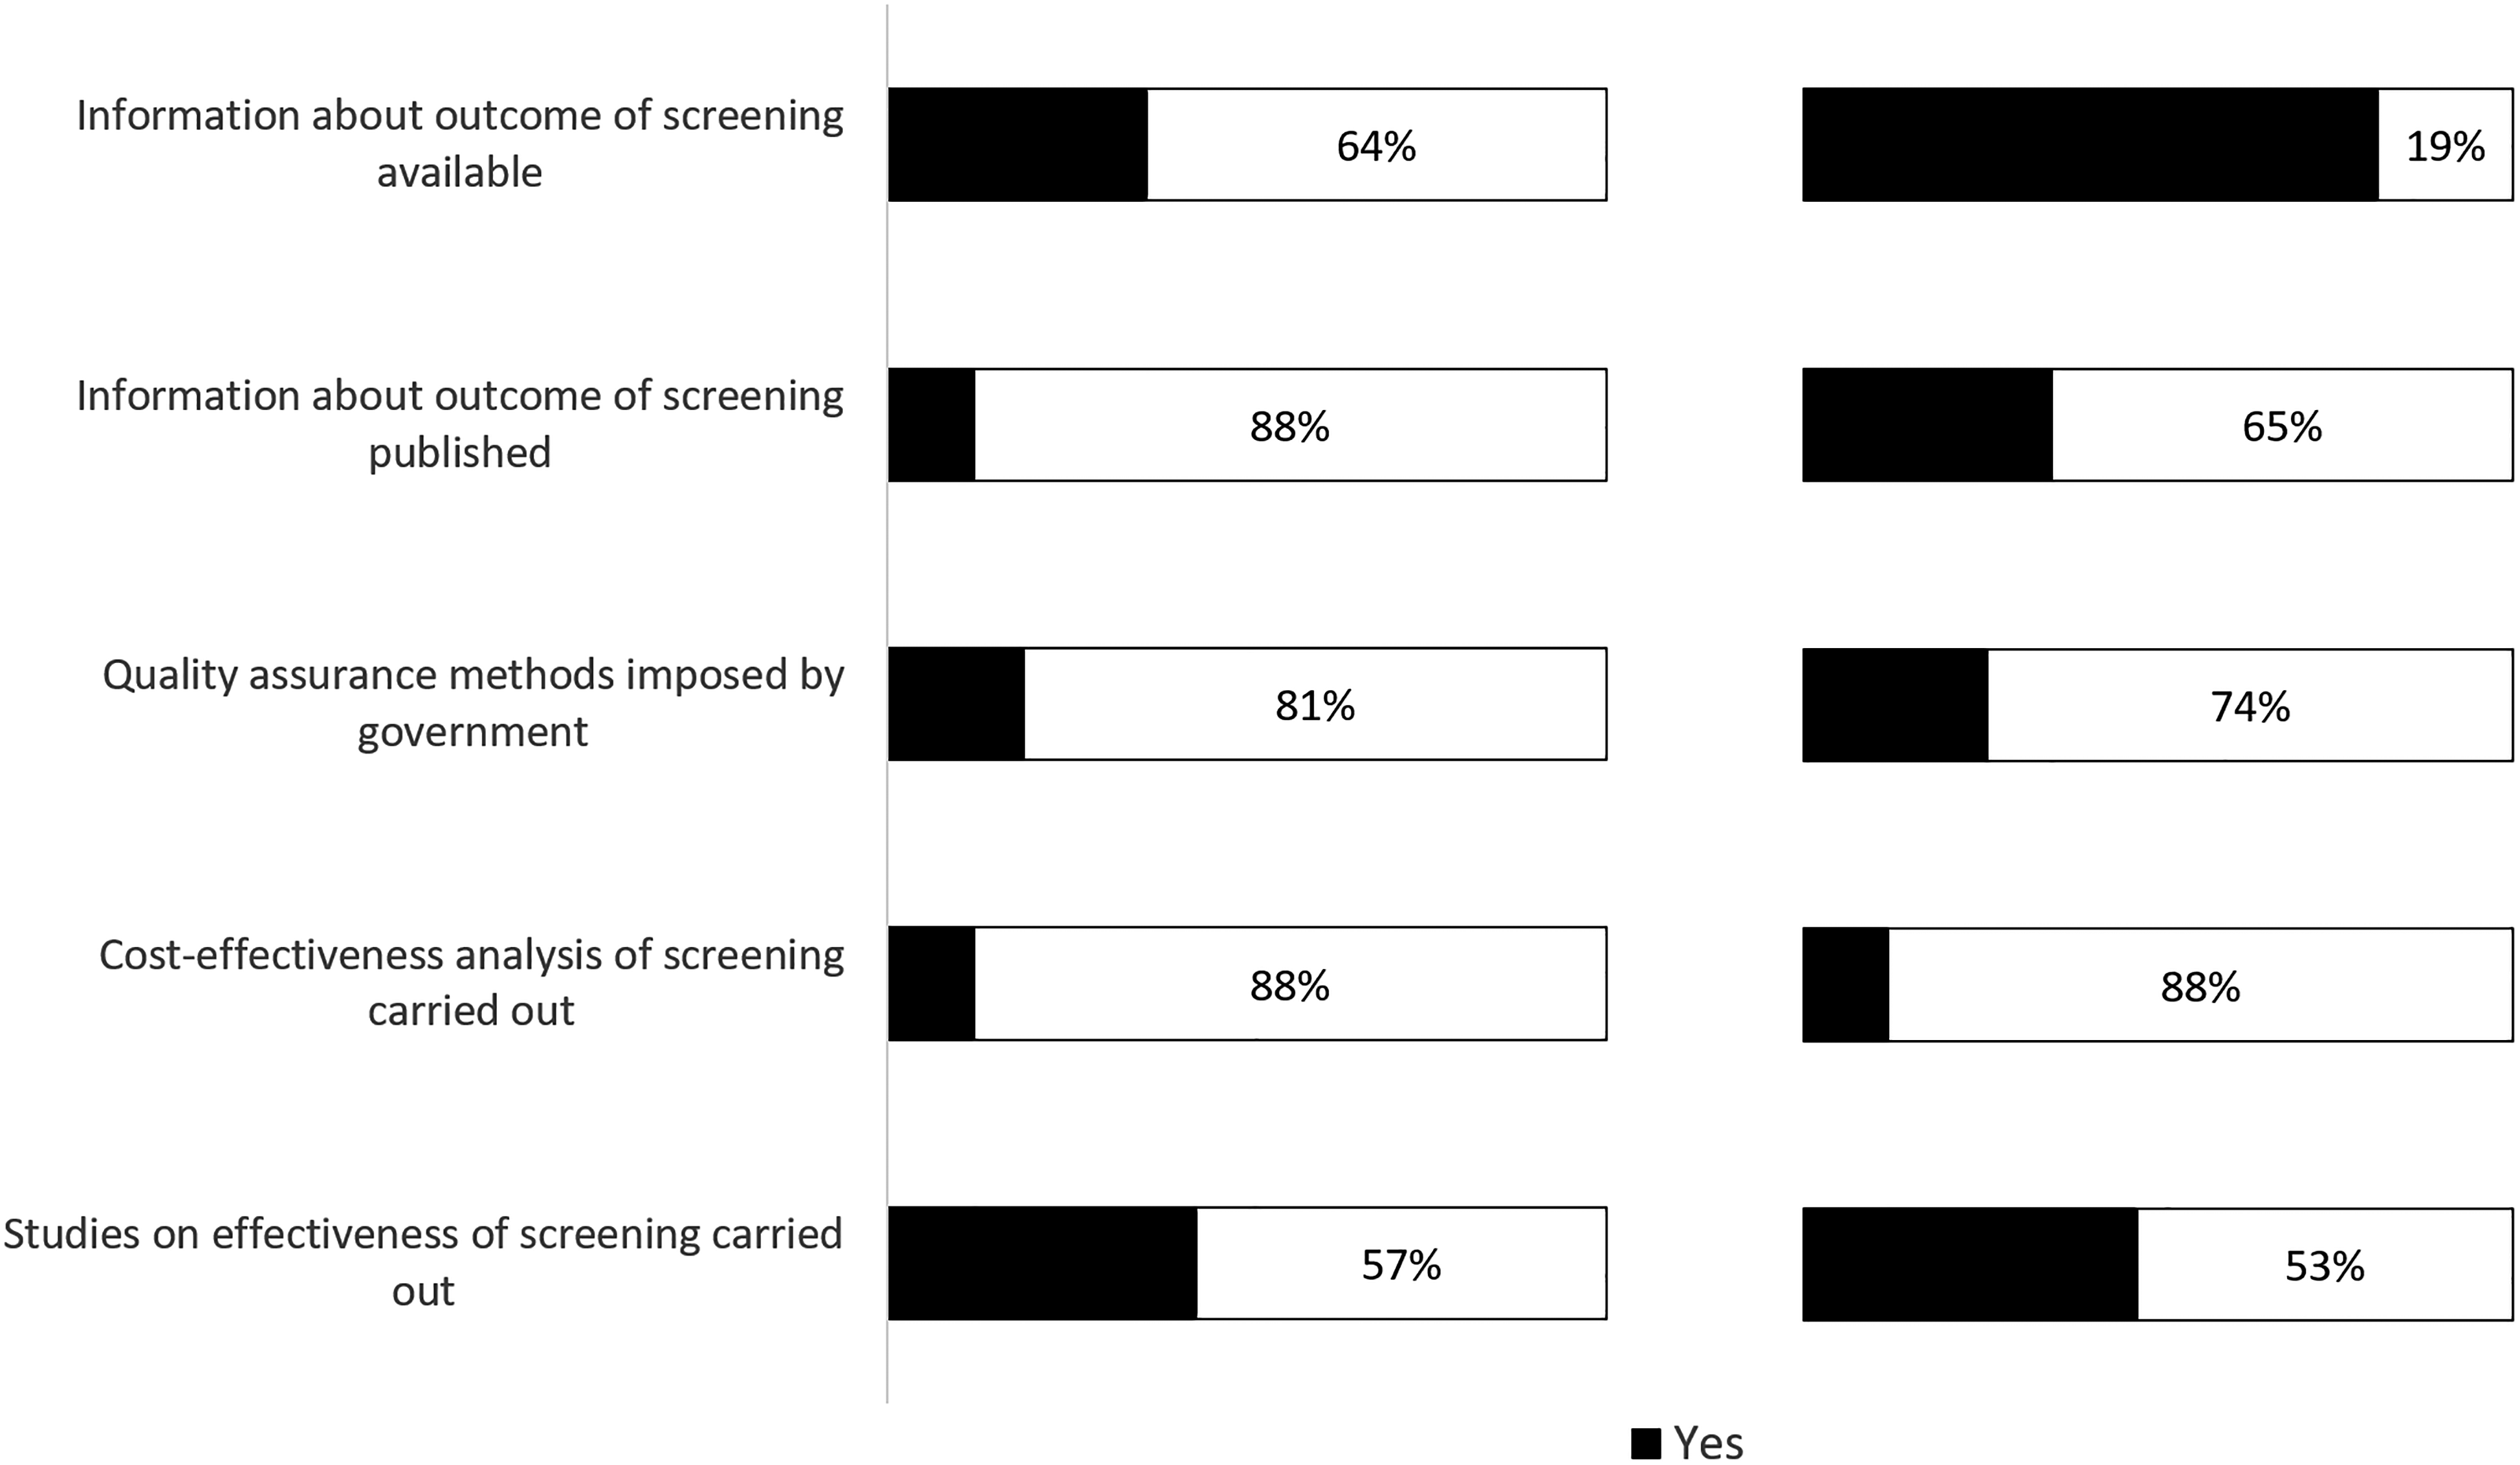
Data collection, monitoring and cost-effectiveness analysis in (left) vision and (right) hearing screening programmes (in N = 42 and N = 43 European countries respectively). A detailed overview per country can be found in Supplemental Table 1a and 1b respectively in Supplemental file 4.
In 3 out of 5 countries where collected vision screening data were published, these were available online (data for 2010–2020). In 13 out of 15 countries where collected hearing screening data were published, these were available online (data for 2009–2020).
Most published data were not based on structural monitoring embedded in the programme, but on incidental studies that were often also geographically limited to a city or area, usually with the purpose of assessing the effectiveness of the screening programme. The comprehensiveness of the data in these studies varied. Some studies published only basic data, for example the number of screenings performed, while others included more data, for example the number of positively screened children.
Few countries, and only for hearing screening, collect screening data in a centralised national database and publish screening results: England, Luxembourg, Poland and the Netherlands. In England, screening Key Perfomance Indicators are published quarterly, but these are limited to coverage and follow-up. 11 Data are also published on other forms of antenatal and newborn screening, but not on vision screening. In Luxembourg, data are published yearly. 12 In Poland, results are not published regularly. The most recent published results were from 2016. 13 Only the newborn hearing screening programme in the Netherlands is monitored continuously and publishes comprehensive yearly reports on its results. 14
Sixty-one CRs (21 vision CRs and 40 hearing CRs) added additional comments on quality assurance and data collection in their countries or regions. Several mentioned that data were recorded at a local or regional level (three vision and nine hearing CRs) and/or that recorded data were only used for auditing, quality assurance and/or accountability (seven vision and six hearing CRs). These data were not collected on a national level, or were collected incompletely or were unavailable or inaccessible. A few commented that data collection only took place voluntarily (two vision and one hearing CR). Examples of comments by CRs can be found in Box 1.
Quality assurance procedures were reported by 19% of vision screening CRs and 28% of hearing screening CRs. In some cases, they specified how quality assurance was carried out. Four vision and four hearing CRs mentioned that data on the screening results played a role in quality assurance. Three vision and three hearing CRs mentioned an audit or assessment procedure being part of quality assurance. When evaluations of programmes were carried out, these often were not based on screening data, but research projects based on surveys among medical staff and parents.
Specific remarks from CRs on data collection.
Hearing screening CRs
“Data collection is performed on a local or regional level” “Information is not continuously collected about screening outcomes” “Data are not collected on outcome measures such as coverage or referral rates, due to lack of manpower” “Data may be collected locally by hospitals” “In some hospitals, outcomes of hearing screening are collected in local databases” “Follow-up data are not routinely collected, national surveys of age of diagnosis and entry to rehabilitation are performed” “Data are collected through auditing. However, these data contain only screening results; follow-up results are not collected” “Data are only collected on a local or regional level voluntarily” “Issues with maternity centres delivering data on individual children” “Any data collection is only performed on a local level”
Vision screening CRs
“Only voluntary studies of health care professionals. No government monitoring” “The outcomes of vision screening are entered into the database. These data are audited to some degree by the orthoptists leading the service” “Quality assurance dictated by service agreements of the local authority”
The content and revision of vision and hearing screening programmes were in most cases determined by either a Ministry of Health (48% vision, 30% hearing), a body of experts (29% vision, 44% hearing) or a public health institute (17% vision, 14% hearing). Bodies of experts could be formal associations or representative bodies of healthcare professionals, but also committees of experts gathered ad hoc for the specific purpose of determining the content of a screening programme.
Most screening programmes were revised over time. Some were revised at regular intervals (36% vision, 28% hearing). Four CRs mentioned that data or research played a role in the revision process, but in most cases the revisions were reportedly based solely on expert opinion.
Twelve percent of both vision and of hearing screening CRs reported cost-effectiveness analysis of the screening programme. Of vision screening CRs, five out of five who reported cost-effectiveness analysis provided a published example (published between 2003 and 2021). Of hearing screening CRs, four out of five who reported cost-effectiveness analysis provided a published example (between 2007 and 2012).
Studies on the effectiveness of paediatric screening programmes were reported by 43% of vision screening CRs and 47% of hearing screening CRs. A published example was provided by 14 out of 18 vision screening CRs who reported effectiveness research (published between 1996 and 2021). Of 20 hearing screening CRs who reported effectiveness research, 19 provided a published example (between 2004 and 2021).
We assessed which countries provided data on prevalence, sensitivity and specificity, coverage, attendance and loss to follow-up (Figure 3). When providing data, CRs could choose between providing actual data (for example from a published study or a programme database) and providing estimated data (for example a CR’s personal impression, based on experience).
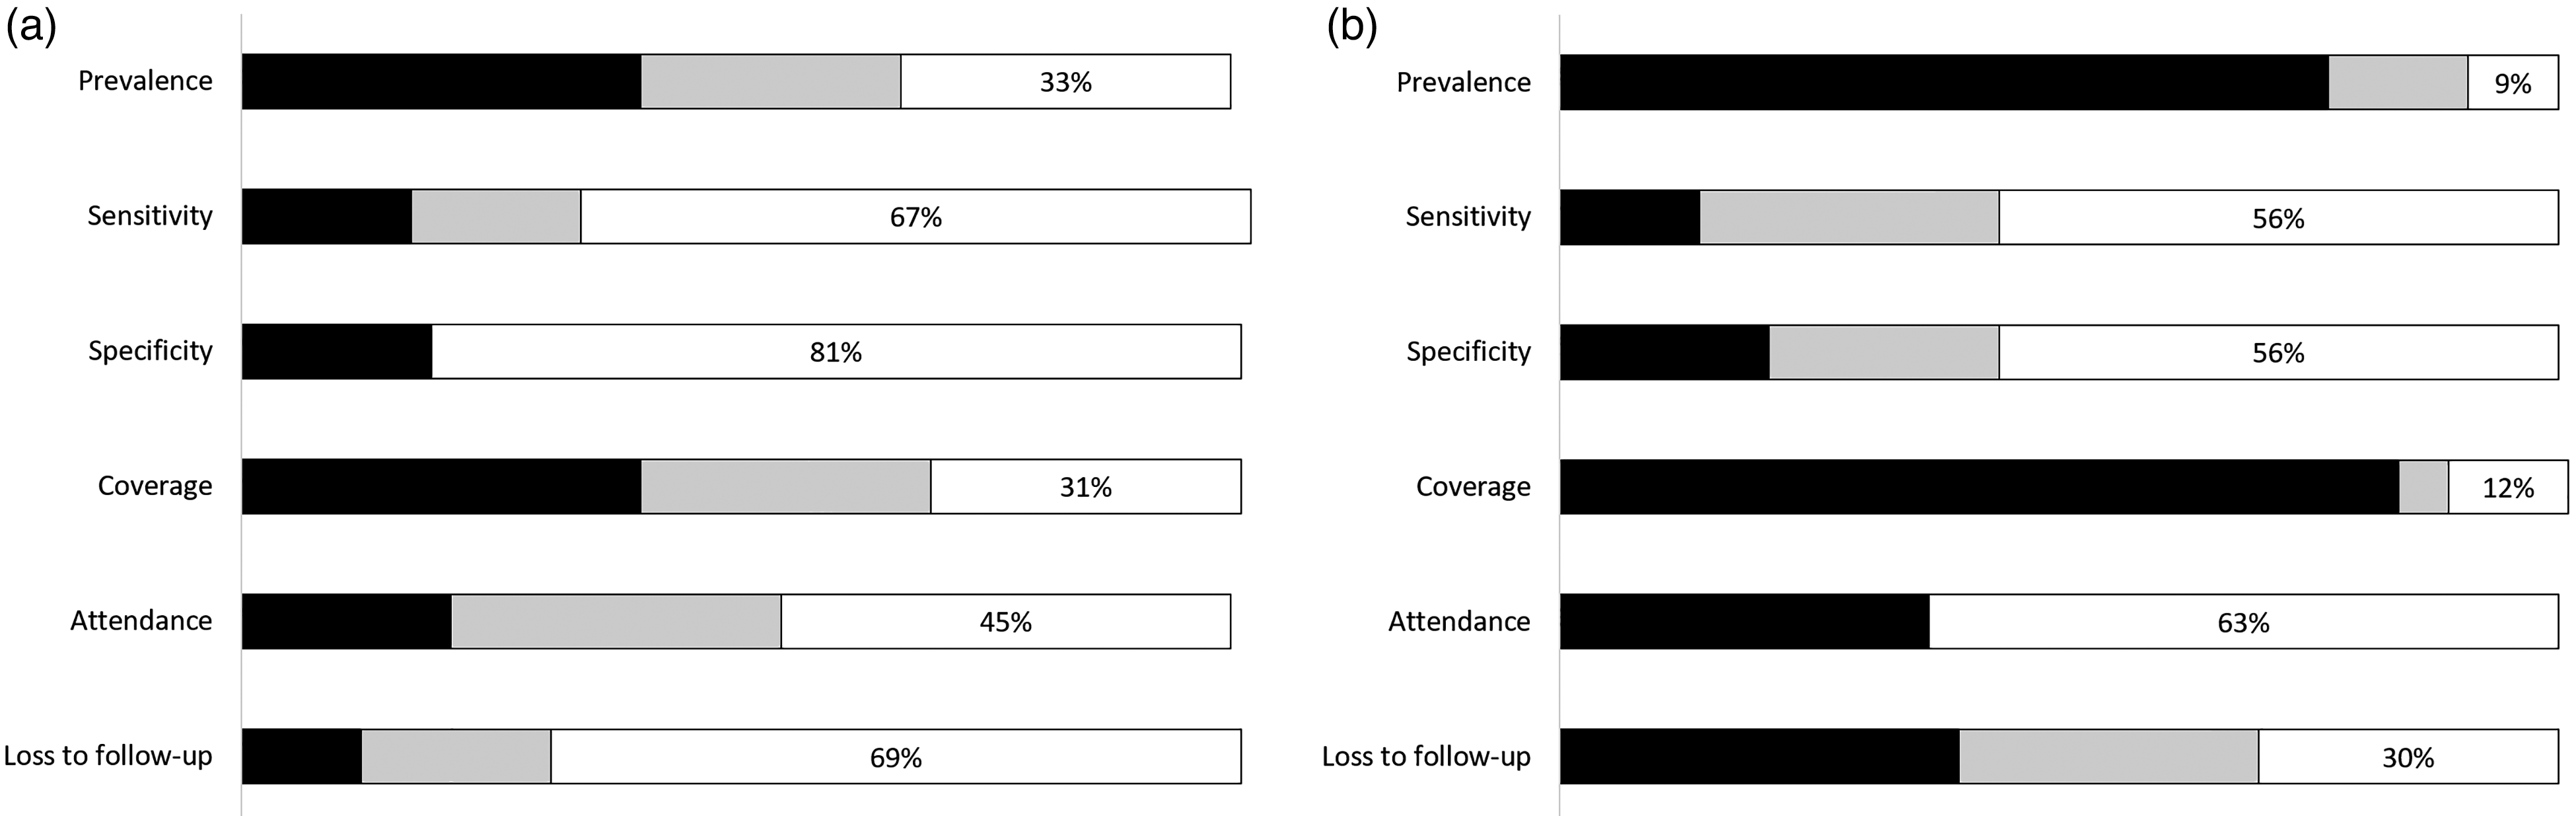
Availability of data on six items essential for cost-effectiveness analysis in (left) vision and (right) hearing screening programmes (in N = 42 and N = 43 European countries respectively). A detailed overview per country can be found in Supplemental Table 2a and 2b respectively in Supplemental file 4.
Of 17 vision screening CRs who reported prevalence of amblyopia, 14 provided a published source: 10 prospective and 4 retrospective cohort studies. There was a large variety in cohort size and in the ages of the children included in the cohorts. Studies used different definitions of amblyopia and different tests and thresholds.
Of 33 hearing screening CRs who reported prevalence of congenital hearing loss, 15 provided a published source. In five cases, these were reports based on continuous monitoring of a programme. The others were five prospective and five retrospective cohort studies. As with vision screening, the cohorts varied in size, and studies used different definitions of hearing loss and different tests and thresholds.
CRs who did not provide published sources for reported data, mentioned sources like “clinical data”, “hospital records”, “local database” or “internal reports”. It is not possible to assess the quality of the reported data in these cases.
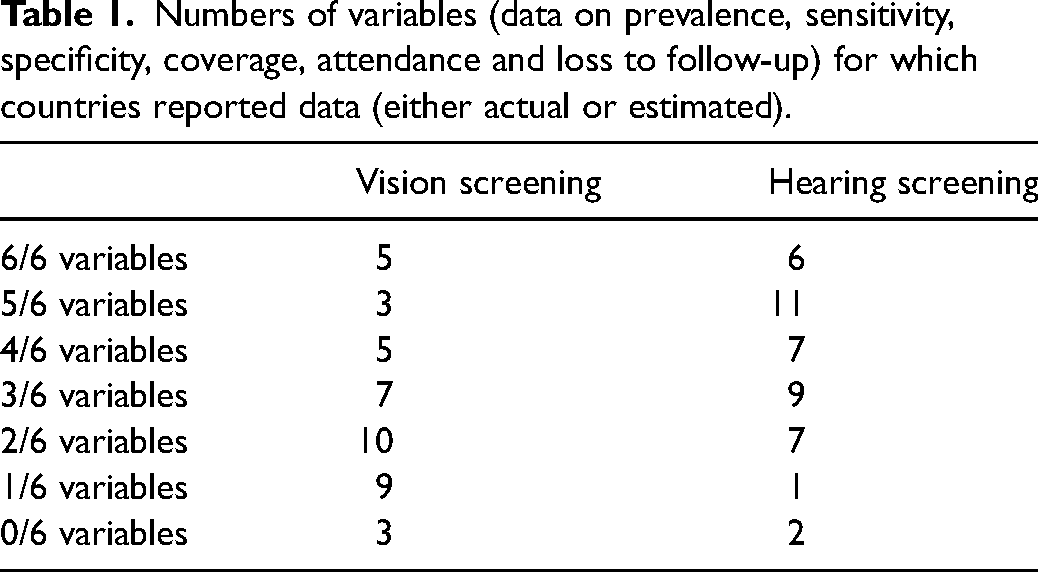
Only five countries for vision screening and six for hearing screening reported data, either actual or estimated, for all six variables: prevalence, sensitivity, specificity, coverage, attendance and loss to follow-up (Table 1). Twenty-nine countries for vision screening and nineteen for hearing screening reported data for three or fewer variables, either actual or estimated. For vision screening, the mode was two variables (10 out of 42 countries) and for hearing screening, the mode was five variables (11 out of 43 countries). Three countries reported no data at all for vision screening and two for hearing screening.
Numbers of variables (data on prevalence, sensitivity, specificity, coverage, attendance and loss to follow-up) for which countries reported data (either actual or estimated).
Few CRs, either for vision or hearing, reported data for sensitivity and specificity. Data on coverage were reported by 40% of vision CRs and 84% of hearing CRs, and data on loss to follow-up by 12% of vision CRs and 40% of hearing CRs.
Discussion
We found that data essential for cost-effectiveness analysis were insufficiently collected in paediatric vision and hearing screening programmes. Data were either recorded but not available, recorded incompletely or not recorded at all. When data were reported, these were often incomparable because of differences in definitions, tests and thresholds. Periodical, public reporting of the results of screening programmes was rare.
Data were collected more often in hearing screening programmes than in vision screening programmes. This may have to do with the fact that the prevalence of congenital hearing loss is much lower than that of amblyopia, and costs and benefits of treatment of hearing loss are much higher. Also, newborn hearing screening is most often performed shortly after birth in maternity hospitals, resulting in high coverage and relatively easy recording of screening data in hospital records.
We found that most data collection takes place at a local or regional level and rarely at a national level. This may be explained by the purposes of data collection. Data are often collected for quality assurance, for example to keep track of children lost to follow-up.15,16 Committees, guidelines and studies that advocate data collection, also do so for the purpose of quality assurance.3,17,18 Data may also be collected for the purpose of accountability to commissioners of screening programmes or other stakeholders. For these purposes, local or regional data collection suffices and for this purpose it is not necessary for the data to be publicly available. However, for comparison of cost-effectiveness of screening programmes across borders, data should be collected nationally, uniformly and digitally, and data should comprise all variables essential for cost-effectiveness analysis.
Lack of data collection in child vision screening programmes was already reported by Stewart-Brown et al. in 1988 19 and is also found in other forms of paediatric screening. A review of congenital heart disease screening reports in California found that over one-third of hospitals did not submit data – in spite of reporting being mandatory – and only 46% of reporting hospitals submitted data with matching numbers of completed screens and results. 20 A study of completeness and correctness of growth charts in Ghana found that more than two-thirds were not filled out completely and 26% were not filled out correctly. 21 A study of vaccination coverage measurement in 194 World Health Organisation member states found many inconsistencies in data quality, concerning completeness of reporting and implausible values. 22 A study on newborn screening for multiple disorders in 34 states in the United States found that only 56% of programmes collected data on long-term follow-up and only a minority of these did so digitally. 23 Data collection in paediatric screening in Germany was found to be insufficient to draw conclusions about the prevalence of target conditions or to properly evaluate the programme. 24
It is also important to include data collection in the planning of a screening programme from the outset, including the costs involved in data collection and ensuring that the necessary funding is available. For example, while progress has been made in data collection in newborn hearing screening in the United States, limited funding is a barrier for many states to fully implement an integrated digital data system that is accessible to providers. 25
Digital data collection in screening is efficient, minimises administrative workload and improves data quality.26,27 This is important, because significant reasons for poor data quality are staff competence issues and a perception of documentation as unnecessary,28–31 as well as a lack of a suitable data collection system.32,33
Newborn hearing screening in the Netherlands is monitored continuously and publishes comprehensive yearly reports on its results. This is facilitated by the fact that the entire documentation process in the programme is centralised and digital: results are uploaded straight from the screening devices to a national database, and results of diagnostic examinations and interventions are entered in this database as well.
The European Union called on member states to prioritise screening and follow-up for vision and hearing disorders in children. 34 Commissioners of screening programmes should require that programmes collect data on all variables necessary for cost-effectiveness analysis, and do so nationally, uniformly and digitally. This should be stimulated by overarching bodies such as the European Union, governments and international professional bodies.
Supplemental Material
sj-docx-1-msc-10.1177_09691413221126677 - Supplemental material for Availability of data for cost-effectiveness comparison of child vision and hearing screening programmes
Supplemental material, sj-docx-1-msc-10.1177_09691413221126677 for Availability of data for cost-effectiveness comparison of child vision and hearing screening programmes by Jan Kik, Eveline AM Heijnsdijk, Allison R Mackey, Gwen Carr, Anna M Horwood, Maria Fronius, Jill Carlton, Helen J Griffiths, Inger M Uhlén, Huibert Jan Simonsz and Country-Committees Joint-Partnership of the EUSCREEN Study Consortium in Journal of Medical Screening
Supplemental Material
sj-docx-2-msc-10.1177_09691413221126677 - Supplemental material for Availability of data for cost-effectiveness comparison of child vision and hearing screening programmes
Supplemental material, sj-docx-2-msc-10.1177_09691413221126677 for Availability of data for cost-effectiveness comparison of child vision and hearing screening programmes by Jan Kik, Eveline AM Heijnsdijk, Allison R Mackey, Gwen Carr, Anna M Horwood, Maria Fronius, Jill Carlton, Helen J Griffiths, Inger M Uhlén, Huibert Jan Simonsz and Country-Committees Joint-Partnership of the EUSCREEN Study Consortium in Journal of Medical Screening
Supplemental Material
sj-docx-3-msc-10.1177_09691413221126677 - Supplemental material for Availability of data for cost-effectiveness comparison of child vision and hearing screening programmes
Supplemental material, sj-docx-3-msc-10.1177_09691413221126677 for Availability of data for cost-effectiveness comparison of child vision and hearing screening programmes by Jan Kik, Eveline AM Heijnsdijk, Allison R Mackey, Gwen Carr, Anna M Horwood, Maria Fronius, Jill Carlton, Helen J Griffiths, Inger M Uhlén, Huibert Jan Simonsz and Country-Committees Joint-Partnership of the EUSCREEN Study Consortium in Journal of Medical Screening
Supplemental Material
sj-docx-4-msc-10.1177_09691413221126677 - Supplemental material for Availability of data for cost-effectiveness comparison of child vision and hearing screening programmes
Supplemental material, sj-docx-4-msc-10.1177_09691413221126677 for Availability of data for cost-effectiveness comparison of child vision and hearing screening programmes by Jan Kik, Eveline AM Heijnsdijk, Allison R Mackey, Gwen Carr, Anna M Horwood, Maria Fronius, Jill Carlton, Helen J Griffiths, Inger M Uhlén, Huibert Jan Simonsz and Country-Committees Joint-Partnership of the EUSCREEN Study Consortium in Journal of Medical Screening
Footnotes
Acknowledgements
The following Country Representatives, members of the Country-Committees Joint-Partnership of the EUSCREEN Study Consortium, contributed information from their national or regional screening programmes to both the EUSCREEN Questionnaire in 2017–2018 and the additional questionnaire in 2021.
Declaration of Conflicting Interests
The author(s) declared no potential conflicts of interest with respect to the research, authorship, and/or publication of this article.
Funding
The authors disclosed receipt of the following financial support for the research, authorship, and/or publication of this article: this work was supported by the European Union’s Horizon 2020 research and innovation programme [grant 733352].
Supplemental material
Supplemental material for this article is available online.
References
Supplementary Material
Please find the following supplemental material available below.
For Open Access articles published under a Creative Commons License, all supplemental material carries the same license as the article it is associated with.
For non-Open Access articles published, all supplemental material carries a non-exclusive license, and permission requests for re-use of supplemental material or any part of supplemental material shall be sent directly to the copyright owner as specified in the copyright notice associated with the article.