
Abstract
Objective
Like most of the United States, school-based hearing screening in Pennsylvania focuses on low-frequency, conductive hearing losses typical for young children, rather than the high-frequency, noise-induced hearing loss more prevalent among adolescents. The objective of this study was to compare the sensitivity and specificity of current school hearing screening in Pennsylvania with hearing screening including high frequencies, designed to detect adolescent hearing loss.
Setting
A single public high school.
Methods
In the Autumn of 2011 the high-frequency screen was delivered alongside the Pennsylvania school screen for students in the 11th grade. Screening referrals and a subset of passes returned for “gold standard” testing with audiology in a sound treated booth, in order to determine the sensitivity and specificity of the screening tests.
Results
Of 282 participants, five (2%) were referred on the Pennsylvania school screen, and 85 (30%) were referred on the high-frequency screen. Of the 48 who returned for gold standard testing with audiology, hearing loss was diagnosed in 9/48 (19%). Sensitivity of the Pennsylvania and high-frequency screens were 13% (95% confidence interval [CI] 0–53%) and 100% (95% CI 66–100%) respectively. Specificity of the Pennsylvania and high-frequency screens were 97% (95% CI 87–100%) and 49% (95% CI 32–65%) respectively.
Conclusions
Current school hearing screens have low sensitivity for detection of adolescent hearing loss. Modifying school-based protocols may be warranted to best screen adolescents, and make optimal use of school nurse time and effort.
Introduction
Screening at the lower, speech-related frequencies has traditionally been the focus of school-based hearing screening, because of the association of middle ear disease and low-frequency hearing loss (LFHL).1,2 Screening in Pennsylvania (PA) is conducted in kindergarten, first to third, seventh and eleventh grades. 3 The recommended protocol screens each ear at 250, 500, 1000, 2000 and 4000 Hertz (Hz) at 25 decibels hearing level (dB HL). 3 Referrals on the initial screening test are retested within one month, with a pure tone threshold hearing test. Referrals on repeat testing are recommended for additional evaluation. 3 The protocol is the same for young children and adolescents, despite the difference in hearing risks and types of hearing loss between these age groups, specifically otitis media and LFHL for younger children, and hazardous noise exposures and high-frequency hearing loss (HFHL; occurring at >3000 Hz) for adolescents.4,5
PA is similar to the majority of states in using a hearing screening protocol which does not detect HFHL.1,2 However, data from the National Health and Nutrition Examination Survey (NHANES) 2005–2006 demonstrates that 1 in 5 adolescents age 12–19 has hearing loss. 5 The majority of this loss is HFHL. 5 Early detection, in combination with behavioural changes, may help to prevent the progression of adolescent high-frequency noise-induced hearing loss (NIHL), by identification and avoidance of hazardous noise exposures.6–8
There is a lack of evidence on the sensitivity and specificity of traditional hearing screens to detect adolescent hearing loss. The study objective was to compare the sensitivity of PA’s school pure tone hearing screen (PA screen), with a pure tone threshold screening test, including high-frequency test points (high-frequency screen) for detection of adolescent hearing loss. Both tests were compared with a “gold-standard” evaluation by an audiologist, including pure tone threshold testing in a sound treated booth. Our hypothesis was that the PA screen is poorly designed to screen adolescents for hearing loss, specifically HFHL. As many state school and office-based hearing screens are designed similarly to the PA screen1,2, these findings may inform adolescent hearing screening on a national level.
Methods
Participants and Study Design
The PA screen is administered annually to all 11th grade students at Hershey High School (Hershey, PA), as mandated by the PA Department of Health (DOH). 3 Parents/guardians of students entering the 11th grade at this public school received a letter in August 2011 regarding the project. The letter described the high-frequency screen, which would be administered in addition to the traditional PA screen. Parents had the option to decline participation. This study was approved by the Penn State College of Medicine’s Human Subjects Protection Office, with a waiver of informed consent, and by the Hershey High School principal.
The PA screen and the high-frequency screen were conducted in September-October 2011 over 4 days (5th day for make-up testing), using Maico MA27 audiometers with a standard TDH-39 headphone assembly, last calibrated on 5/10/11 to meet American National Standards Institute (ANSI) S3.6-2010 for level and linearity. 9 Students were provided with passes at 10 minute intervals to come to a school conference room for testing. The room is too noisy if the tester cannot hear the frequencies 250, 500, 1000, 2000, 4000 and 8000 Hz at 25 dB HL in one ear with both earphones on (a tester with hearing loss should query another normal hearing adult). 3 No specifications are given regarding maximum ambient noise levels. Students were not excluded for current middle ear problems or upper respiratory symptoms, as this is not a school-based exclusion. 3 A note was made if participants wore hearing aids.
On the hearing screening days, two school nurses performed the PA screen, and two research nurses, trained by a certified audiologist, conducted the high-frequency screen, working in parallel. Students were randomized to start with the PA screen or the high-frequency screen, to minimize the effects of fatigue on test results. Nurses conducting one screen were blinded to the student results on the other screen.
The PA screen determines the ability to hear 25 dB HL pulsed pure tones at 250, 500, 1000, 2000 and 4000 Hz. 3 Testing followed the PA DOH hearing screening procedure. The 1000 Hz tone was initially presented at 55 dB HL, decreased to 40 dB HL, and finally to 25 dB HL. Following a positive response to these three tones, only 25 dB HL pulsed pure tones were presented, once at each tested frequency. 3 If there was no response to the initial three tones, the participant was referred on the test at this frequency. 3 The high-frequency screen utilized threshold testing at 250, 500, 1000, 2000, 3000, 4000, 6000 and 8000 Hz also using pulsed pure tones. Threshold testing identified the lowest intensity at which the participant could positively respond to a tone in 2 out of 3 trials.10,11 Testing began at 1000 Hz and 30 dB HL. Steps of 10 dB HL were used, until the tone was no longer heard, and then 5 dB HL increasing increments were used, to establish the threshold level. This identified the hearing “threshold”, which was marked on the audiogram at each tested frequency. 3 Depending on the day of the week, study nurses alternated the ear in which testing was performed first, to prevent an order effect.
Pass/Fail Criteria for the Screening Tests
Comparison of Pennsylvania’s school hearing screen (PA Screen) with pure tone threshold screen including high-frequencies (high-frequency screen) referral criteria.
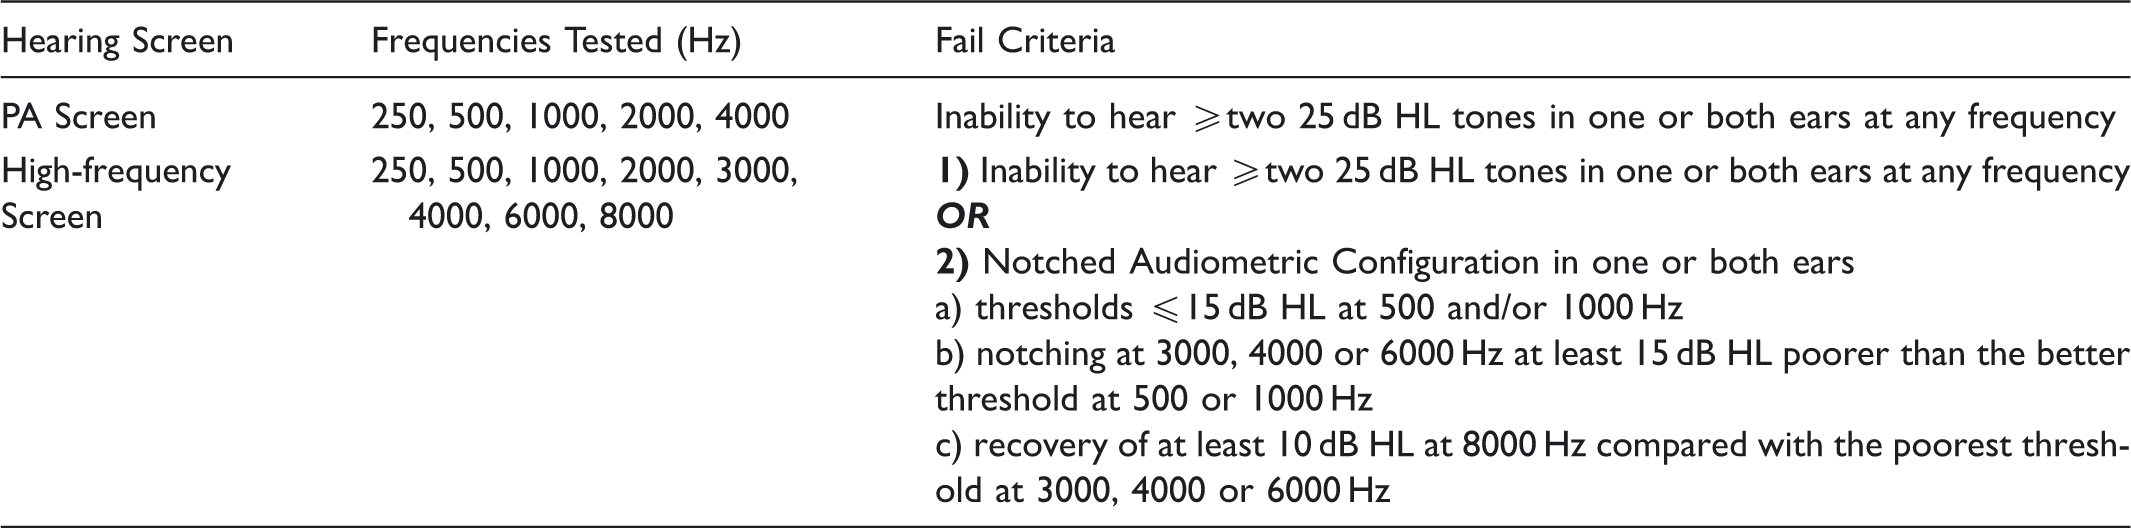
Similar to the PA screen, students referred on the high-frequency screen for inability to hear two or more 25 dB HL tones in one or both ears at any frequency. The high-frequency screen was also reviewed applying criteria for a notched audiometric configuration, as described by Niskar, et al. 2001.10,11 Notched audiometric configurations indicate high-frequency NIHL when paired with a history of hazardous noise exposure.
10
However, because testing was done in the school setting, and ambient noise specifically affects test performance at lower frequencies (500 and 1000 Hz), the Niskar noise-notch definition was modified as per Meinke et al, which allowed for thresholds equal to or better than 15 dB HL at 500 and/
Gold standard testing – sound treated booth
All students referring on the PA screen and/or the high-frequency screen were invited to return for a comprehensive audiologic evaluation, free of charge, at the Penn State Milton S. Hershey Medical Center. This “gold standard” evaluation was done in a sound treated booth. Parents were informed of this option via a mailed letter, which allowed them to decline further study contact by returning a prestamped/preaddressed card. Referrals who did not return the card within two weeks were contacted by phone. Three attempts were made to schedule follow-up. To calculate the sensitivity and specificity of the screening tests, a subset of passes also needed to return for gold standard testing. Passes were randomly selected and contacted via telephone for follow-up testing until 19 participants had completed gold standard testing. This number was deemed sufficient based on a prior power calculation. Four weekend dates were offered, with weekdays available for those who preferred that option. A maximum of 5 months may have passed between initial screening, done in September 2011, and the last gold standard test date offered, in February 2012. Participants returning for gold standard testing were given a $25 gift card.
All audiometers used in the sound treated booth testing were calibrated according to ANSI S3.6 2010 on 16 September 2011. 9 Biologic calibration was performed prior to the start of each test day. All tests were performed in sound booth suites, which met ANSI S3.6 2010 standards. 9
The audiologist performed otoscopy prior to the start of testing. Tympanometry (226) Hz was performed. Distortion product otoacoustic emissions were tested from 750–8000 Hz. Speech reception thresholds were performed using monitored-live voice. Word recognition testing was performed at +40 dB SL, using NU-6 recorded word lists. These tests were performed for completeness of the audiology examination, but the reported results focus on the pure tone testing, done in the sound treated booth, as compared with the screening test results.
For pure tone threshold testing, subjects were instructed to raise their hand when they heard the tone, even if it was very soft. Pure tone testing, using pulsed stimuli, was performed from 250 Hz– 8000 Hz, including inter-octaves of 3000 Hz and 6000 Hz, with EAR3A insert phones. Thresholds were determined using the Hughson-Westlake technique, and recorded in accordance with ASHA standards (minimum of three responses at a single level). 13 Masking was applied for the following:
Air conduction threshold of the test ear and the air conduction threshold of the non-test ear differ by the interaural attenuation for the frequency. Air conduction threshold of the test ear and the bone-conduction threshold of the non-test ear differ by the interaural attenuation. Air conduction threshold of the test ear and the bone conduction threshold of that same ear differ by more than 10 dB HL. Speech masking used for interaural attention difference of 45 dB HL referencing the bone conduction of the non-test ear.
Statistical Analysis
Based on our previous work, we assumed a 26% referral rate on the high-frequency screen. 11 Therefore, of 290 students undergoing initial screening, approximately 75 referrals were anticipated. Sample size calculations for the retest population were performed, based on a desired level of precision for a 95% CI of ±0.10 around an estimate of sensitivity. A total sample size of n = 93 was the anticipated goal. This goal assumed that a large percentage of screen failures would return for gold standard testing (i.e. 75 referrals + 18 passes).
Sensitivity and specificity of the screening tests were estimated by constructing standard 2x2 tables. Exact binomial 95% confidence limits were calculated for each estimate. The estimates of sensitivity were compared between the two screening methods, using McNemar’s test for paired responses among those deemed referrals according to the gold standard testing. Similarly, the estimates of specificity were compared between the two screening methods, using McNemar’s test among those who passed the gold standard testing. The Chi-square and Cochran-Mantel-Haenszel tests were used to evaluate bivariate associations between test results and basic demographic variables.
Results
Descriptive statistics of study participants comparing the group rescreened with those who did not return for rescreen.
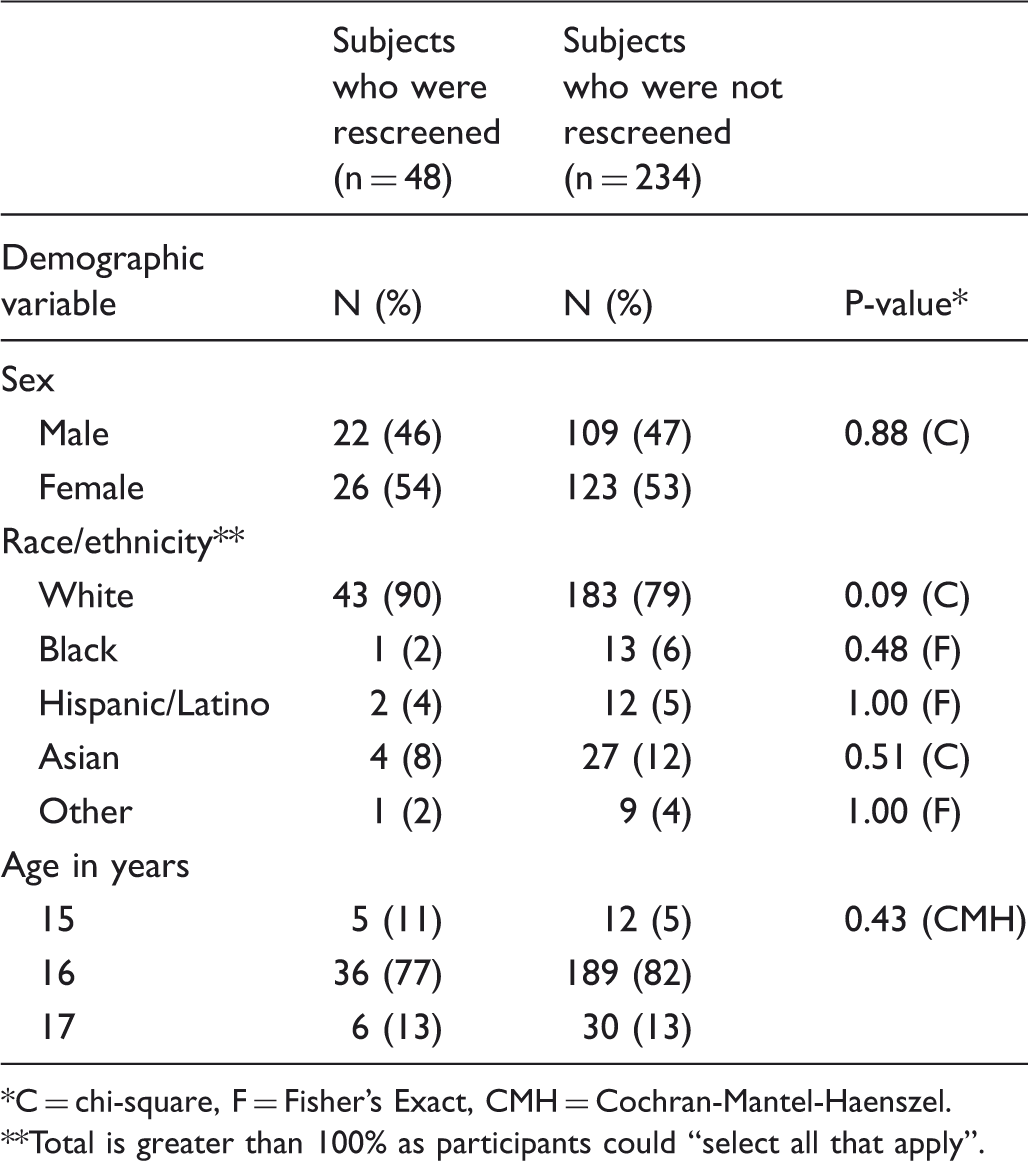
C = chi-square, F = Fisher’s Exact, CMH = Cochran-Mantel-Haenszel. **Total is greater than 100% as participants could “select all that apply”.
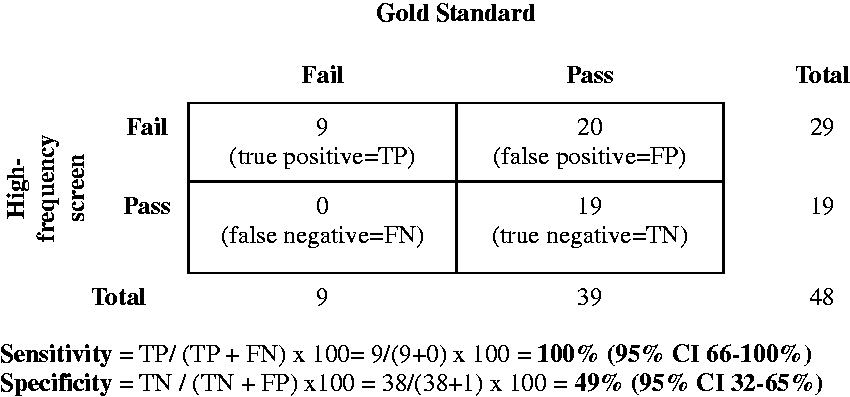
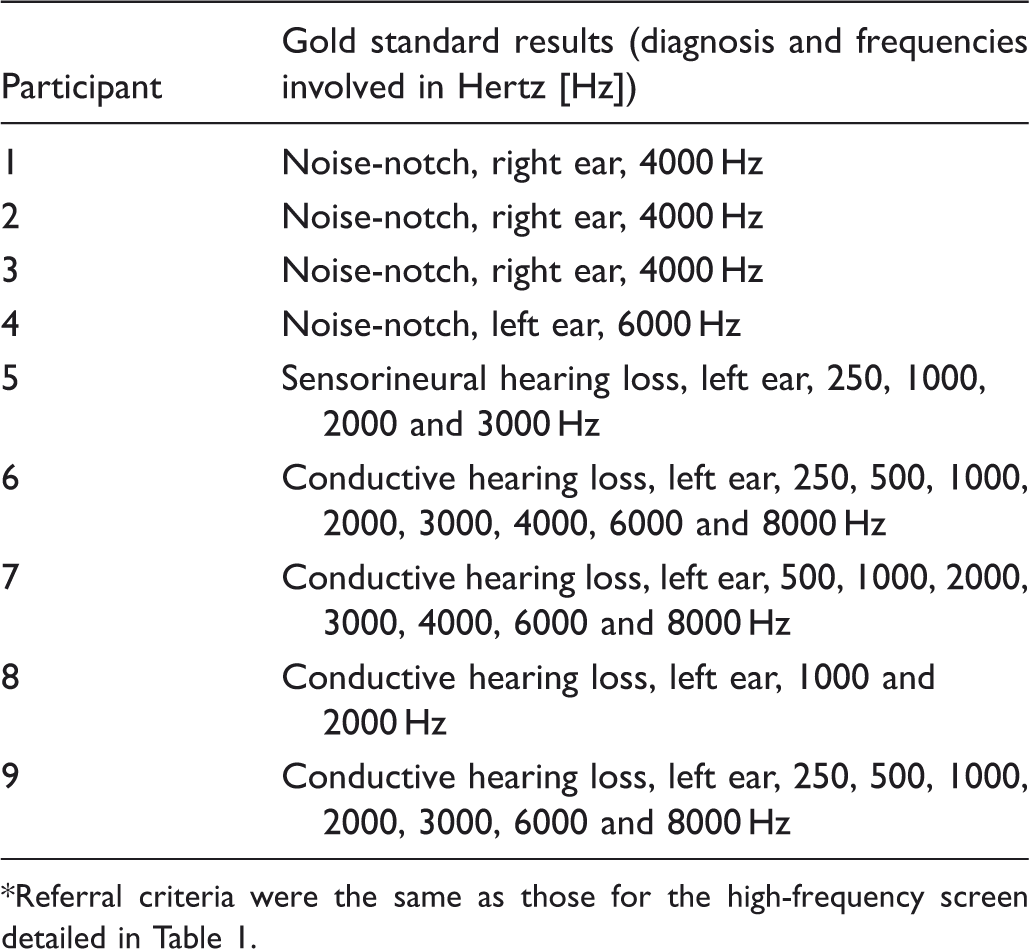
Sensitivity of the PA screen was l3% (95% CI 0–53%), while the sensitivity of the high-frequency screen was 100% (95% CI 66–100%, McNemar p-value 0.008; Figures 1 and 2). Specificity of the PA screen and the high-frequency screen were 97% (95% CI 87-100%) and 49% (95% CI 32–65%) respectively (McNemar p-value = <0.001; Figures 1 and 2). Of the nine students diagnosed with hearing loss via gold standard testing, four were diagnosed with HFHL and noise notches, and four were diagnosed with conductive hearing losses. One student was diagnosed with a sensorineural hearing loss. Only one initially referred on the PA screen (Table 3).
Sensitivity and specificity of Pennsylvania’s school hearing screen (PA Screen) compared with gold standard testing in a sound treated booth. *Participant 4 (Table 3) had a hearing loss at a frequency not included in the PA screen. This individual was not included in the PA screen sensitivity and specificity calculations. Sensitivity and specificity of pure tone threshold screen including high-frequencies (high-frequency screen) compared with gold standard testing in a sound treated booth. Audiologic information on the nine participants diagnosed with hearing loss by gold standard testing in a sound treated booth*. Referral criteria were the same as those for the high-frequency screen detailed in Table 1.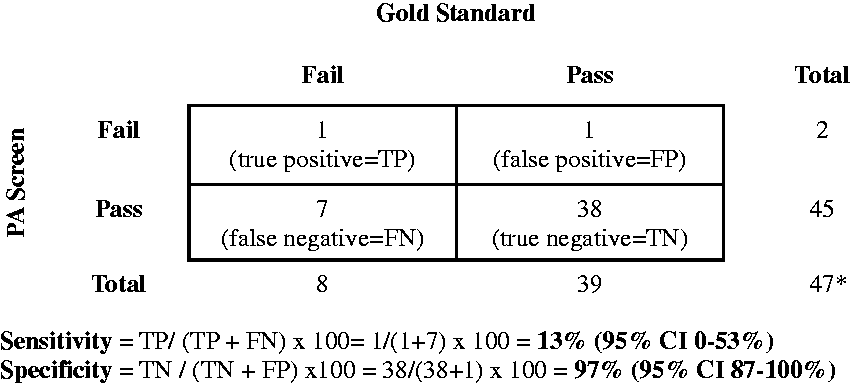
The positive predictive value (PPV) of the PA screen was 50% (95% CI 1–99%), while the PPV of the high-frequency screen was 31% (95% CI 15–51%). The negative predictive value (NPV) of the PA screen was 84% (95% CI 71–94%), while the NPV of the high-frequency screen was 100% (95% CI 82–100%).
Discussion
The results of this pilot study suggest that current school-based hearing screens have low sensitivity for detection of adolescent hearing loss, and are therefore unsuitable as screening tests. Meinke and Dice demonstrated that school hearing screening protocols, even those incorporating high-frequencies, miss a majority of students with noise notches. 12 Simply adding high-frequency test points to current protocols without threshold testing is unlikely to be effective.
The use of threshold testing, in particular, may allow for a more in-depth hearing evaluation. As participants had to respond in two out of three trials, they may have been less successful at “guessing”, or falling into a pattern of hand raising to indicate an audible tone, than with the PA screen. Threshold testing, combined with the high-frequency test points and additional referral criteria (“noise-notch”), is likely to have improved the sensitivity of the high-frequency screen, compared with the PA screen.
It may be argued that, if adolescents are asymptomatic, their hearing loss is unlikely to be clinically significant. However, self-report of hearing loss by parents and adolescents is known to be inaccurate, different from studies on older adults examining self-report of hearing symptoms.14,15 When screening is performed, professionals encourage asymptomatic individuals to be tested, on the understanding that they will benefit.16–19 High-frequency NIHL will not be noticed until it progresses to affect speech and communication. 12 Progression of high-frequency NIHL is preventable.6–8 The current test misses the opportunity to identify a progressive, yet preventable, source of morbidity.
To avoid missing cases, the sensitivity of a screening test should be high; the high-frequency screen fulfills this criteria. However, to maximize sensitivity, the trade-off is often a loss of specificity. 17 The high-frequency screen had 100% sensitivity, with a specificity of 49%. One simple way to improve the specificity of the high-frequency screen is serial administration of the screening test. 18 Only those with a positive test result (referral) would repeat the high-frequency screen. Two “fails” would prompt a referral for additional follow-up.
Though a higher sensitivity hearing screen will yield more false positive results, many of the pieces to implement a revised adolescent hearing screen are already in place. States with mandatory school hearing screening will have audiometers and staff trained in operating this equipment. PA school nurses are to conduct threshold testing after an initial hearing screen referral, and therefore should be familiar with this procedure. 3 Audiometric technician certification programmes are also available, and completion of this coursework by school hearing screening personnel could not only improve test quality and validity, but also better inform interactions with parents and students on the value of hearing screening. 20
Our previous work demonstrated that threshold testing takes about 5 minutes, compared with 2 minutes for the PA screen. 11 Threshold testing was demonstrated to be a viable option with high school students. 20 Though 5 minutes is not an excessive amount of time for the high-frequency screen, it is twice as long as the PA screen. To address this, one option may be to remove some of the low-frequency test points for adolescent hearing screening. Sharing the task of hearing screening with primary care providers may also ameliorate the time constraints.
Limitations
Only 48 of the 93 adolescents anticipated by the power calculation returned for rescreening. Some reasons for this may have been the lack of education on adolescent hearing loss, parental belief that their adolescent was at low risk for hearing loss, or concerns about the implications of a hearing disorder. Statistically, the small number of adolescents presenting for gold standard testing resulted in wider confidence intervals around the estimates of sensitivity and specificity.
The time lapse between the initial screen and gold standard testing may have affected the results, as some causes of hearing loss (middle ear effusions, temporary threshold shifts) resolve with time. The school testing environment made immediate follow-up with gold standard testing a challenge. Use of a mobile sound treated booth may be one way to approach this concern. 20
Despite appropriately following the PA screen guidelines, the lack of daily calibration of the school audiometers and failure to take ambient noise measures is a weakness of this study. 3 However, the study intent was to work within the school testing environment, so calculations of sensitivity and specificity would be based on real-life conditions. The high-frequency screen demonstrated 100% sensitivity, despite these limitations, suggesting it is possible to construct a high-quality screening test in the school setting. Additionally, the use of TDH-39 headphones and a calibration error at 6000 Hz has been previously documented.21,22 The current findings are supported, as hearing loss was confirmed during gold standard testing with the majority of noise notches at 4000 Hz.
Finally, research nurses were trained by a certified audiologist for the high-frequency screen. They did not pass certified technician training, but threshold testing is already part of the follow-up testing in the PA hearing screening guidelines. 3 The high-frequency screen is not a big step from this. Research nurses performing the high-frequency screen were blind to PA screen results, but expectation bias must be considered, as they were aware of the study design and purpose.
Conclusions
The results of this pilot study suggest that PA’s school hearing screen, which demonstrates only 13% sensitivity for detection of adolescent hearing loss, is an unsuitable screening tool. Modifying school-based protocols may be warranted, in order to best screen adolescents, and to make optimal use of school nurse time and effort.
Footnotes
Acknowledgements
We thank Tara Blackburn, MEd, BSE, RN, school nurse, Michael Murphy, principal at Hershey High School, and Jorge Gonzalez, PhD, CCC-A for their valuable assistance with this study.
We also thank the Milton S. Hershey Medical Center Audiologists who gave their time free of charge in the interest of making a meaningful contribution to the health of children.