
Abstract
Objective
There is a rising prevalence of hearing loss among adolescents in the United States. Current paediatric preventive care recommendations by the Bright Futures guidelines and the American Academy of Pediatrics suggest that clinicians should ask adolescents ten hearing screening questions to identify those who are at high risk of hearing loss for further objective hearing testing. We assessed the utility of these subjective risk assessment questions to distinguish those adolescents with objectively documented hearing loss.
Setting
A single public high school in Pennsylvania.
Methods
We compared results from a prospective study evaluating objective hearing assessments with the use of the ten Bright Futures hearing screening questions plus additional adolescent-specific questions to predict adolescent hearing loss.
Results
In relation to the questions used in this study, adolescents who were referred following objective hearing screens were more likely to report “trouble following the conversation when two or more people are talking at the same time” and a “past experience of slight hearing loss”. Referrals from sound treated booth testing were more likely to report “trouble hearing over the phone” and have a diagnosis or history of hearing loss.
Conclusions
Most Bright Futures questions were not associated with adolescent hearing loss. An objective adolescent hearing screen should be considered in the recommended schedule of preventive care, instead of the current risk-based subjective assessment.
Data from the 2010 National Health and Nutrition Examination Survey (NHANES) demonstrate that one in five adolescents has hearing loss, and that the prevalence is rising. 1 The reasons for this rise are not known, but the increase in adolescent high-frequency hearing loss (HFHL) may be related to evolving hazardous noise exposures, such as increased use of personal listening devices. 1
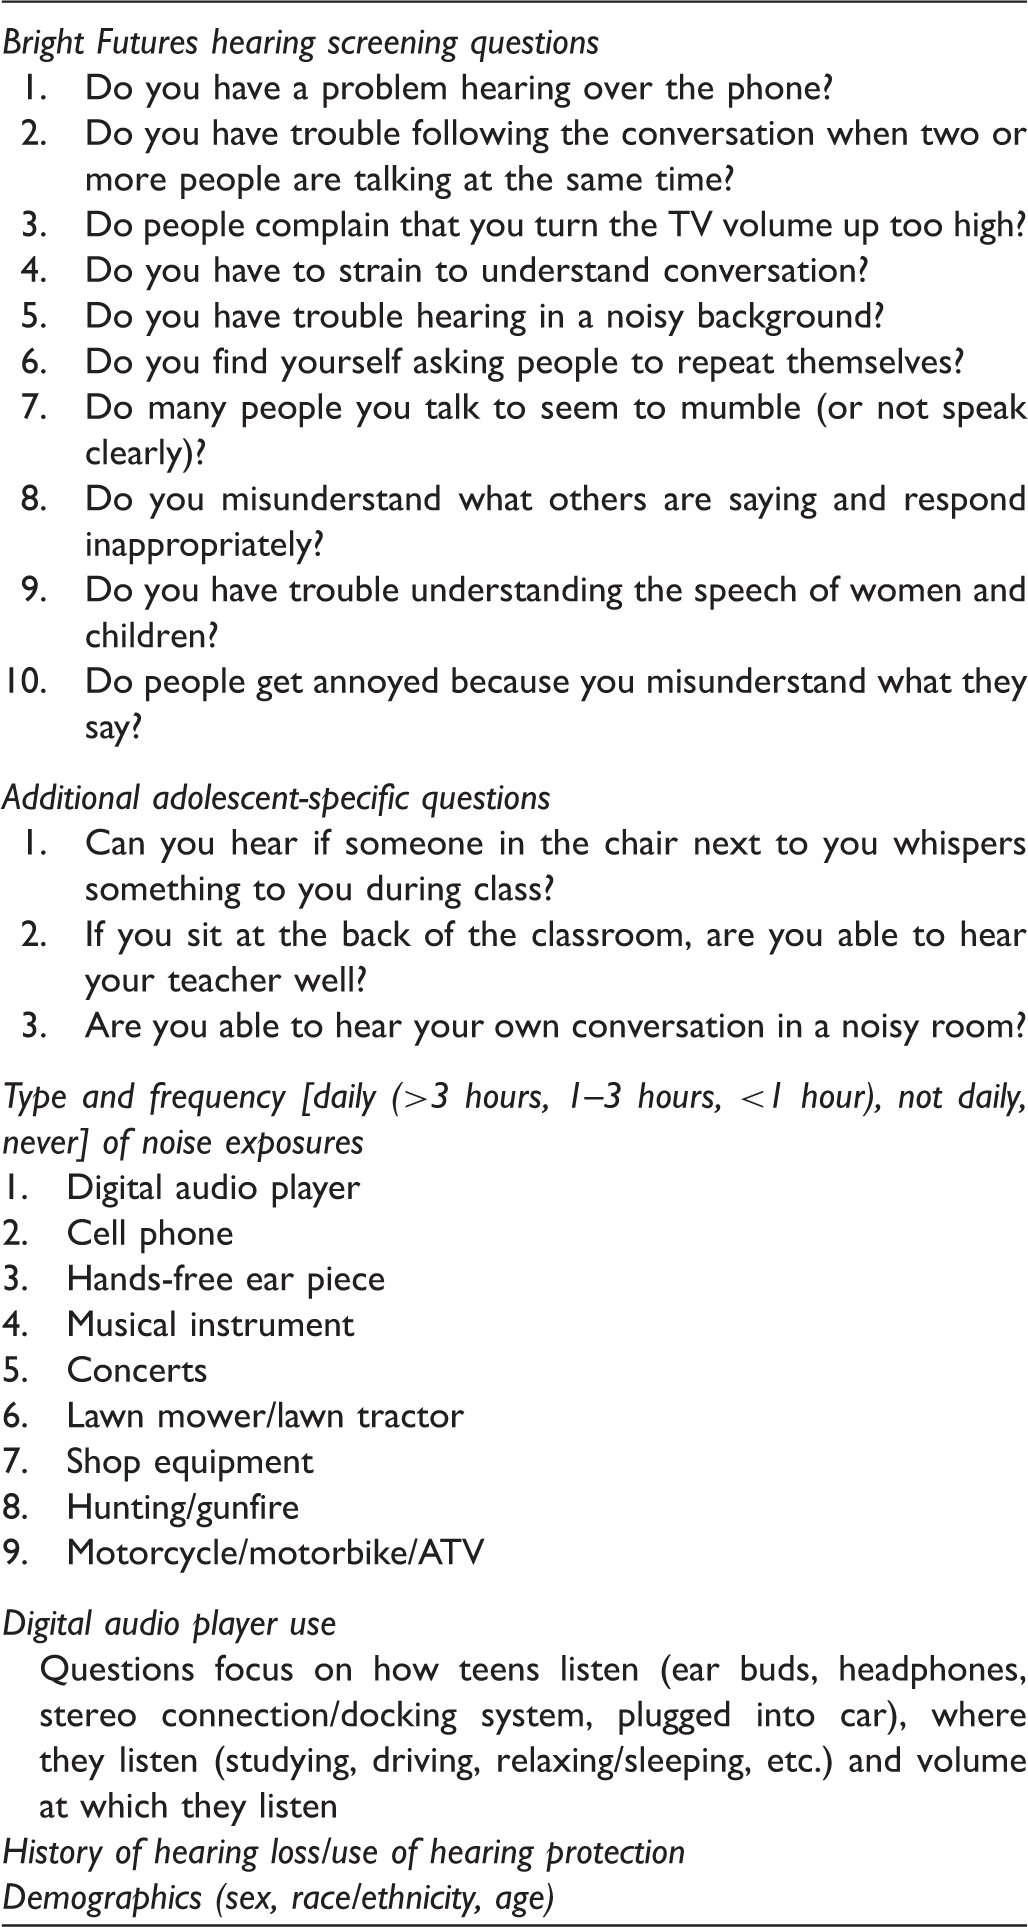
Summary of survey components.
The utility of the ten current recommended Bright Futures hearing screening questions for identifying adolescents at risk for hearing loss was evaluated as part of a study examining a school-based hearing screening protocol including the high-frequency range. 6 Because the questions have not been validated with teenagers, our hypothesis was that the Bright Futures questions would demonstrate poor association with objective measures of adolescent hearing loss.
Methods
Participants
Pennsylvania (PA) public schools conduct a pure tone hearing screen (PA screen) annually for all 11th grade students as mandated by the PA Department of Health. 7 In 2011 students at Hershey High School, PA participated in a pilot study on detecting adolescent high-frequency noise-induced hearing loss. 6 Participants underwent a pure tone threshold screening test including high-frequency test points (high-frequency screen), and completed a survey that included the Bright Futures hearing screening questions along with questions assessing other potential risk factors for adolescent hearing loss. 6 Hearing screening test referrals and a subset of passes were invited to return for gold standard testing in a sound treated booth to determine the sensitivity and specificity of the PA screen and the high-frequency screen as well as the utility of the Bright Futures hearing screening questions to select adolescents with hearing loss.
Letters sent to parents/guardians of all students entering the 11th grade at the school in August 2011 described the study protocol, high-frequency screen, and the survey. Parents were given the option to decline participation for their children. The study was approved by Penn State College of Medicine’s Human Subjects Protection Office and by the principal of Hershey High School.
PA screen protocol
The PA screen determines the ability to hear 25 decibels Hearing Level (dB HL) pulsed pure tones at 250, 500, 1000, 2000 and 4000 Hertz (Hz). 7 Testing followed the PA Department of Health hearing screening procedure. Results were recorded as “pass” or “refer”. Students were referred on the PA screen for inability to hear two or more 25 dB HL tones in one or both ears at any frequency. 7
High-frequency screen protocol
The high-frequency screen utilized threshold testing at 250, 500, 1000, 2000, 3000, 4000, 6000 and 8000 Hz, also using pulsed pure tones. Threshold testing identified the lowest intensity at which the participant could positively respond to a tone in 2 out of 3 trials.8,9 As with the PA screen, students were referred on the high-frequency screen for inability to hear two or more 25 dB HL tones in one or both ears at any frequency. The high-frequency screen was also reviewed applying criteria for a notched audiometric configuration, as described by Niskar, et al.8,9 Notched audiometric configurations indicate high-frequency noise induced hearing loss when paired with a history of hazardous noise exposure. 9 However, because testing was performed in the school setting, and ambient noise specifically affects test performance at lower frequencies (500 and 1000 Hz), the Niskar noise-notch definition was modified as per Meinke et al, as follows: 1) thresholds equal to or better than 15 dB HL at 500 and/or 1000 Hz, 2) notching at 3000, 4000 or 6000 Hz at least 15 dB HL poorer than the better threshold at 500 or 1000 Hz, 3) recovery of at least 10 dB HL at 8000 Hz compared with the poorest threshold at 3000, 4000 or 6000 Hz. 10 High-frequency screen results were reviewed by two certified audiologists, using the above criteria. If their assessments did not concur, a third certified audiologist served as a ‘‘tiebreaker’’.
Sound treated booth protocol
Pure tone threshold testing was conducted in a sound treated booth using pulsed stimuli from 250 Hz to 8000 Hz, including inter-octaves of 3000 Hz and 6000 Hz. 6 Thresholds were determined using the Hughson-Westlake technique, and recorded in accordance with American Speech-Language-Hearing Association standards. 11 Criteria to apply masking were clearly outlined. 6
Survey
The survey instrument was assembled with the assistance of the Pennsylvania State Center for Survey Research. It included the Bright Futures hearing screening questions,2–5 with the addition of questions specifically focused on situations applicable to teenagers. Typical adolescent noise exposures were queried. A history of hearing problems or hearing loss and basic demographic information was also obtained (Table 1).
The survey underwent two rounds of pilot testing (round one, 13 participants; round two 10 participants) among adolescents recruited from the Penn State Hershey general pediatrics clinic and a youth group fundraiser. All had consented to take the survey. In addition to completing the survey, participants were asked a series of probes to gauge their responses to certain questions. The research nurses administering the pilot testing also asked for feedback as the participants completed the survey. All participants in the survey pilot testing received a $25 gift card. Questions were reworded or answer choices expanded for clarity based on pilot test comments.
The final survey was converted to a scannable document in which participants could “bubble in” their responses. High school students were anticipated to be familiar with this method of answering questions, based on participation in standardized testing.
Audiologic tests
Hearing screening tests (PA screen and high-frequency screen) and surveys were administered in September-October 2011 over four days (fifth day for make-up testing). Students failing either of the hearing screens were invited to return for “gold standard”, comprehensive audiologic testing in a sound treated booth at the Penn State Milton S. Hershey Medical Center, free of charge. 6 To account for false negative screening results, a subset of passes also returned for testing in the sound treated booth. Participants who returned for testing were given a $25 gift card.
Letters were mailed to parents of all participants indicating the results of the PA screen and the high-frequency screen, and the need for follow-up testing of referrals with the primary care provider. Those who returned for sound treated booth testing with their parents discussed their results, and any additional follow-up needs, with the audiologist. A copy of the test results was sent to the participant’s primary care provider.
Our previous research found that the sensitivity and specificity of the high-frequency screen for detection of adolescent hearing loss was 100% (95% confidence interval [CI] 66-100%) and 49% (95% CI 32-65%), respectively, when compared with gold standard testing in a sound treated booth. 6 We therefore compared survey items between passes and fails for both the high-frequency screen and testing in the sound treated booth, with the assumption that a survey item which was a strong predictor of hearing loss would be significantly associated with failing both tests. Survey items were not compared with PA screen results due to the small number of failures and our previous report of its low sensitivity as a screening test. 6
Statistical Analysis
Sample size calculations were performed for the primary hypothesis of the original study, which involved the precision around the estimate of sensitivity of the high-frequency screen. The analysis reported here is focused on the association between the survey questions and the objective hearing test results. Descriptive statistics were calculated for all participants. Students were categorized as pass or fail for the high-frequency screen and sound treated booth testing. The Chi-square, Cochran-Mantel-Haenszel, and Fisher’s exact tests were used to compare the proportion of participants responding positively to the Bright Futures hearing screening questions, additional adolescent specific questions, and risk factors raised in the survey between those who passed and failed the objective hearing tests. Odds ratios and 95% CIs were estimated based on frequency table analysis methods presented by Stokes et al. 12 A significance level of 0.05 was used to determine statistical significance, therefore setting the threshold for false-positive results at 5%. Evaluating the association between each of the survey questions and both forms of objective testing (high-frequency screen and sound treated booth) resulted in performing 94 tests on 47 total variables. All statistical measures were calculated using SAS version 9.2 (Cary, NC).
Results
Demographics
Descriptive statistics of study participants.
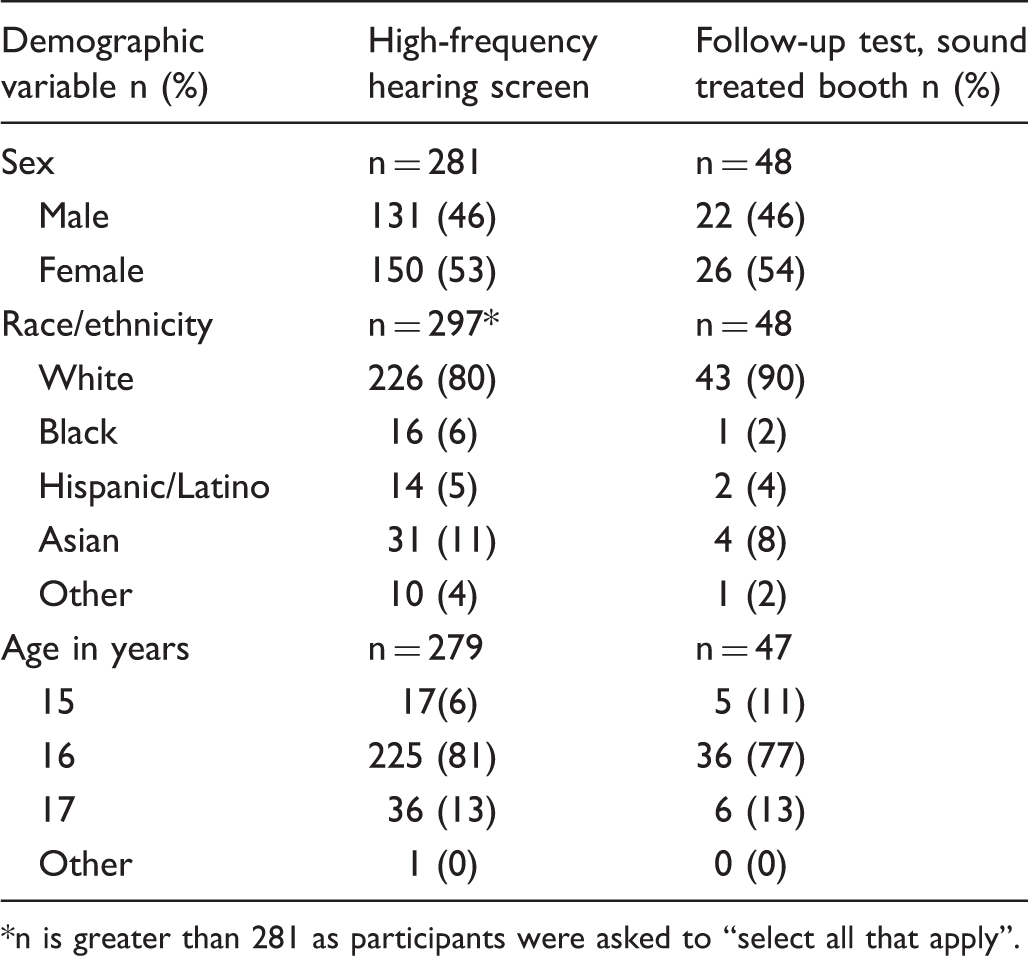
n is greater than 281 as participants were asked to “select all that apply”.
Bright Futures questions and failure of the high-frequency screen
Association of a positive response to the individual Bright Futures hearing screening questions and high-frequency screen results.
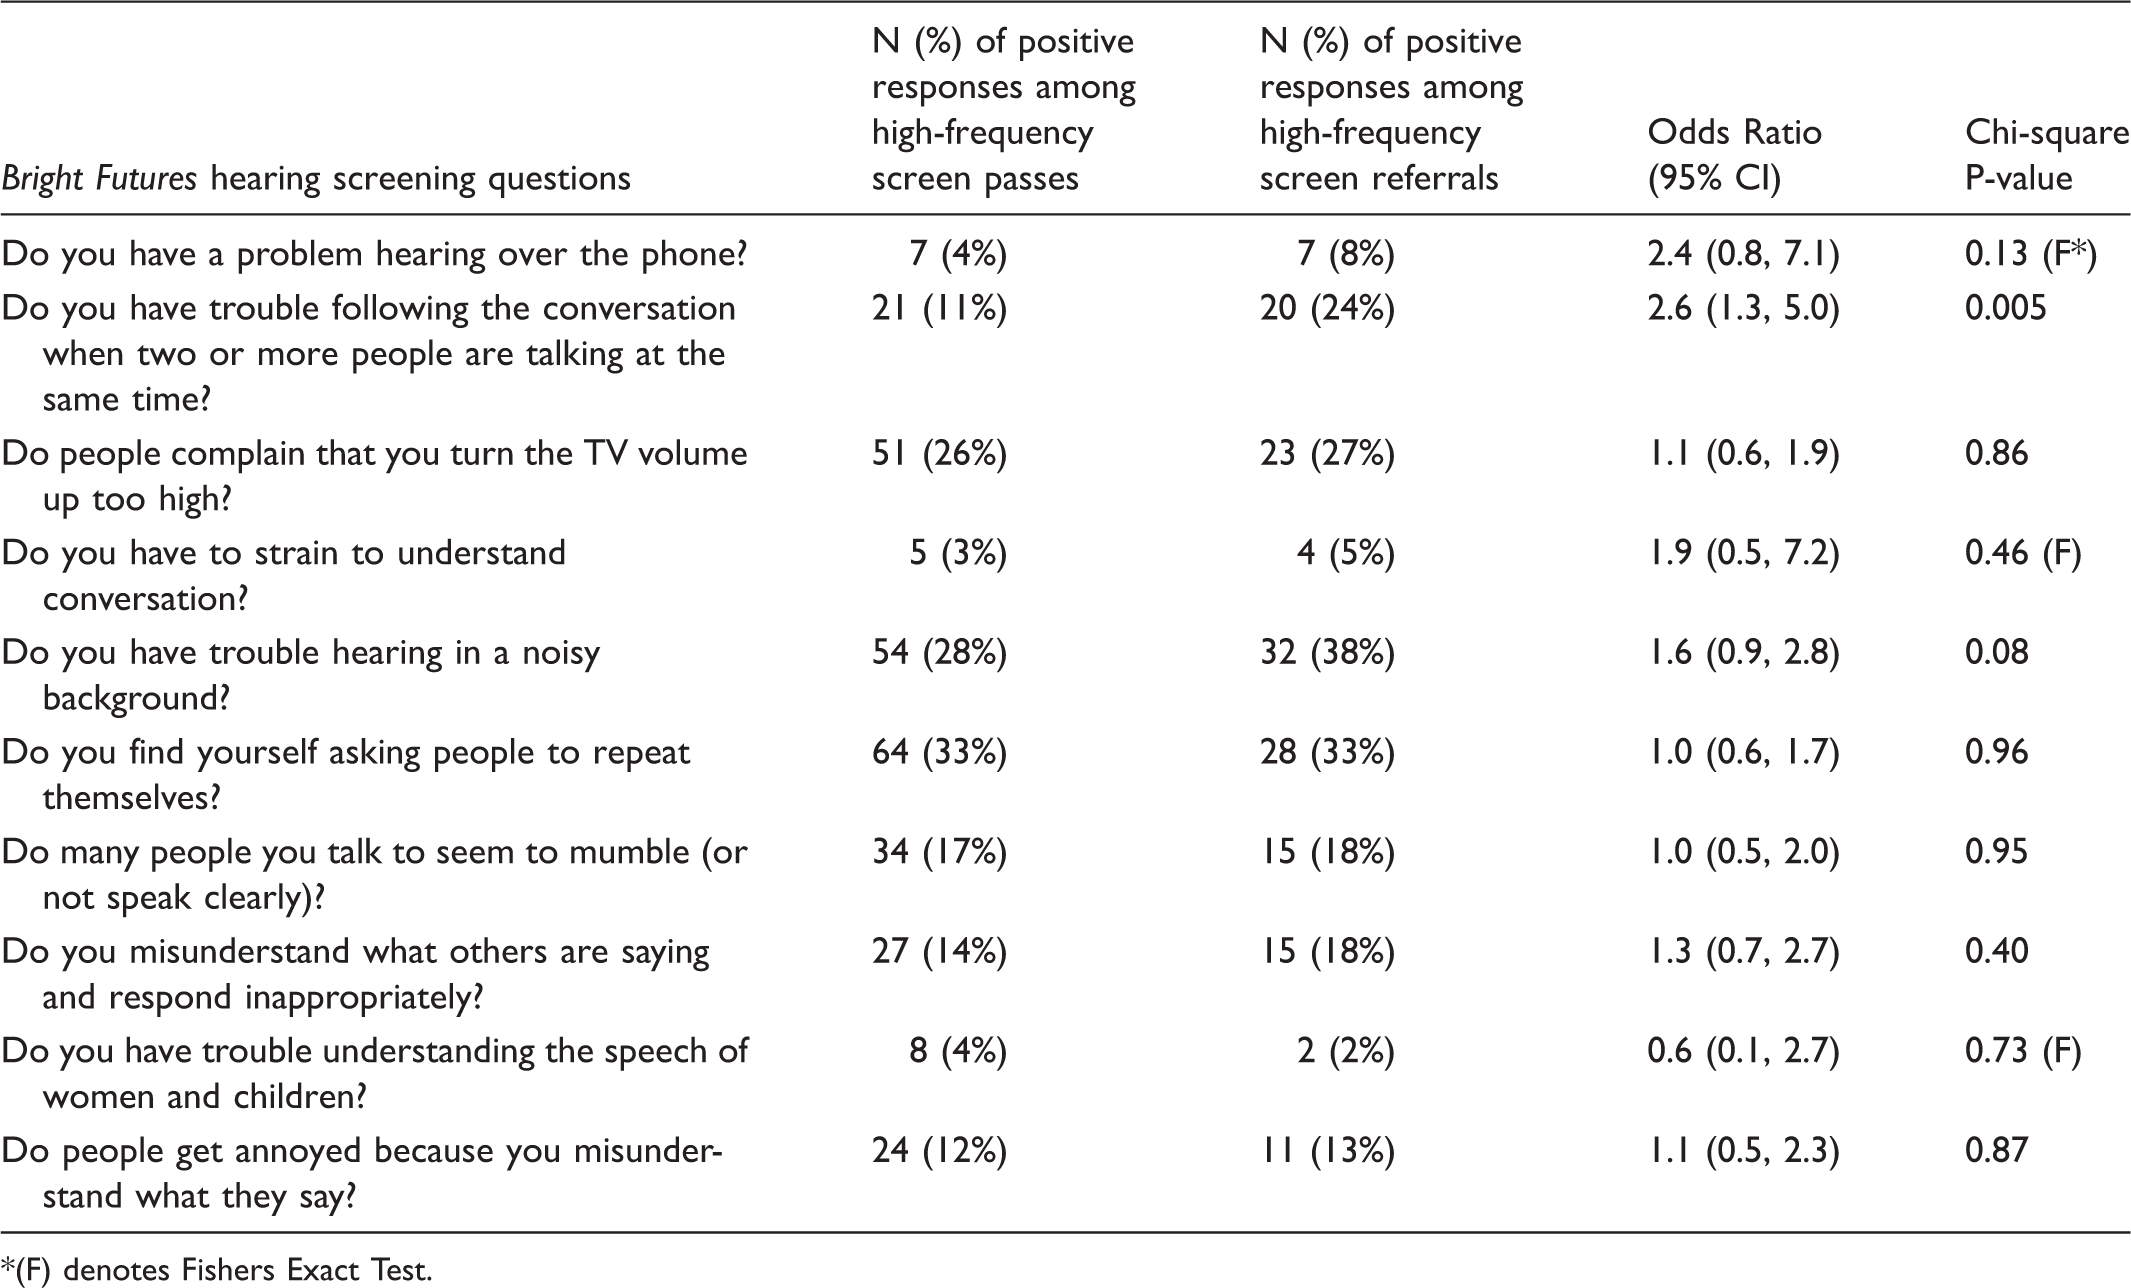
(F) denotes Fishers Exact Test.
There were 70 participants (25%) with a positive response to three or more of the Bright Futures questions. Of these 70 participants, 24 were referred on the high-frequency screen (Figure 1). There was no association between a positive response to three or more of the Bright Futures questions, which should indicate increased risk of hearing loss, and the high-frequency screen results (Chi-square p = 0.40).
Screening passes and referrals by objectives hearing testing (high-frequency screen followed by sound treated booth) and a positive response to 3 or more of the Bright Futures (BF) hearing screening questions.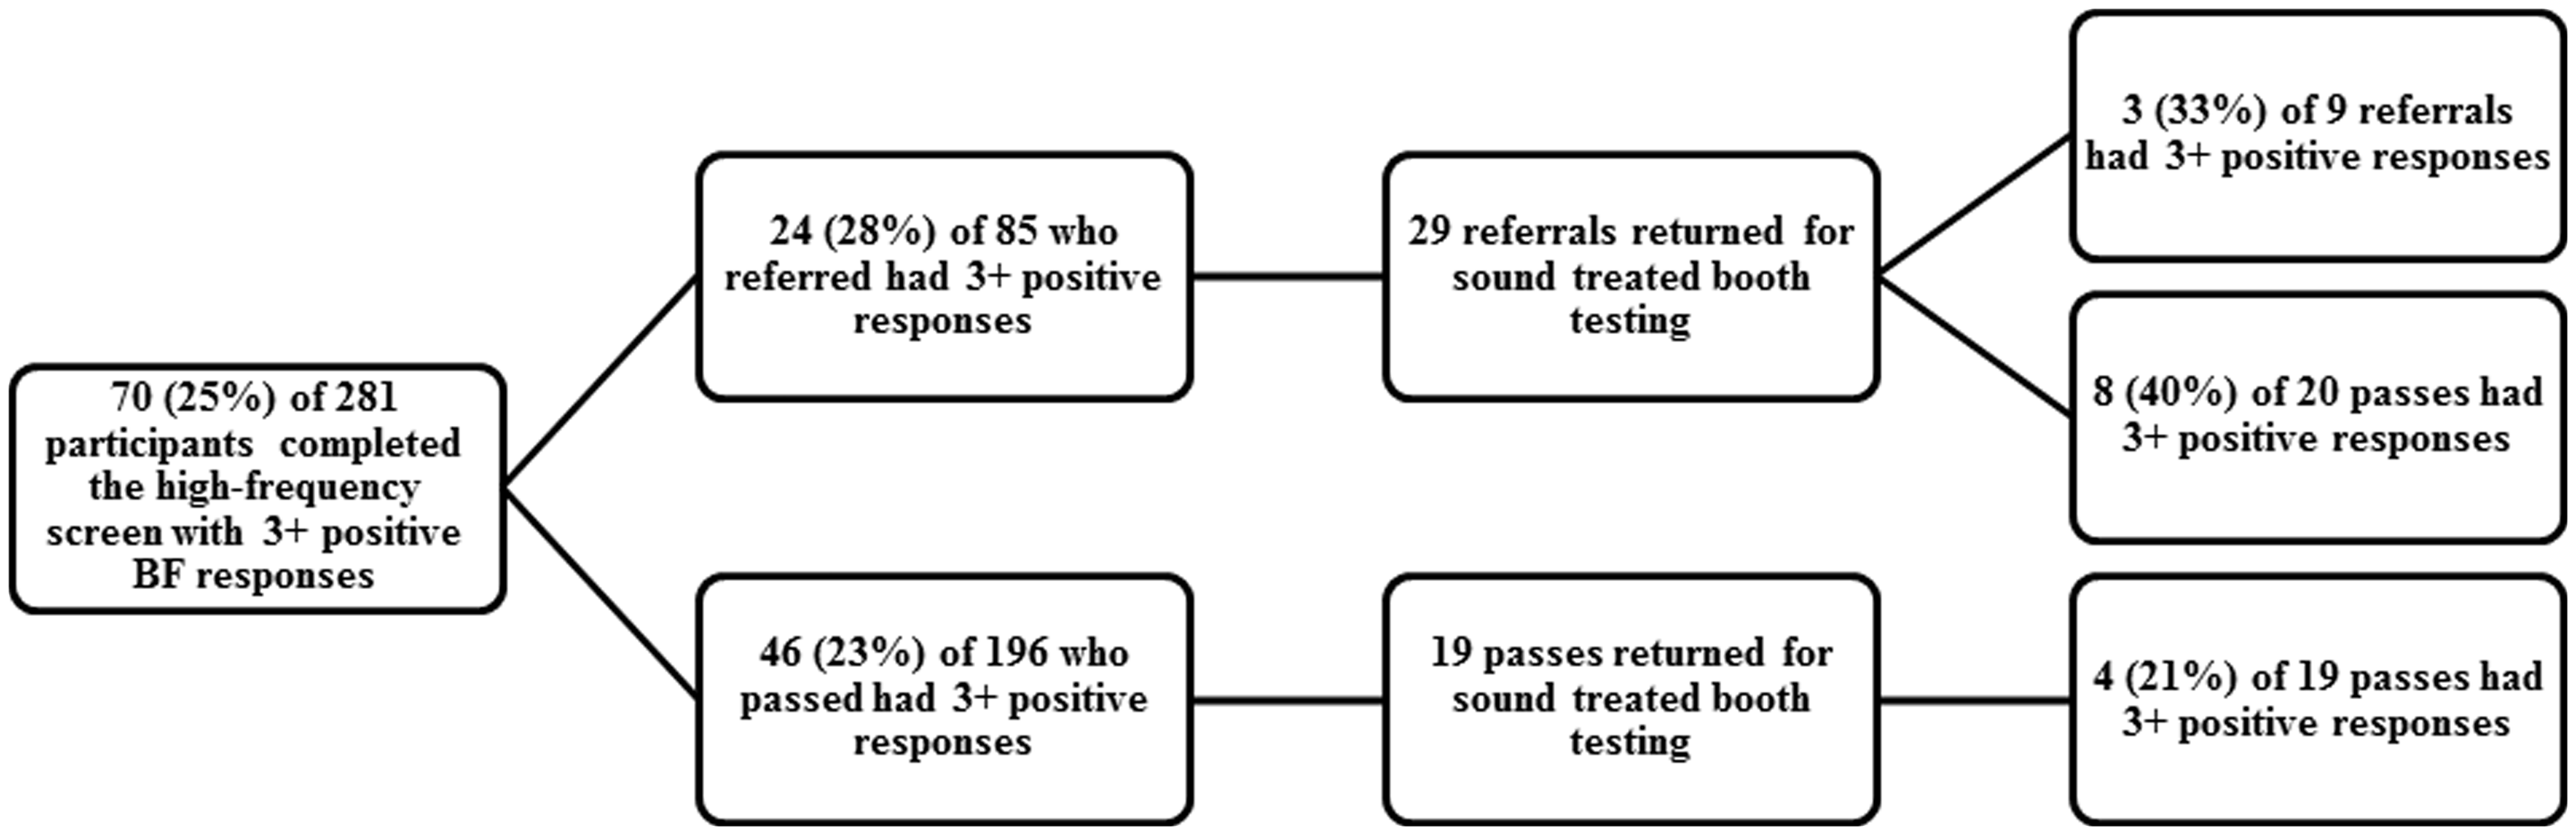
Bright Futures questions and failure of testing the in the sound treated booth
Association of a positive response to the individual Bright Futures hearing screening questions and sound treated booth results.
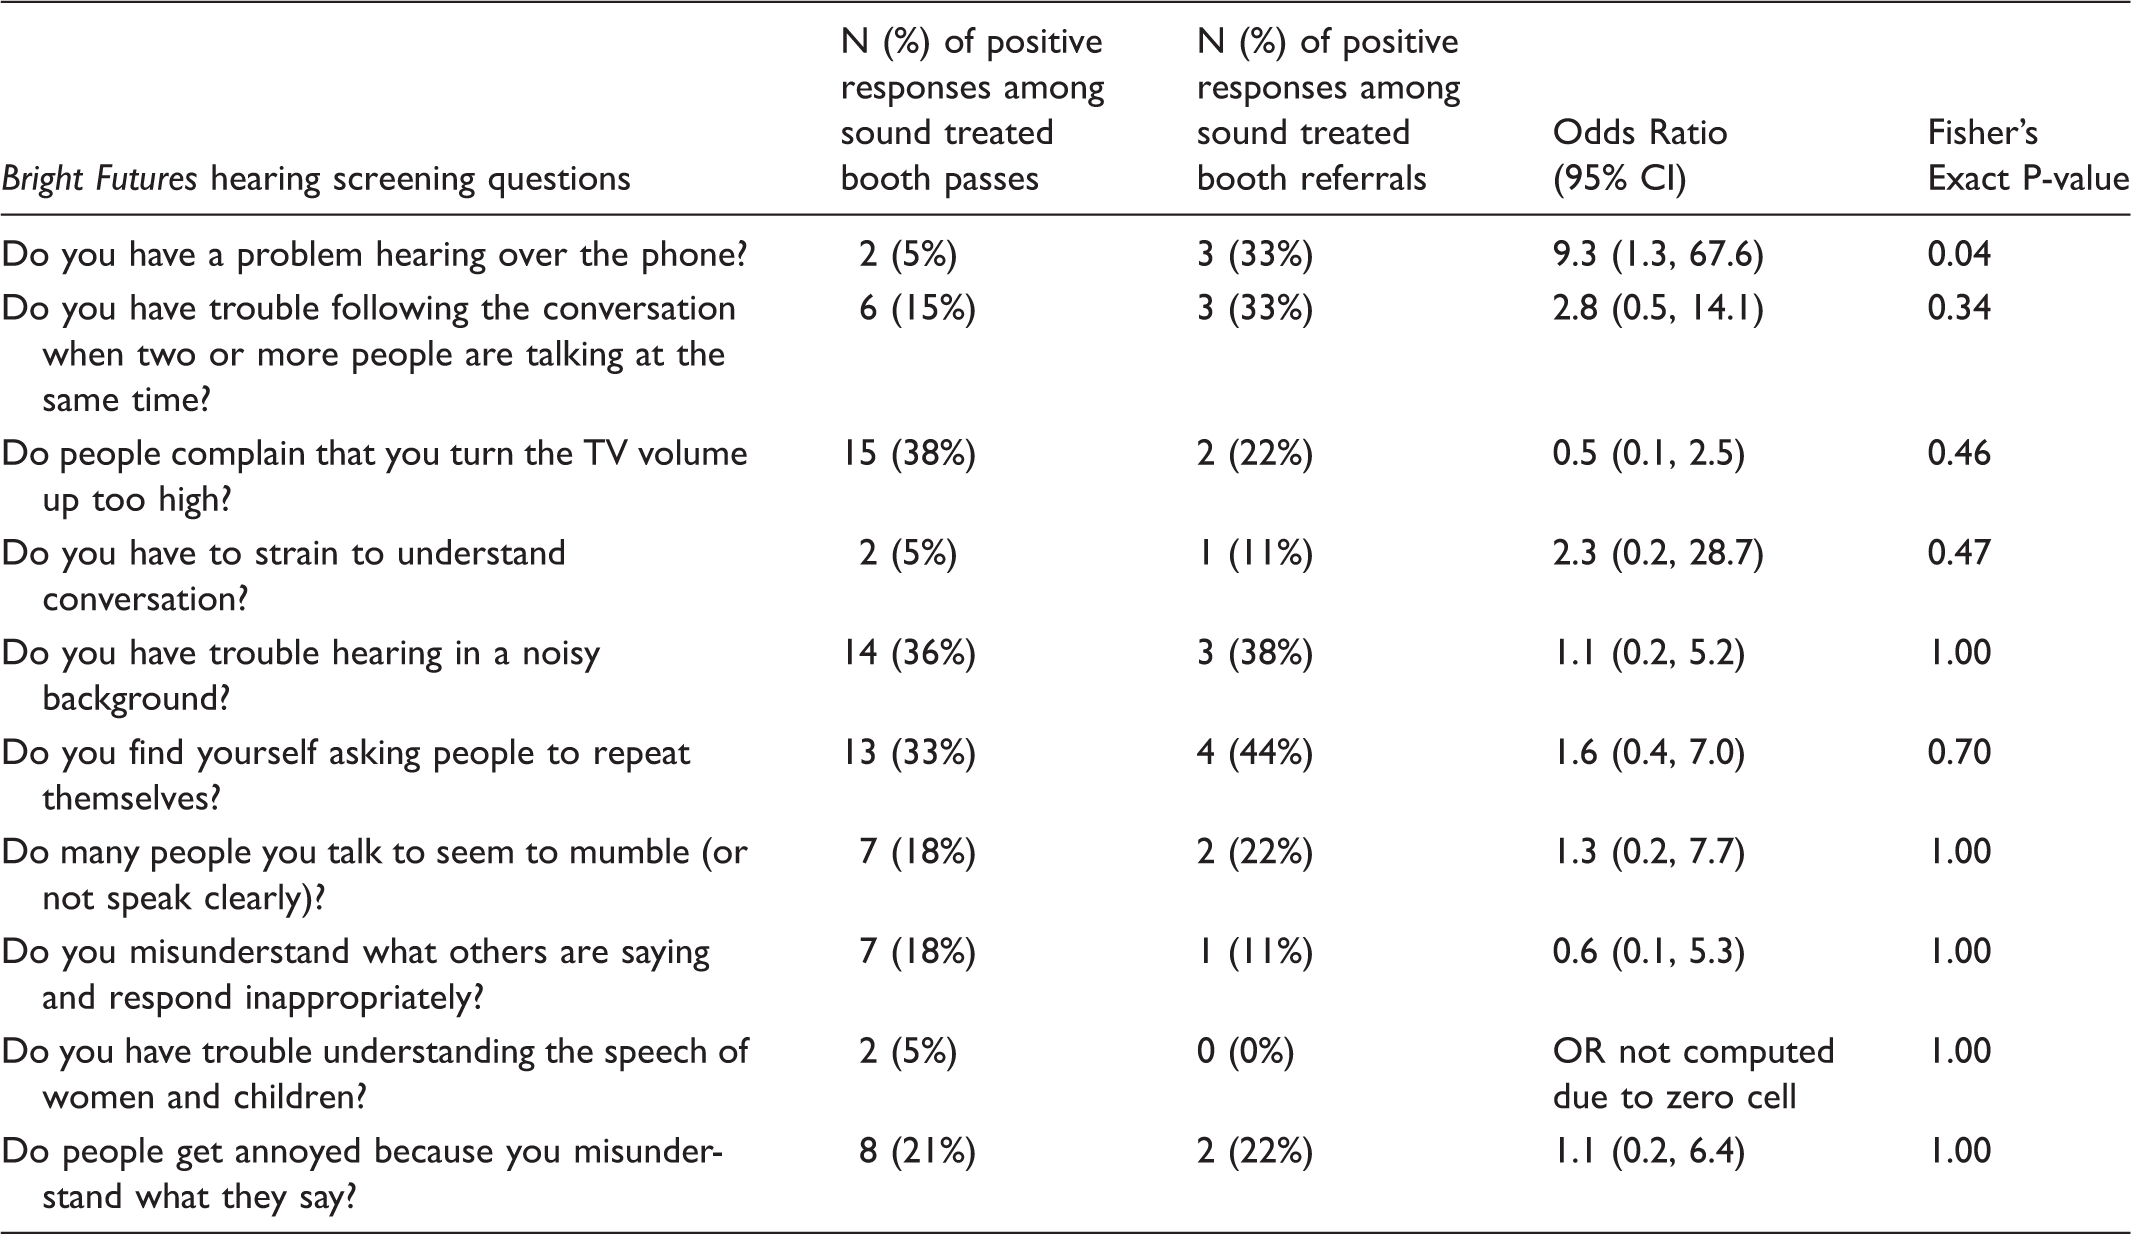
There were 15 participants out of the 48 who returned for sound treated booth testing with a positive response to three or more of the Bright Futures questions, and three of these participants were referred on sound treated booth testing (Figure 1). There was no association between a positive response to three or more of the Bright Futures questions and sound treated booth results (Fisher’s Exact p = 1.00).
Adolescent-specific questions
Three more age-appropriate questions were added to the existing Bright Futures questions: “Can you hear if someone in the chair next to you whispers something to you during class”, “If you sit at the back of the classroom, are you able to hear your teacher well?” and “Are you able to hear your own conversation in a noisy room?”. None of these was significantly associated with pass or refer results for the high-frequency screen or sound treated booth testing. The adolescent exposures which were queried, including digital audio player, cell phone, instrument, concerts, lawn mower/lawn tractor, shop equipment, hunting/gunfire, and motorcycle/motorbike/ATV use were also not associated with objective hearing test referral. Additional questions related to volume level were similarly not associated with hearing test referral.
Past medical history questions
Questions focusing on past history found that 14% (12/84) of those who were referred on the high-frequency screen reported experiencing slight hearing loss compared with 7% (13/195) of passes, odds ratio [OR] 2.33 95% CI (1.0-5.4), p = 0.04 (two participants did not respond). On sound treated booth testing, 33% (3/9) of referrals compared with 3% (1/39) of passes thought they had hearing problems OR 19.0 (95% CI 1.7-212.8), p = 0.02. Additionally 22% (2/9) of sound treated booth referrals compared with 0% (0/39) passes had been diagnosed with hearing loss (p = 0.02, OR could not be calculated due to zero cell value).
Discussion
The results of this study demonstrate that most of the Bright Futures hearing screening questions are not associated with adolescent hearing loss. Significantly, the questions were not developed for children or adolescents. The importance of screening adolescents for hearing loss was demonstrated by NHANES 2005-2006, which found that one in five adolescents aged 12-19 had hearing loss. 1 Current recommendations for adolescent hearing screening suggest initially utilizing the Bright Futures hearing screening questions, to select those who are at “high-risk” for hearing loss for objective testing.2,3 However, this approach may be problematic, for several reasons: 1) inability to directly link hearing hazardous exposures to hearing loss, 2) poor recognition among adolescents and parents of hearing difficulties, and 3) lack of a validated hearing risk-assessment tool in the adolescent population. Thus, it is not clear to clinicians who should be characterized as “high-risk”.
Many studies have demonstrated that adolescents are exposed to sound intensities high enough to put them at risk for hearing loss.13–17 The Occupational Health and Safety Administration has clear guidelines delineating what constitutes hazardous noise exposures for employees. 18 However, finding a direct link between duration and decibel level of typical adolescent hazardous noise exposures, especially music and hearing loss, remains elusive.15,16,19 It is unclear whether this is due to a strong genetic variation in susceptibility to hearing loss, low sensitivity measures for noise-related hearing loss, or failure to ask questions in such a way that high-risk behaviour is adequately captured. Additionally, the issue may be a delay between exposure to hazardous noise and development of permanent hearing loss. 20 However, this may partially explain why there was no clear association between the many adolescent hazardous noise exposures which were queried in this study and referral on the high-frequency screen or sound treated booth testing.
The hearing screening questions which were significantly associated with referral on the high-frequency screen did not emerge as significantly associated with referral on gold-standard testing in a sound treated booth. For example, even if an individual gave a “yes” response to the question, “Do you think you have hearing problems?”, he or she would be no more likely to fail the high-frequency screen and be referred for subsequent sound treated booth testing. Thus, there was no question, or combination of questions, reliably associated with an objective hearing test referral on both the high-frequency screen and sound treated booth testing, such that a subjective response alone could be used to predict those individuals most likely to be referred on objective testing.
Studies have indicated that adolescents and parents provide poor self-report of hearing status, in contrast to studies on older adults examining the self-reporting of hearing symptoms.10,21,22 Noise-related HFHL, in particular, will not be recognized until it is severe enough to affect the speech-related frequencies. 10 Hearing loss is not a priority for young adults when compared with other contemporary health issues. 23
However, ample evidence over the past 30 years supports the detrimental impact of even mild or unilateral hearing loss on children and adults.24–36 Students with mild hearing loss are 10 times more likely to repeat a grade. 37 With average costs of $9,200 per year of schooling, the total expenditures for repeated grades for the United States (US) school system currently exceeds 10 billion dollars. 37 With the cumulative effects of poor school performance and lack of workplace advancement, it is estimated that those with hearing loss lose $220,000-440,000 in earnings, depending on when the hearing loss was diagnosed. 37 Such estimates do not account for the less tangible impact on quality of life. 35
Audiologic damage caused by excessive sound exposure results in irreversible HFHL, although it is the most preventable type of hearing loss (ie. by avoiding sound hazardous environments).10,23 Early identification is the best defence in preventing the progression of HFHL in adolescents, which may have long-term effects on future productivity and quality of life.
The lack of a high-quality subjective hearing risk assessment remains a significant barrier to the recommendations for selective hearing screening in adolescents. The American Academy of Pediatrics’ current recommendations are for an objective hearing assessment as a newborn, and then at the 4, 5, 6, 8 and 10 year health maintenance visits.2,3 At other visits, a risk assessment (Bright Futures questions) is to be performed, followed by an objective screen if the risk assessment is positive. Perhaps for the adolescent population, it would make more sense to include another age for an objective hearing assessment, as our study clearly demonstrates that the currently recommended screening questions are inadequate for identifying adolescents at risk for hearing loss. Of note, the Bright Futures questions were inadequate for secondary prevention of hearing loss in adolescents. Another option would be the development of a primary prevention tool to assess risk factors for developing hearing loss in younger teenagers.
Limitations
Ideally, all 85 participants who failed the high-frequency screen would have returned for testing in the sound treated booth, however, only 29 did so. The smaller sample size resulted in large confidence intervals for the odds ratios reported in the analysis. Regardless, if one of the ten Bright Futures hearing screening questions was strongly associated with hearing loss, it might have been expected that it would show up as significantly related to failing both the high-frequency screen and testing in the sound treated booth. While a larger sample size would increase the statistical power of the findings, there is a clear indication that selectively screening adolescents for hearing loss with the currently recommended subjective risk assessment tool is not valid.
The lack of association between the Bright Futures hearing screening questions and the objective hearing tests may have been due to the hearing test referral criteria. We used well-established criteria for referral in the school setting and the noise notch, but it is possible that varying these criteria would have produced a different outcome.
While scheduling participants for the sound treated booth testing, study coordinators found that those students who passed the screening test were more willing to return for the free audiology testing. Several of the parents whose children were referred on the hearing screening stated that their teenagers did not have any hearing problems, and declined further testing. As previously discussed, parental and teen judgment regarding symptoms of hearing loss is inaccurate.19,20 This supports consideration of a recommendation for an objective hearing assessment in adolescence.
Conclusions
Most Bright Futures hearing screening questions are not associated with objective measures of hearing loss among adolescents. This is a concerning outcome, considering the evolution of hazardous noise exposures and rising prevalence of adolescent hearing loss. Rather than using the currently recommended subjective hearing screening questions to select adolescents at high risk for hearing loss, an objective hearing screen for all adolescents should be considered for inclusion in the schedule of preventive care services. The findings of this research may be used to inform the American Academy of Pediatrics preventive care recommendations, and to improve hearing screening for adolescents.
Supplementary materials may be obtained by contacting the corresponding author.
Footnotes
Declaration of conflicting interests
The authors have no potential conflicts of interest with respect to the research, authorship, and/or publication of this article.
Funding
This project was supported by a grant from the Academic Pediatric Association (APA)/Maternal and Child Health Bureau (MCHB) Young Investigator Award; principal investigator, Deepa Sekhar. The APA/MCHB did not have any role in the design and conduct of the study; collection, management, analysis, and interpretation of the data; and preparation, review, or approval of the manuscript.
Acknowledgements
The authors thank Tara Blackburn, MEd, BSE, RN, school nurse, Michael Murphy, principal at Hershey High School, and Jorge Gonzalez, PhD, CCC-A for their valuable assistance with this study. The authors also thank the Penn State Milton S. Hershey Medical Center Audiologists, who gave their time free of charge in the interest of making a meaningful contribution to the health of children.