
Abstract
Objectives
Determination of methylmalonic acid, 2-methylcitric acid, and total homocysteine in dried blood spots by liquid chromatography–tandem mass spectrometry has usually been used as a second-tier test to improve performance of newborn screening for propionylcarnitine-related disorders. However, factors that potentially affect its detection results have not been investigated, and we aimed to evaluate these influencing factors and explore their potential utility in newborn screening and initial follow-up for propionylcarnitine-related disorders.
Methods
This study comprised a prospective group (1998 healthy infants, to establish cutoff values and investigate the influencing factors) and a retrospective group (804 suspected positive cases screened from 381, 399 newborns for propionylcarnitine-related disorders by tandem mass spectrometry, to evaluate the performance of newborn screening and initial follow-up).
Results
Cutoff values for methylmalonic acid, 2-methylcitric acid, and total homocysteine were 2.12, 0.70, and 10.05 µmol/l, respectively. Concentration of methylmalonic acid, 2-methylcitric acid, and total homocysteine in dried blood spots is not impacted by sex, age, birth weight, gestational age, or dried blood spot storage time. A total of 75 of 804 cases were screened positive by combined tandem mass spectrometry and liquid chromatography–tandem mass spectrometry, thus eliminating 90% of the false positives without compromising sensitivity. Eighteen propionylcarnitine-related disorders were successfully identified, including one CblX case missed in the initial follow-up by tandem mass spectrometry.
Conclusions
Methylmalonic acid, 2-methylcitric acid, and total homocysteine detected in dried blood spots by liquid chromatography–tandem mass spectrometry is a reliable, specific, and sensitive approach for identifying propionylcarnitine-related disorders. We recommend this assay should be performed rather than tandem mass spectrometry in follow-up for propionylcarnitine-related disorders besides second-tier tests in newborn screening.
Keywords
Introduction
Newborn screening by tandem mass spectrometry (MS/MS) detects more than 40 inborn metabolic disorders that have historically caused severe morbidity and mortality.1,2 Early diagnosis and treatment allow for patients to have an almost normal life, reduce sequelae or lessen organ damage.3,4 However, current MS/MS screening also creates frequent false positives, leading to considerable emotional and financial burdens that accompany follow-up tests for false positives,5,6 such as propionylcarnitine (C3)-related disorders:7–11 methylmalonic acidemias (MMAU), propionic acidemia (PA), and vitamin B12 deficiency. 12
To improve this situation for C3-related disorders, there are several approaches: defining birth weight 13 or age14-related cutoff values, using secondary screening analytes (methionine (MET), 15 heptadecanoylcarnitine, 16 ratios of C3/acetylcarnitine (C2) and C3/free carnitine (C0) 17 ), and utilizing postanalytical tools from Region 4 Stork system. 18 However, these methods are based on C3 levels, which overlap between normal and affected individuals and vary with birth weight, gestational age, infection, hypoglycemia, antibiotics, parenteral nutrition, liver disease, jaundice, etc. 19 Although genetic testing has been developed, it is relatively expensive, time-consuming, and difficult for clinicians to interpret. 20
Currently, the determination of more specific markers, such as methylmalonic acid (MMA), 2-methylcitric acid (MCA), 3-hydroxypropionic acid (3-OHPA), and total homocysteine (tHCY), by liquid chromatography–tandem mass spectrometry (LC–MS/MS) from original newborn dried blood spots (DBSs) is used as a second-tier test after primary newborn screening for C3-related disorders.19,21–27 Combining MS/MS and LC–MS/MS in newborn screening eliminates 95% of false positives with higher specificity. 26 Moreover, this assay is used as a follow-up monitoring tool for confirmed MMA patients. 28
Although determination of MMA, MCA, and tHCY in DBSs by LC–MS/MS has been reported, several factors (sex, age, birth weight, gestational age, and DBS storage time) that potentially affect detection results have not been investigated. In this study, we evaluated these influencing factors and explored their potential utility in newborn screening and initial follow-up for C3-related disorders.
Material and methods
Subjects
This study was approved by the Ethical Committee, Children’s Hospital, Zhejiang University School of Medicine. Written informed consents were obtained from the parents of all newborns. A total of 2000 leftover newborn DBSs were randomly selected following routine newborn screening from December 2016 to March 2017 in the Zhejiang newborn screening center. These DBSs were negative for all screened conditions. They were analyzed prospectively to determine reference ranges and evaluate the influencing factors for MMA, MCA, and tHCY by LC–MS/MS.
The retrospective study group consisted of 381,399 DBSs obtained in our center from December 2015 to September 2017. They were screened for amino acids, acylcarnitines, and succinylacetone by using TQD/Xevo TQD MS/MS systems (Waters, MA, United States) and NeoBase non-derivatized MS/MS kit (PerkinElmer, United States) as Winter et al. 29 described. The cutoff values for Met, C3, C3/C0, and C3/C2 were 7.18 µmol/l, 3.80 µmol/l, 0.15, and 0.27, respectively. In total, 804 samples were suspected to be positive for C3-related disorders and were analyzed further by LC–MS/MS. Additionally, 69 initial follow-up cases with positive results detected by combined MS/MS and LC–MS/MS in newborn screening were evaluated (Figure 1). Definitive diagnosis was confirmed by genetic analysis. After newborn screening by MS/MS analysis, all of the DBSs were stored at 4–8°C.
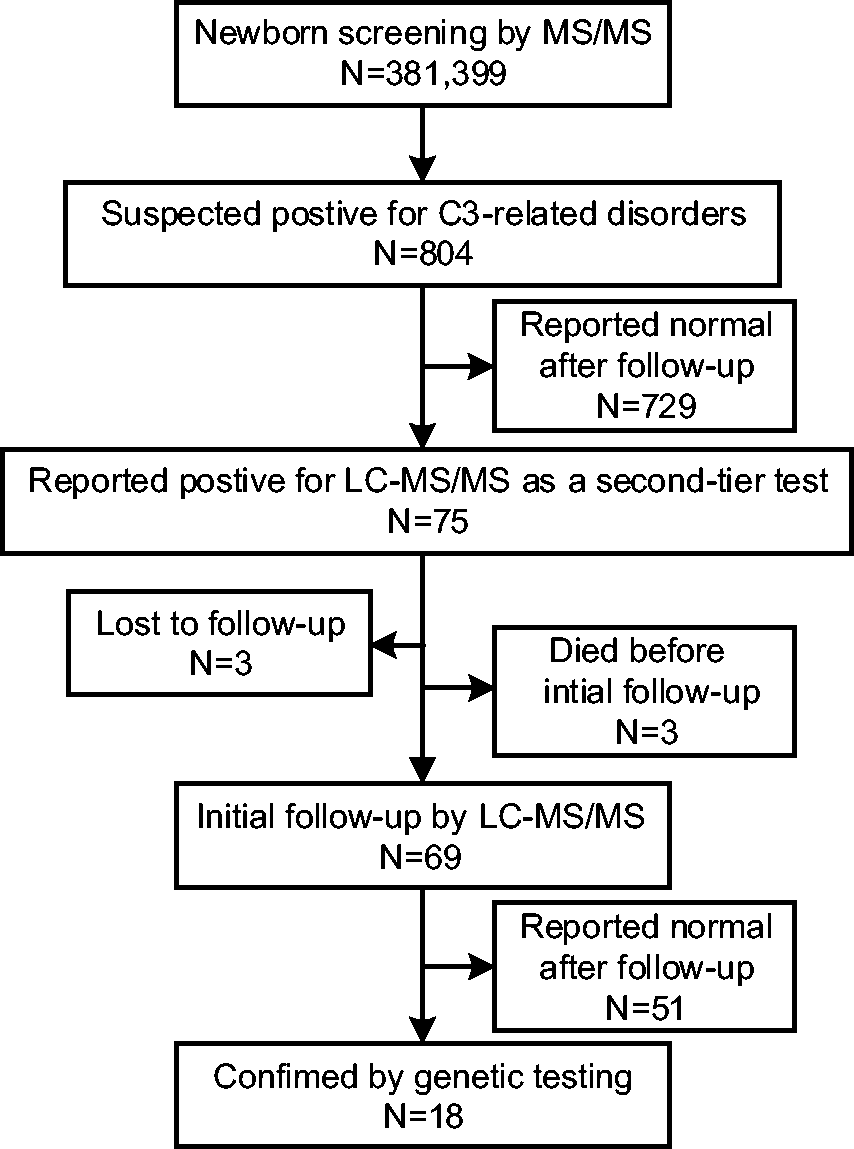
Flowchart of the retrospective group included in the study.
LC–MS/MS analysis
Concentrations of MMA, MCA, and tHCY were determined in three 3.0 mm DBS punches by a modified LC–MS/MS method based on the work of Turgeon et al. 19 Briefly, the analytes were extracted with a solution containing dithiothreitol and isotopically labeled internal standards (d3-MMA, d3-MCA, d8-HCY). d3-MMA and d8-HCY were purchased from Cambridge Isotope Laboratories (USA), and d3-MCA was purchased from CDN Isotopes (Canada). The extract was dried under a nitrogen stream at 45°C and butylated by adding 3 mol/l HCl in n-butanol to the residues for derivatization. The dried butylesters of MMA, MCA, and HCY were reconstituted in 100 µl mobile phase A (aqueous 0.1% formic acid). Waters ACQUITY UPLC I-Class system was used and the flow rate was 0.5 ml/min. Separation was achieved on an ACQUITY BEH-C18 column (2.1 mm× 50 mm, 1.7 m) at a temperature of 40°C with mobile phase A (aqueous 0.1% formic acid) and mobile phase B (acetonitrile/water/formic acid, 80:20:0.1%) as follows: 10–40% B in 2.5 min, 40–85% B in 2.5 min, 85–95% B in 0.8 min. The runtime was 7.5 min. The detection was performed on a LC–MS/MS system (Waters ACQUITY UPLC-TQD, Milford, USA), which was operated in positive ion mode (capillary voltage 2.0 kV, desolvation temperature 350°C). The instrument was optimized automatically by an internal algorithm that monitored the transitions of m/z 231.0 to 119.3 and m/z 234.2 to 122.2 for MMA and d3-MMA, m/z 375.3 to 199.0 and m/z 378.2 to 202.2 for MCA and d3-MCA, and m/z 192.1 to 90.1 and m/z 196.0 to 94.1 for HCY and d8-HCY, respectively.
Statistical analysis
Statistical analysis was performed with SPSS 24.0 software. The normality of the data was evaluated using the Kolmogorov–Smirnov test, and evaluations related to the influence of sex, age, and gestational age were conducted with Mann–Whitney U tests; the effect of birth weight was determined by the Kruskal–Wallis test; the effect of DBS storage time was tested using Spearman’s rank correlation. The correlations between the results of MS/MS and LC–MS/MS were visualized by scatter plots. Tests were two-sided, and the level of significance was set at P < 0.05.
Results
Establishment of cutoff values for MMA, MCA, and tHCY
Two of the 2000 normal infants were excluded due to incomplete birth information. Of the 1998 infants, 51.9% were male. The median birth weight, age, and gestational age were 3300 g, 4 days, and 39 weeks, respectively.
Data sets of MMA, MCA, and tHCY were nonnormally distributed (P < 0.05) and positively skewed (skewness > 0), as determined by the Kolmogorov–Smirnov test. The 99.9th percentiles of the target analytes detected in the DBSs of these infants were chosen as cutoff values by LC–MS/MS and were as follows: MMA: 2.12 µmol/l, MCA: 0.70 µmol/l, and tHCY: 10.05 µmol/l.
Effect of sex, age, birth weight, gestational age, DBS storage time, and correlations with analytes of C3-related disorders by MS/MS and LC–MS/MS
In the present data set, no sex-related differences were noted for MMA, MCA, tHCY, and C3 levels, while C3/C2, C3/C0, and MET were significantly higher in females than in males (P < 0.001) (Figure 2(a)). No age-related differences were noted for MMA, MCA, tHCY, and C3/C2, while C3 and C3/C0 were significantly lower and MET was significantly higher in older infants than in younger infants (P < 0.01) (Figure 2(b)). No birth weight-related differences were noted for MMA, MCA, and tHCY, while C3, C3/C0, and C3/C2 were significantly higher and MET was significantly lower in heavier infants than in lighter infants (P < 0.05) (Figure 2(c)). Except for C3/C0, which was significantly higher, and MET, which was significantly lower in full-term infants than in preterm infants (P < 0.01), no gestational age-related differences were noted for MMA, MCA, tHCY, C3, and C3/C2 (Figure 2(d)).
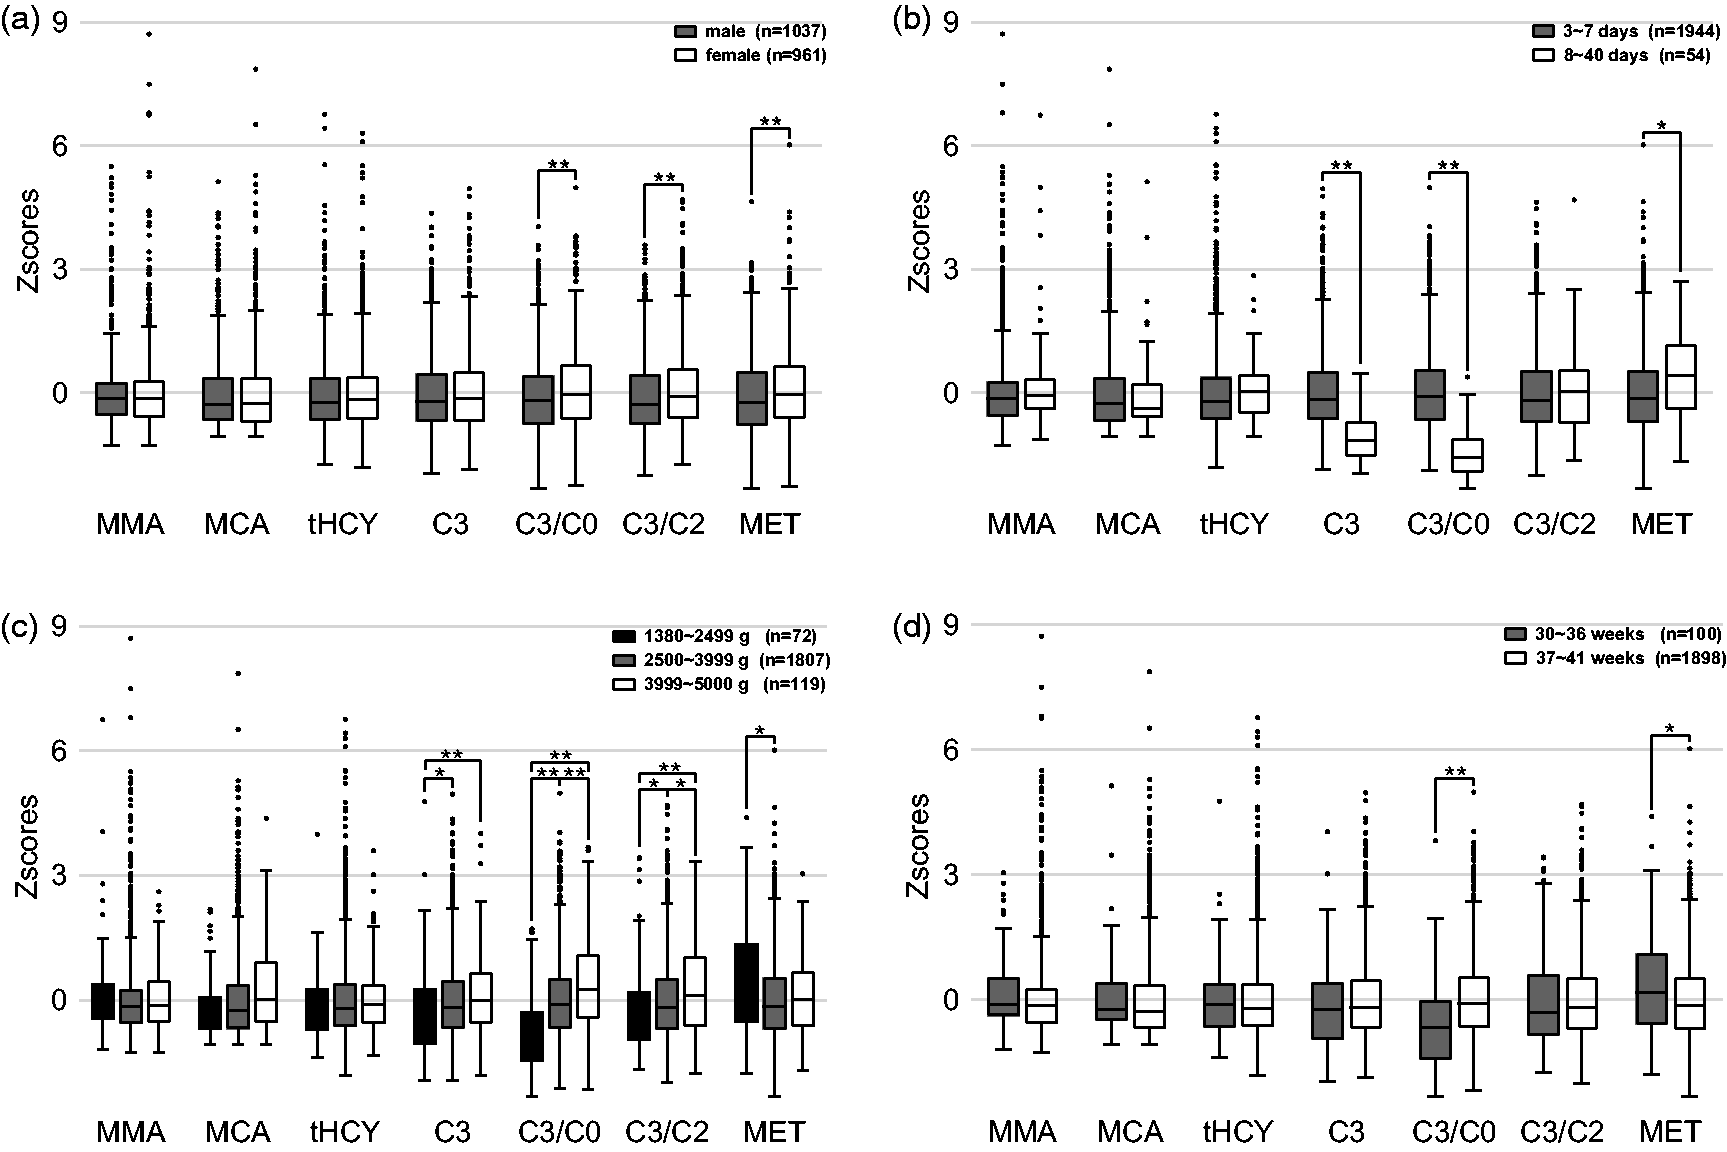
Effect of sex (a), age (b), birth weight (c), and gestational age (d) on analyte values of C3-related disorders by LC–MS/MS and MS/MS. Data presented as boxplots of 1998 healthy infants after Z-Score standardization.
After collection, 1998 DBSs of infants were stored at 4–8°C between 7 and 36 days until LC–MS/MS assay. MMA levels did not differ significantly (r = 0.034, P = 0.128) with storage time, whereas MCA (r = −0.180, P < 0.001) and tHCY (r = −0.146, P < 0.001) levels showed a very weak negative linear relationship.
There were no correlation occurrences observed among the analytes of C3-related disorders by MS/MS and LC–MS/MS from the generated scatter plots.
Utility of the LC–MS/MS assay in newborn screening and initial follow-up
Initially, 804 samples showed suspected positive results from 381,399 newborns screened for C3-related disorders, with elevated C3, C3/C0, and C3/C2 or lower MET levels detected by MS/MS. When the second-tier LC–MS/MS assay was introduced, only 75 cases were reported positive and 18 true positive cases were identified. The false positive rate was reduced from 0.21% to 1.49‱, and the positive predictive value was increased from 2.11 to 24.00%.
According to our screening protocol, follow-up for suspected positive cases was initiated with a repeated MS/MS test. Of the 75 cases screened positive by combined MS/MS and LC–MS/MS in newborn screening, 69 initial follow-up DBSs were analyzed by LC–MS/MS retrospectively. The other six initial follow-up DBSs were not obtained because three individuals had died, and the rest were lost to follow-up. Twenty-four and 31 cases were reported to be positive by MS/MS and retrospective LC–M/MS analysis, respectively. Although seven additional positive cases were determined with LC–MS/MS, one male infant with CblX that was not positively identified by MS/MS was identified by LC–MS/MS. He was regarded as a healthy infant without subsequent follow-up due to his normal MS/MS result from the initial follow-up DBS. He presented with recurrent seizures at three months of age and died of respiratory failure 20 days later. Thus, all 18 of the 69 patients with C3-related disorders were successfully identified with the LC–MS/MS assay.
Patient characteristics
Of the 18 positive cases confirmed by genetic analysis, 13 MMAU (four MUT, eight CblC, and one CblX), four PA, and one maternal vitamin B12 deficiency (MBD) patient were identified (Table 1). Four MUT patients showed significantly elevated MMA and MCA levels and normal tHCY levels. Eight CblC (MMACHC) patients displayed elevated MMA and tHCY levels and elevated or normal MCA levels. One CblX (HCFC1) patient exhibited normal MCA levels and elevated MMA and tHCY levels. Four PA patients revealed elevated MCA levels, normal MMA levels, and elevated or normal tHCY levels. One MBD patient had significantly elevated MMA, MCA, and tHCY levels (Table 2).
Median and range of analyte concentrations and ratios obtained in this study.
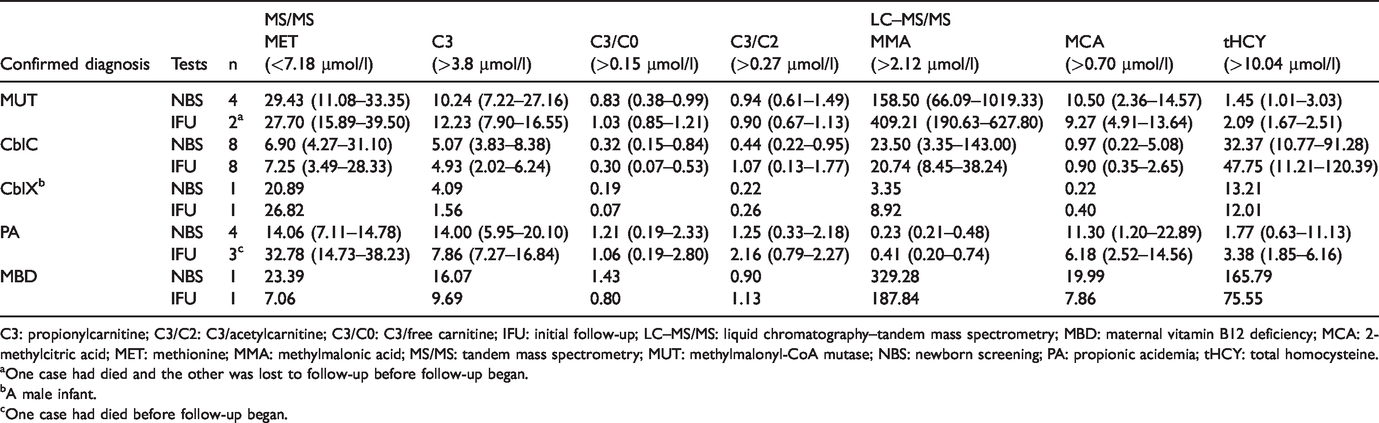
C3: propionylcarnitine; C3/C2: C3/acetylcarnitine; C3/C0: C3/free carnitine; IFU: initial follow-up; LC–MS/MS: liquid chromatography–tandem mass spectrometry; MBD: maternal vitamin B12 deficiency; MCA: 2-methylcitric acid; MET: methionine; MMA: methylmalonic acid; MS/MS: tandem mass spectrometry; MUT: methylmalonyl-CoA mutase; NBS: newborn screening; PA: propionic acidemia; tHCY: total homocysteine.
aOne case had died and the other was lost to follow-up before follow-up began.
bA male infant.
cOne case had died before follow-up began.
Metabolite abnormalities of disorders in newborn screening.
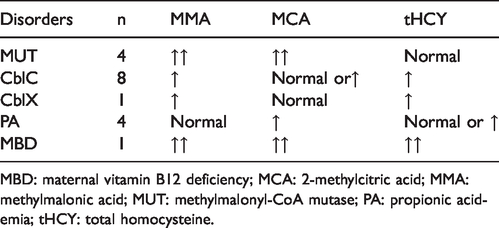
MBD: maternal vitamin B12 deficiency; MCA: 2-methylcitric acid; MMA: methylmalonic acid; MUT: methylmalonyl-CoA mutase; PA: propionic acidemia; tHCY: total homocysteine.
Discussion
There are seven panels (Supplementary Table S1) for C3-related disorders in LC–MS/MS assays. Although the seventh panel includes all second-tier markers (MMA, MCA, 3-OHPA, and tHCY), it is complicated due to the use of two methods: one analyzes MMA, 3-OHPA, and MCA, and the other analyzes tHCY. 30 In this study, we chose the sixth panel (MMA, MCA, and tHCY) for the following reasons: first, MMAU and PA can be distinguished by whether MMA is elevated. Second, PA is characterized by normal MMA and elevated MCA, not by elevated 3-OHPA. 27 Third, tHCY is a key indicator for combined MMAU, which is the main form of MMAU detected in our center. The differential strategy was not identical, but the panel utilized in our study was based on that in Turgeon et al.’s 19 study. For instance, Turgeon et al.’s study suggested that the MCA level of CblC patients (n = 7) and the tHCY level of PA patients (n = 2) were normal. However, the MCA level of CblC patients (n = 8) may be elevated in our study, which is consistent with the studies by Al-Dirbashi et al. 26 and Monostori et al. 27 Additionally, the tHCY level may also be elevated in PA patients (n = 4). One MBD patient in Gramer et al.’s 30 study had normal MMA levels and elevated MCA and tHCY levels, whereas one MBD patient in our study had elevated MMA, MCA, and tHCY levels. The difference between the two studies may be due to insufficient sample size. Therefore, based on the patient samples available, the sixth panel seems to be usable for differentiation among PA and certain subtypes of MMA in newborn screening (Table 2); however, CblC cannot be differentiated from CblX. Consequently, doctors can introduce immediate therapeutic interventions as patients are recalled to the hospital to prevent or mitigate clinical symptoms without waiting for differentiated results of urine organic acids analysis, serum or plasma tHCY detection, or genetic analysis.
By LC–MS/MS implementation after primary newborn screening, our approach eliminated approximately 90% of the false positive cases introduced by other newborn screening programs.21,26 However, this LC–MS/MS assay cannot replace primary screening because of its inability to screen for other inherited metabolic disorders, and its complexity, limited throughput, analysis time, and cost. Instead, we can utilize it as a second-tier test using original newborn DBSs to reduce the false positive rate without compromising sensitivity.
In this study, one CblX case that was missed due to a normal MS/MS result (MET 26.82 µmol/l, C3 1.56 µmol/l, C3/C0 0.07, C3/C2 0.26) in the initial follow-up was identified with abnormal results (MMA 8.92 µmol/l, tHCY 12.01 µmol/l) by LC–MS/MS, indicating that the LC–MS/MS assay should be performed rather than MS/MS in the initial follow-up. The same cutoffs are often used to interpret results by MS/MS in newborn screening and initial follow-up. However, the concentrations of C3 and C3/C0 decrease with age, and the concentration of MET increases with age even after seven days old (Figure 2(b));14,31 thus, normal results of affected cases may be reported in the initial follow-up. Only seven positive cases were increased after the initial follow-up by LC–MS/MS based on 381,399 infants, while 90% of false positive cases were eliminated after the second-tier test. Therefore, the method of detecting MMA, MCA, and tHCY by LC–MS/MS is more effective than utilizing MS/MS for C3-related disorders in initial follow-up owing to its stability, which is not impacted by sex, age, birth weight, or gestational age (Figure 2).
MMA levels in DBSs increase with storage at room temperature, 25 but in our study MMA levels were stable when DBSs were stored at 4–8°C. Although MCA and tHCY levels showed a negative linear relationship with storage time, the correlation was very weak. Besides, DBSs of 18 true positives from newborn screening and initial follow-up were retrospectively analyzed and reported positive between 23 days and 42 months after collection. Thus, we conclude that MMA, MCA, and tHCY levels in DBSs are not impacted by storage time when DBSs are stored at 4–8°C.
MMA, MCA, and tHCY detected in DBSs by LC–MS/MS have a strong correlation with MMA in urine determined by gas chromatography–mass spectrometry (GC–MS) or in plasma determined by immunoassays, MCA in urine determined by GC–MS, and tHCY in serum determined by enzymatic cycling assay or in plasma determined by immunoassays.24,28 This LC–MS/MS assay is a good routine monitoring tool for C3-related disorders follow-up. Hence, we conclude that MMA, MCA, and tHCY detected in DBSs by LC–MS/MS should be used not only as a second-tier test and differential tool in newborn screening but also as a verified and routine monitoring tool in follow-up for guiding patient treatment.
Here, we propose a new strategy for C3-related disorders in newborn screening: once a newborn is reported positive for C3-related disorders in primary screening by MS/MS, the LC–MS/MS method should be introduced as a second-tier test in newborn screening, and as a verified and routine monitoring tool throughout the follow-ups. Due to its stability and specificity, using this new strategy should reduce false positives by approximately 90%, differentiate PA and certain subtypes of MMA in newborn screening, allow treatment to start without waiting for results of other biochemical and genetic tests, and help to avoid false negatives in initial follow-up, monitor the more specific markers, and guide treatment more effectively in follow-ups.
However, there are three limitations to report from this study. First, seven additional cases were detected as positive after the initial follow-up by LC–MS/MS, and the timing to exclude them in subsequent follow-up is uncertain. Second, the effect of older infant age (>40 days) on the distribution of MMA, MCA, and tHCY is unclear. Third, this study included only one CblX case and one MBD case; hence differential diagnosis for C3-related disorders based on the concentration of MMA, MCA, and tHCY was not accurate enough, and a larger number and wider range of patient samples with MMAU and MBD need to be tested.
Conclusion
In conclusion, using LC–MS/MS to detect MMA, MCA, and tHCY in DBSs as a second-tier test can significantly improve the performance of newborn screening for C3-related disorders. Furthermore, this method is more reliable, specific, and sensitive than using MS/MS in follow-up owing to its stability, which is not impacted by sex, age, birth weight, gestational age, or DBS storage time.
Footnotes
Acknowledgements
We thank all the participants and their parents for their support and participation in this study.
Declaration of conflicting interests
The author(s) declared the following potential conflicts of interest with respect to the research, authorship, and/or publication of this article: Junjuan Wang and Yu Zhang currently are employees of Zhejiang Biosan Biochemical Technologies Corp. The remaining authors have no conflicts of interest to declare.
Funding
The author(s) disclosed receipt of the following financial support for the research, authorship, and/or publication of this article: This work was supported by National Key Research and Development Program of China (No. 2018YFC1002200, 2017YFC1001700) and Analysis and Measurement Foundation of Zhejiang Province (No. LGC19B050013).
Supplemental material
Supplemental material for this article is available online.