
Abstract
Objective
The National Lung Screening Trial demonstrated the benefits of lung cancer screening, but the potential high incidence of unnecessary invasive testing for ultimately benign radiologic findings causes concern. We aimed to review current biopsy patterns and outcomes in our community-based program, and retrospectively apply malignancy prediction models in a lung cancer screening population, to identify the potential impact these calculators could have on biopsy decisions.
Methods
Retrospective review of lung cancer-screening program participants from 2013 to 2016. Demographic, biopsy, and outcome data were collected. Malignancy risk calculators were retrospectively applied and results compared in patients with positive imaging findings.
Results
From 520 individuals enrolled in the screening program, pulmonary nodule(s) ≥6 mm were identified in 166, with biopsy in 30. Malignancy risk probabilities were significantly higher (Brock p < 0.00001; Mayo p < 0.00001) in those undergoing diagnostic sampling than those not undergoing sampling. However, there was no difference in the Brock (p = 0.912) or Mayo (p = 0.435) calculators when discriminating a final diagnosis of cancer from not cancer in those undergoing sampling.
Conclusions
In our screening program, 5.7% of individuals undergo invasive testing, comparable with the National Lung Screening Trial (6.1%). Both Brock and Mayo calculators perform well in indicating who may be at risk of malignancy, based on clinical and radiologic factors. However, in our invasive testing group, the Brock and Mayo calculators and Lung Cancer Screening Program clinical assessment all lacked clarity in distinguishing individuals who have a cancer from those with a benign abnormality.
Keywords
The National Lung Screening Trial (NLST) demonstrated a relative reduction in lung cancer mortality of 20% and a reduction in overall mortality of 6.7%. 1 Publication of these results and subsequent endorsements by major healthcare societies2,3 and governmental agencies,4–6 has led to renewed interest in lung cancer screening programs (LCSPs).
Published guidelines for participation in LCSP 4 include the determination of the appropriate population and requirements of the program. Current guidelines recommend the availability of multidisciplinary care and evaluation; however, published outcomes from multidisciplinary team decision-making to proceed with diagnostic sampling in lung cancer screening remain sparse. In the NLST population receiving computed tomography, 6.1% underwent invasive testing, with 43% undergoing testing that ultimately did not result in a cancer diagnosis. 1
The aim of this study was to review the current biopsy patterns of individuals enrolled in our community-based program, and the outcomes associated with those biopsies. A secondary aim was to retrospectively apply malignancy prediction models in a lung cancer screening population, to identify the impact that the use of these calculators potentially could have on decisions to biopsy.
Methods
We performed a retrospective review of all individuals enrolled in the Lung Cancer Screening Program at Swedish Cancer Institute from January 2013 to March 2016. In this review, all individuals received at minimum one year’s worth of follow-up (March 2017) in the program. A clinical database of all enrolled individuals was cross-referenced with billing records and the Electronic Medical Record (EMR) from the same time frame to identify participants. The Institutional Review Board at Swedish Medical Center (STUDY2017000236) approved this study and waiver of consent was granted.
The Swedish Cancer Institute LCSP exists within the Division of Thoracic Surgery and Interventional Pulmonology as a centralized program with all evaluations and decisions to biopsy processed through the program, as previously described.7,8 All individuals underwent a lung cancer screening shared decision making discussion prior to enrollment in the program and low-dose computed tomography (LDCT). All current smokers were offered tobacco cessation counseling by a certified tobacco cessation specialist, as part of enrollment and ongoing maintenance within the program. 8
A multidisciplinary team consisting of advanced nurse practitioners, interventional pulmonologists, and thoracic surgeons meet twice a month to review LDCT imaging of concerning positive screening results, including any individuals being considered for biopsy or additional imaging (e.g. short interval LDCT, Positron Emission Tomography, scan). Malignancy risk prediction calculators are not formally utilized and/or not recorded during the decision-making process. As part of our secondary aim we elected to retrospectively calculate malignancy risk with the use of the Brock University Calculator 9 and the Mayo Clinic Calculator. 10 The Brock University Calculator is a validated prediction model for nodules identified during computed tomography imaging. This prediction model utilizes the following characteristics to estimate the probability that lung nodules are malignant; age, gender, family history of lung cancer, emphysema, nodule size, anatomic location of nodule, solid versus part-solid nature of nodule, number of nodules, and the presence of spiculation. 9 The Mayo Clinic Calculator is a prediction model based on long-term follow-up of pulmonary nodules, using both clinical (age, smoking exposure, and personal history of cancer) and radiographic (nodule size, spiculation, and anatomic location of nodule) characteristics. 10 This information was retrospectively applied to all patients with a positive imaging finding (nodule >6 mm), to identify the ability of the calculators to assess final biopsy outcomes.
All data were collected and stored in a REDCap database. 11 Mean with standard deviation (SD) and median with the 25th–75th interquartile range (IQR) were calculated for the population, as well as basic percentages. Data between groups were compared using the one-way analysis of variance, and Mann–Whitney U tests for continuous variables and the x2 for categorical variables. Groups were compared using the Yates correction when any of the subgroups had five or less components. Statistical significance was defined as p < 0.05. Statistical analyses were performed using the SPSS 24.0 (SPSS Inc., Chicago, IL, USA) statistical software package.
Results
There were 520 individuals enrolled in the LCSP from 2013 to 2016, with a mean age of 66.2 (SD – 6.7 years), and a mean tobacco year exposure of 50.8 (SD – 19.5) years. All participants underwent a minimum of one-year of follow-up, resulting in a median follow-up time of 655 (IQR 500–891) days. Radiographic reports identified 166 individuals (31.9%) with at least one pulmonary lesion 6mm or larger in size. Biopsy was undertaken in 30 individuals (5.7% of the total population and 18.1% of individuals with nodules 6 mm or greater). Basic demographic information and radiographic characteristics of all LCSP participants are shown in Table 1. Individuals selected to undergo biopsy were older (p = 0.006), had larger sized nodules (p < 0.001), less radiographic evidence of emphysema (p < 0.001), and more spiculation as a nodule characteristic (p < 0.001). However, after identifying patients who underwent biopsy, and comparing those with and without a final diagnosis of cancer, none of these significant characteristics (nor others) appear to persist (Table 2).
Demographics and radiographic characteristics of all individuals enrolled in the lung cancer screening program.
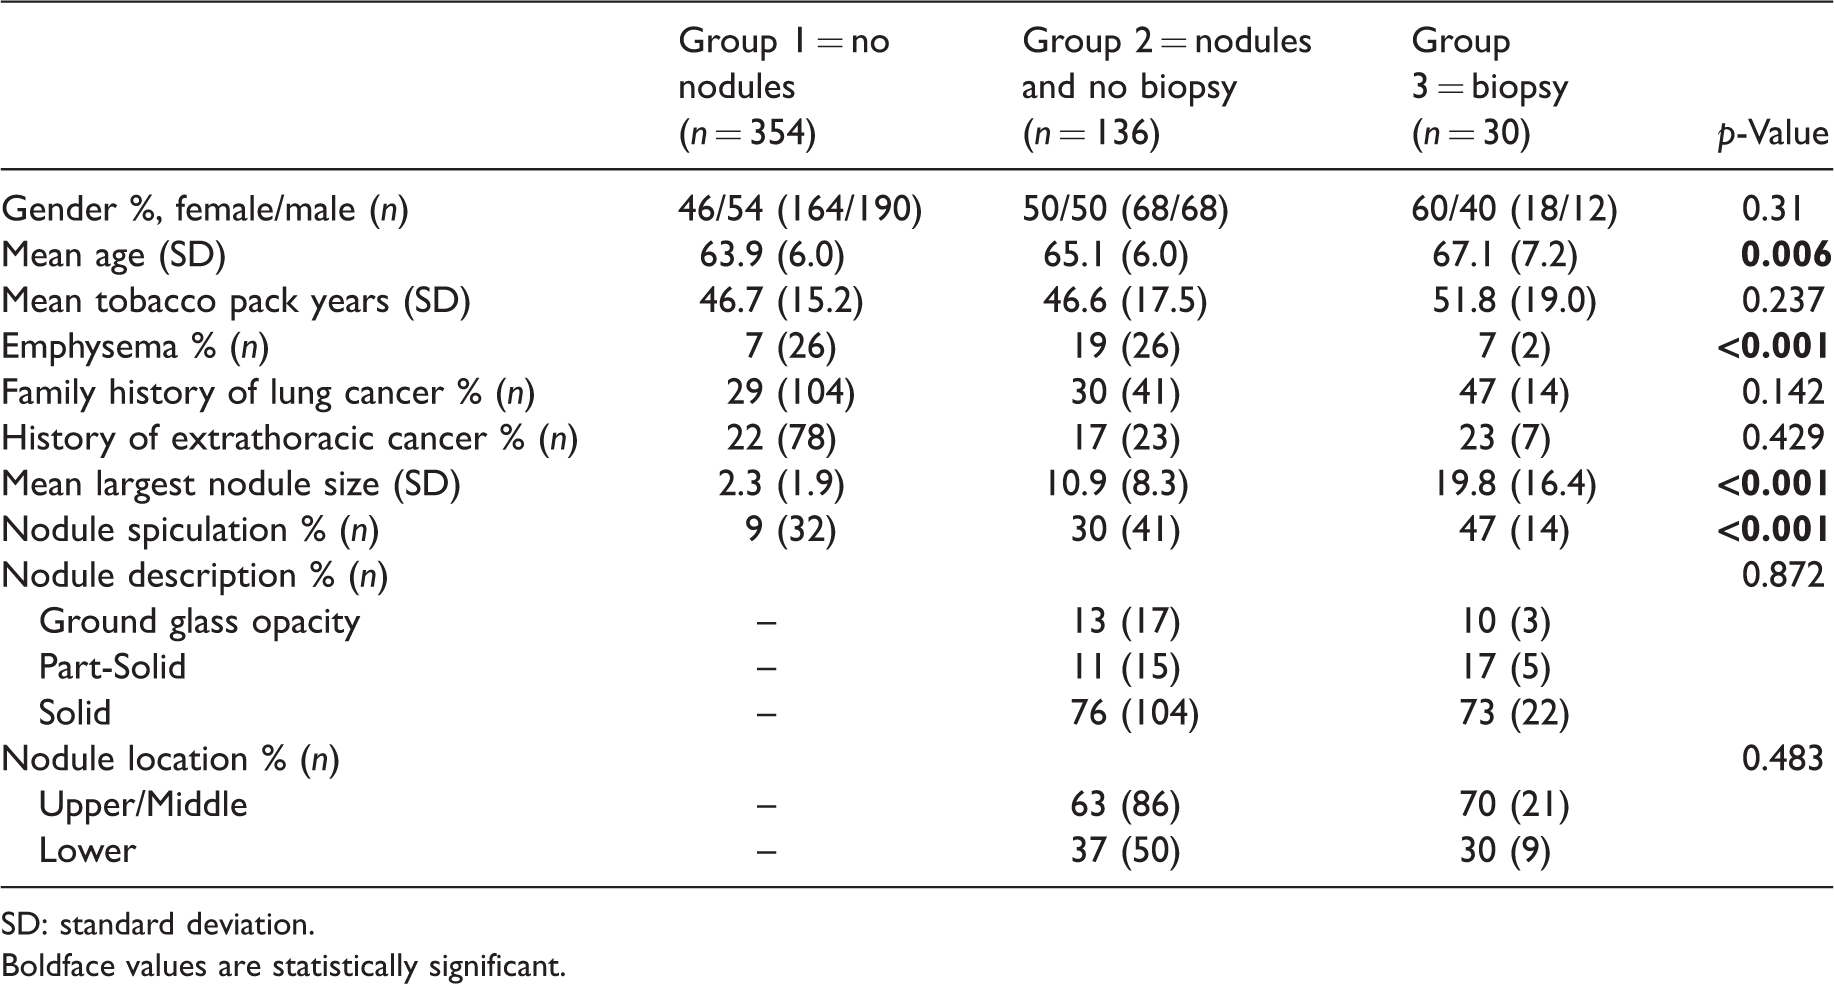
SD: standard deviation.Boldface values are statistically significant.
Demographics and radiographic characteristics of individuals who underwent a biopsy procedure.
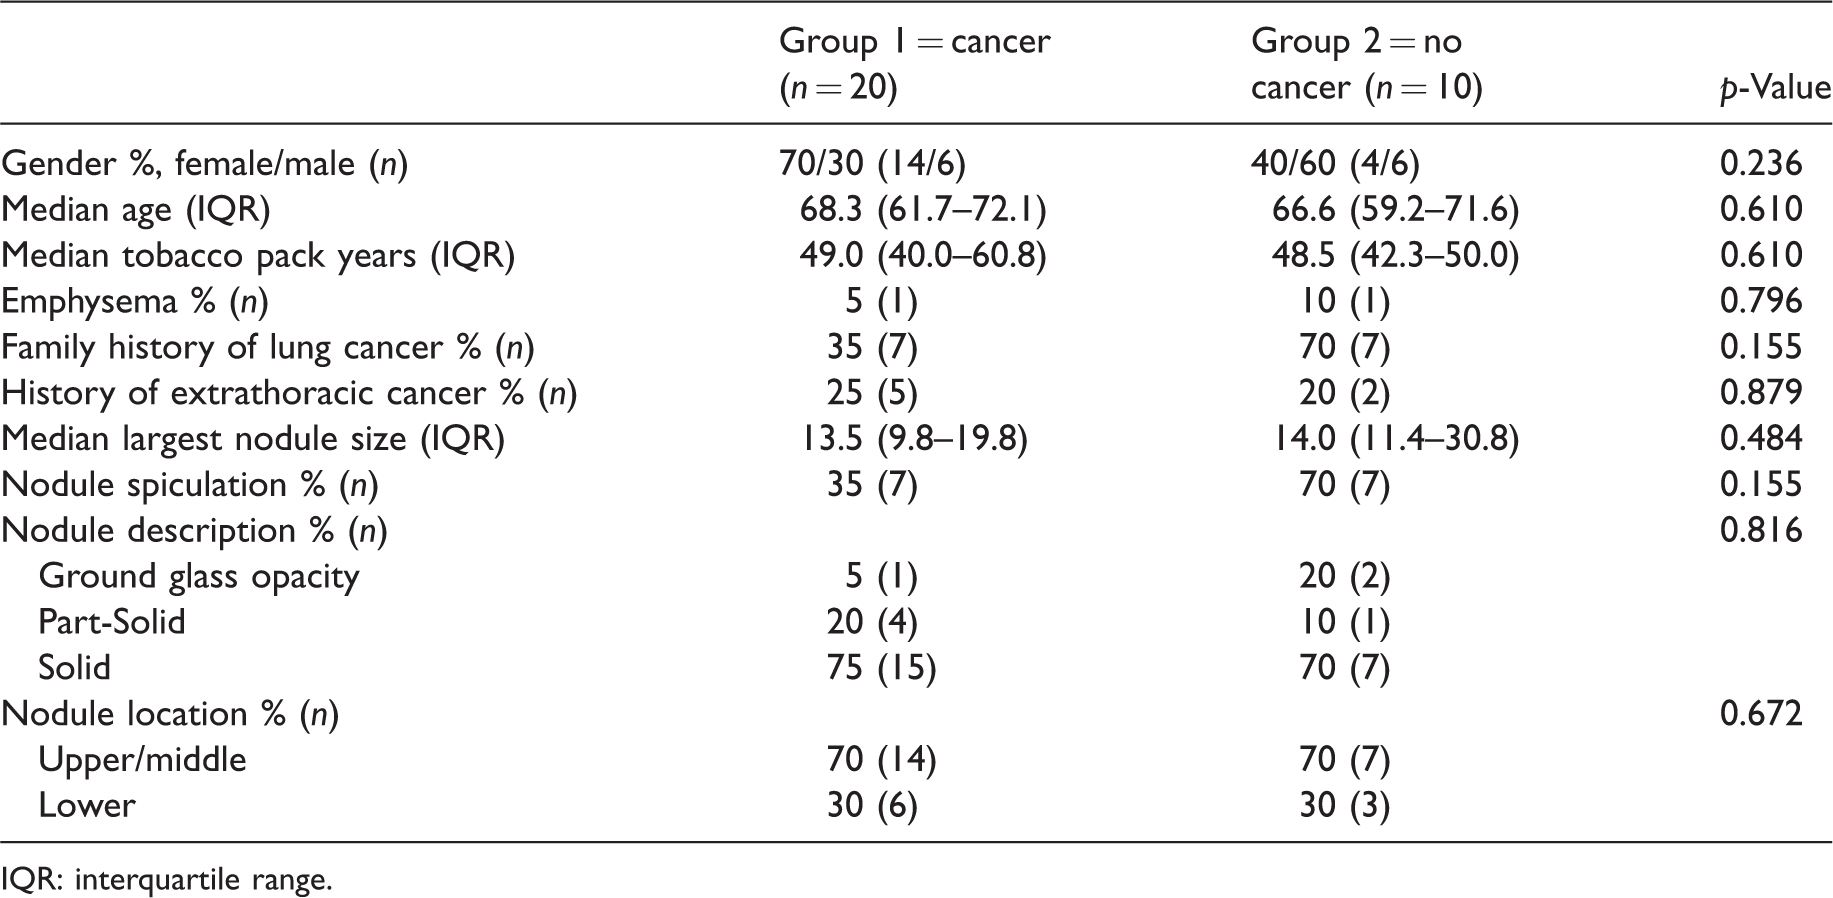
IQR: interquartile range.
Table 3 shows details of the 37 diagnostic procedures performed in 30 individuals. The incidence of carcinoma in our overall population was 3.8%, and in the nodule population, 12.0%. One diagnostic procedure was performed in 24 individuals, two diagnostic procedures in five individuals, and one participant underwent three diagnostic procedures. The overall diagnostic rate for the initial procedure ordered by the multidisciplinary team was 66.7% (20/30), and the overall diagnostic rate per individual was 86.7% (26/30). The final diagnostic outcomes of the 30 individuals selected for testing included cancer (n = 20), benign (n = 3), granulomatous inflammation (n = 2), infection (n = 1), and no diagnosis (n = 4). All individuals had a minimum of one-year follow-up from their initial enrollment in the program, and those who did not have a diagnosis of cancer remained within our LCSP, and received guideline consistent follow-up imaging. The overall procedural complication rate from diagnostic testing was 8.1% (3/37). These complications included the presence of pneumothorax requiring a chest tube (n = 3).
Procedural choice and associated diagnostic outcomes.
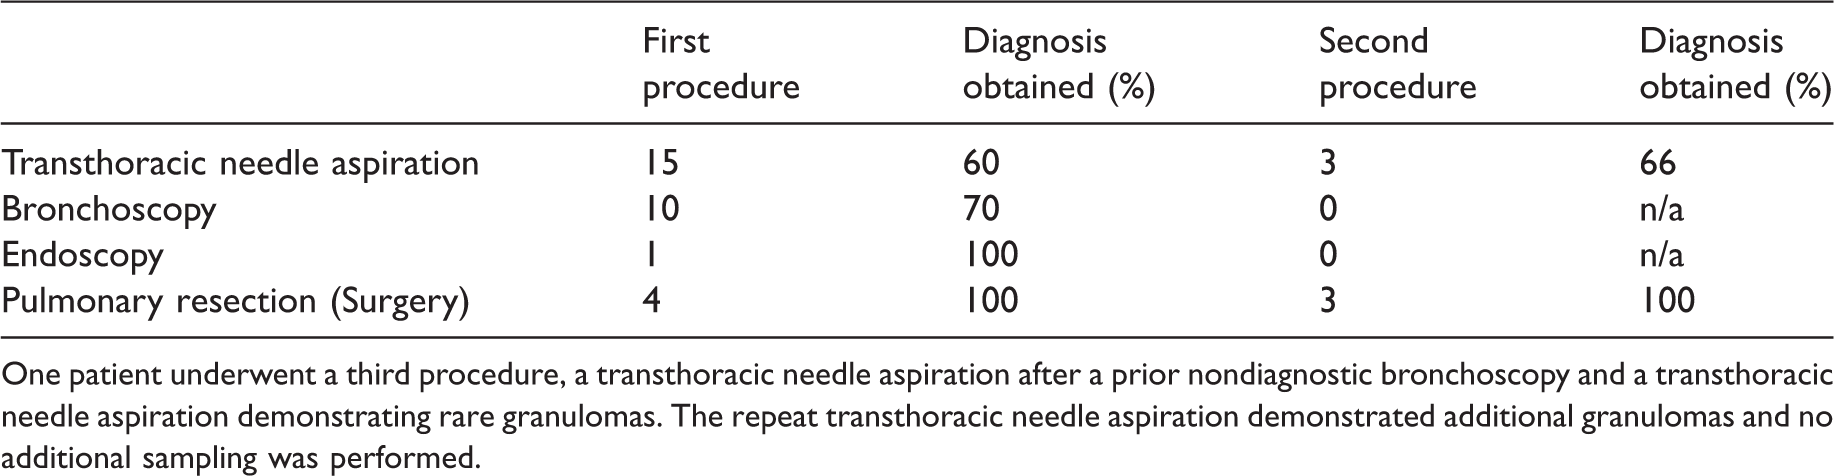
One patient underwent a third procedure, a transthoracic needle aspiration after a prior nondiagnostic bronchoscopy and a transthoracic needle aspiration demonstrating rare granulomas. The repeat transthoracic needle aspiration demonstrated additional granulomas and no additional sampling was performed.
Retrospectively calculated malignancy predictor criteria were obtained in all individuals with nodules greater than 6 mm, and compared in those who underwent diagnostic sampling with those who did not. In individuals who underwent diagnostic sampling, the median malignancy risk probability was significantly higher with the Brock calculator (p < 0.00001) and Mayo calculator (p < 0.00001), compared with those not undergoing sampling (Figure 1). However, when attempting to discriminate a final diagnosis of cancer from not cancer in only those who underwent sampling, the median malignancy risk probability was not significantly different with the Brock calculator (p = 0.912) or the Mayo calculator (p = 0.435) (Figure 2). Furthermore, retrospectively calculated malignancy risk probability when comparing all nodules (>6 mm in size) was also significantly higher with both the Brock (p = 0.0016) and the Mayo calculators (p = 0.0016) when comparing those ultimately diagnosed with malignancy with those without malignancy.
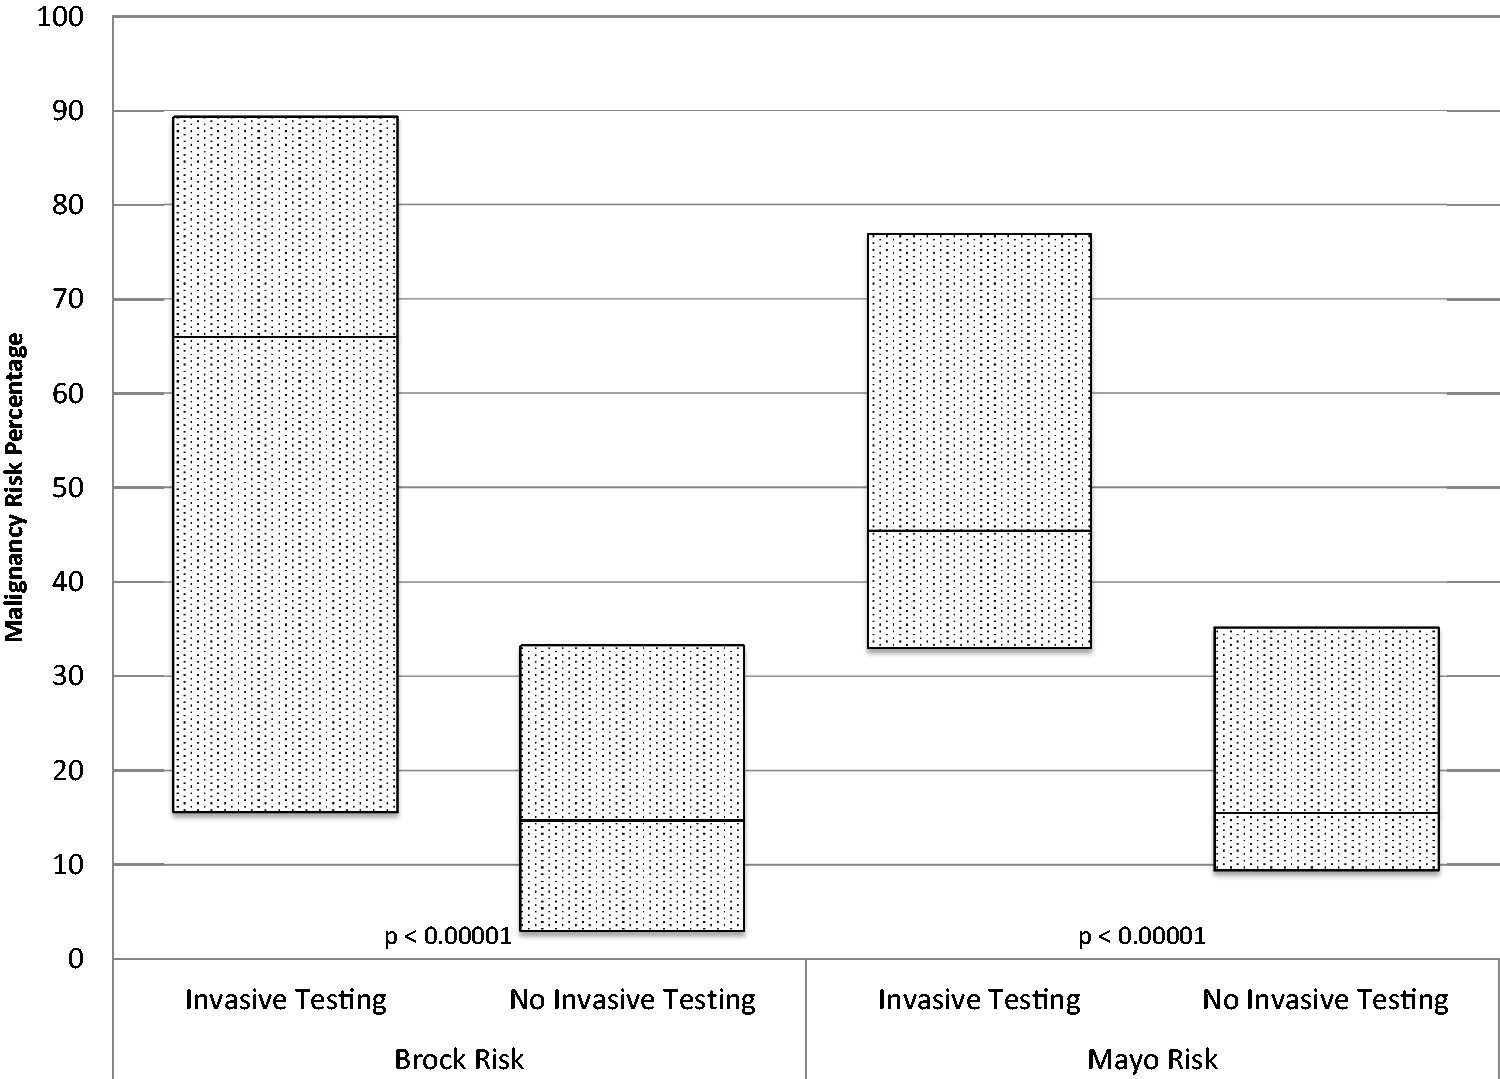
Malignancy predictor models of all individuals with nodules greater than 6 mm compared by the decision to undergo invasive testing. Data are presented in box plot form, with the uppermost line (top of the box) representing the 75%, the line within the box representing the median, and the lowermost line (bottom of the box) representing the 25%. Both the Brock and Mayo malignancy risk probability median percentages (66.0 versus 14.7 and 45.4 versus 15.5, respectively) were significantly higher (p < 0.00001 for both) when compared with those not undergoing sampling.
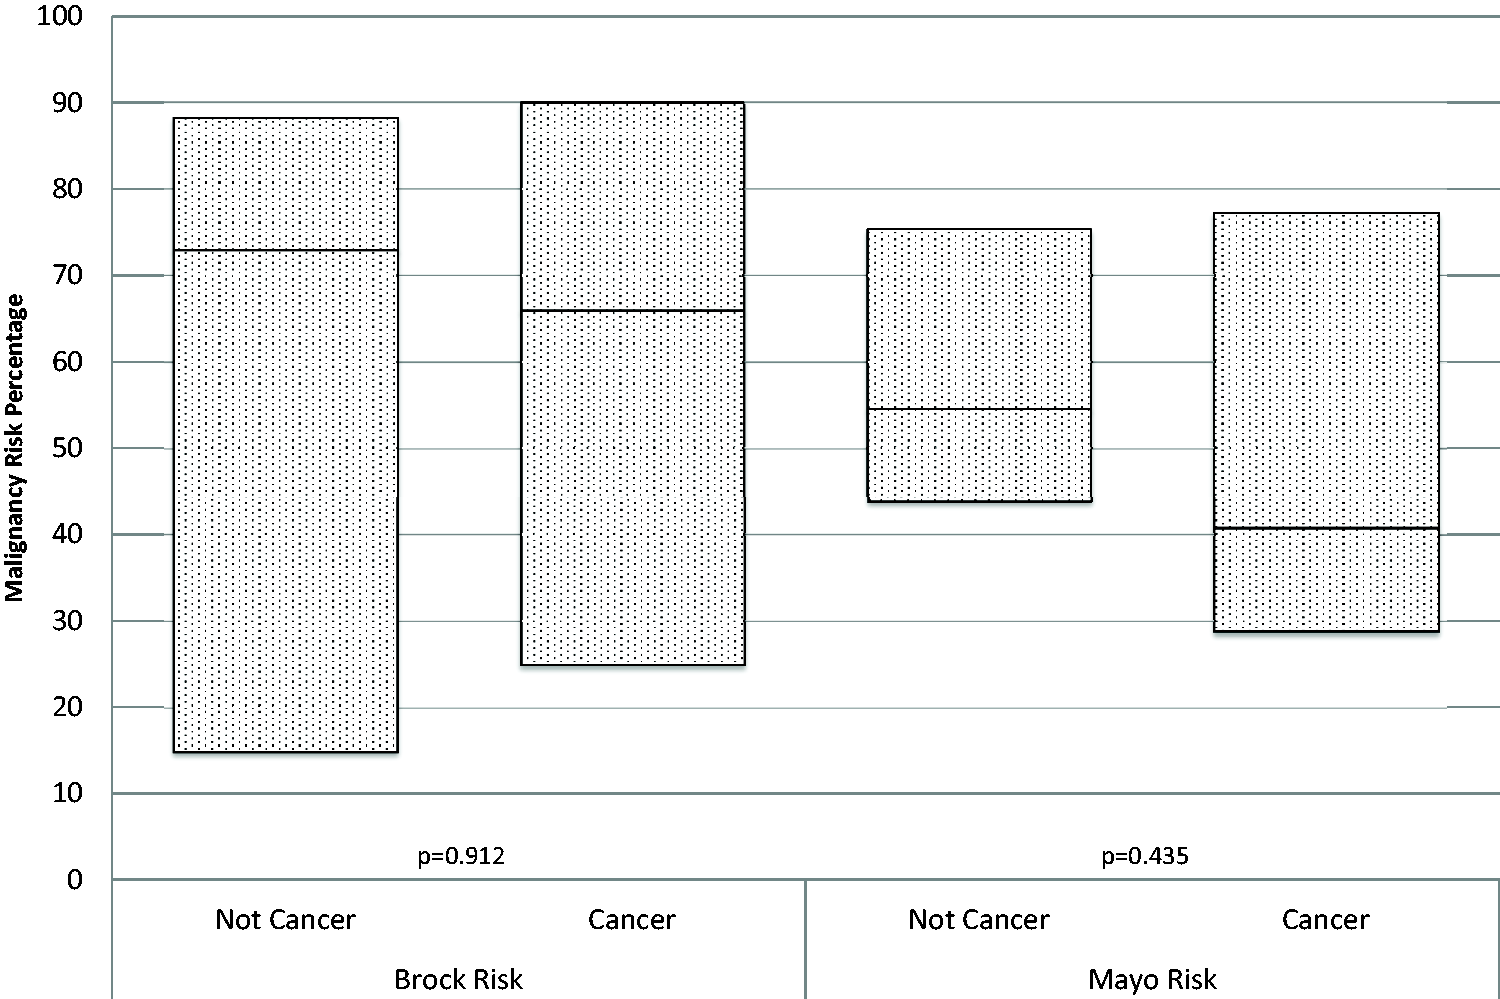
Malignancy predictor models of all individuals undergoing invasive diagnostic sampling comparing those ultimately diagnosed with malignancy with those not diagnosed with cancer. Data are presented in box plot form, with the uppermost line (top of the box) representing the 75%, the line within the box representing the median, and the lowermost line (bottom of the box) representing the 25%. Neither, the Brock or Mayo malignancy risk probability median percentages (66.0 versus 73.0 and 40.8 versus 56.6, respectively) were significantly different (Brock – p = 0.912, Mayo – p = 0.435) when attempting to discriminate a final diagnosis of cancer from not cancer.
Discussion
In our community-based nurse practitioner-led multidisciplinary LCSP, only a small proportion of individuals (5.7%) underwent invasive diagnostic testing as a result of their imaging findings, a rate comparable with that in the NLST (6.1%). 1 Our multidisciplinary team performed invasive testing for a minority of individuals, addressing some fears that LCSP may induce harm from an unnecessarily high incidence of testing and procedures.12–14 However, additional guidance is still needed for this screening population to define who should be biopsied, a frequently quoted critique of the NLST.1,15 Of those undergoing invasive testing in our LSCP, 33% ultimately did not receive a cancer diagnosis, which appears better than the reported rate in the NLST of 43%, 1 but still remains fairly high, particularly for a screening population.
The overall incidence of carcinoma in our population differs from some other studies, including populations from the Brock and Veterans Affairs (VA) calculators, and it remains unclear whether they are truly equal comparisons. Within the Brock cohort, the incidence of carcinoma among those with nodules was between 3.7% and 5.5% lower than that detected within our population (12.0%). 9 However, in the Brock cohort, lung nodules (the denominator utilized to calculate incidence) included any nodules greater than 1 mm on LDCT. This differs markedly from our criteria, as well as those in the LungRADS 16 and Fleischner 17 studies, in which positive scans included nodules of 6–8 mm or greater in size. The Mayo calculator reported a carcinoma prevalence of 23% 10 within their cohort, but again, this calculator was derived and validated within a different population, the incidental pulmonary nodule population, which is likely to have been a different population from lung cancer screening.
The use of risk scores in this population may overall be beneficial, as they may identify people and radiologic findings that are at risk for malignancy; however, there are likely to be some limitations. 18 Within our screening population, with nodules greater than 6 mm and the population chosen by our LCSP team to undergo invasive testing, the Brock and Mayo calculators appear relatively concordant in identifying individuals with a high probability of malignancy (Figures 3 and 1, respectively). However, when these risk calculators are utilized on an individual basis, and after the decision to biopsy has been entertained, the predictors appear to underperform in identifying malignancy versus no malignancy within a nodule (Figure 2). This difficulty has also been previously described; many prediction risk models work quite well on a population level, but less well on a more individual level. 18 This difference (and potential limitation) does appear present within our population. Within our groups chosen for invasive testing, all risk assessments (Brock calculator, Mayo calculator, and LCSP clinical assessment) were unable to accurately predict which individuals had a cancer and which had a nonmalignant abnormality. While the identification of tools that may predict the potential risk of developing malignancy are clearly helpful, the ability to identify a specific nodule that will be malignant would be extremely helpful in the evaluation of this high-risk population, potentially avoiding invasive biopsy procedures and the morbidity associated with such interventions.
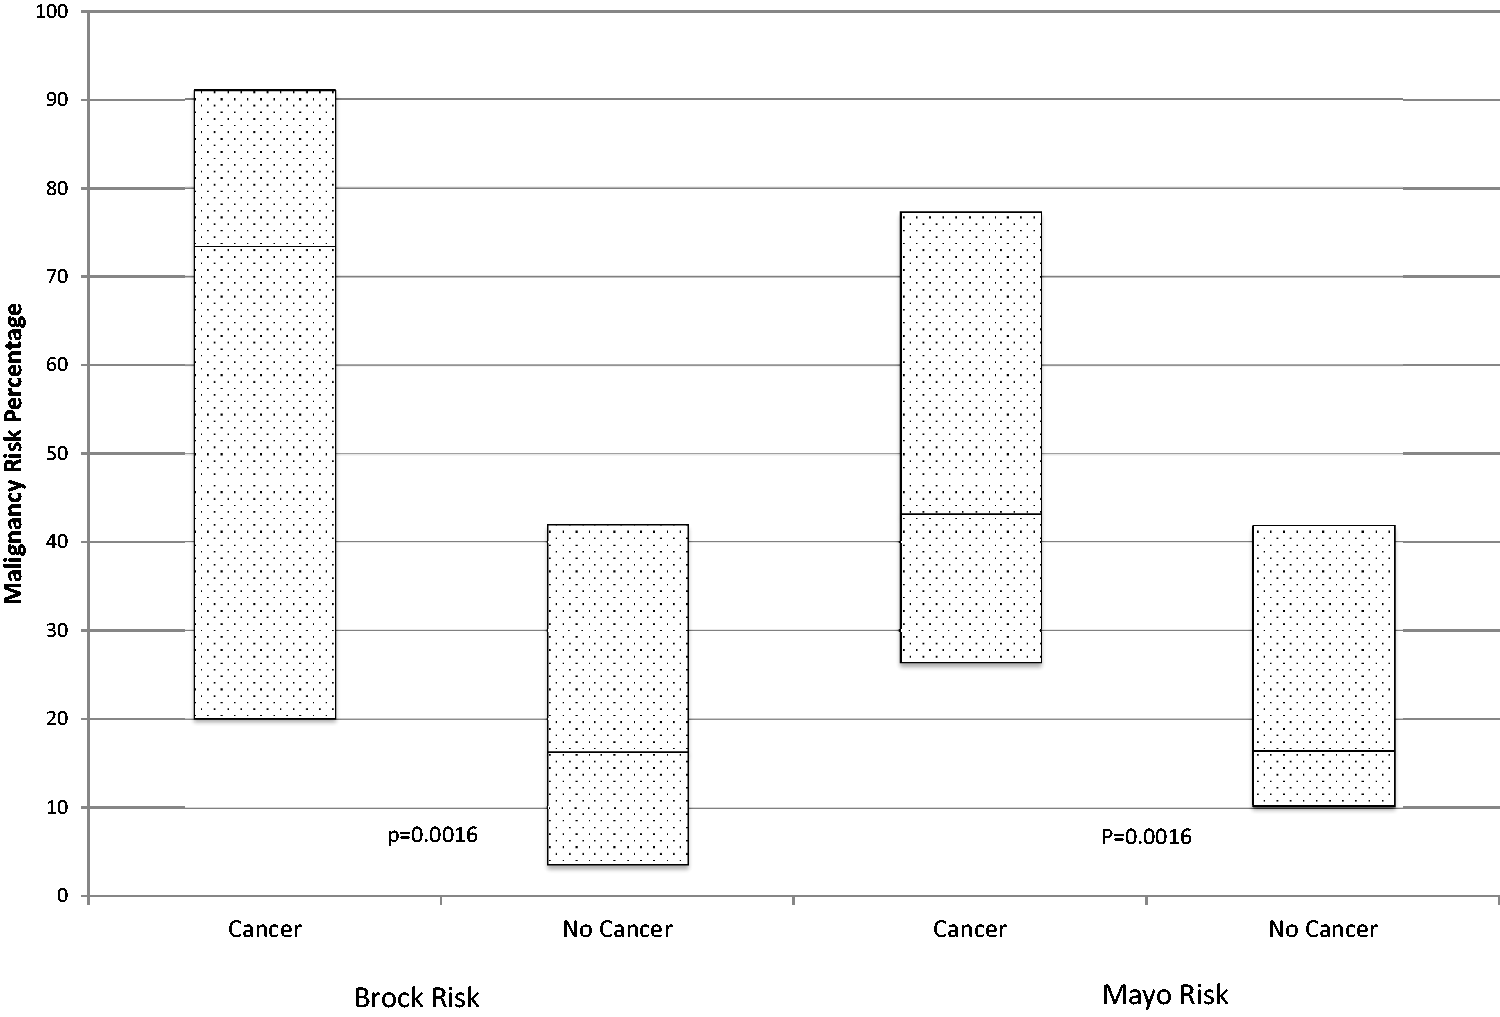
Malignancy predictor models of all individuals with nodules greater than 6 mm comparing those ultimately diagnosed with malignancy with those not diagnosed with malignancy. Data are presented in box plot form, with the uppermost line (top of the box) representing the 75%, the line within the box representing the median, and the lowermost line (bottom of the box) representing the 25%. Both the Brock and Mayo malignancy risk probability median percentages (73.4 versus 16.3 and 43.1 versus 16.4, respectively) were significantly higher (p < 0.0016 for both) when compared with those not undergoing sampling.
Both the VA 19 and Mayo 10 models of cancer probability have demonstrated accuracy in a large cohort of pulmonary nodules when retrospectively applied, 20 and prospectively, both physicians and prediction models are able to fairly accurately identify cancer (85% and 75%), but again this analysis was within a pulmonary nodule population, 21 not the lung cancer screening population. Based on the available data, it appears that experienced physicians are able to fairly accurately predict carcinoma risk, based on imaging and the clinical scenario. Participation in a multidisciplinary panel evaluating LCSP individuals and abnormal findings is likely only to lead to better care; however, with the current 1821 sites performing 107,335 exams in the year 2017, 22 it remains unclear how much multidisciplinary care and experience is available within these programs. Our retrospective application of malignancy prediction suggests that these calculators in experienced, multidisciplinary LCSP’s, are unlikely to provide additional discriminatory help in identifying patients with nodules at high risk for carcinoma. However, these risk calculators may be helpful in programs with less experience, or multidisciplinary input; this is a subject for future research.
The retrospective design of our study, which introduces inherent bias, is a limitation. Although data collection may have been missed, or individuals may have sought care at other institutions, the use of the electronic medical record for data collection probably minimizes these issues. A significant limitation remains the data surrounding the actual decision making process to biopsy. Numerous assumptions are made in a retrospective study, based on available data, timing of imaging, and procedures. Notes were not reviewed to determine why individuals did or did not undergo a biopsy procedure, nor was there any attempt to determine patient decision-making in the process. This remains a future area of study that is probably very important in this type of population, with such uncertainty in the current data.
Other limitations are that because our study was conducted at a single center its overall generalizability is not known, and that there was variable follow-up time for individuals after enrollment. As the study is retrospective, current follow-up time for individuals varies depending on LCSP entry date. Median follow-up time was a little less than 22 months, reflecting the maturity of our LCSP; however, some individuals will have only one year of follow-up while others may have up to four years’ worth of follow-up imaging. Malignancy risk predictors and the associated follow-up can vary, with some current predictors helping to identify the risk of malignancy in six years; however, this concept is more relevant to global cancer risk, as opposed to a risk calculator targeted towards a specific radiographic finding (i.e. a spiculated nodule).
Conclusion
In our nurse practitioner-led multidisciplinary LCSP, only a small proportion of participants underwent invasive diagnostic testing as a result of their imaging findings. While malignancy risk calculators appear to correlate with multidisciplinary teams in indicating concern for risk of carcinoma in a population of LCSP individuals, current risk calculators and provider clinical assessments appear to perform poorly in discriminating between the final diagnosis of cancer versus not cancer. Further research is paramount to improve the selection process for diagnostic sampling in lung cancer screening populations.
Footnotes
Declaration of conflicting interests
The author(s) declared no potential conflicts of interest with respect to the research, authorship, and/or publication of this article.
Funding
The author(s) disclosed receipt of the following financial support for the research, authorship, and/or publication of this article: This study was supported by The Center for Lung Research in Honor of Wayne Gittinger.