
Abstract
Objective
To assess whether the accuracy of risk estimation in antenatal screening for trisomy 18 using the Combined test can be improved by revising the truncation limits of two serum markers.
Methods
In an audit of data from 420 trisomy 18 and 573,754 unaffected singleton pregnancies screened at the Wolfson Institute of Preventive Medicine, London (March 2003 to June 2017), the accuracy of risk estimation was assessed by inspection of a validation plot (the median predicted late first trimester Combined test risk plotted against observed prevalence within categories of predicted risk estimates). Using validation and probability plots, we assessed whether the revised pregnancy-associated plasma protein A (PAPP-A) and free β-human chorionic gonadotrophin (free β-hCG) truncation limits led to more accurate risk estimation and improved screening performance.
Results
With the lower truncation limits currently used for PAPP-A and free β-hCG (0.15 and 0.30 multiples of the median [MoM], respectively), risk was underestimated. Revised lower truncation limits of 0.05 MoM for both PAPP-A and free β-hCG led to greater accuracy, with an increase in the number of trisomy 18 pregnancies detected (from 85.4% to 90.2%) for a small increase in the false-positive rate (from 0.20% to 0.29%) at a 1 in 100 late first trimester risk cut-off.
Conclusion
The revised truncation limits for PAPP-A and free β-hCG increase the accuracy of trisomy 18 risk estimation and improve screening performance using the Combined test. Validation and probability plots are useful in setting screening marker truncation limits.
Introduction
In the late first trimester, average levels of pregnancy-associated plasma protein A (PAPP-A) and free β-human chorionic gonadotrophin (free β-hCG) are about 80% lower in pregnancies with trisomy 18 compared with unaffected pregnancies. 1 The ultrasound marker nuchal translucency is about twice as high in affected pregnancies as unaffected pregnancies. 1 Using these markers together with maternal age (the Combined test) can identify about 85% of trisomy 18 pregnancies with a false-positive rate of about 0.2%.1,2
The accuracy of risk estimates in screening can be assessed by inspection of a validation plot.3,4 Risk estimates generated by the test are ranked and put into categories, with approximately equal numbers of affected pregnancies in each. Within each category, the median predicted risk and the observed prevalence of the disorder being screened for are calculated. If the test is accurate, when the median predicted risk is plotted against the observed prevalence, the points will lie on a straight diagonal line, i.e. where predicted risk is equal to observed prevalence. If the test is discriminatory, all but the last point will tend towards the bottom left hand corner of the plot, i.e. where both the median predicted risk and observed prevalence are high, and the last point will tend toward the top right of the plot. 4
Upper and lower truncation limits are applied to marker levels in antenatal screening to avoid extreme values having an unduly large impact on the estimated risk of having an affected pregnancy. If the screening marker value is greater (or lesser) than the specified upper (or lower) truncation limit, the limit is used in risk estimation. 5 In antenatal screening for trisomy 18, lower truncation limits of 0.15 and 0.30 multiples of the median (MoM) for PAPP-A and free β-hCG1,2 are currently in use. Given that the median PAPP-A and free β-hCG MoM values in affected pregnancies are both 0.16, 1 a large proportion of affected pregnancies have their MoM values truncated. In auditing the Wolfson Institute of Preventive Medicine (London) antenatal screening programme, the detection and false-positive rates of the Combined test for trisomy 18 were close to those expected based on previous modelling, 1 but validation plots indicated an underestimation of risk, especially at lower risks. We used data from this screening programme to investigate this, and to explore whether the lower PAPP-A and free β-hCG truncation limits need to be revised.
Methods
Data on 420 trisomy 18 pregnancies and 573,754 unaffected pregnancies screened at the Wolfson Institute between March 2003 and June 2017 were available. Almost all (98%) were screened between 11 and 13 weeks’ gestation. PAPP-A and free β-hCG were assayed using the AutoDELFIA® Immunoassay (Perkin Elmer, Turku, Finland) until January 2012, and then using the Cobas® Immunoassay (Roche, Mannheim, Germany). MoM values for the Combined test markers were calculated using Alpha software (Logical Medical Systems Ltd). Probability plots were generated for PAPP-A and free β-hCG MoM values in trisomy 18 and unaffected pregnancies and inspected to determine if the lower truncation limits for these two markers could be reduced from those previously specified (0.15 MoM for PAPP-A and 0.30 MoM for free β-hCG).1,2 In unaffected pregnancies, the probability plots were generated after censoring values below the 0.01st centile and above the 99.99th centile (0.05 and 6.72 MoM for PAPP-A, 0.08 and 14.05 MoM for free β-hCG).
For each pregnancy, the (late first trimester) risk of being affected with trisomy 18 was estimated using previously described methods and parameters, including the previously specified lower truncation limits for PAPP-A and free β-hCG.1,2 To assess the accuracy of risk estimation, a validation plot was generated using 10 categories of risk estimates. Validation plots were also created with risks re-estimated using lower truncation limits of 0.10 and 0.05 MoM for PAPP-A, and for 0.25, 0.20, 0.15, 0.10, and 0.05 MoM for free β-hCG. Detection and false-positive rates were calculated using a 1 in 100 late first trimester risk cut-off, and risk cut-offs and detection rates calculated for a 0.2% false-positive rate. Stata Version 14 was used for all analyses.
Results
Figure 1 shows the probability plot of PAPP-A expressed in MoM values (vertical axis) against centile value. About 35% (144/420) of trisomy 18 pregnancies have values below the current lower truncation limit of 0.15 MoM, and as a result would be expected to have underestimated risk estimates. Figure 2 shows, in similar way to Figure 1, the probability plot for free β-hCG. About 70% (294/440) of trisomy 18 pregnancies have values below the current lower truncation limit of 0.30 MoM and again would be expected to have underestimated risk estimates. Figure 3(a) shows a validation plot for the Combined test using the existing truncation limits for PAPP-A and free β-hCG. The points deviate from the diagonal line of identity where predicted risk is equal to observed prevalence. With lower truncation limits of 0.05 MoM for both PAPP-A and free β-hCG, less than 2% of trisomy 18 pregnancies have values below the limits (7/420 and 8/420, respectively). Figure 3(b) shows a validation plot using 0.05 MoM as the lower truncation limit for both PAPP-A and free β-hCG; there is less deviation in the points from the line of identity compared with Figure 3(b), indicating that risk estimation is more accurate with the lower limits of 0.05. Validation plots using a lower truncation limit of 0.10 MoM for PAPP-A and 0.10, 0.15, 0.20 or 0.25 MoM for free β-hCG indicated less accuracy than 0.05 MoM for both (data not shown).
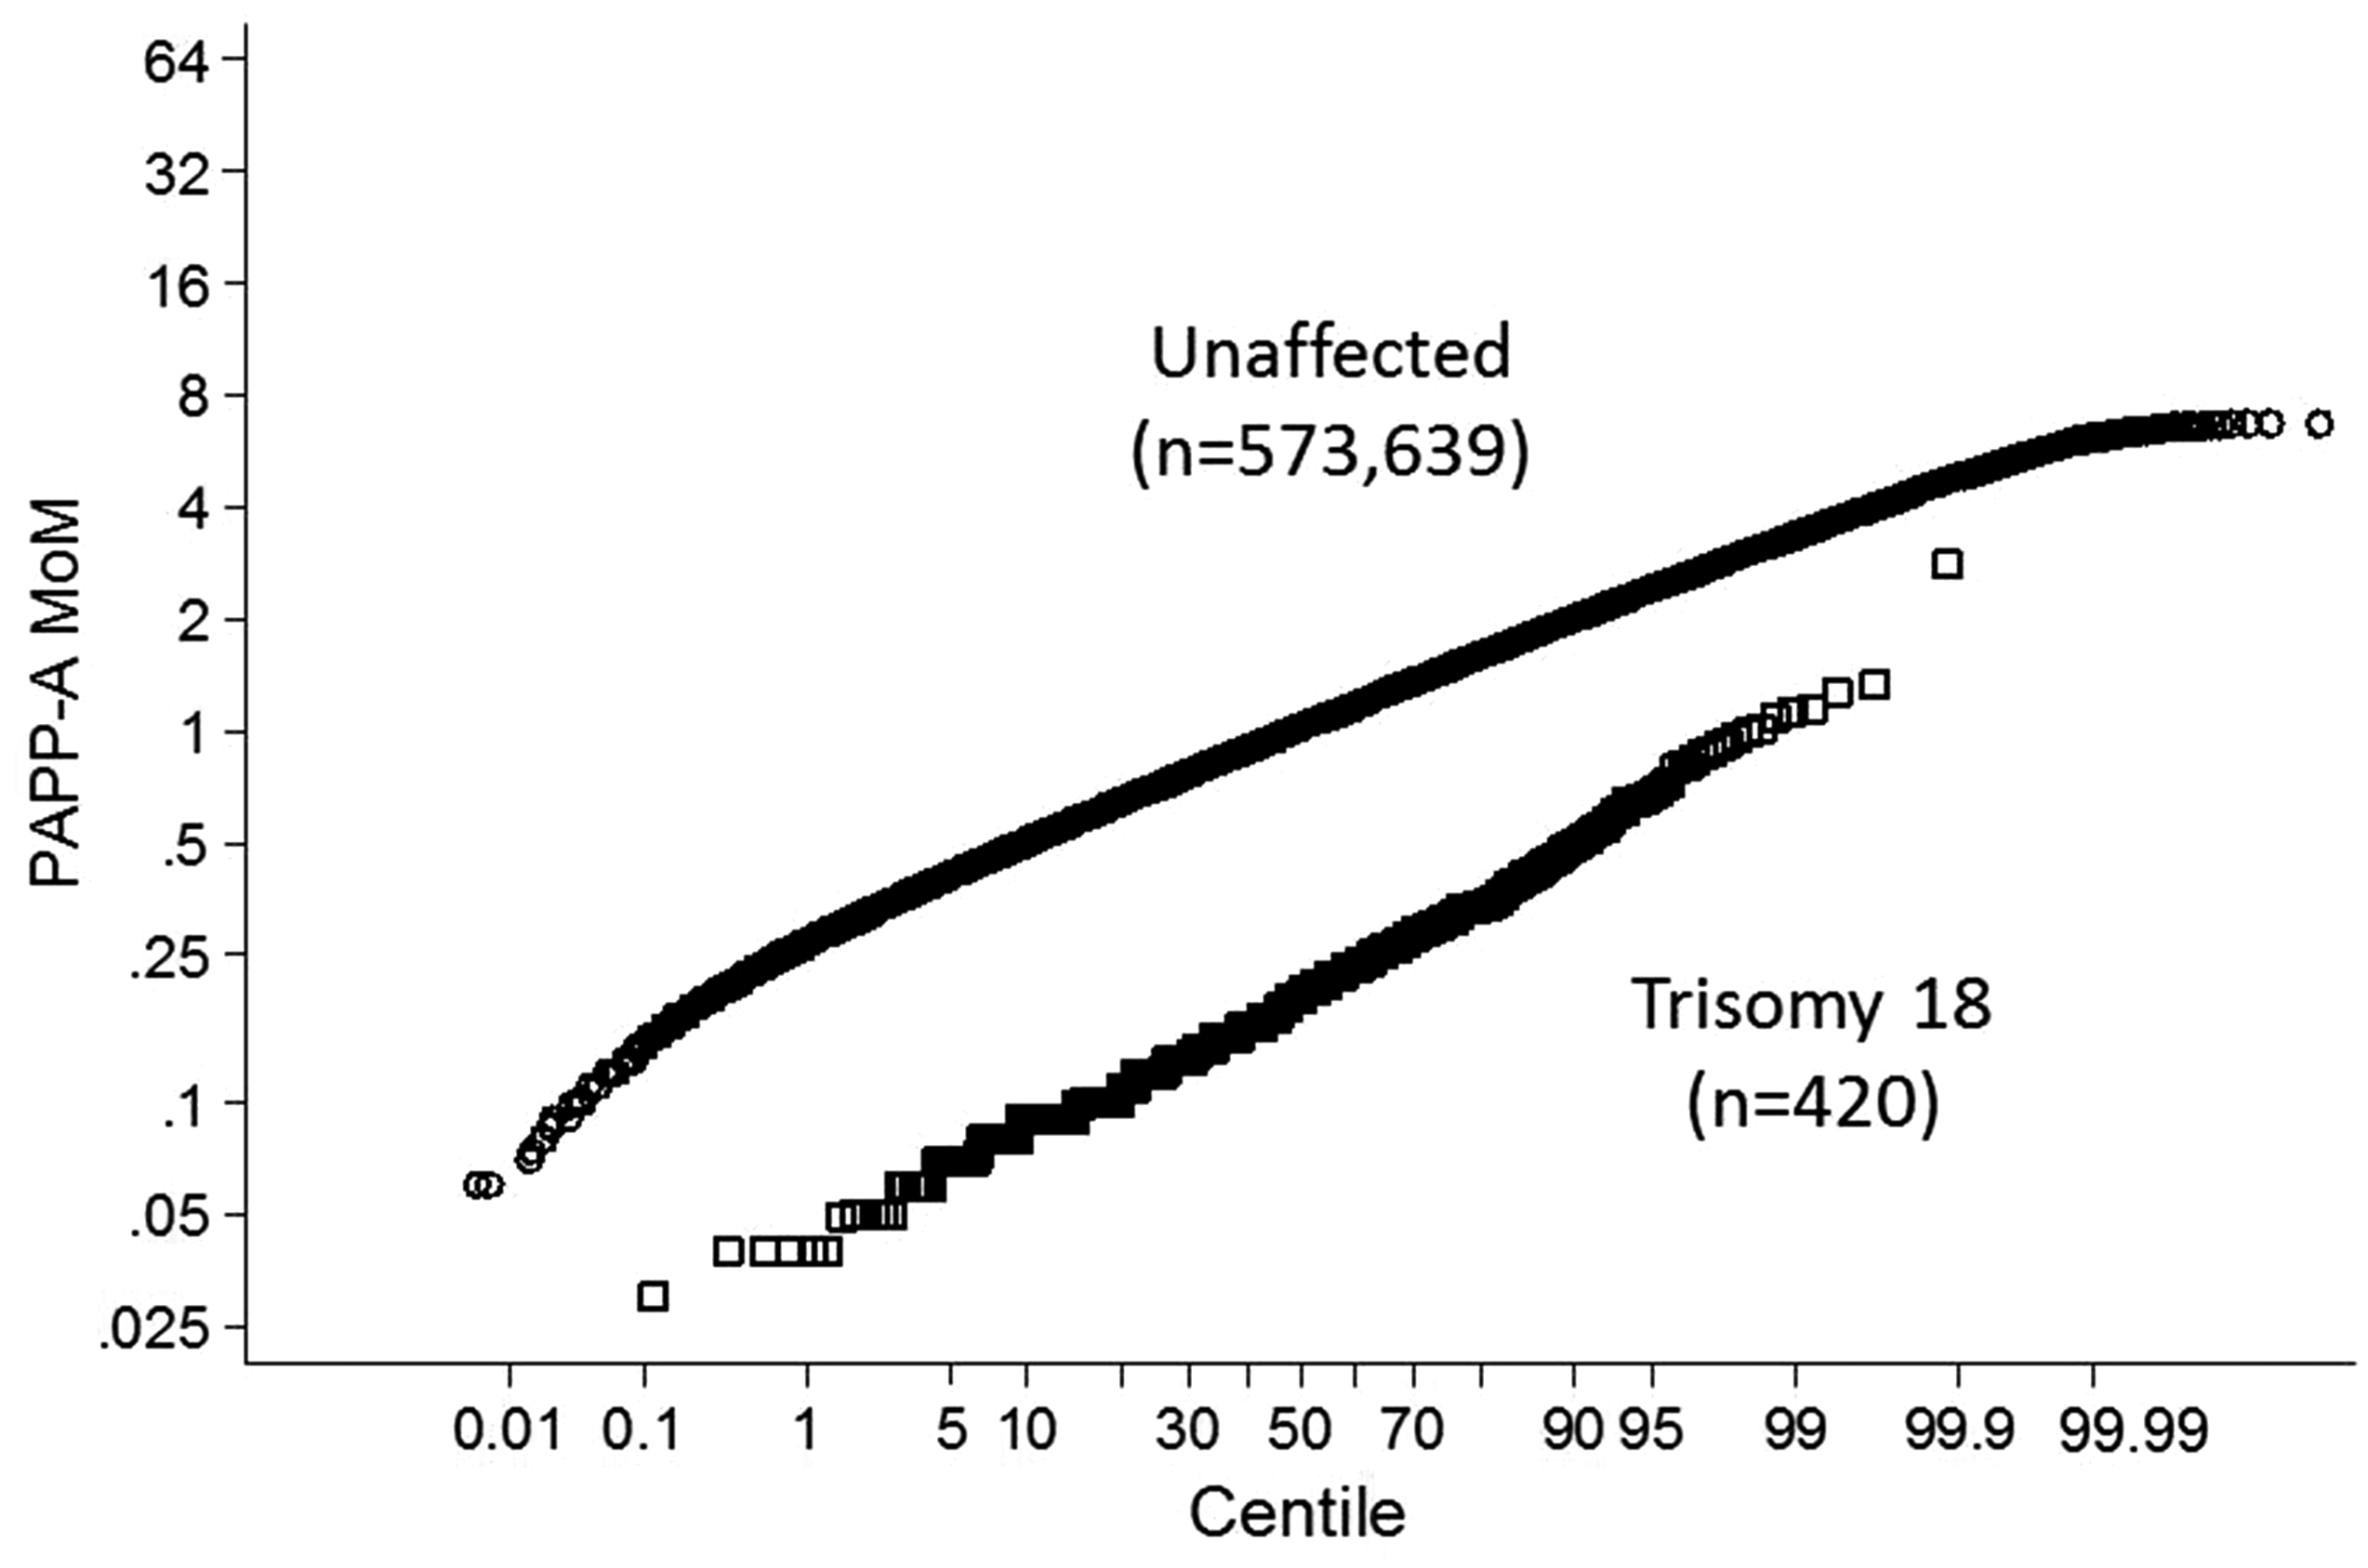
Probability plot of PAPP-A multiple of the median (MoM) values in unaffected and trisomy 18 pregnancies. PAPP-A: pregnancy-associated plasma protein A.
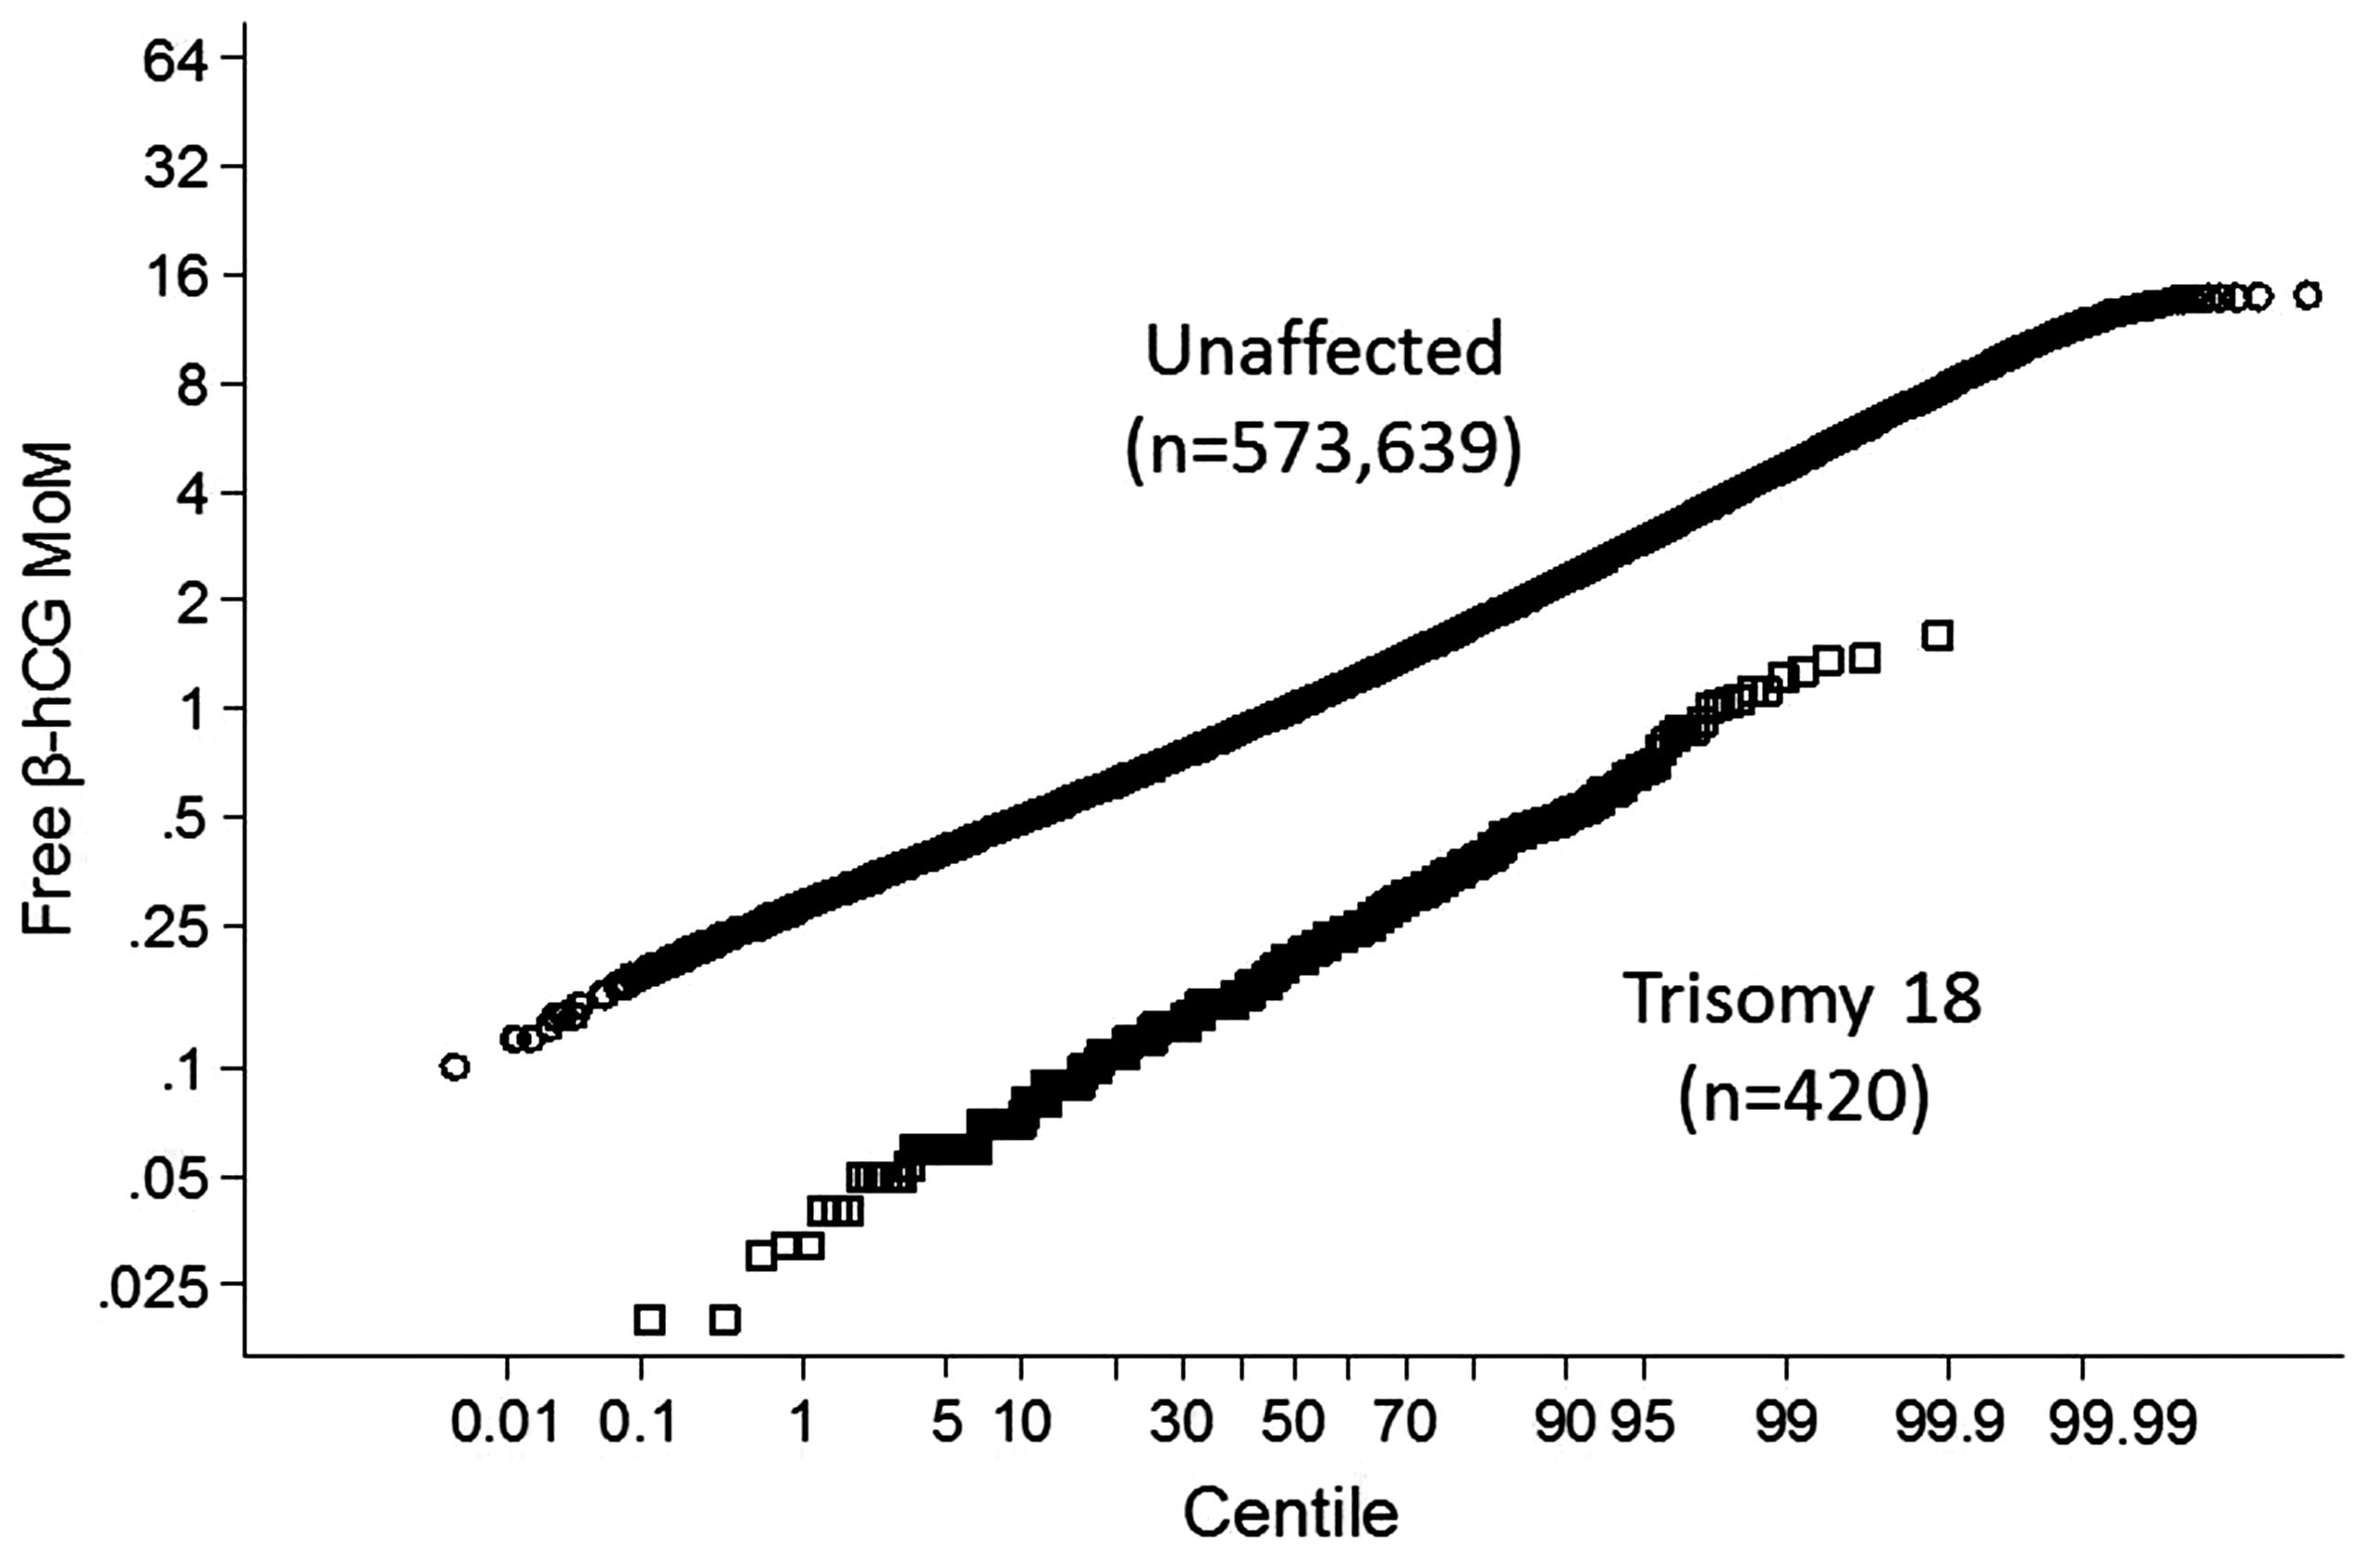
Probability plot of free β-hCG multiple of the median (MoM) values in unaffected and trisomy 18 pregnancies. β-hCG: β-human chorionic gonadotrophin.
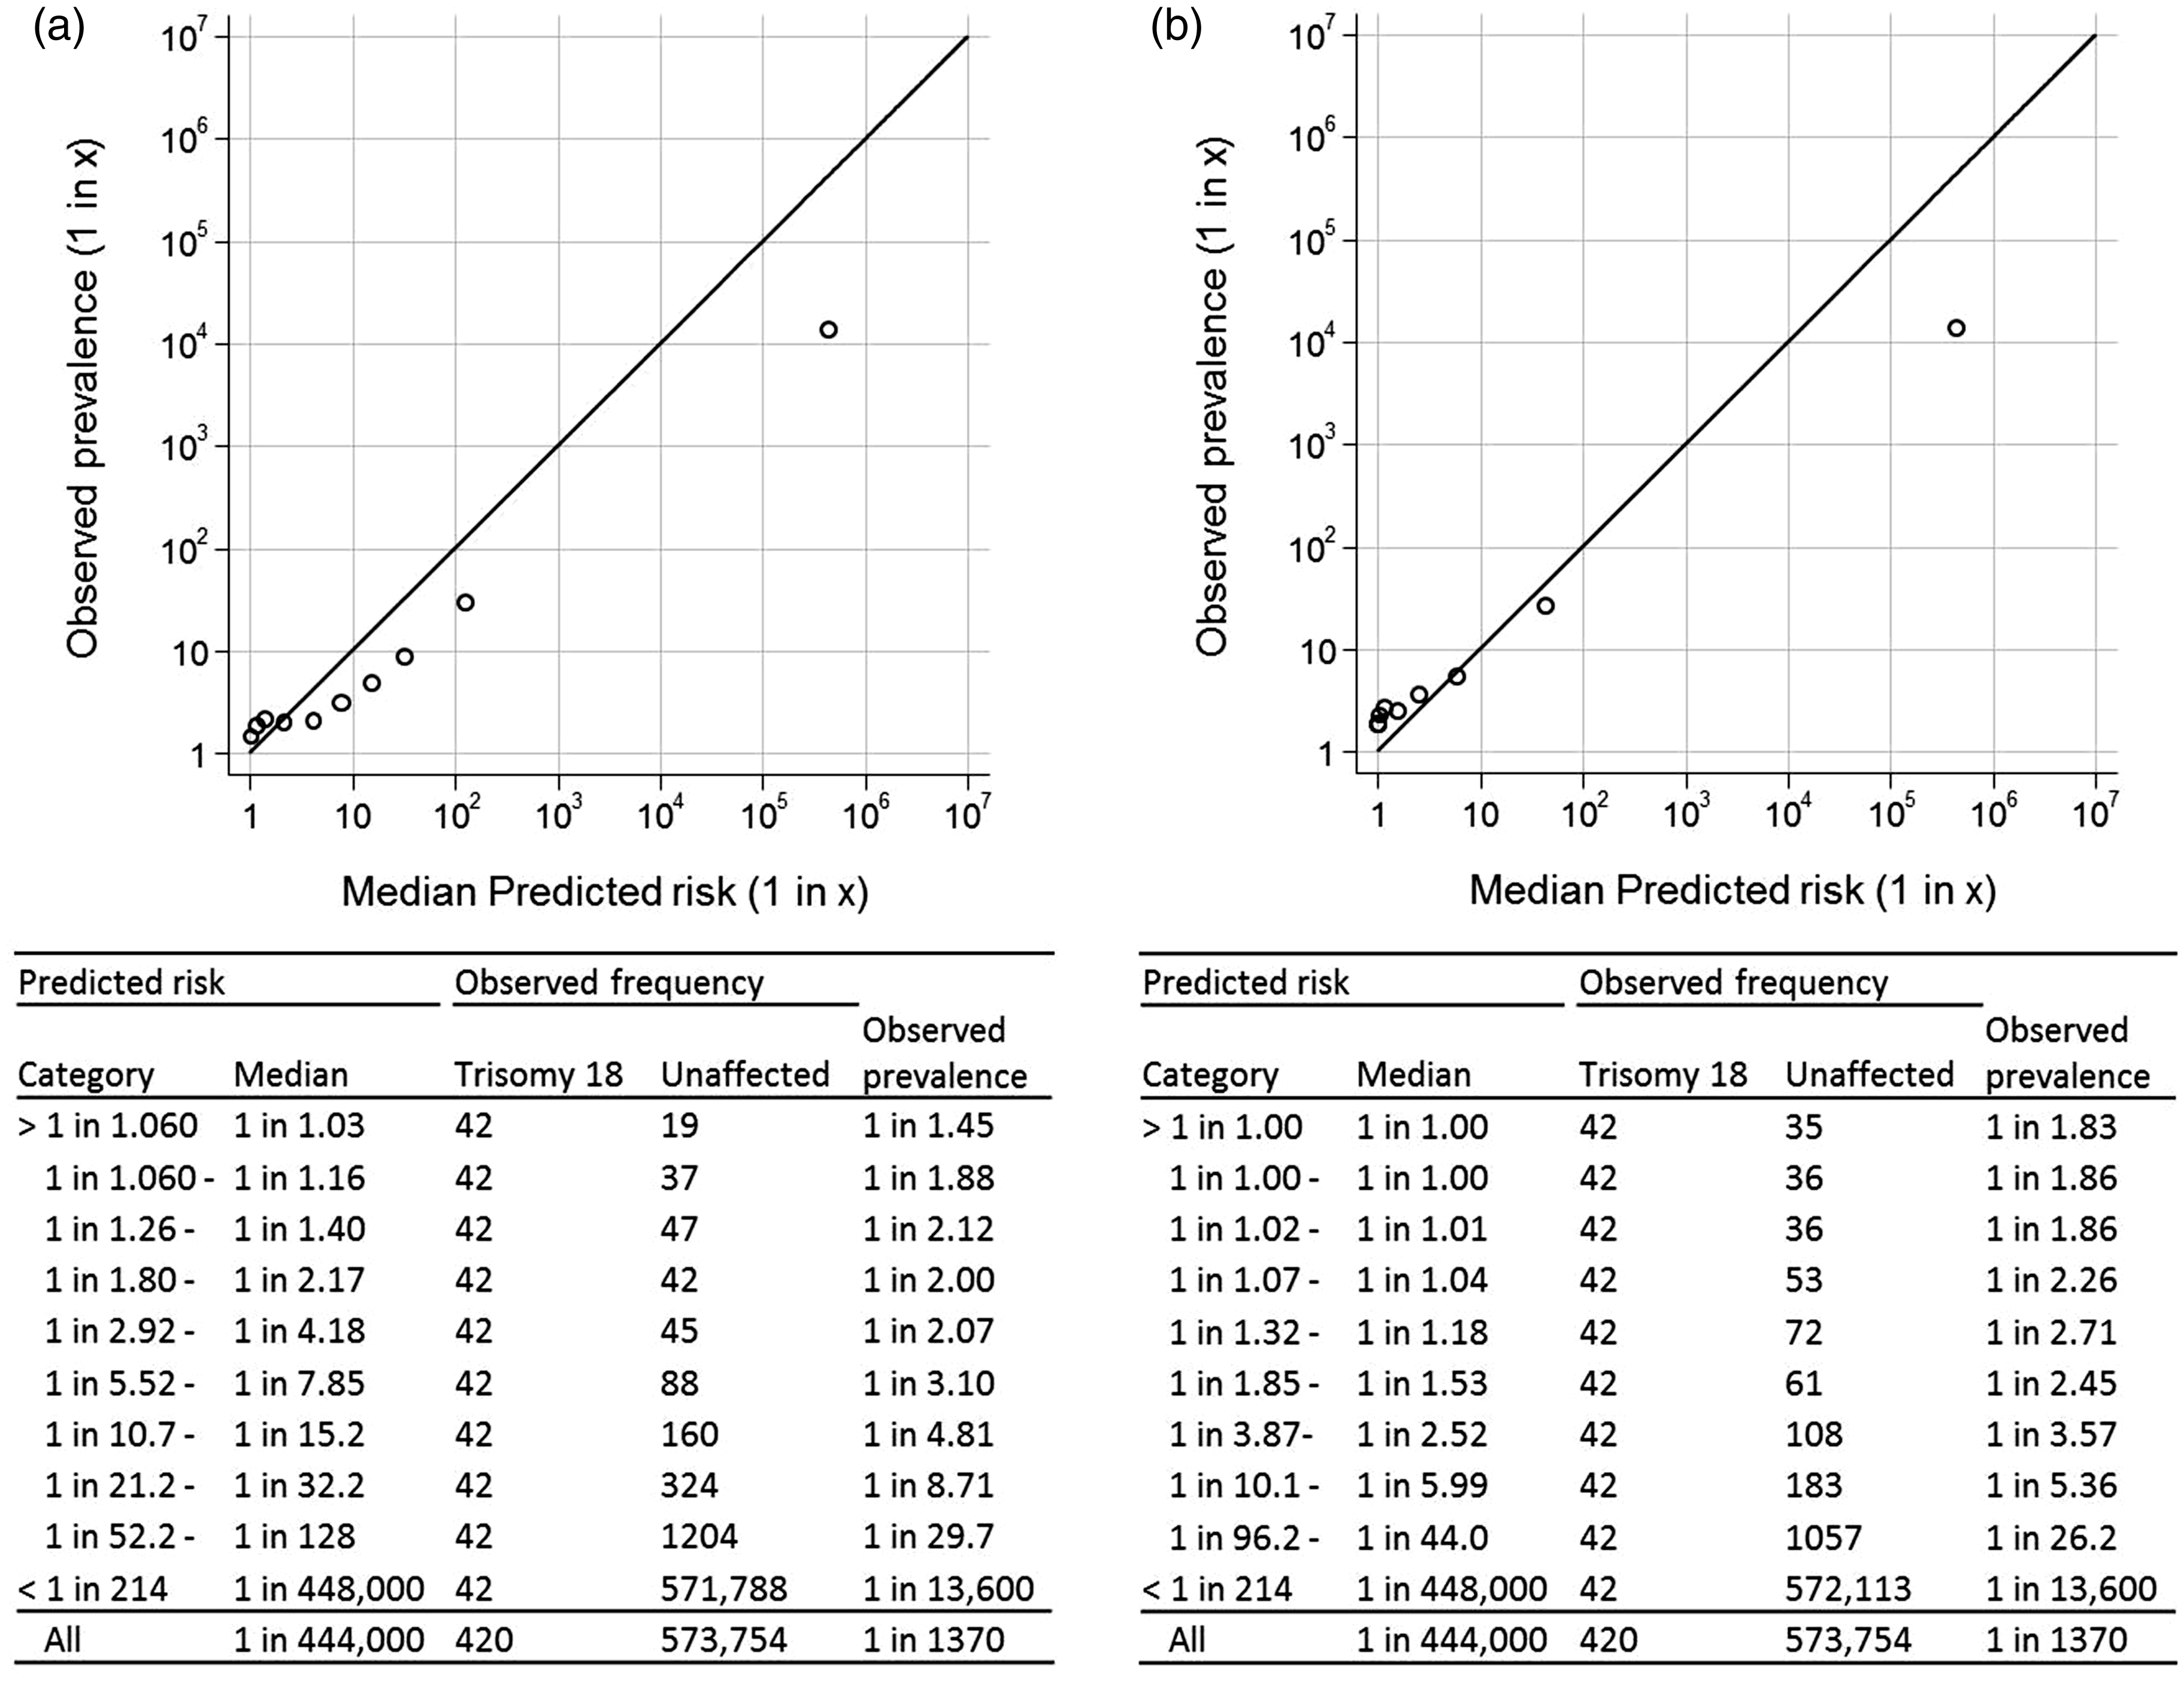
Validation plots for the Combined test in screening for trisomy 18 according to lower truncation limits used for PAPP-A and free β-hCG (risk at late first trimester). (a) Lower truncation limits; PAPP-A 0.15 MoM, free β-hCG 0.30 MoM; (b) lower truncation limits; PAPP-A 0.05 MoM, free β-hCG 0.05 MoM. PAPP-A: pregnancy-associated plasma protein A; β-hCG: β-human chorionic gonadotrophin; MoM: multiple of the median.
Table 1 shows the screening performance of the Combined test using the previously specified truncation limits and using revised lower truncation limits of 0.05 for both PAPP-A and free β-hCG. With the currently used lower truncation limits at a 1 in 100 risk cut-off, 359/420 (85.4%) trisomy 18 pregnancies are detected, with 1151 false-positives (0.20%). With the reduced lower truncation limits, more trisomy 18 pregnancies are detected: 379/420 (90.2%) at the expense of an increase in the number of false-positives: 1678 (0.29%). However, for a 0.2% false-positive rate, the detection rate increases from 85.5% (risk cut-off 1 in 99) with the current lower truncation limits to 88.1% (risk cut-off 1 in 47) with the reduced lower truncation limits.
Observed screening performance according to truncation limits used in risk estimation.
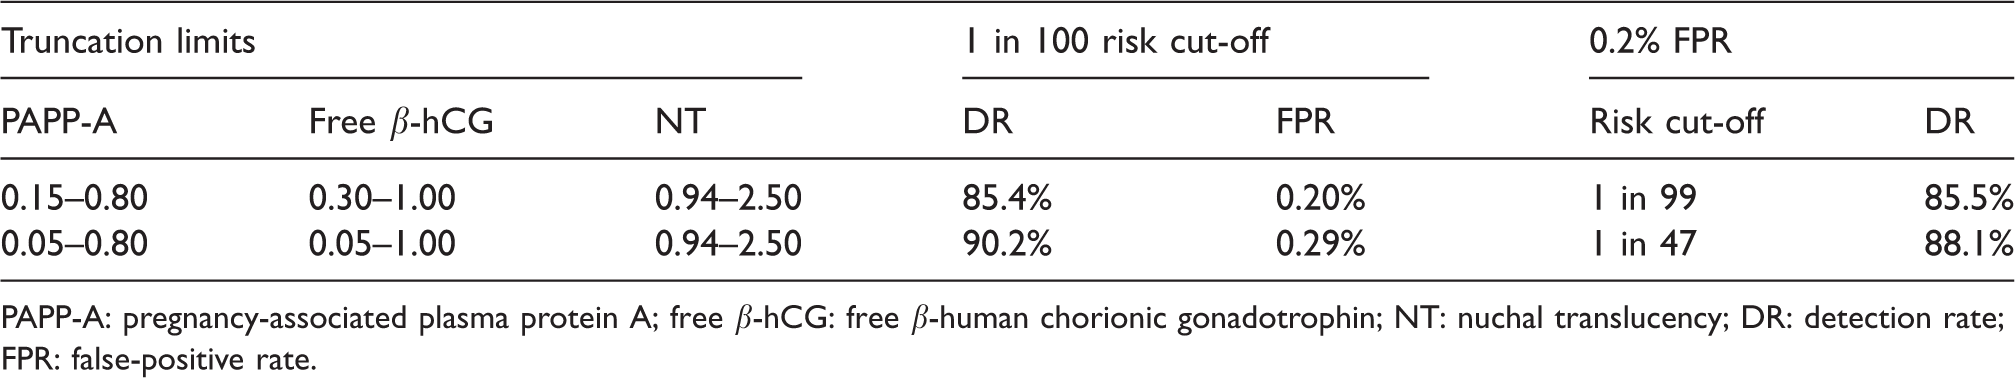
PAPP-A: pregnancy-associated plasma protein A; free β-hCG: free β-human chorionic gonadotrophin; NT: nuchal translucency; DR: detection rate; FPR: false-positive rate.
Discussion
Our results show the value of setting the lower truncation limits to 0.05 MoM for both PAPP-A and free β-hCG in antenatal screening for trisomy 18. The lower truncation limit of 0.05 MoM was above the sensitivity of the two assays (4–5 mIU/L for PAPP-A and 0.2–0.3 ng/ml for free β-hCG). The use of the existing truncation limits (0.15 MoM for PAPP-A and 0.30 MoM for free β-hCG) leads to an underestimation of the risk of trisomy 18 (Figure 3(a)), while the revised lower truncation limits for PAPP-A and free β-hCG lead to more accurate risk estimation for individual women (Figure 3(b)). This study illustrates the value of validation plots in auditing antenatal screening programmes, by revealing the underestimation of trisomy 18 risks that prompted this study.
In Figure 3(a) and (b), the highest point representing the lowest risk category falls well below the line of identity, suggesting an underestimation of risk in this category. This is a limitation of the method, previously described, 3 that affects the plotting of this one point only. The limitation arises from the need to place a number of trisomy 18 pregnancies in the lowest risk category because the data are categorized according to ranked groups of risk in affected pregnancies. Within the lowest risk category, trisomy 18 pregnancies tend to have higher risk estimates than unaffected pregnancies in the category, and given that most unaffected pregnancies fall into the lowest risk category, the trisomy 18 pregnancies will have little influence on the median predicted risk, but still influence the prevalence of trisomy 18 (1 in 13,600 in both Figure 3(a) and (b) after rounding). The lowest risk point falling below the line of identity is therefore expected for tests with high screening performance, and should not cause concern.
The nuchal translucency median MoM in trisomy 18 affected pregnancies (1.711) is not sufficiently different from 1.0 MoM to cause the effect seen with the serum markers, and hence, no adjustment in the previously specified truncation limits (0.94 to 2.50 MoM1) is needed. Our study, based on routine UK practice, uses free β-hCG. We therefore did not have data on total hCG, which is often used in the United States; however, it is likely that truncation limits for this marker would also need to be lowered. A separate study would be useful to assess this.
Conventionally, truncation limits are determined from probability plots of the marker values separately in affected and unaffected pregnancies. There are several ways in which these limits are set: when screening marker values deviate from the Gaussian distributions used in calculating risk, when in the tails of the distributions there are too few data for a likelihood ratio to be reliably calculated at the value of the marker or when the likelihood ratio ceases to increase or decrease with more extreme values of the marker.5,6 Previous trisomy 18 truncation limits were based on large numbers (375 trisomy 18 pregnancies for PAPP-A, 2 and 224 trisomy 18 pregnancies for free β-hCG1), but did not take into account information from validation plots.
Our dataset, involving over half a million unaffected pregnancies and 420 affected pregnancies, overcomes the problem of limitations from having few data, but there remains the problem of what to make of deviations from linearity. Given the added information from the validation plots, our results show that setting truncation limits beyond the point of deviation from linearity should be more permissive, to avoid underestimating risk in affected pregnancies. The consequence is an increase in the detection rate and a small increase in false-positives, to achieve greater accuracy in risk prediction.
Extreme outlying values often fail to represent the true distribution of a serum marker, because they tend to include erroneous values and values associated with other disorders or pregnancy outcomes, such as miscarriage. Accordingly, it is appropriate to censor extreme values in describing and plotting marker distributions, including probability plots such as those in Figures 1 and 2. In this paper, we censored the lowest 0.01% of values and the highest 0.01% of values, so that the plots would, to some extent, exclude misleading outliers. Such censorship generally requires a large dataset, as was available in this study.
The use of the revised lower truncation limits increased the detection rate at a 1 in 100 risk cut-off by about 5 percentage points (from 85.4% to 90.2%), with a small increase in the false-positive rate (from 0.20% to 0.29%). The reason for this can be illustrated in a hypothetical example: a 25-year-old woman with an affected pregnancy has serum markers typical of a trisomy 18 pregnancy (PAPP-A 0.10 MoM and free β-hCG 0.20 MoM), but a nuchal translucency that is not typical of a trisomy 18 pregnancy (0.95 MoM) has a risk of 1 in 102 using the previous truncation limits, but 1 in 3 with the revised limits, which shows that truncating PAPP-A and free β-hCG at the current higher values of 0.15 and 0.30 MoM respectively, clearly underestimates risk, compared with using the revised limits (0.05 for both).
Inspection of validation plots relating to risk estimates for trisomy 21 and trisomy 13 screening using the Combined test did not indicate the inaccuracy observed in respect of trisomy 18 screening; hence, the current truncation limits used in trisomy 21 7 and trisomy 131 screening can remain unchanged.
Conclusions
Two main conclusions arise from our study. First, it is advantageous to use validation plots in conjunction with probability plots in setting screening marker truncation limits. Second, the accuracy of trisomy 18 risk estimation in first trimester antenatal screening for trisomy 18 using the Combined test is improved by reducing the lower truncation limits to 0.05 for PAPP-A and free β-hCG.
Footnotes
Declaration of conflicting interests
NJW is the director of Logical Medical Systems, which produces software for the interpretation of antenatal screening tests. The other authors declare no conflict of interest.
Funding
The author(s) received no financial support for the research, authorship, and/or publication of this article.