
Abstract
Objective
To compare the performance of antenatal screening for Down’s syndrome (DS), trisomy 18 (T18), and trisomy 13 (T13) using a single risk of being affected by one of the three disorders, with the performance using separate risks for each disorder.
Methods
Screening performance was estimated using Monte Carlo simulation based on published parameters for the Integrated, Combined, and Quadruple tests. Detection rates (DRs) were calculated using a single risk and separate risks for each disorder at given false-positive rates (FPRs).
Results
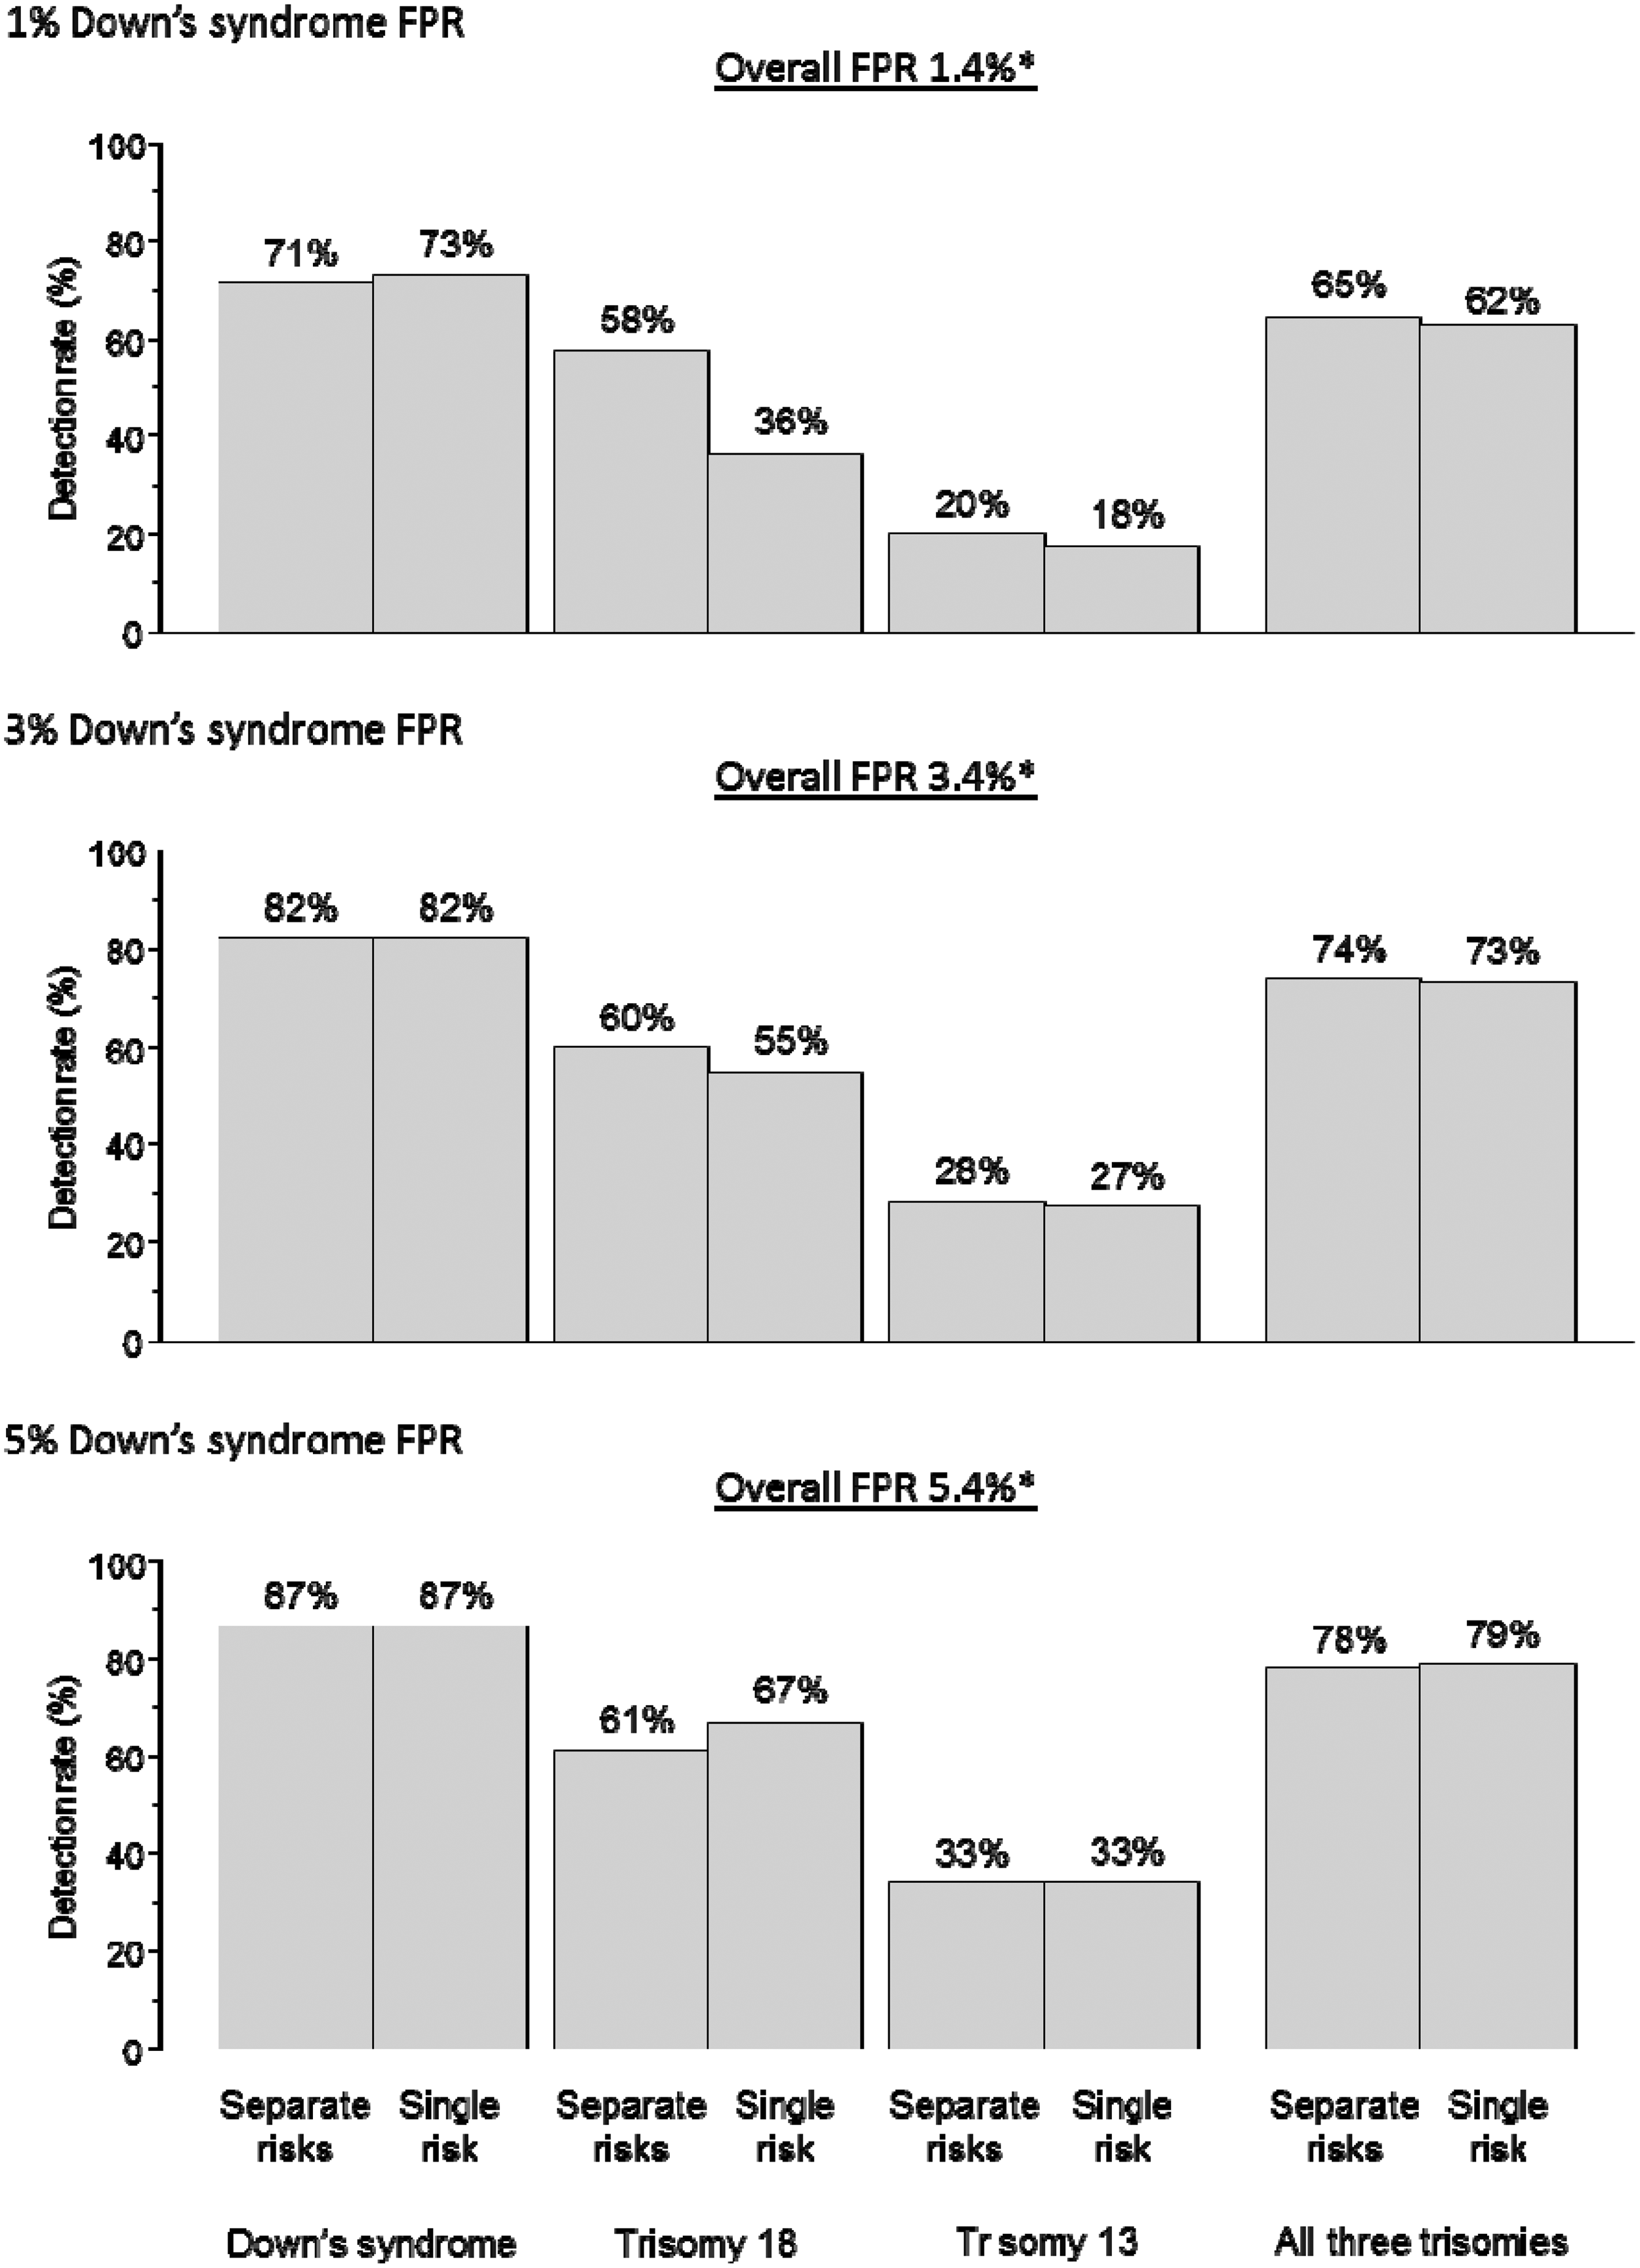
With separate risks, using a 3% DS test FPR and 0.2% FPRs for the T18 and T13 tests, the overall FPRs for the Integrated and Combined tests are both 3.3%. For the same overall FPR (3.3%), the use of a single risk with the Integrated test increases the T13 DR from 76% to 82%, with unchanged DS and T18 DRs (94% and 92% respectively). With the Combined test, it increases the T13 and T18 DRs (from 89% to 91% and 77% to 81% respectively), with unchanged DS DR (85%). With separate risks, using a 5% DS test FPR and 0.2% FPRs for the T18 and T13 tests, the overall FPR for the Quadruple test is 5.4%. For the same overall FPR (5.4%), the use of a single risk increases the T18 DR from 61% to 67% with unchanged DS and T13 DRs (87% and 33% respectively).
Conclusions
Reporting a single risk estimate for the three disorders is less confusing than reporting separate risks and can yield the same or better screening performance.
Introduction
Antenatal screening for Down’s syndrome (trisomy 21) using a combination of markers together with maternal age has been routine for about 25 years. 1 Two other trisomies, Edwards syndrome (trisomy 18) and Patau syndrome (trisomy 13) can be incidentally detected using screening markers that form part of the Down’s syndrome screening test. 2 Some centres have extended the scope of their Down’s syndrome screening programmes to include all three disorders. This poses the question of whether separate risk estimates should be reported for each of the three disorders.
A problem with reporting separate risk estimates is that different risk cut-off levels are likely to be used for each, and this may seem inconsistent. For example, a risk of 1 in 150 might be appropriate for Down’s syndrome using the Combined test (measurements of the ultrasound marker nuchal translucency [NT] and serum markers free β-human chorionic gonadotropin [hCG] and pregnancy associated plasma protein-A [PAPP-A] at 11–13 weeks’ gestation together with maternal age) because it yields an adequate detection rate (proportion of affected pregnancies with positive results) for an acceptable false positive rate (proportion of unaffected pregnancies with positive results). A risk cut off of 1 in 150 would not, however, be appropriate for trisomy 13 where there is no material improvement in the detection rate between a risk cut off of 1 in 100 and 1 in 150, but the false positive rate is higher with the 1 in 150 cut off. 2 A further problem is that separate risks cannot be simply added, multiplied, or averaged to obtain an overall risk, and the highest of the three would underestimate the overall risk that the pregnancy is affected with any one of the three disorders.
These issues prompted us to assess the implications of reporting a single risk estimate of a woman having a pregnancy with any one of these three disorders instead of separate risk estimates for each. We investigated this for the Integrated test (first trimester NT and PAPP-A, and early second trimester serum makers alphafetoprotein [AFP], unconjugated estriol [uE3], hCG and inhibin-A together with maternal age), the Combined test, and the Quadruple test (early second trimester AFP, uE3, hCG, inhibin-A and maternal age).
Methods
Monte Carlo simulation was used to estimate the screening performance for the three disorders using separate risks and performance using a single risk of having any one of the three. For each of the Integrated, Combined, and Quadruple tests, screening marker values for 1,000,000 unaffected pregnancies and 1,000,000 Down’s syndrome pregnancies were simulated, based on published marker distribution parameters (means, standard deviations, and truncation limits) in unaffected and Down’s syndrome pregnancies.
3
In determining screening performance using a single risk estimate, the relative numbers of Down’s syndrome, trisomy 18, and trisomy 13 pregnancies need to be in proportion to the early second trimester prevalence. Using the birth prevalence of Down’s syndrome
4
, the birth prevalence of trisomy 18 and trisomy 135, the fetal loss rate of Down’s syndrome
6
, and the fetal loss rate of trisomy 18 and trisomy 137, for 1,000,000 Down’s syndrome pregnancies there would be 270,535 trisomy 18 pregnancies and 95,585 trisomy 13 pregnancies, and these numbers of trisomy 18 and trisomy 13 pregnancies were simulated with marker levels based on published parameters.
2
Each simulated pregnancy was assigned a maternal age, based on the maternal age distribution of maternities in England and Wales 2006-2008
8
and the maternal age-specific odds of a livebirth affected with trisomy 18, trisomy 135, or Down’s syndrome.
4
For each simulated pregnancy, and for each disorder, an early second trimester maternal age risk was calculated by multiplying the maternal age specific odds of having an affected live birth by 1/0.35 for trisomy 18, 1/0.58 for trisomy 137, and 1/0.77 for Down’s syndrome
6
, to allow for the fetal loss of affected pregnancies from this time in pregnancy until term. For each disorder, the predicted risk of the disorder was calculated by multiplying the age specific odds of the disorder by the likelihood ratio (for a given set of marker values) obtained from the overlapping multivariate Gaussian distributions of marker levels in affected and unaffected pregnancies. Each simulated pregnancy therefore had a predicted risk of trisomy 18, a predicted risk of trisomy 13, and a predicted risk of Down’s syndrome. A single risk was calculated from these risks using the formula
Results
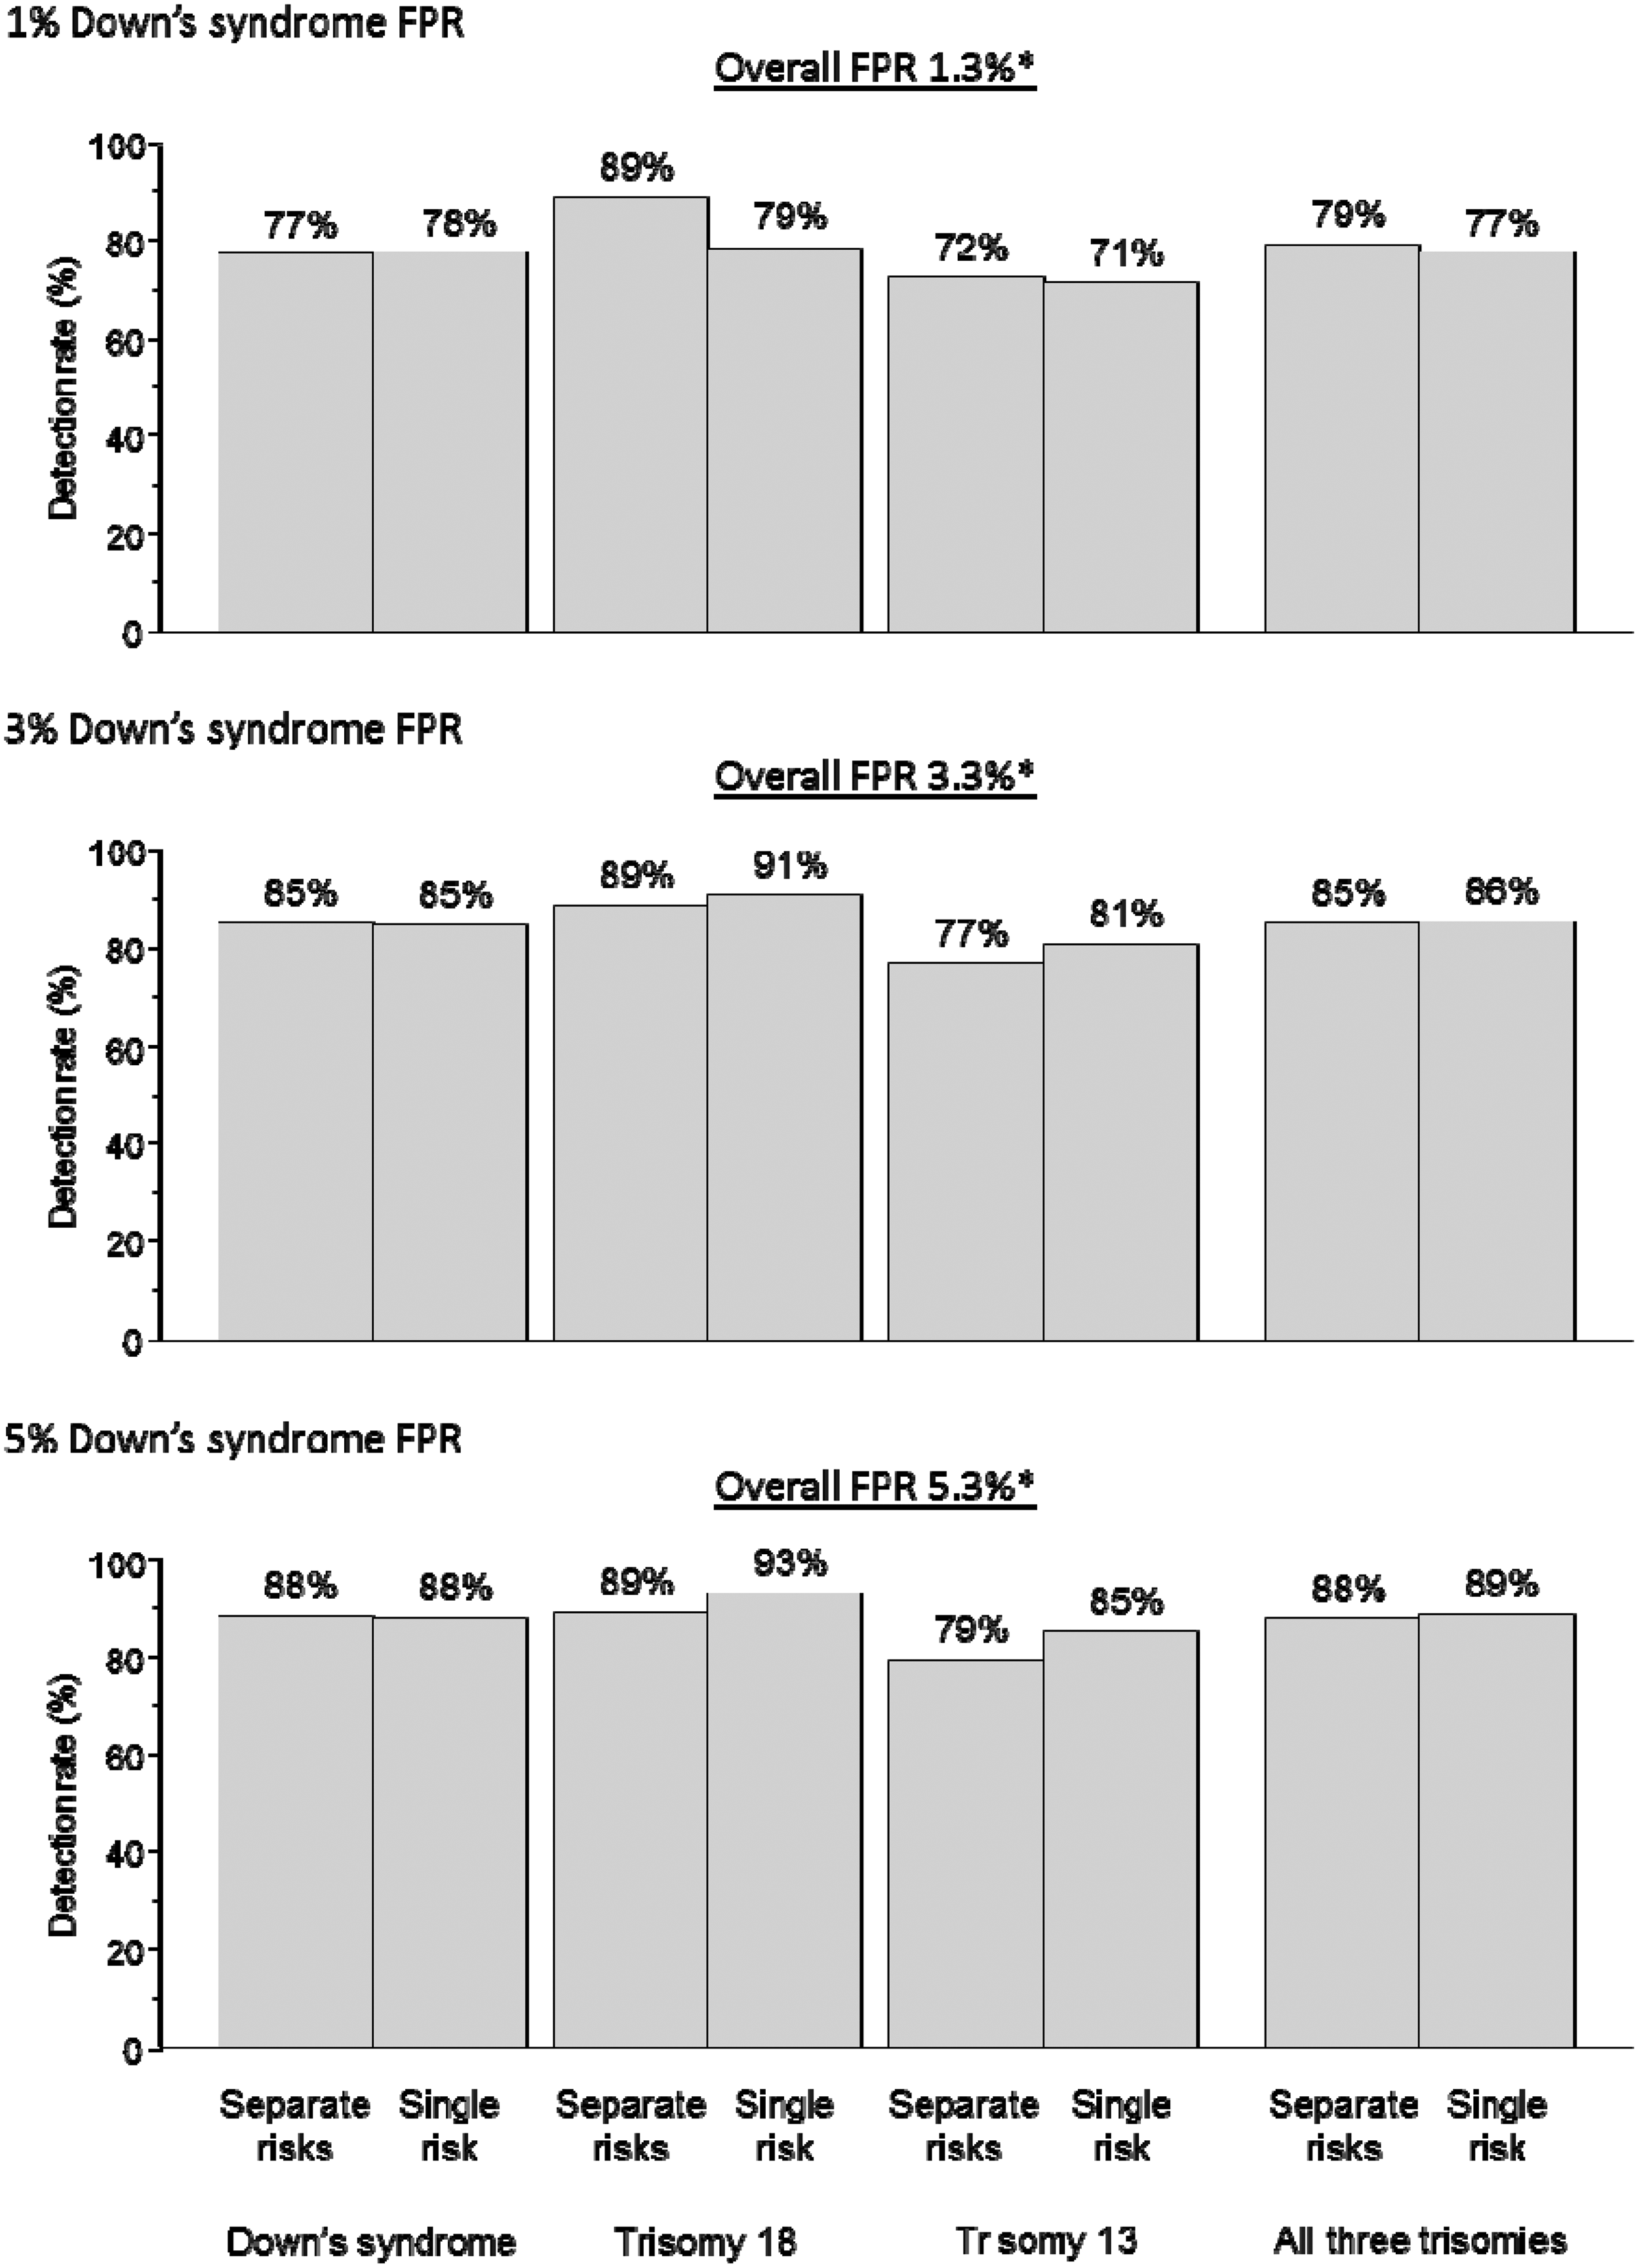
Figure 1 shows, for the Integrated test with first trimester markers measured at 11 completed weeks of pregnancy, the detection rates according to using separate risk estimates for the three disorders, or a single risk for any of the three. The results are shown for Down’s syndrome false-positive rates of 1, 3, and 5%, a trisomy 18 false-positive rate of 0.2%, and a trisomy 13 false-positive rate of 0.2%. Compared with separate risks, the use of a single risk increases the trisomy 13 detection rate. For example, at an overall false-positive rate of 3.3%, it is increased from 76% to 82% with unchanged Down’s syndrome and trisomy 18 detection rates of 94% and 92% respectively. At an overall false-positive rate of 1.3% there is a small loss in the trisomy 18 detection rate with the use of a single risk (from 92% to 86%) with unchanged Down’s syndrome and trisomy 13 detection rates. At an overall false-positive rate of 5.3% there is a small increase in the trisomy 18 detection rate (from 93% to 95%) and the trisomy 13 detection rate (from 79% to 86%) with an unchanged Down’s syndrome detection rate. Figures 2 and 3 show the corresponding estimates for the Combined test and the Quadruple test. The patterns are similar to those for the Integrated test. The overall false-positive rates in Figures 1 and 2 are less than the sum of the rates for the three disorders (eg. 3.3% instead of 3.4% in figure 1) because some pregnancies with a false-positive result for one disorder will also have a false-positive result for another.
Integrated test. Detection rate of Down’s syndrome, trisomy 18, trisomy 13 and all three disorders using separate risks for each disorder, or a single risk according to Down’s syndrome test false-positive rate (FPR). Trisomy 18 and trisomy 13 test FPRs each 0.2%*. First trimester markers measured at 11 completed weeks’ gestation. *Allows for pregnancies positive for one disorder also being positive for another. Combined test. Detection rate of Down’s syndrome, trisomy 18, trisomy 13 and all three disorders using separate risks for each disorder or a single risk, according to Down’s syndrome test false-positive rate (FPR). Trisomy 18 and trisomy 13 test FPRs 0.2%. Markers measured at 11 completed weeks’ gestation. *Allows for pregnancies positive for one disorder also being positive for another. Quadruple test. Detection rate of Down’s syndrome, trisomy 18, trisomy 13 and all three disorders using separate risks for each disorder, or a single risk according to Down’s syndrome test false-positive rate (FPR). Trisomy 18 and trisomy 13 test FPRs 0.2%.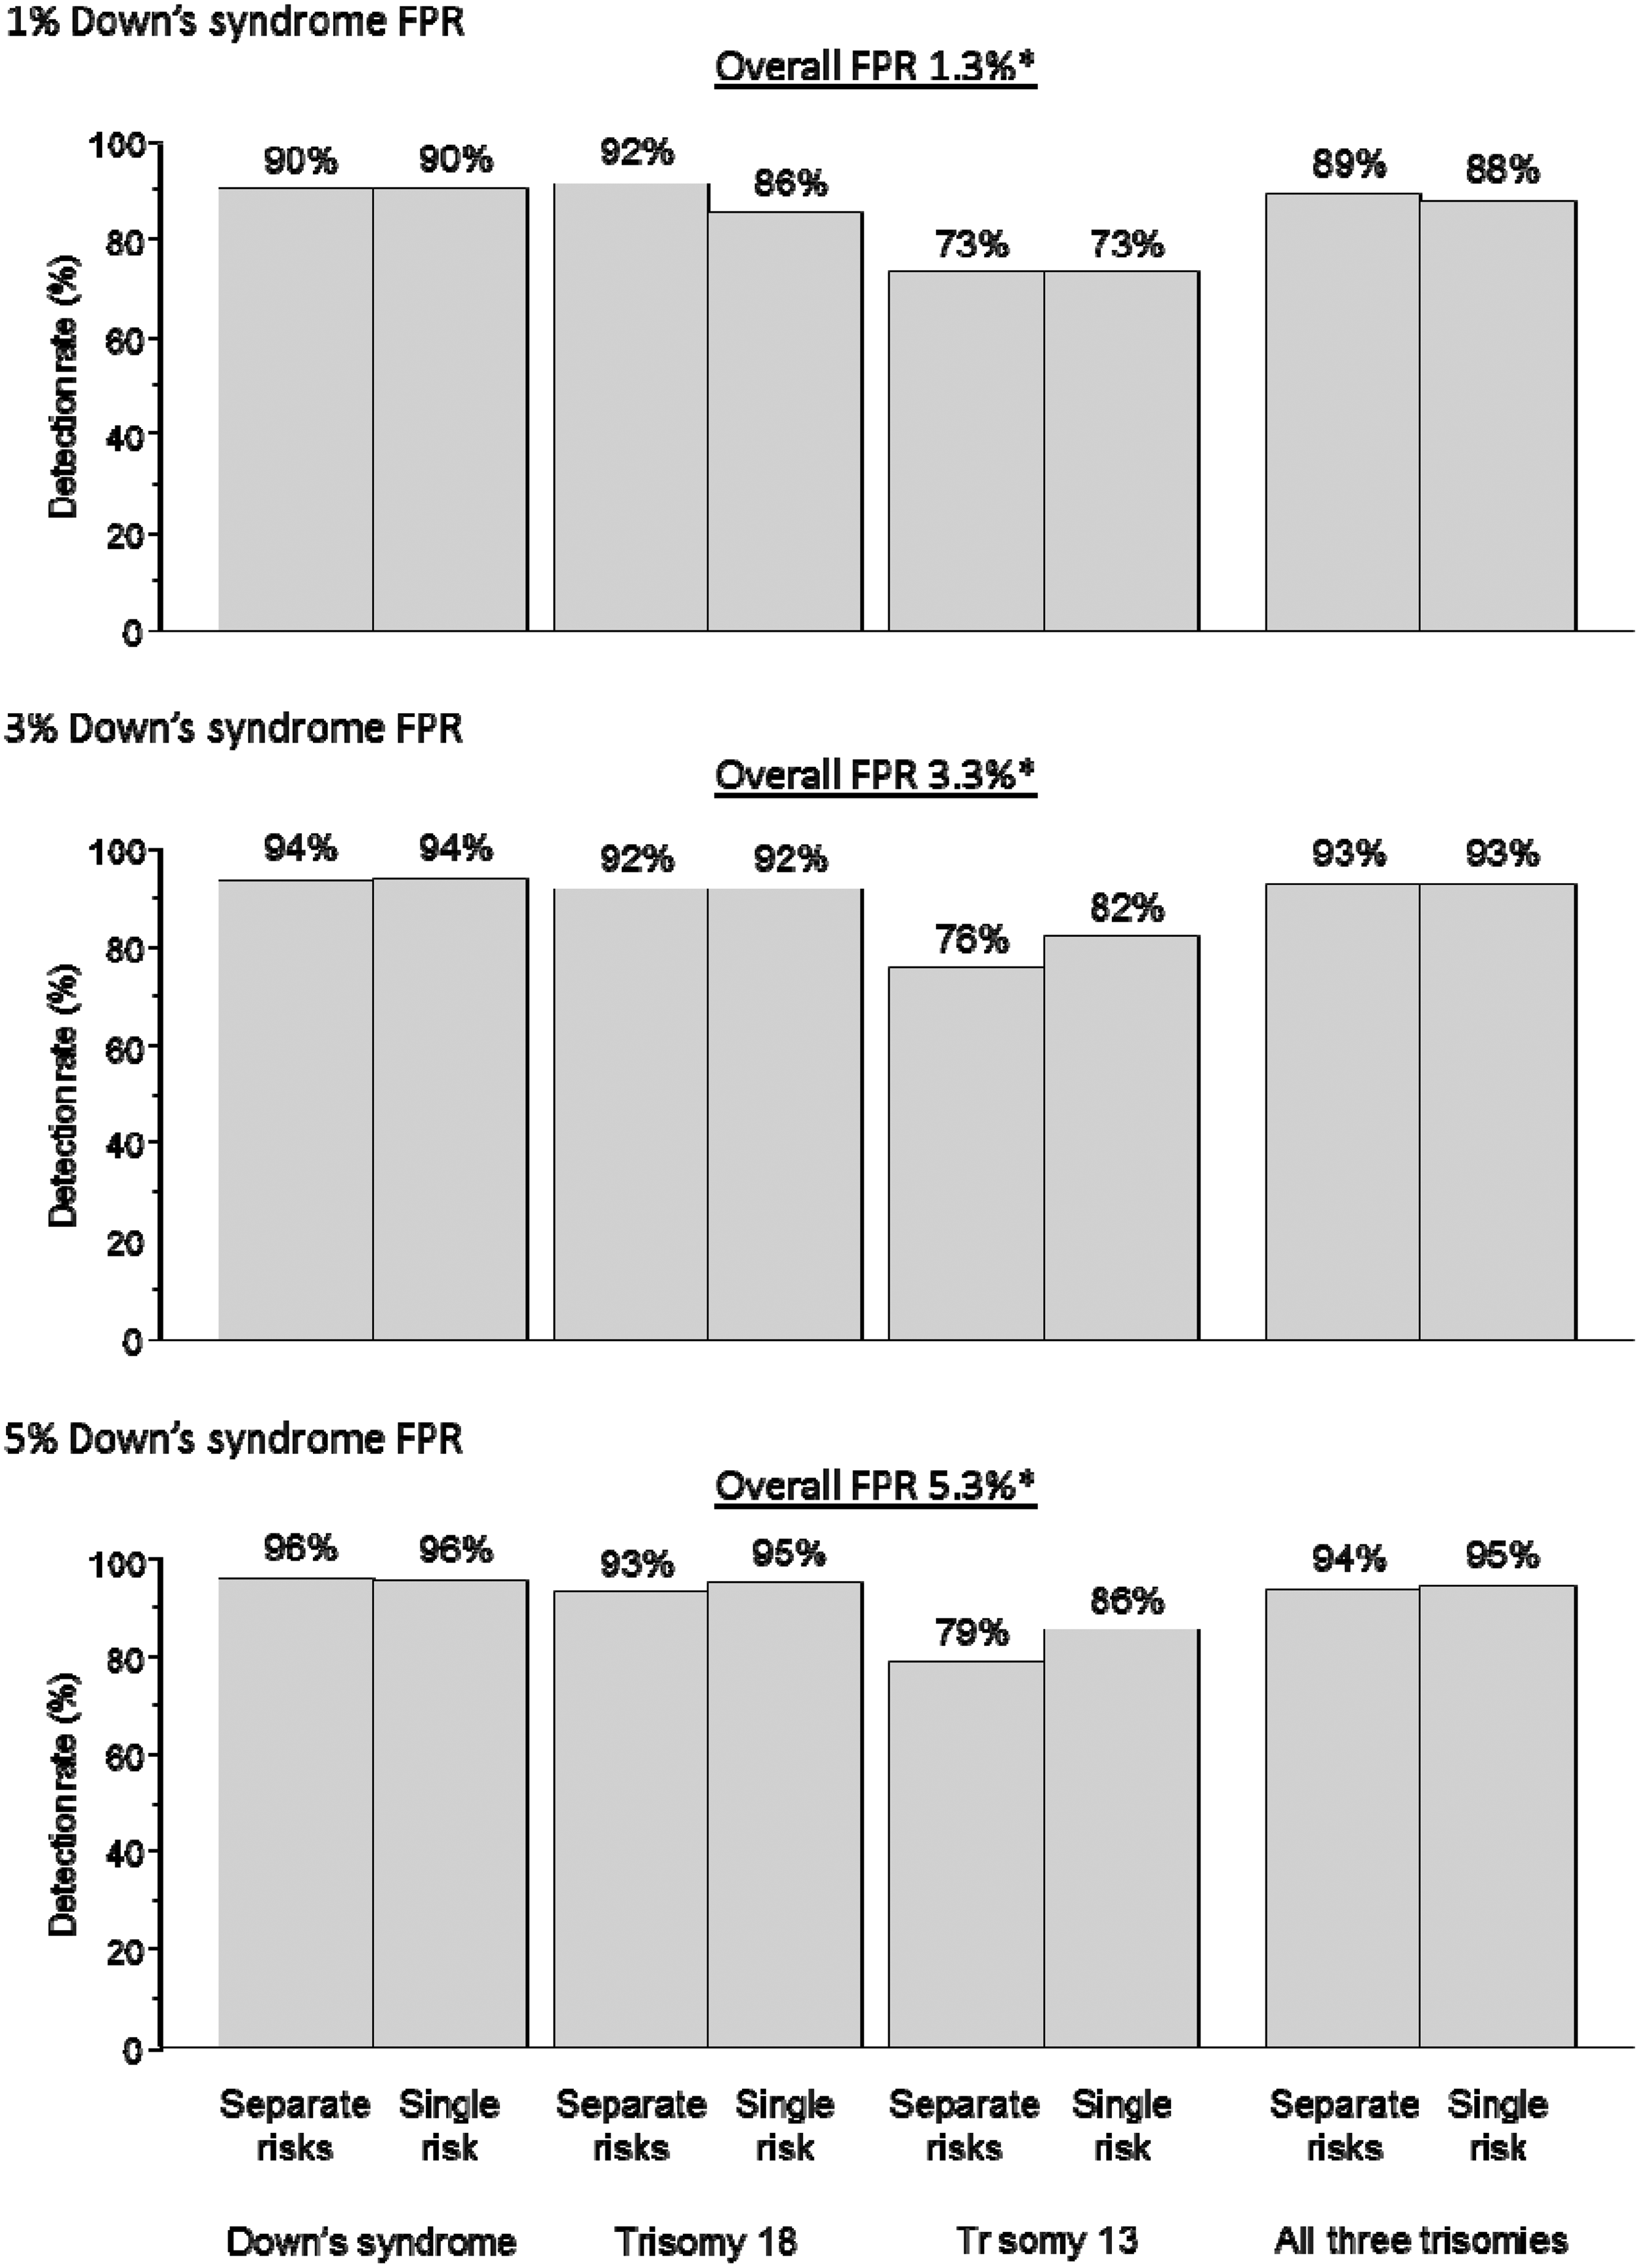
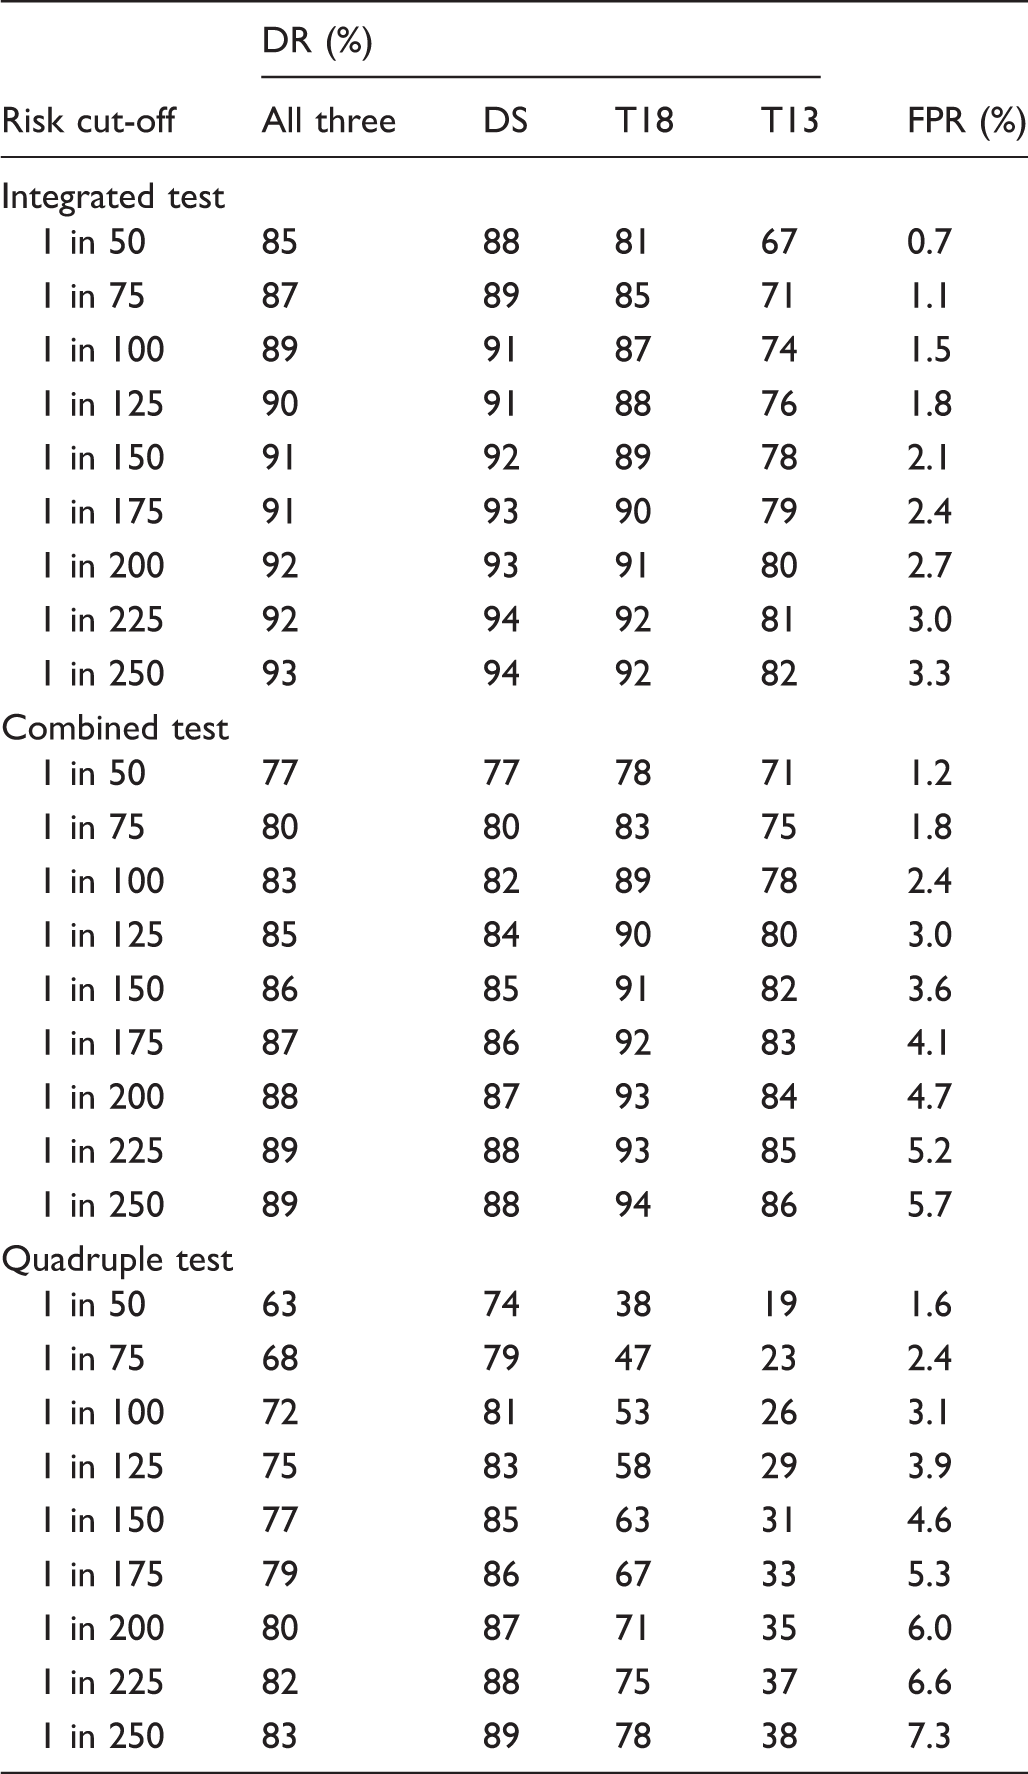
Appendix table 1 shows the Integrated test detection rates for a wider selection of false-positive rates. This shows that increasing the trisomy 18 and trisomy 13 test false-positive rates has a small effect in increasing the detection rates. Appendix tables 2 and 3 show the corresponding results with the first trimester markers measured at 12 and 13 completed weeks’ gestation respectively instead of 11 weeks. Appendix tables 4, 5, and 6 show the corresponding results for the Combined test with markers measured at 11, 12 and 13 completed weeks’ gestation respectively. Appendix table 7 shows the corresponding results for the Quadruple test.
Detection rate (DR) of Down’s syndrome (DS), trisomy 18 (T18), trisomy 13 (T13) and all three disorders, and false-positive rate (FPR) using a single risk according to early second trimester risk cut-off. First trimester markers measured at 11 completed weeks’ gestation.
Discussion
Our results show that the screening performances using a single risk estimate for any of the three disorders can be the same or better than those using separate risk estimates for each disorder. Reporting a single risk result has the advantage of simplicity, is less confusing, and avoids the difficulty of having to determine the overall risk from three separate reported risks. On its own, a single risk estimate does not indicate, if a disorder is present, which one it is likely to be. The separate risks could be provided as well as the single risk, to indicate the most likely disorder, if the pregnancy were affected. For example, if a pregnancy had a Down’s syndrome risk of 1 in 400, a trisomy 18 risk of 1 in 350, and a trisomy 13 risk of 1 in 110, the overall risk is 1 in 69. Alternatively, screen positive reports could specify the single risk and indicate which of the three disorders was most likely. In the above example it is trisomy 13, because it has the highest risk.
It has been suggested that, from a screening perspective, trisomy 18 and 13 are regarded as a single disorder with a single set of screening marker distribution parameters. 9 We do not think that this is appropriate because the screening marker distribution parameters are different for the two disorders. This is particularly the case with the second trimester screening markers. However, a Down’s syndrome risk and a single trisomy 18/trisomy 13 risk could be calculated from the separate risks. The results of doing this are shown in Appendix Table 10.
Using the single risk approach, as expected, the trisomy 18 and trisomy 13 detection rates increase as the overall false-positive rate increases (see Figure 1). Using the separate risk approach, there is little change in the trisomy 18 and trisomy 13 detection rates as the overall false-positive rate increases. The difference arises because with the use of separate risks, the trisomy 18 and trisomy 13 false-positive rates were both fixed at 0.2%, and increasing the Down’s syndrome false-positive rate has little impact on increasing the trisomy 18 and trisomy 13 detection rates.
If antenatal screening for trisomy 18 and trisomy 13 is carried out in addition to screening for Down’s syndrome, this needs to be made clear at the time that screening is offered to women, so they are not surprised by the result of a screening test that they did not know they were having. If a single risk is to be reported for having a pregnancy with Down’s syndrome, trisomy 18, or trisomy 13, this also needs to be made clear in the patient information material and the screening report.
Explicitly screening for trisomy 18 and trisomy 13, rather than regarding the detection of these disorders as incidental to screening for Down’s syndrome, may imply that it is worthwhile to screen for these two disorders alone; this is not justified, given their rarity and high natural fetal loss rate. The reason trisomy 18 and 13 are included in Down’s syndrome screening programmes is that all three are identified by the same test. Screening programmes need to take a view on whether they are screening for trisomy 18 and 13 as well as Down’s syndrome, or screening for Down’s syndrome with the incidental detection of trisomy 18 and 13. The distinction is important because it affects what information is given to women offered screening, and how the screening results are reported. If centres decide to explicitly screen for Down’s syndrome, trisomy 18, and trisomy 13, then the use of a single risk estimate for the three disorders could be considered.
Footnotes
Conflict of interest
Nicholas Wald holds patents for the Integrated test, and is Director of Logical Medical Systems Ltd, which produces software for the interpretation of Down’s syndrome screening tests.
References
Supplementary Material
Please find the following supplemental material available below.
For Open Access articles published under a Creative Commons License, all supplemental material carries the same license as the article it is associated with.
For non-Open Access articles published, all supplemental material carries a non-exclusive license, and permission requests for re-use of supplemental material or any part of supplemental material shall be sent directly to the copyright owner as specified in the copyright notice associated with the article.