
Abstract
Objective
In dried blood spot analysis, punch location and variations in applied sample volume and haematocrit can produce different measured concentrations of analytes. We investigated the magnitude of these effects in newborn screening in the UK.
Methods
Heparinized blood spiked with thyroid stimulating hormone (TSH), phenylalanine, tyrosine, leucine, methionine, octanoyl carnitine (C8), and immunoreactive trypsinogen (IRT) was spotted onto filter paper: (i) at a constant haematocrit of 50% at various volumes, and (ii) at a range of haematocrits using a constant volume. Subpunches (3.2 mm) of the dried blood spots were then analysed.
Results
Compared with a central punch from a 50 µL blood spot with 50% haematocrit, 10 µL spots can have significantly lower measured concentrations of all analytes, with decreases of 15% or more observed for leucine, methionine, phenylalanine, and tyrosine. Punching at the edge of a spot can increase measured concentrations up to 35%. Higher haematocrit decreased measured TSH and C8 yet increased amino acids and IRT by 15% compared with 50% haematocrit. Lower haematocrits had the opposite effect, but only with higher concentrations of some analytes.
Conclusions
Differences in blood spot size, haematocrit and punch location substantially affect measured concentrations for analytes used in the UK newborn screening programme, and this could affect false positive and negative rates. To minimize analytical bias, these variables should be controlled or adjusted for where possible.
Introduction
In 1969, Hill and Palmer noted sources of analytical bias in dried blood spot measurements, 1 including variability in commercially available blood spot calibrants for phenylalanine and the haematocrit of the blood. For the same volume of applied blood, a decreasing area of filter paper is covered with increasing haematocrit in the sample, 2 and this can affect measured analyte concentrations. 3 Batch to batch variation of filter paper contribute to analytical imprecision 4 (though this has been reduced by the development of blood absorption criteria for filter papers by the Clinical and Laboratory Standards Institute in the USA), as does the location of the punch 5 for methods employing non-volumetric blood application, such as newborn screening, in which only a portion of the spot is analysed.
Identification of disorders by newborn blood spot screening typically relates whole blood measurements to biochemical concentrations in serum. For example, serum and blood spot phenylalanine concentrations are expected to be very similar. However, the diameter of the patient's blood spot and haematocrit may differ significantly from that of assay calibrants, and the extent of the variance of whole blood from the plasma measurement may be unrecognized. Sadler and Lynskey 6 reported in 1979 that plasma volume varied by applied blood volume, with less plasma in a punch from a smaller compared with a larger volume of blood applied. They observed that TSH, located solely in plasma, measured less in a standard centre punch from smaller spots compared with a central or edge punch from a larger blood spot.
Newborn screening in England and Northern Ireland utilizes heelprick blood applied non-volumetrically to 10 mm circles on PE 226 filter paper, 7 and most commonly a 3.2 mm diameter punch size for analysis. The volume of blood to fill each of the four circles on these cards will be different from that for larger diameter circles used in the USA and other countries. Blood spot external quality assessment (EQA) and performance evaluation material for newborn screening from the United States Centers for Disease Control (CDC) is used widely around the world, including in England. However, it is unclear whether bias exists in each country's analytical results if their assays are set up and calibrated with different circle diameters from those from the CDC.
A haematocrit of approximately 50–55% is generally anticipated in infants during the first few days of life. Calibration materials for neonatal screening are therefore created with this or a similar haematocrit.8,9 However, variation in the haematocrits of 5–8 day old babies' blood as screened in the UK will exist and it is not known how much this might influence the outcome of screening tests and, if variations are observed, whether correction can be made for these changes.
Dried blood spot analysis has many advantages compared with utilizing liquid whole blood samples. 10 It uses significantly smaller volumes of blood, does not require centrifugation facilities, tends to stabilize many analytes on drying, and permits inexpensive mailing of specimens. However, the impact of variable haematocrit on results, which should ideally be within 15% of the ‘true' result, 11 is a stumbling block. Sampling matrices which mitigate the haematocrit effect are being developed.12,13 If efficacy of these matrices is proven, they might be of value in improving accuracy not only of drug testing results but also of newborn blood spot results.
Little is known about the effect of blood spot size, spot punch location, and haematocrit on the performance of newborn screening blood spot analysis in England and Northern Ireland. We investigated the magnitude of these effects in relation to screening for congenital hypothyroidism, phenylketonuria, cystic fibrosis, Medium-chain acyl-CoA dehydrogenase deficiency homocystinuria, and maple syrup urine disease.
Methods
Reagents
L-phenylalanine, L-methionine, L-tyrosine, L-leucine, and octanoyl carnitine (C8) were purchased from Sigma-Aldrich (Gillingham, Dorset, UK). The Second International Reference Preparation of human thyroid stimulating hormone (TSH), 80/558, was obtained from the National Institute for Biological Standard (South Mimms, Hertfordshire, UK).
Preparation and analysis of blood spots
Method and performance characteristics for blood spot newborn screening assays.
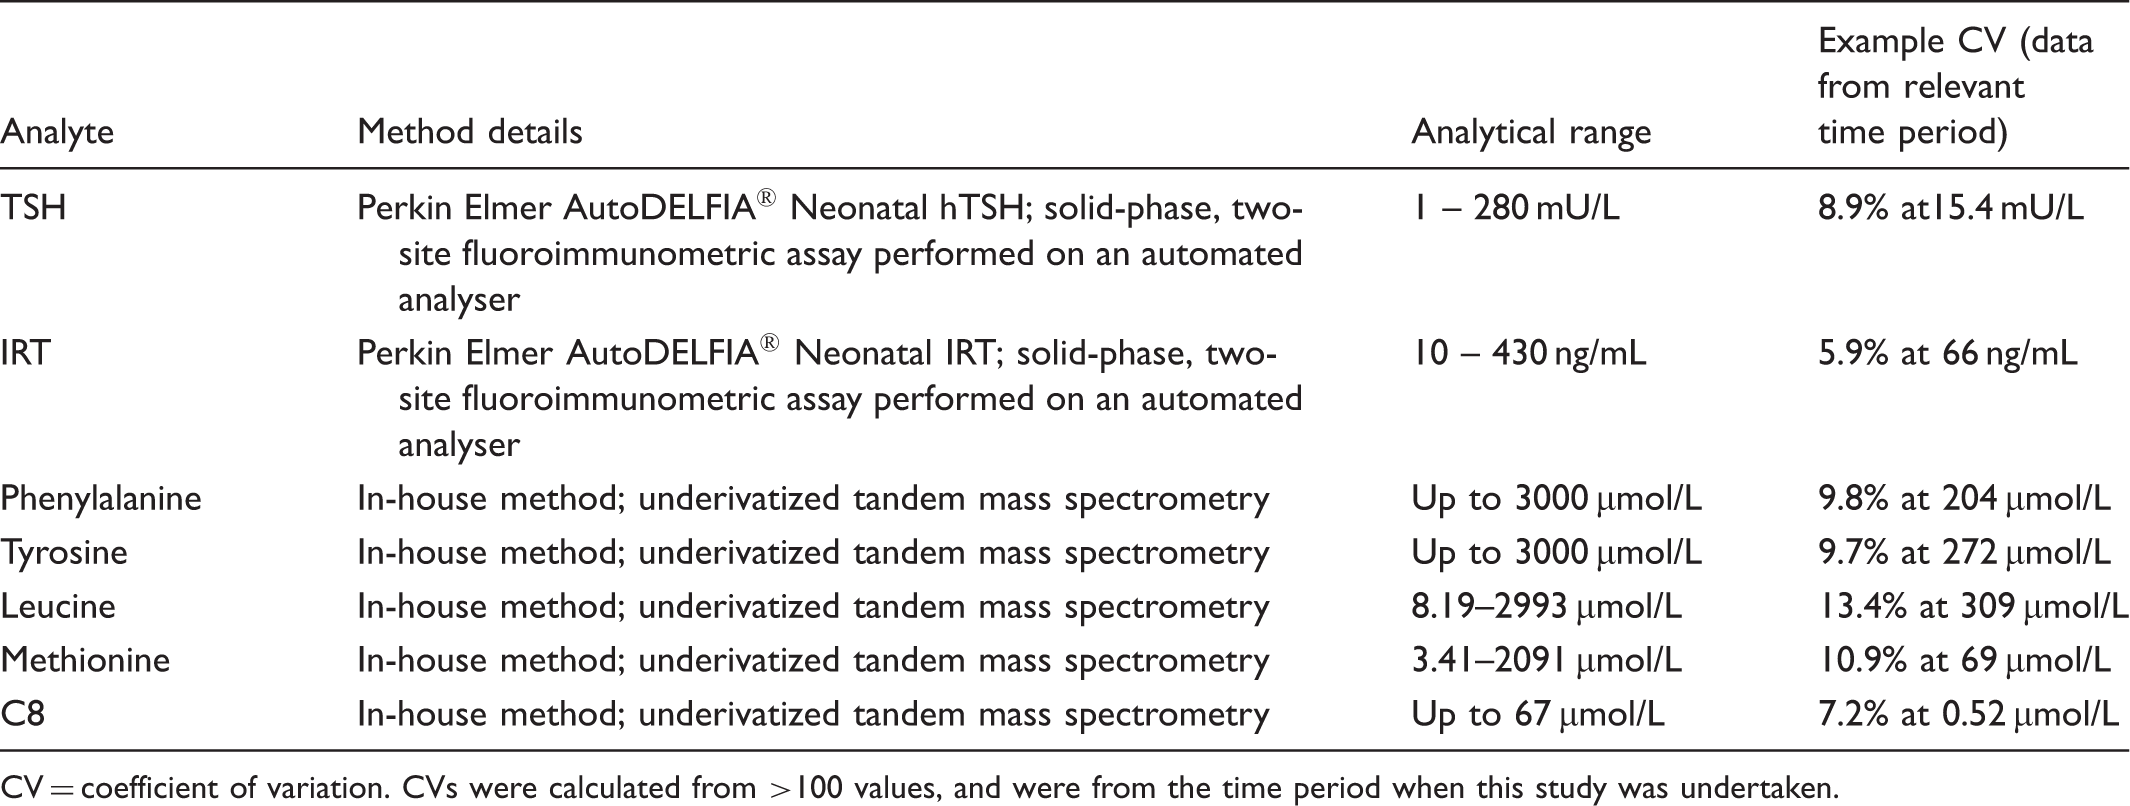
CV = coefficient of variation. CVs were calculated from >100 values, and were from the time period when this study was undertaken.
Analyte concentrations used for all experiments.
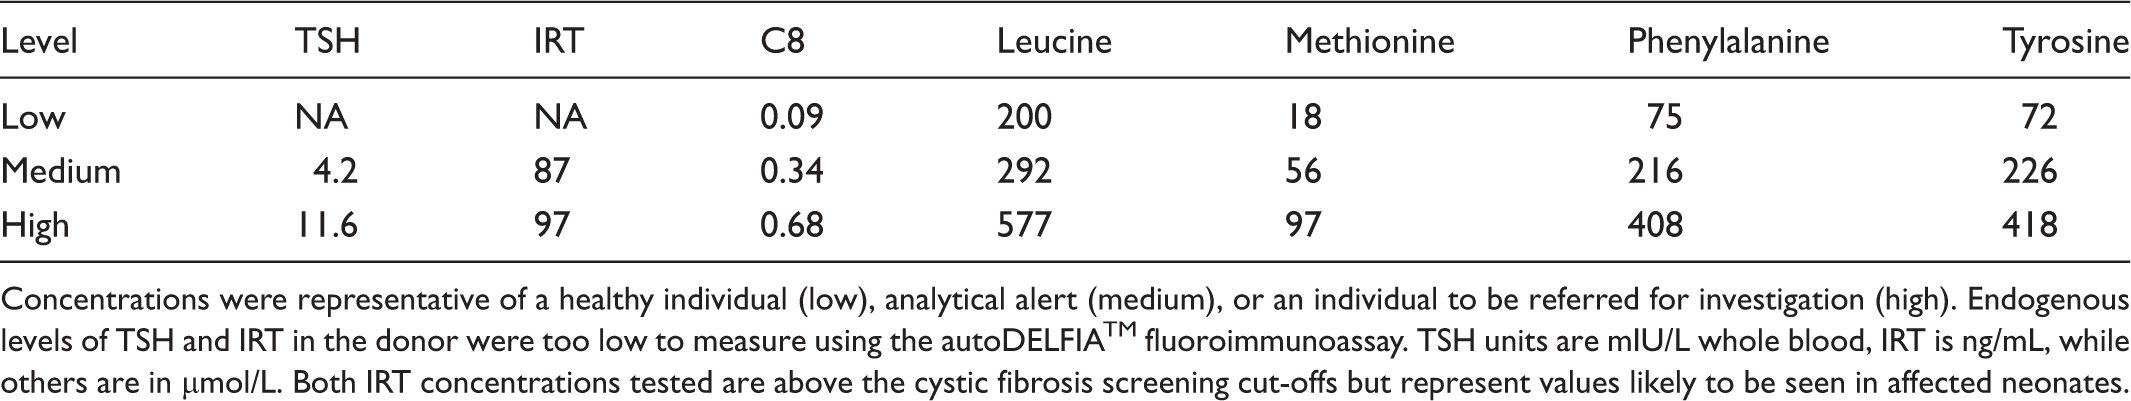
Concentrations were representative of a healthy individual (low), analytical alert (medium), or an individual to be referred for investigation (high). Endogenous levels of TSH and IRT in the donor were too low to measure using the autoDELFIA™ fluoroimmunoassay. TSH units are mIU/L whole blood, IRT is ng/mL, while others are in µmol/L. Both IRT concentrations tested are above the cystic fibrosis screening cut-offs but represent values likely to be seen in affected neonates.
To investigate the effect of punch location and spot volume on newborn screening results, blood of a constant 50% haematocrit was spotted onto Perkin Elmer 226 cards (Lot Number 100535/311433) in four different volumes (10 µL, 20 µL, 50 µL, and 75 µL), n = 20 for each volume at each analyte concentration. Cards were punched as per Figure 1A and each analyte measured. TSH was measured from a separate punch to other analytes due to different methodology. To investigate the effect of haematocrit, blood was manipulated using removal or addition of donor plasma for each analyte concentration, to create haematocrit values of 30%, 40%, 45%, 50%, and 60%. 50 µL of blood was then spotted onto the cards, n = 6 for each haematocrit at each analyte concentration. Cards were punched as per Figure 1B and each analyte measured.
Experimental design to investigate the effect of spot volume, punch location (A) and haematocrit (B) on newborn screening results. Punch locations shown by black dots. All spot volumes were kept constant at 50 µL. Haematocrit values used for the separate IRT experiment were 25%, 50% and 65%. A: volumes in µL are volume of blood added to the card. All haematocrits constant at 50%. B: percentage values refer to haematocrit of blood applied to the card.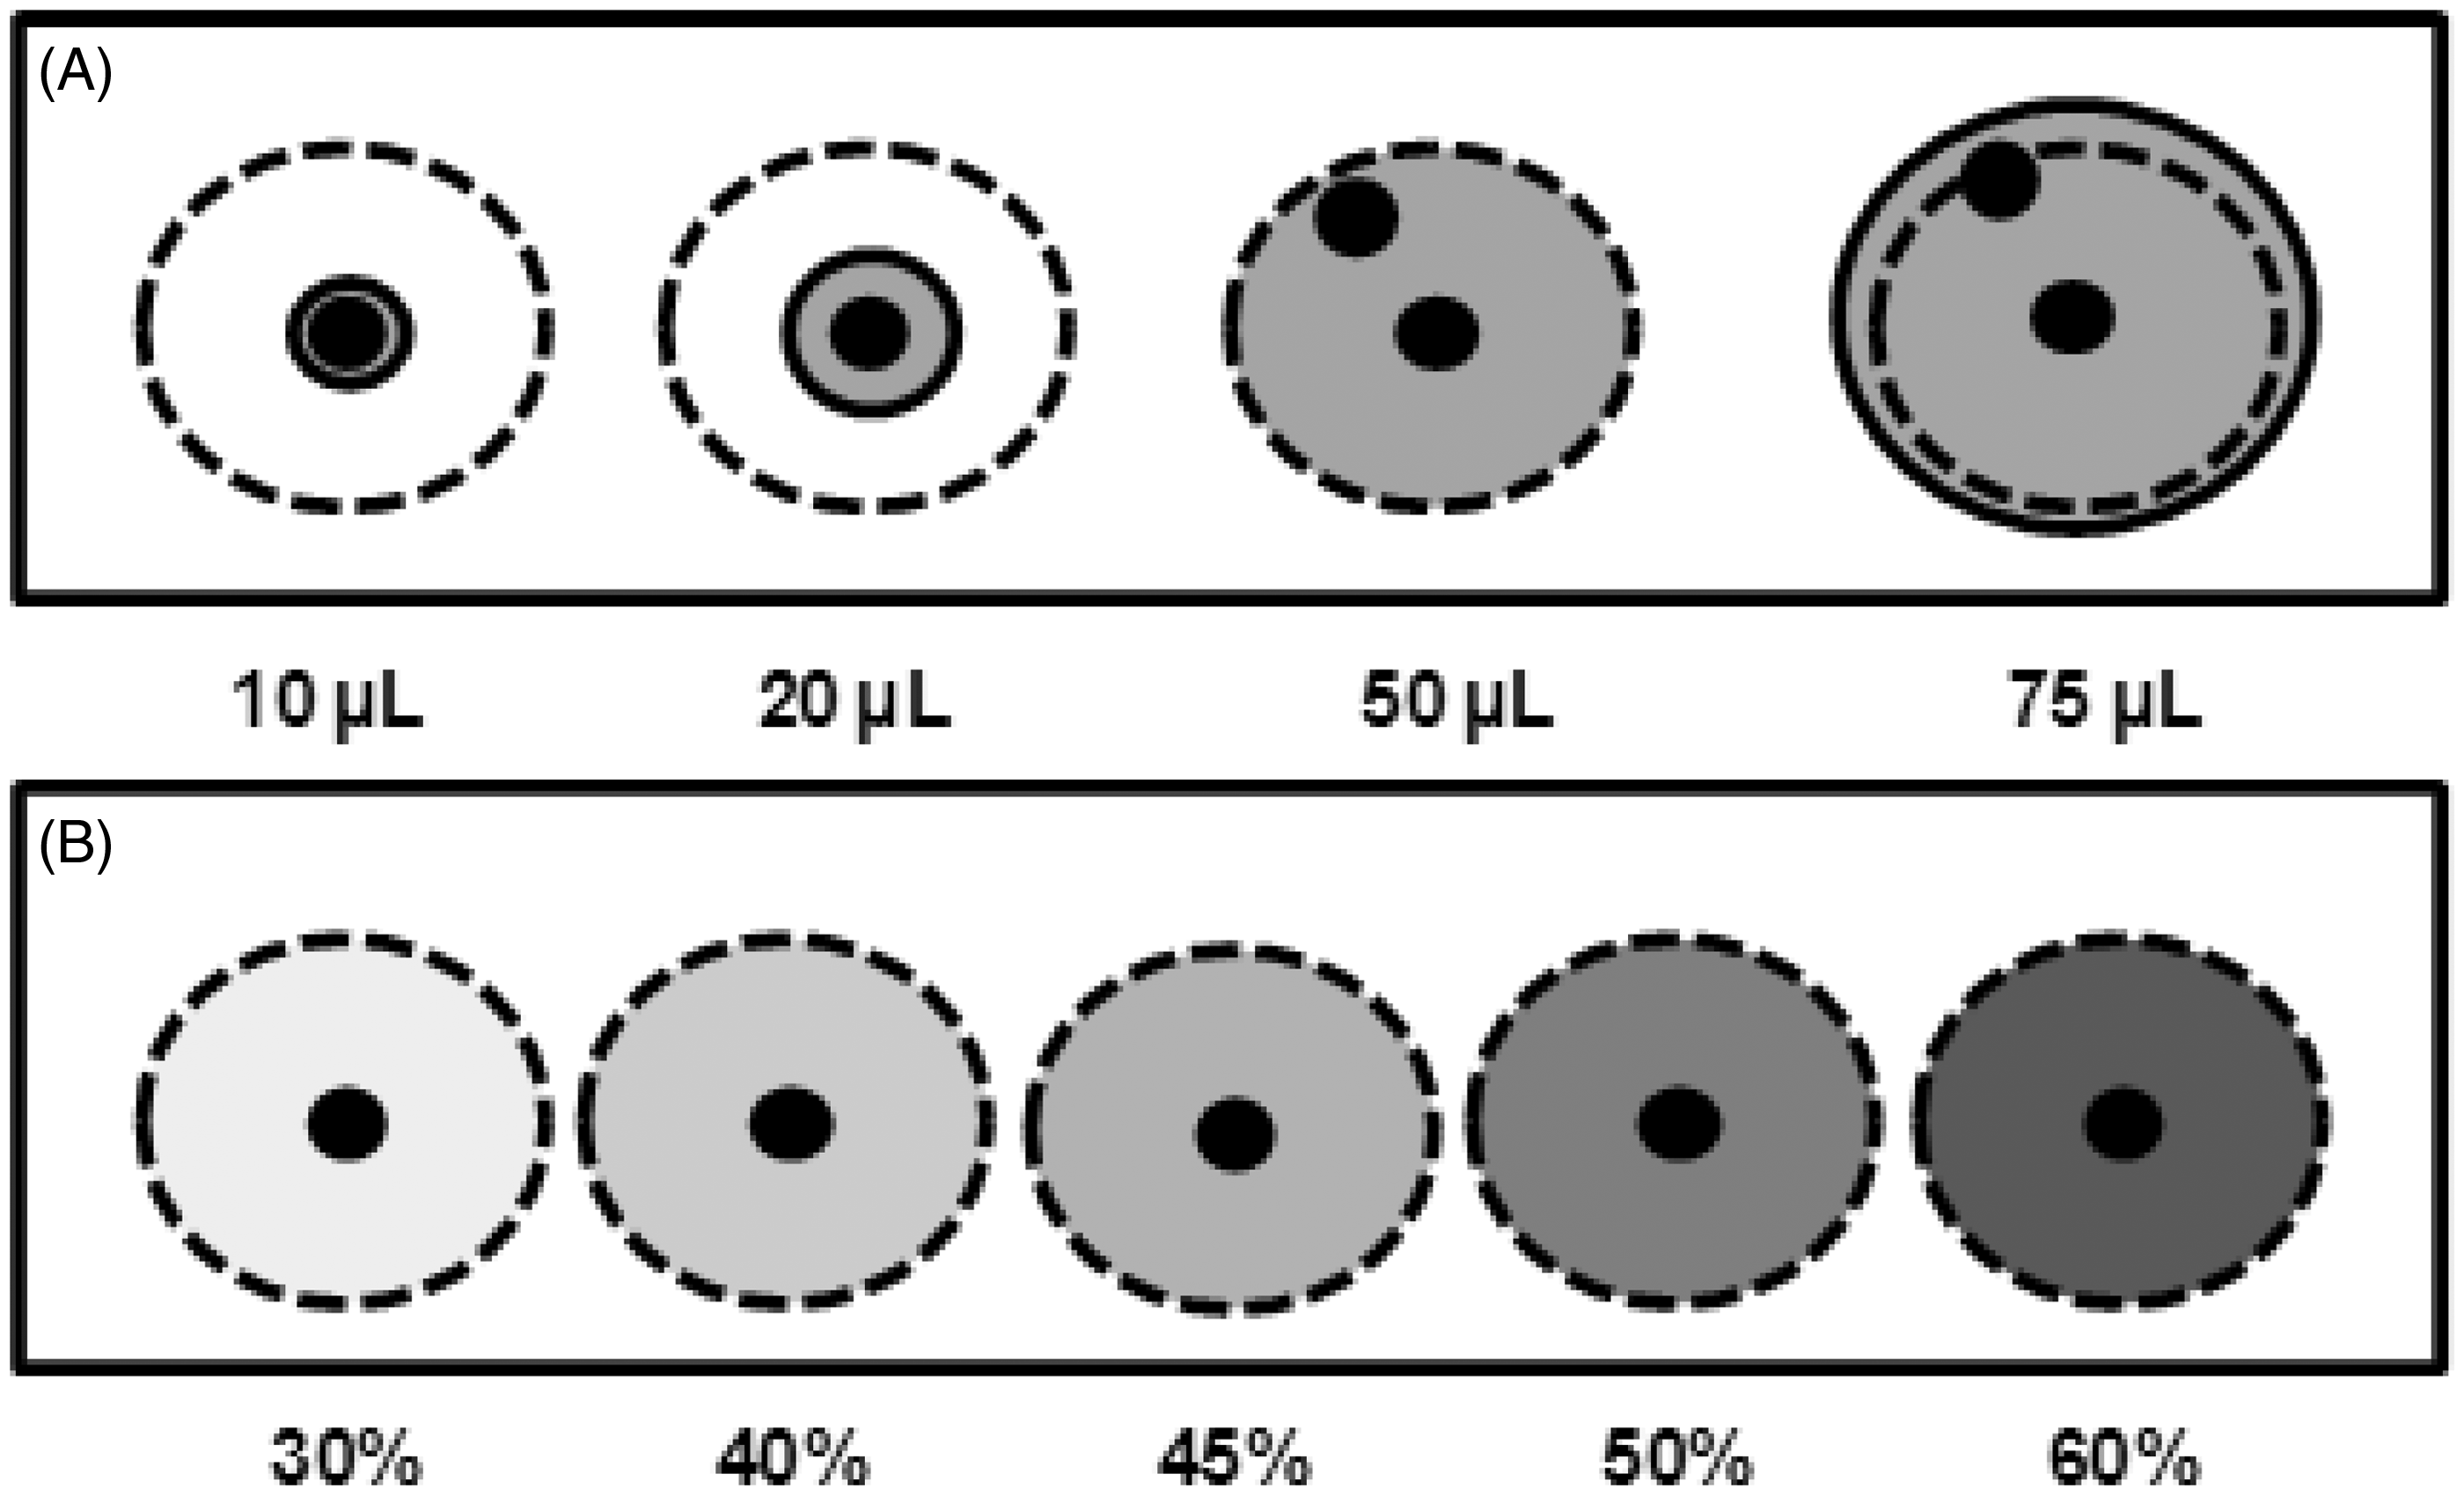
In a separate experiment, 60 mL of blood from a different donor (research team member, full consent provided) was adjusted to three different haematocrits; 25%, 50%, and 65%, and spiked with serum from an anonymous adult patient with pancreatitis containing high levels of immunoreactive trypsinogen (IRT) to create two IRT concentrations (Table 2). Based on the initial IRT measurements, calculated amounts of this serum were added to the whole blood to provide the desired concentrations. The effects of punch location and spot volume were investigated as above, and IRT measured. Blood spots were also produced using samples with haematocrits of 25% and 65%, and IRT concentrations were measured from a central punch of a 50 µL spot and compared with 50% haematocrit.
Collection of haematocrit data
Haematocrits for screened babies were collected from hospital records at Birmingham Children's Hospital.
Analysis of blood spot homogeneity
Using bespoke proprietary software, blood spot cards were scanned with a Cardscan™ device supplied by Luminex. Blood migration across spots was assessed at different sites by recording light transmission through a 3.2 mm circular area (equivalent to a standard punch size) at the centre and edge of blood spots.
Statistical Analysis
One-way ANOVA with post-hoc Tukey test, linear regression and paired t-test analyses were performed using SPSS Statistics (IBM) and GraphPad Prism software. For all experiments statistical analysis was performed on absolute (ie. not percentage change) values.
Results
Effect of sample volume and punch location
For newborn screening in the UK, single heelprick non-volumetric blood drops are applied to fill 10 mm diameter circles onto the blood spot card.
7
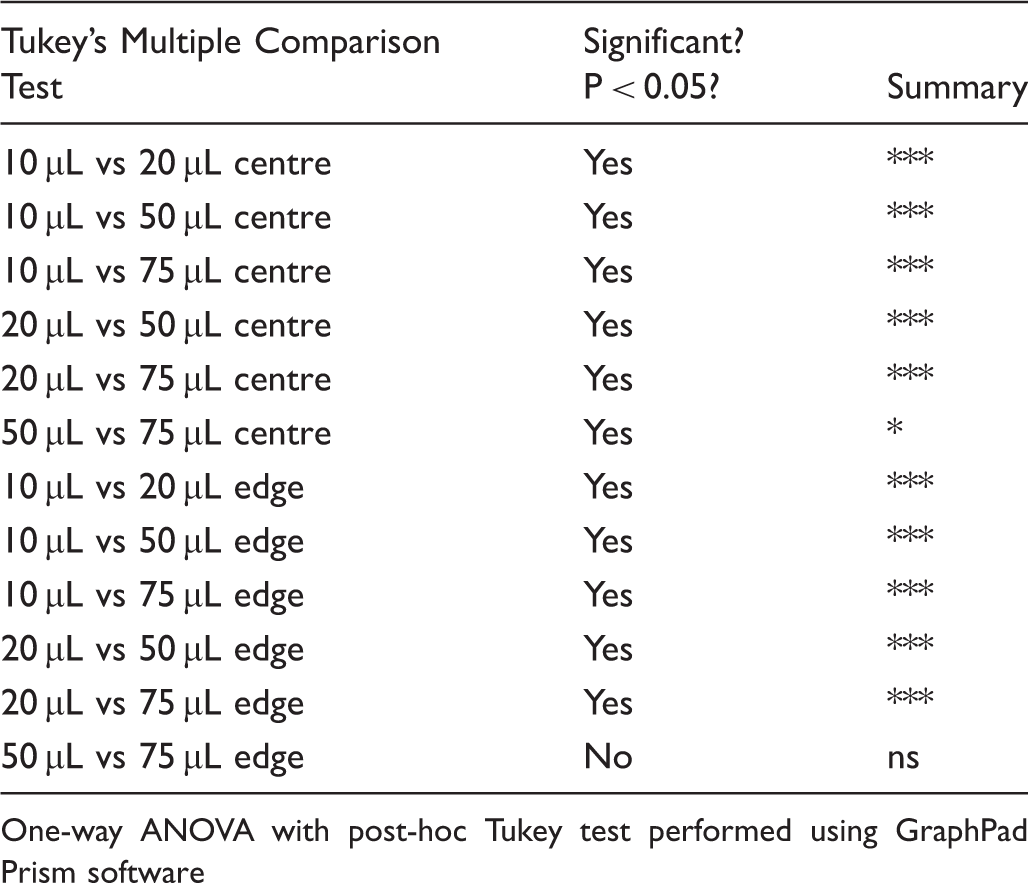
This equates to approximately 35–50 µL of blood, however it is common for the circles to be incompletely filled or overfilled. Figure 2 shows that a reduction in the volume of blood applied to the card from 50 µL to 10 or 20 µL significantly reduced the measured analyte value, in some cases up to 20%. This reduction was observed at all three analyte concentrations except TSH, where the difference was only observed at the higher TSH level (Figure 2C). For IRT, the lower of the two concentrations tested showed the largest difference due to small spot size (Figure 2B and C). Using larger 75 µL spots generally increased measured values of all analytes, although this effect was more variable and did not reach significance.
Effect of spot size and punch location on newborn screening results at concentrations representative of an unaffected individual (A), laboratory alert (B) and an individual referred for further investigation (C). N = 20 for each data point. Data displayed as percentage change (y axis) in analyte concentration when compared with a 50 µL centre punch at a haematocrit of 50%. Statistical analysis performed using one-way ANOVA with post-hoc Tukey test using SPSS Statistics (IBM). * = p < 0.05, ** = p < 0.01 and *** = p < 0.001. Error bars represent +/− standard error of the mean. Leu = Leucine, Met = Methionine, Phe = Phenylalanine & Tyr = Tyrosine.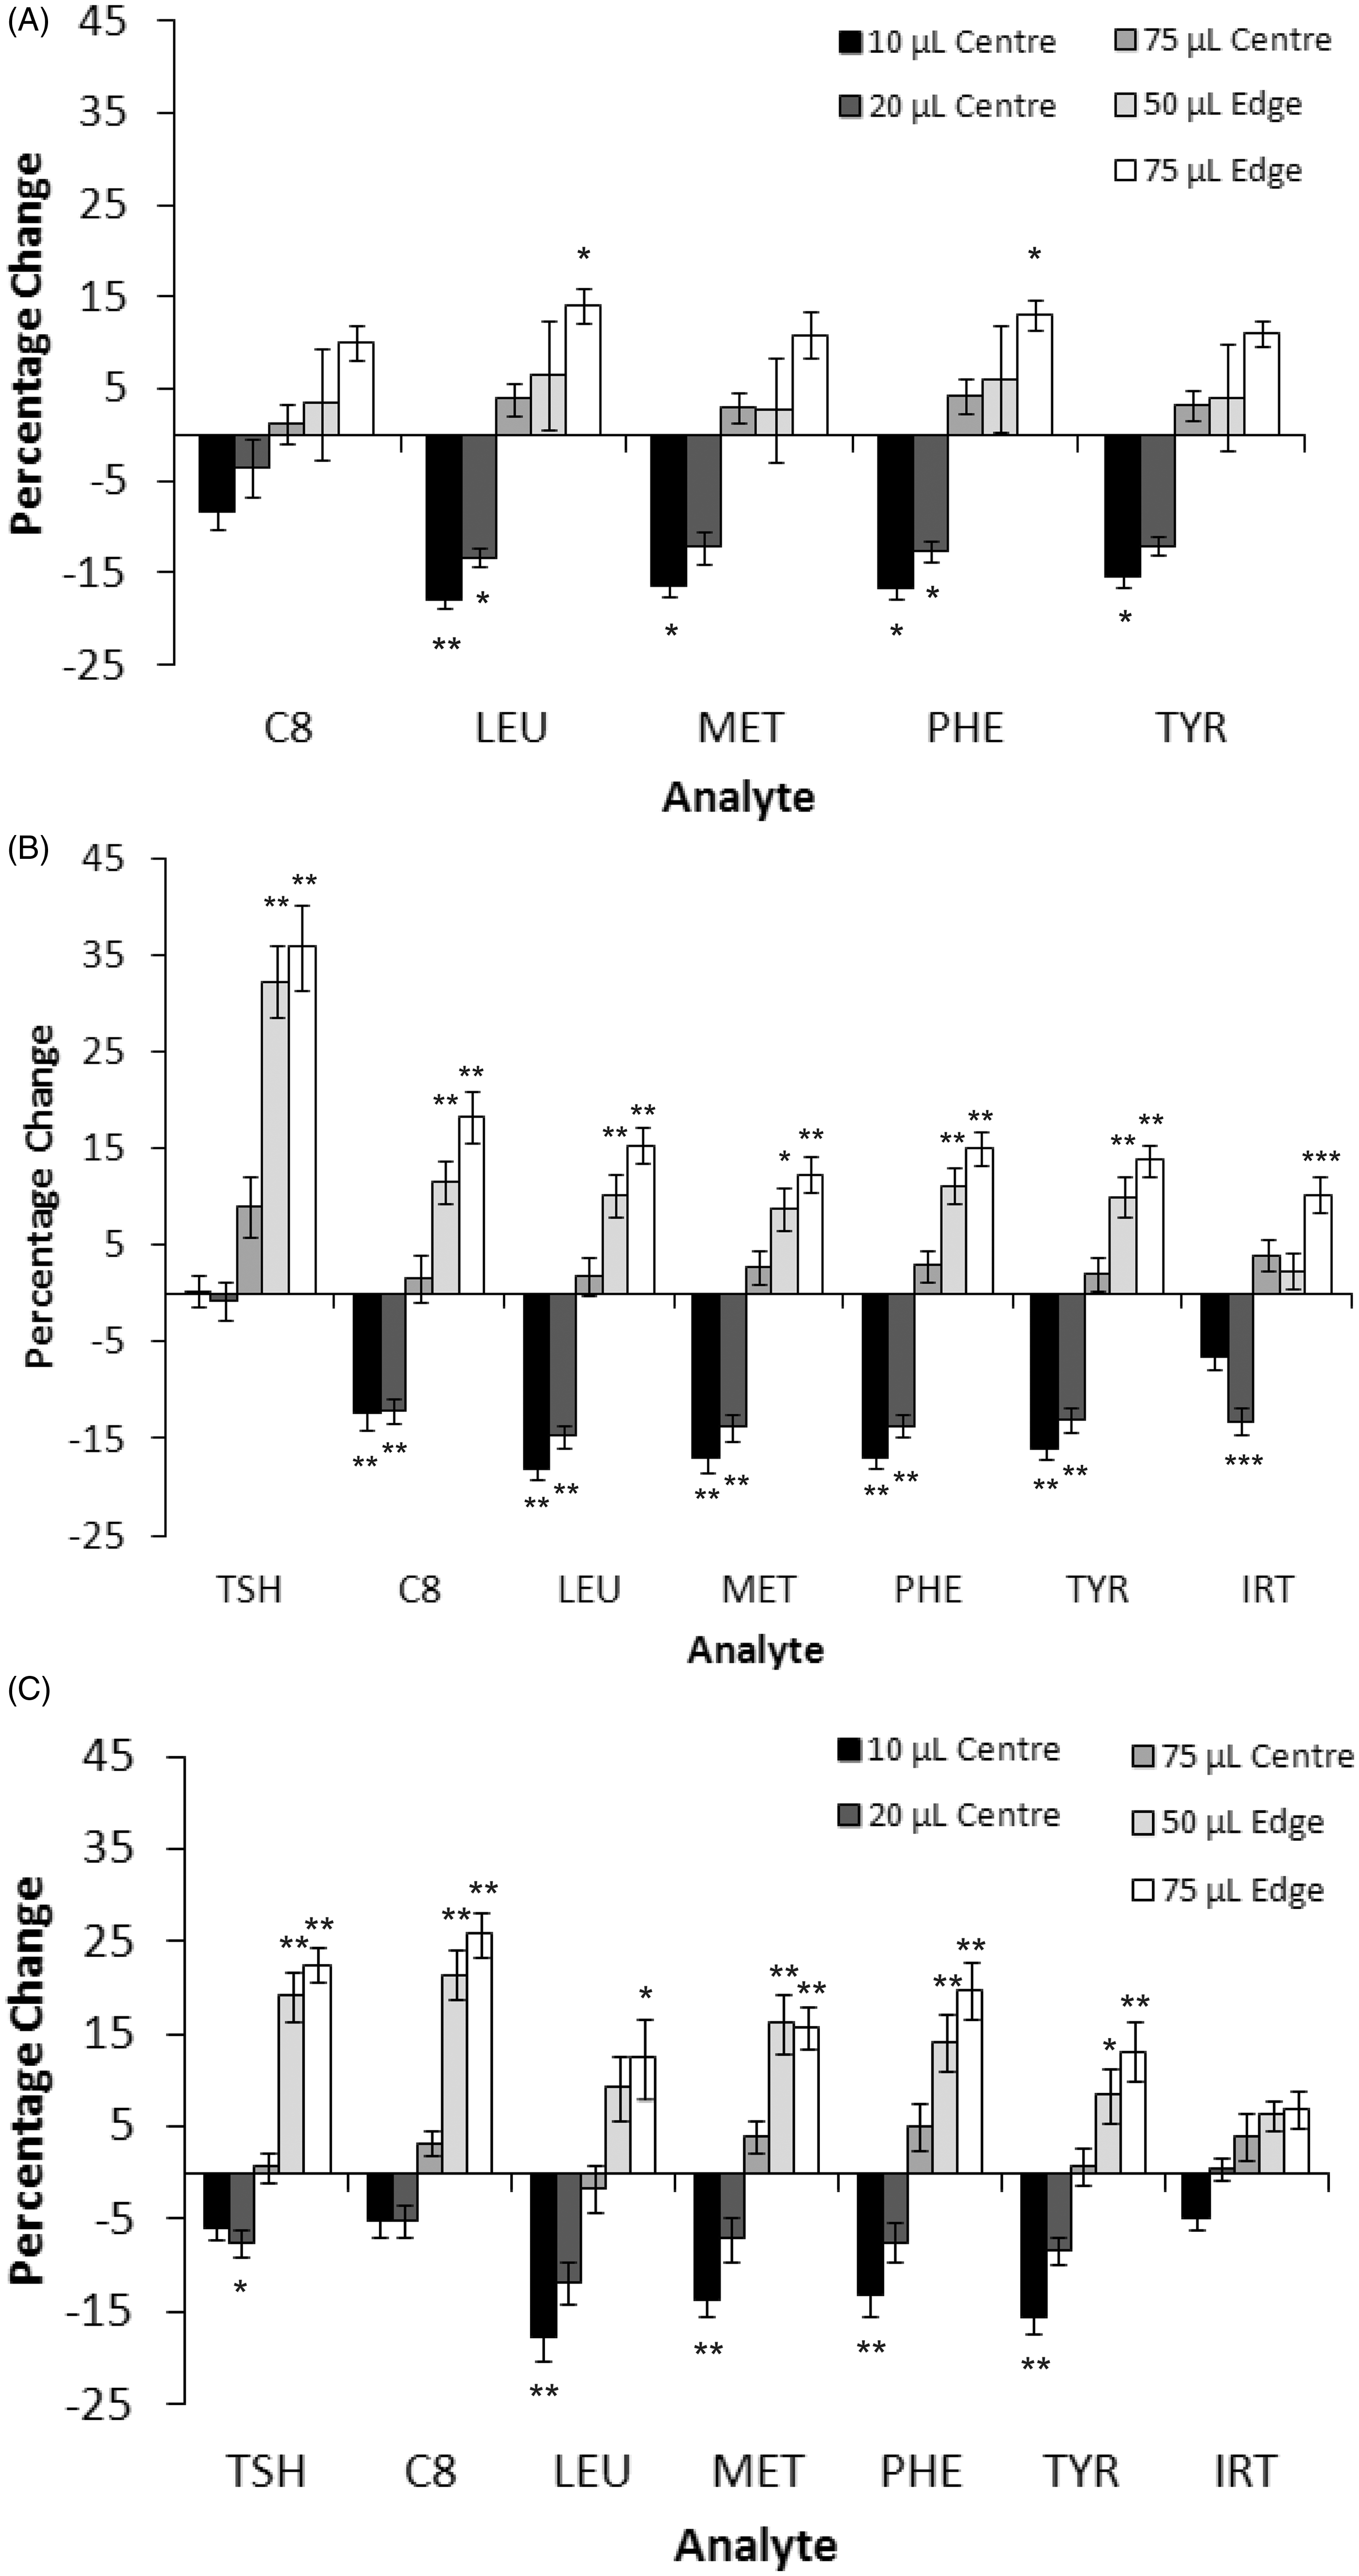
In punches taken from the edge of a 50 µL or 75 µL blood spot, measured analyte concentrations were significantly increased (up to 35%) (Figure 2) for all analytes tested. The effect was greater with larger blood spots at higher concentrations of analyte. TSH and C8 were most affected by peripheral punches. For IRT, a significant increase was seen with the lower of the two concentrations when a peripheral punch of a 75 µL spot was taken, however at the higher concentration no significant differences were seen, although the trend was the same.
Effect of haematocrit
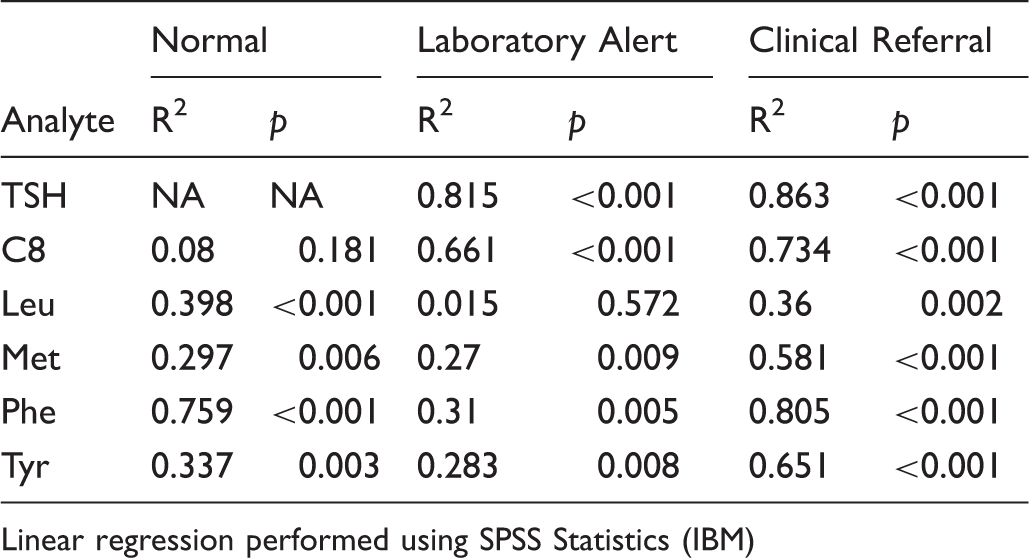
The haematocrit of the newborn test population blood is taken to be fairly consistent (about 50–55%), but data from Birmingham Children’s Hospital show that in babies admitted for heart surgery, liver disease, or attending follow up of positive PKU or tyrosinaemia screening tests, the haematocrit can deviate markedly from this average with both higher and lower values (Figure 3). Figure 4 shows that with increasing haematocrit TSH and C8 measured analyte concentrations decreased, while leucine, methionine, phenylalanine and tyrosine increased. This effect becomes increasingly significant at higher analyte concentrations (Figure 4B & C) and linear regression analysis showed highly significant correlations (Table 3). However, when compared on a pair-wise basis with a haematocrit value of 50%, only large alterations in haematocrit were shown to be significant for certain analytes, most noticably TSH and C8 (Figure 4C). The low level of significance attributed to some of the changes in analyte concentrations with differing haematocrits may be explained by the low numbers of replicates at each data point (n = 6) when compared with the previous experiment on spot size and punch location (n = 20).
Haematocrits of babies in hospital. Haematocrits for hospitalized infants routinely identified as requiring newborn screening and not known to have been transfused, n = 39. Effect of haematocrit on newborn screening results at concentrations representative of an unaffected individual (A), laboratory alert (B) and an individual referred for further investigation (C). (D) The effect of haematocrit on measured IRT concentrations in blood spots. N = 6 for each data point in A-C, n = 20 for D. Data displayed as percentage change (y axis) in analyte concentration when compared with a 50 µL centre punch at a haematocrit of 50%. Statistical analysis performed using one-way ANOVA with post-hoc Tukey test. * = p < 0.05, ** p = < 0.01, *** = p < 0.001. Error bars represent +/− standard error of the mean. R2 and p values for linear regression analysis of each measurand with increasing haematocrit. Linear regression performed using SPSS Statistics (IBM)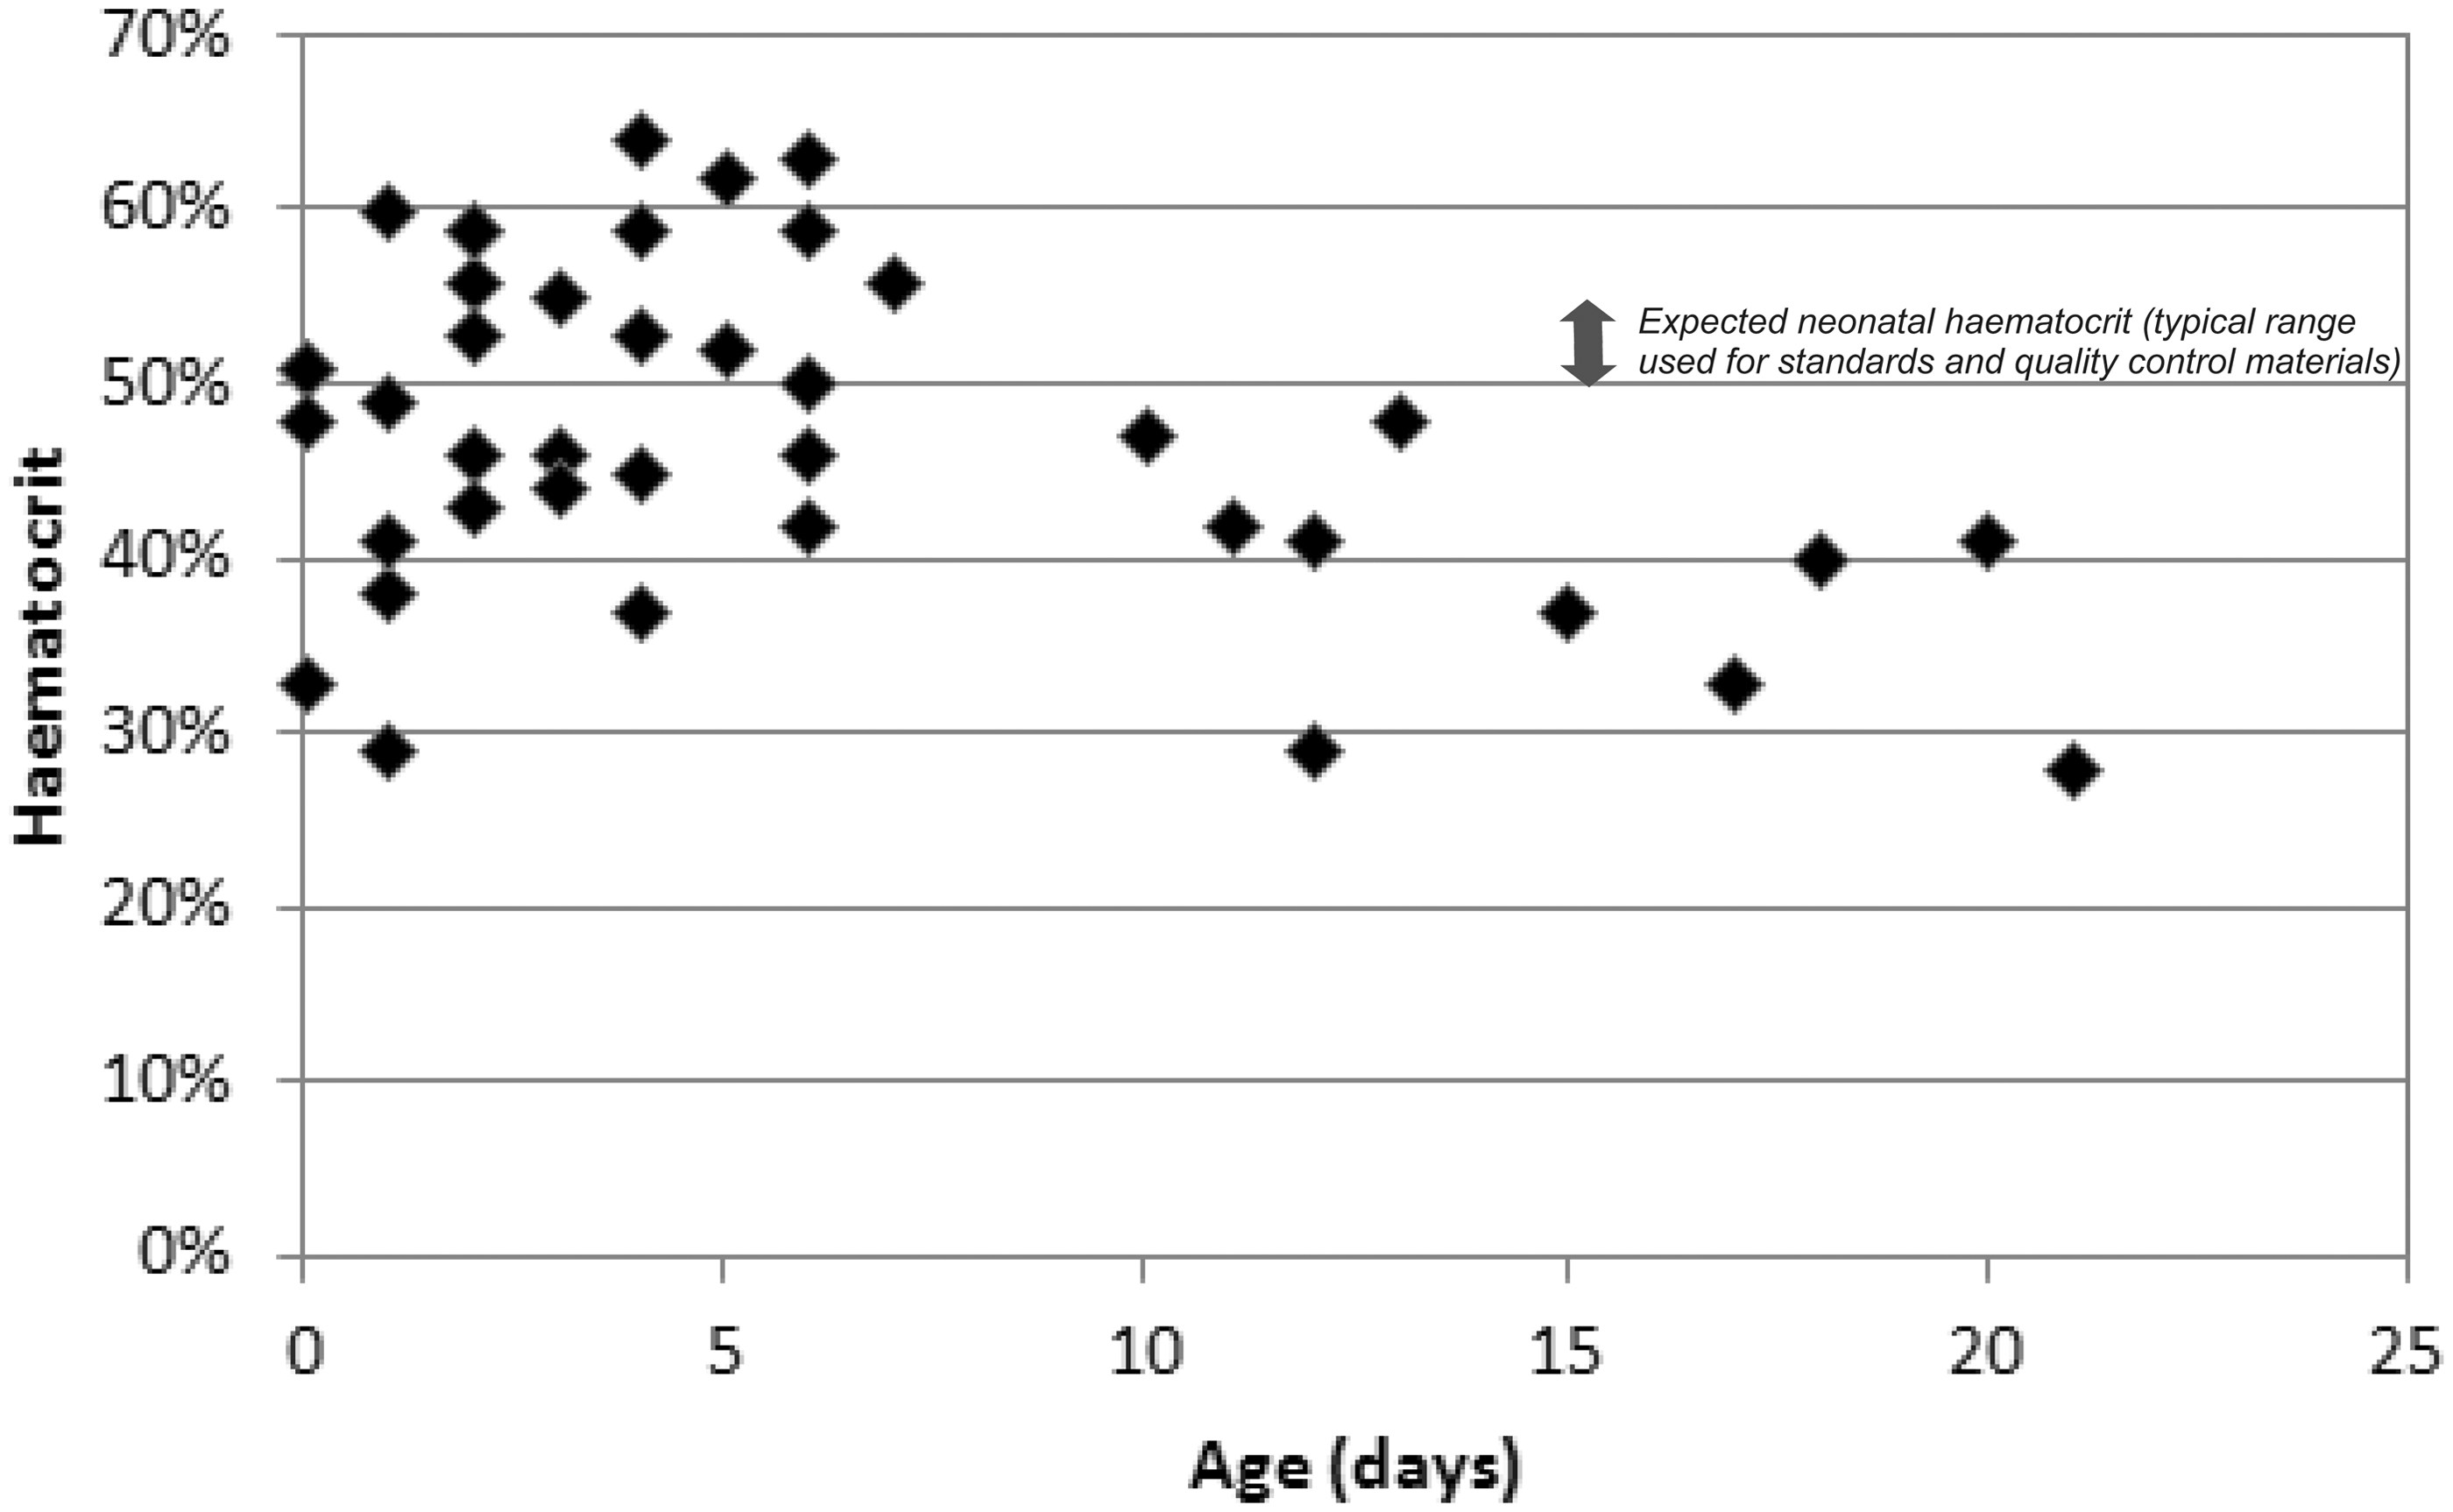
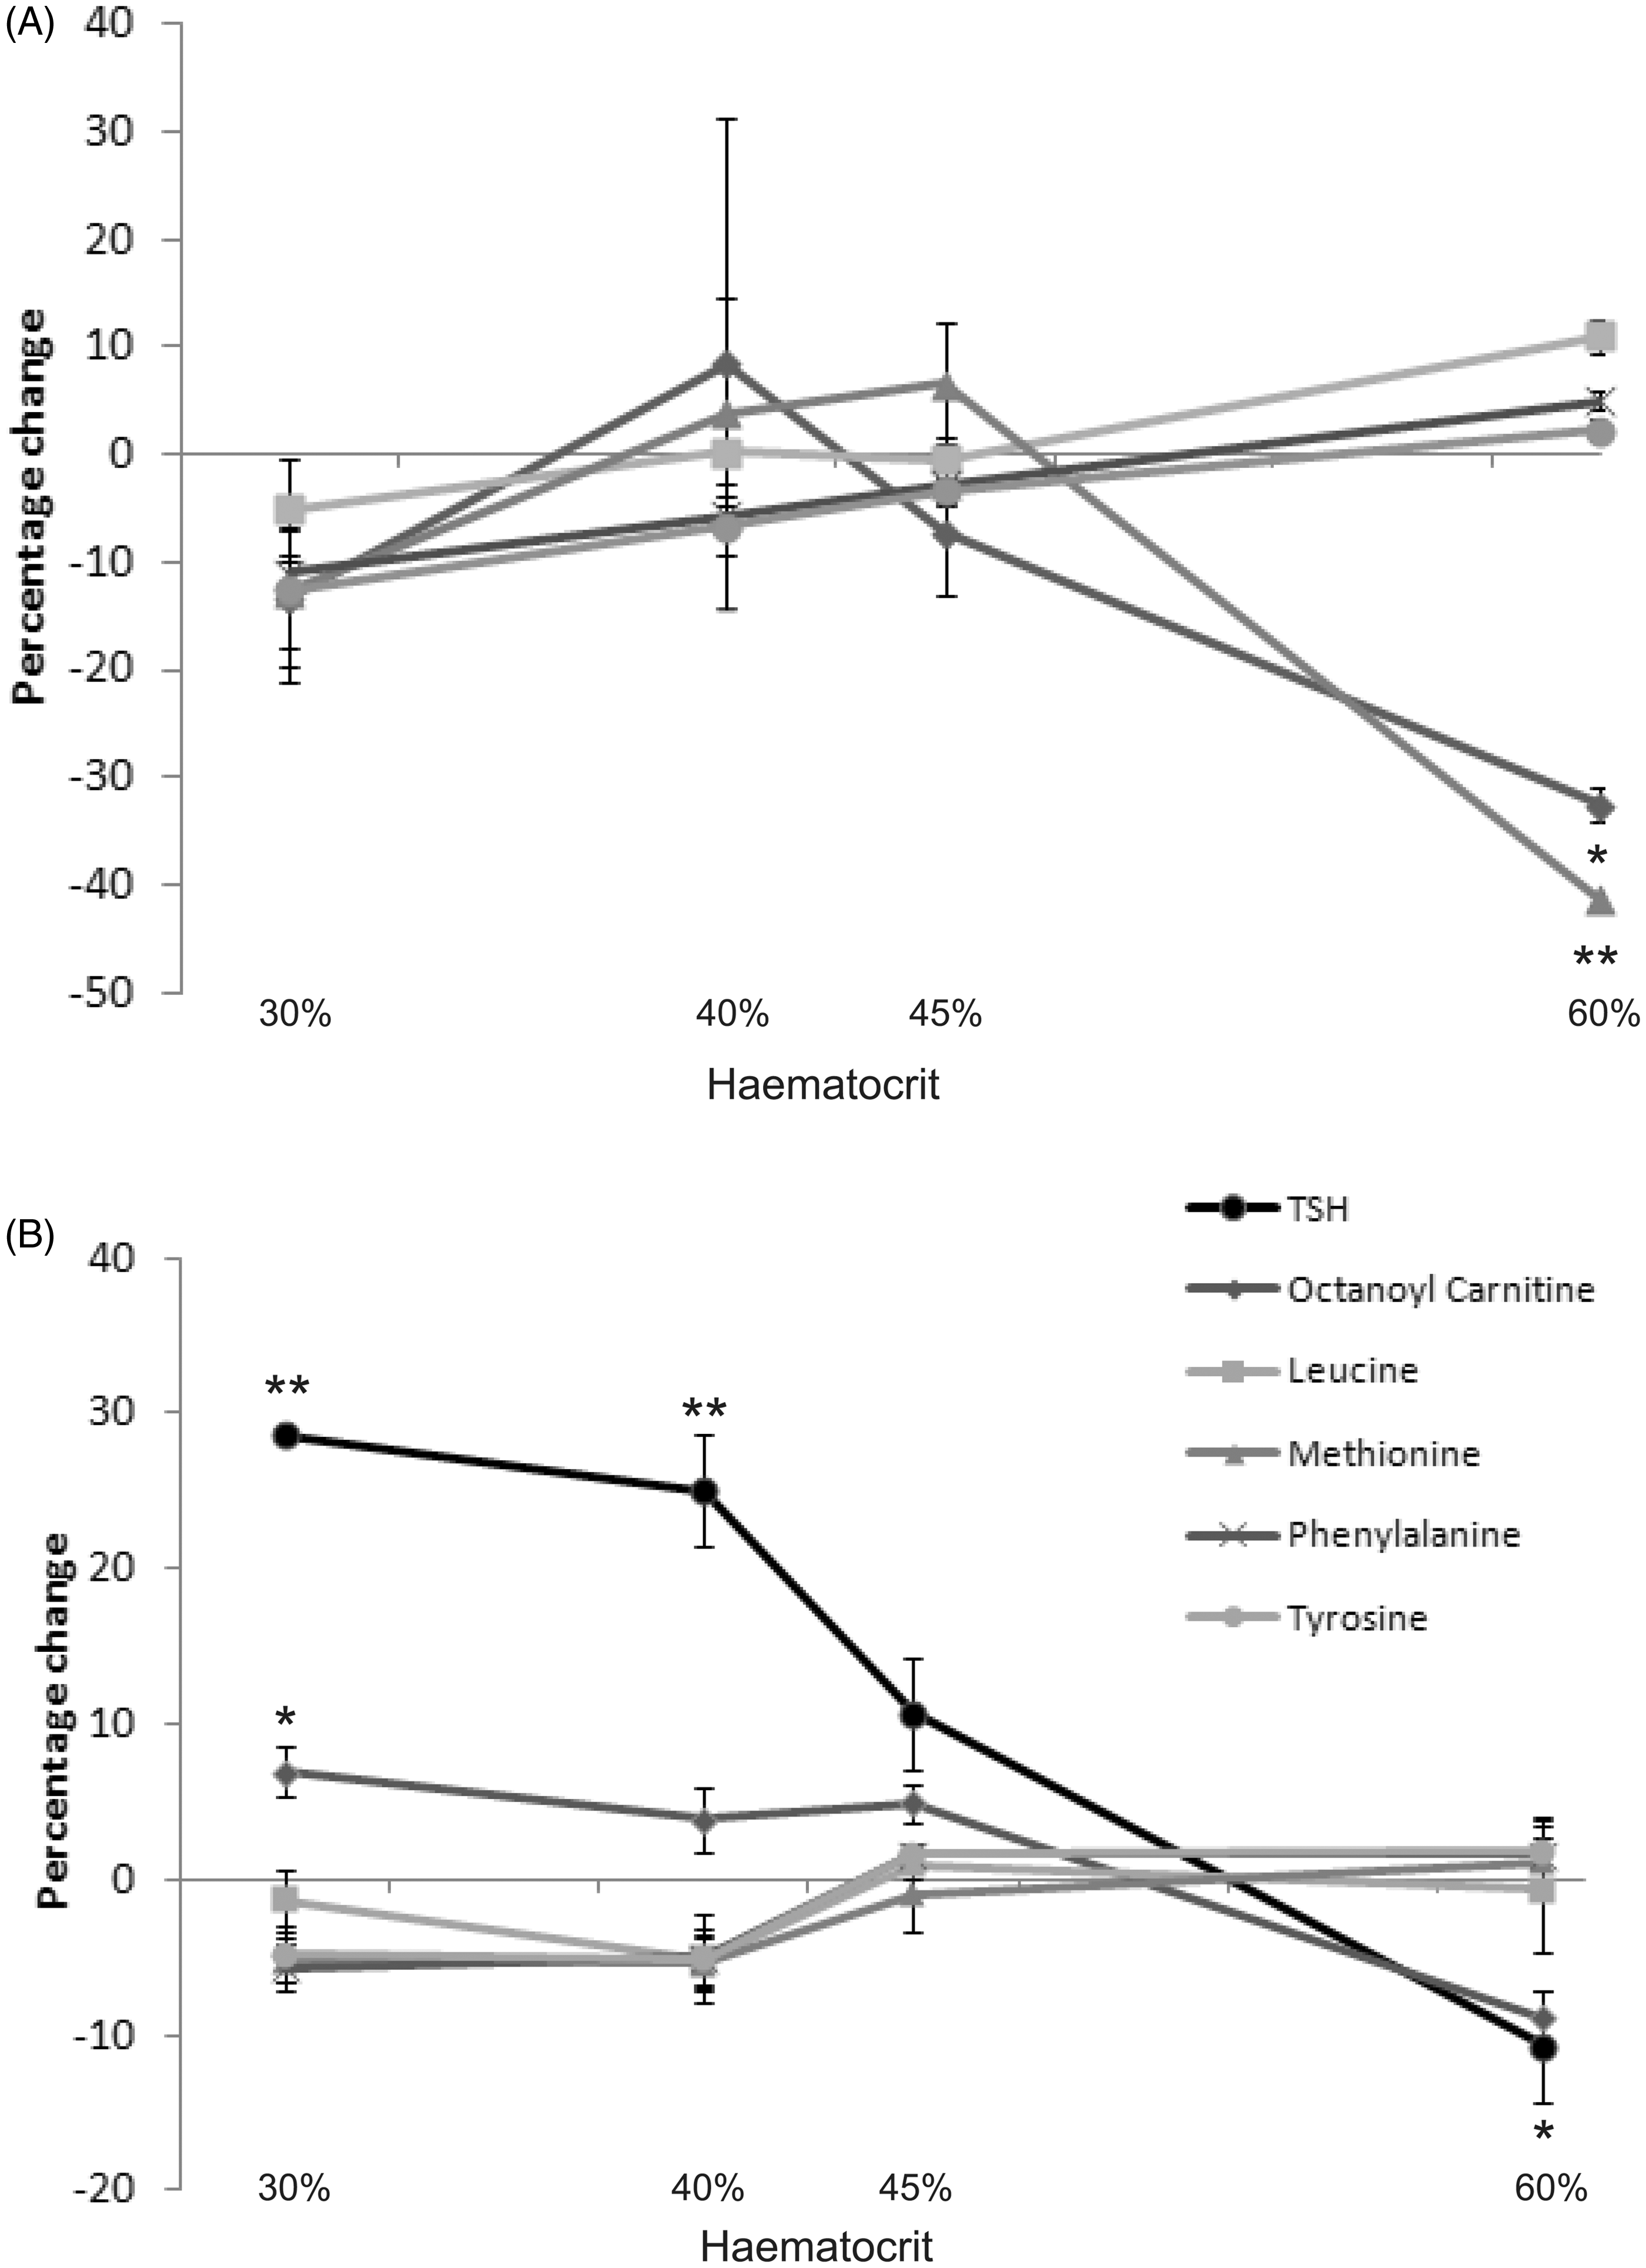
In a separate experiment, IRT concentrations were measured using spots from blood with 25% and 65% haematocrit and compared with 50% haematocrit samples. Measured IRT levels were not affected by a reduction in haematocrit but were very significantly increased, by 10–15%, when the haematocrit was 65%, at both IRT concentrations tested (Figure 4D).
Assessment of blood spot parameters using Cardscan™
To investigate the effect of blood spot size, cards were scanned using the Cardscan™ device. Light transmission through circular areas matching the punch size used for measurement of analytes showed that as blood spot areas increase, transmission of light at both central and edge locations decreases (Figure 5A and Table 4), suggesting relative compaction of red cells when larger blood volumes are applied. Comparing central transmission at different blood spot volumes, all differences were highly significant, with p < 0.001 showing reduced light transmission with increased blood spot volume, except 50 µL and 75 µL where p was <0.05. Similarly, decreasing edge transmissions with increasing volume were also highly significant, p < 0.001, again except for 50 µL compared with 75 µL, where no significant difference was shown (Table 4). For all blood volumes tested, light transmission was significantly greater at the edge of the spot compared with the centre (Figure 5A). Finally, we tested the effect of haematocrit on light transmission through the spots. Unsurprisingly, higher haematocrit values resulted in lower light transmission at the centre of spots (Figure 5B), and also at peripheral punch locations (data not shown).
Assessment of blood spot homogeneity using a Cardscan™ device. Blood spot cards were scanned and parameters recorded using provided software. (A) Effect of spot size and punch location on light transmission through the spot. Within the software, a 3.2 mm diameter circle was used to assess light transmission at the centre and edge of each spot (n = 60 for each spot size). (B) Effect of haematocrit on blood spot transmission. Transmission values for a 3.2 mm diameter circle at the centre of the spot were recorded (n = 36 for each haematocrit). Data analysed using one-way ANOVA with post-hoc Tukey test, and paired t-test to compare central and edge transmission values for each spot. Comparison of light transmission for different blood spot volumes and punch locations. One-way ANOVA with post-hoc Tukey test performed using GraphPad Prism software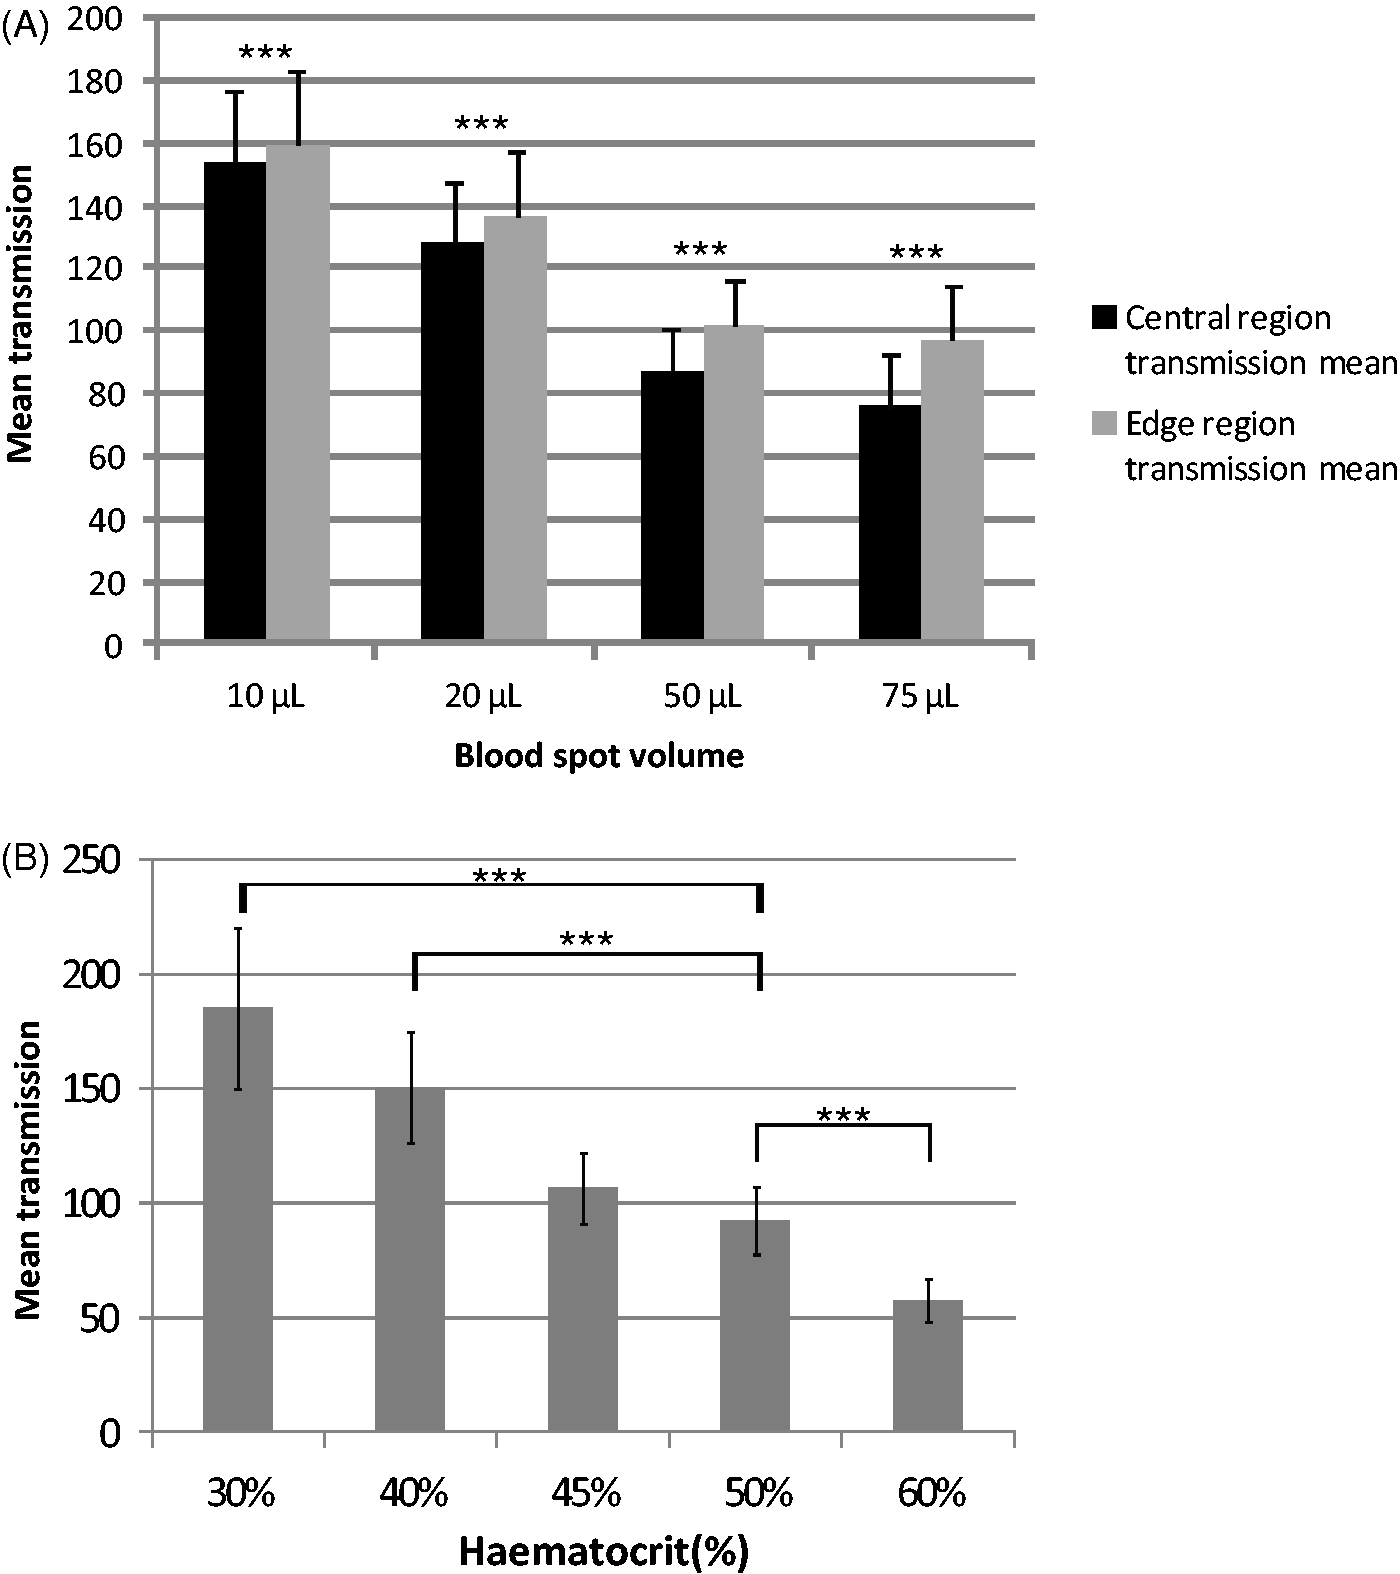
Discussion
We have shown here that blood spot punch location can significantly affect the measured concentration of an analyte. This has previously been reported for phenylalanine, 14 TSH6, and a large selection of metabolites, 15 but not using the 10 mm spot size used in England. IRT and TSH are plasma components with negligible presence in red cells, 6 and C8 and methionine are present at higher amounts in plasma compared with red cells. 16 Their concentration in blood spots will reflect the proportion of plasma in the punch; if higher fractions of plasma are present at the edge of the spot, this could explain the higher measured values we observed in peripheral punches. Our observation that light transmission through blood spots is greater at the edge, regardless of spot size, supports this theory. However, leucine, tyrosine and phenylalanine are present at similar levels in red cells and plasma, 16 so this does not explain the higher concentrations found for these analytes with peripheral punches.
Various punch machines, with differing capabilities, are used in England. The Perkin Elmer Multipuncher™ used in this study permits punching four 3.2 mm discs from both circular and oval blood spots. One punch, at least, is more likely to be central in the spot, and other(s) more peripheral, leading to greater analytical variation than taking one central punch for analysis. This may influence the triplicate mean calculated to categorize abnormal newborn screening test results, if confirmatory punches are taken from two central positions in other spots when the initial punch was peripheral.
Blood spot volume was also shown here to have large effects on measured concentrations of newborn screening analytes. In general a decrease was observed when smaller volumes were used to make the blood spots. This could represent greater migration of the sample once it is applied the filter paper, 17 and therefore a punch from a smaller spot will contain less blood. Cardscan™ transmission data presented here support this, with higher transmission values obtained from smaller spots.
The range of haematocrits we observed in a hospitalized (ie. sick) newborn English population at age 5 days or older supports Jopling's 18 reference ranges of 35–60% (mean 47%) in the term infant and 34–55% (mean 44%) in the preterm (29–34 weeks gestation), each at age 5 days. This demonstrates that haematocrits in newborn blood spots can differ widely from the 50–55% of calibration and EQA materials. The average haematocrit for a healthy 5 day old baby may ordinarily be less than 55%, and a lower haematocrit for calibration and EQA materials for this age could be more appropriate. Our observed increasing trend in leucine, methionine, phenylalanine, and tyrosine concentrations with increasing haematocrit concord with Holub's work, 15 and may be due to changes in plasma volume 20 or reduced sample spreading on the filter paper. 2
The decreasing concentration with increasing haematocrit observed for C8 differs from Holub’s 15 findings, and merits substantiation. We know of no studies to date describing the effect of haematocrit on measured blood spot TSH and IRT concentrations. Our Cardscan™ data confirm that alterations in haematocrit substantially affect the properties of the blood spot, possibly partly due to reduced migration of the blood in the filter paper. 2 A more extensive study with larger numbers of samples is needed to confirm this finding.
The blood spots in this study were produced in a laboratory environment using a dispensing pipette, which is likely to differ substantially from sample collection in the community where non-homogenous blood spots can be produced (eg. layering of spots). This will introduce additional confounding factors and could affect measured analyte concentrations if non-ideal spots are used for sampling.
Effects of blood spot size, punch location, and haematocrit could lead to false positive or false negative screening results, with consequent inappropriate investigations or missed diagnoses. It is difficult to control precisely blood spot size when collecting heel prick specimens from neonates, although detailed guidelines are available to midwives. 7 The laboratory can assist by applying agreed blood spot acceptance criteria, and preferentially selecting appropriately sized blood spots for punching. The screening laboratory also controls punch location, but given the number of punches required, they cannot all be central.
Attempts to correct blood spot test results for haematocrit have been explored by measurement of blood spot potassium, 19 light reflectance, 20 and using data from HPLC haemoglobin screening. 21 The Cardscan™ device also has this potential. 22 Our data show that variation in light transmission through the blood spot correlates with differences in measured analyte concentrations. Blood spot transmission could, therefore, be used as a surrogate marker to correct for punch location and for haematocrit, and appropriate correction could then applied to the results. This should lead to improved accuracy of newborn screening and fewer false positive and false negative results.
Limitations of the study
It would have been preferable to test alternative concentrations of IRT closer to the cut offs used in UK newborn screening programmes. Patient serum was used to spike donor blood from a different individual, and this may have affected the sample in non-discernable ways. Six replicates were tested at each haematocrit for all analytes except IRT; a more extensive study with more replicates and using more than one blood donor could confirm our findings.
Footnotes
Acknowledgements
Russell Denmeade and Deborah Finnerty (Newborn Screening Laboratory, Birmingham Children’s Hospital) coordinated the blood spot punching and analysis for all analytes. Luminex Corporation kindly provided the Cardscan™ device and associated software on loan.
Declaration of competing interests
None
Funding
Partial financial support was received from the UKNSPC for reagent use.