
Abstract
Objectives
To explore effects of a pre-screening life style survey on the subsequent attendance proportion in colorectal cancer screening.
Setting
Finnish colorectal cancer screening programme in 2011.
Design
Double randomized and controlled follow-up design.
Methods
The study population comprised of 31,951 individuals born in 1951. In 2010 to a random sample of every sixth (n = 5,312) person we sent a 7-paged life style questionnaire, and to another random sample of every sixth person (n = 5,336) a 10-paged life style and quality of life questionnaire. One year later, in 2011, 31,484 individuals of the original cohort were independently randomized (1:1) for colorectal cancer screening (n = 15,748) or control group (n = 15,736). Of those who were invited for screening, 5185 had received a questionnaire during the previous year.
Results
5870 individuals (55.1 %) responded to the questionnaire in 2010. The overall attendance at screening in 2011 was 59.0 % in those born in 1951 (i.e. the 60-year-olds). In those who had been sent the survey the attendance in screening was 56.6% (57.3% for the short and 56.0% for the long questionnaire) and in those who had not received the questionnaire it was 60.2% (P < 0.001).
Conclusions
We believe that the observed reduction in attendance in those who had been sent a questionnaire earlier is generally true. Thus, if any survey is enclosed in the screening invitation, this finding should be taken into account when planning the programme. Any extra effort requested may reduce the attendance proportion for screening, reducing the population level impact of screening.
Keywords
Introduction
Colon and rectum cancers together are the third most common cancer site by incidence among Finnish men and women combined, with over 2500 new cases annually. 1 Colorectal cancer (CRC) incidence and mortality can be reduced by repeated faecal occult blood testing, followed by colonoscopy for test positives.2,3 A population-based programme for CRC screening by biennial faecal occult blood testing for 60–69 year olds has been running in Finland since 2004. The screening is voluntary for the municipalities to organize. An experimental design has been incorporated for public health evaluation, using individual level randomization of the target population into screening and control groups. 4
For a cancer screening programme to be effective from the mortality-lowering aspect, a high participation rate is crucial. The Finnish CRC screening has achieved high attendance: from 2004 to 2007, overall attendance was 71%. Participation was better in women (78%) than in men (62%)5,6 and in older age groups than in younger people.
Screening programmes provide a useful setting in which to conduct epidemiological surveys, but there is a risk of lowering attendance if participants are asked to submit to extra investigations. In evaluating the effects of CRC screening, information on life style, quality of life, and costs is also needed. In Finland, the “Psychosocial effects of colorectal cancer screening study” was incorporated into the CRC screening programme in 2010. The study utilizes a prospective, randomized and controlled study design to ensure an unbiased setting. Life style and quality of life are assessed through a self-administered postal questionnaire at two stages, at baseline one year before the first possible screening invitation, and a similar questionnaire one year after the first invitation (Figure 1). A comparison can then be made on how different life style related factors change among the invited and the control population, and the possible effect of screening on health habits can be evaluated.
Study design of Psychosocial effects of colorectal cancer screening study.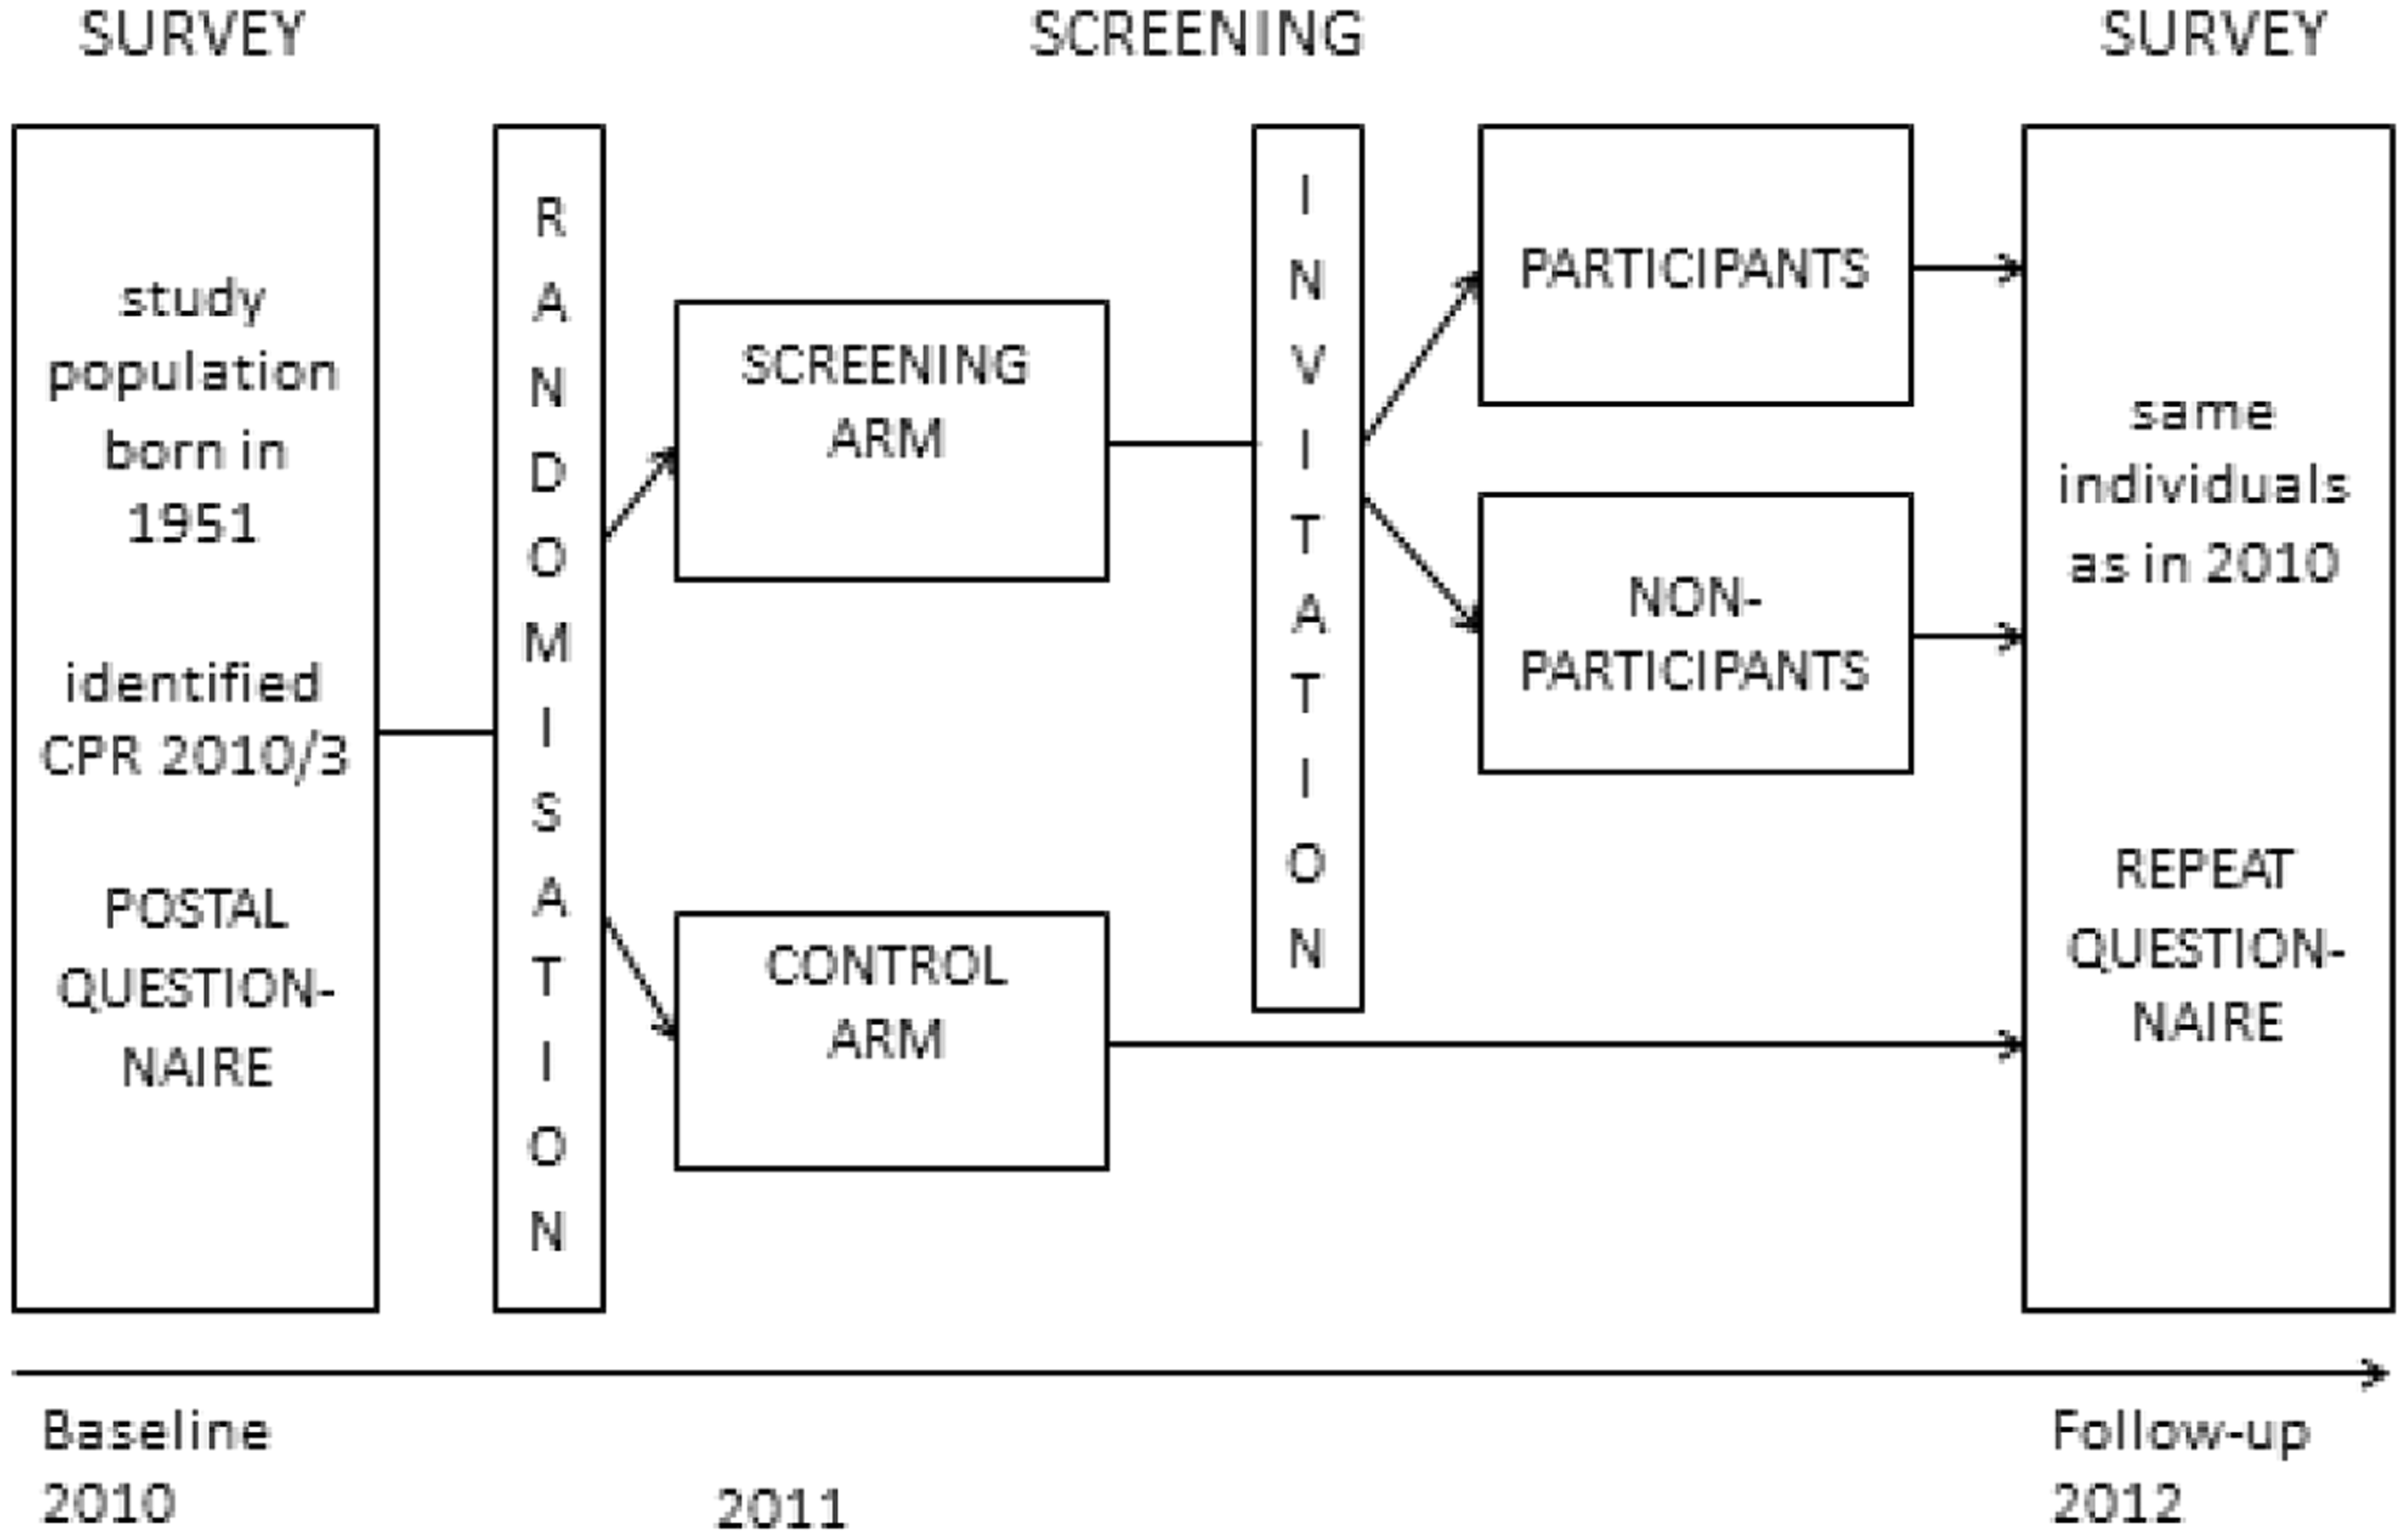
We here attempt to determine whether sending a short (7-paged) or long (10-paged) questionnaire on life style and quality of life one year before the first ever screening invitation has an effect on uptake of screening. We also investigate whether this effect varies between different groups according to background demographic factors.
The study design was approved by the Helsinki and Uusimaa hospital district Ethics Committee (15.12.2009, 420/13/03/00/2009).
Methods
Study population
The study population was comprised of those born in 1951 and living in municipalities involved in the CRC screening programme (148 out of total 342 in 2010). These individuals were to turn 60 in the calendar year 2011, when the first invitation to CRC screening was due. Individual data on the target population (n = 31,951) was provided by the Central Population Register (CPR) in March 2010. Random allocation of 1:2 resulted in 10,648 individuals to whom questionnaires were mailed in May 2010. Of these, a random 5312 received a 7-paged questionnaire and 5336 a 10-paged questionnaire.
In 2011, a randomly selected half of the target population received their initial Finnish CRC screening programme invitation. This programme randomizes (1:1) to screening or control groups in men and women aged 60 and eligible for screening for the first time. 4 Survey randomization and screening randomization were independent of each other. There were no exclusion criteria in either the survey study population or in the screening programme.
Questionnaire
The self-administered postal questionnaires were designed in collaboration with experts in life style and quality of life research, and as far as possible incorporated questions of the type used in the “Health Behaviour and Health among the Finnish Adult Population” validated annual postal survey carried out since 1978. 7 The main reason for this was to enable comparisons between respondents and respective age groups within our study and those in the annual survey.
The two questionnaires were the short (7-paged) “life-style questionnaire” and the longer (10-paged) “life style and quality of life questionnaire”. The short questionnaire included 30 questions divided into seven sections: socio-demographic background data of the respondents, smoking, alcohol consumption, exercise, diet, health status and CRC related questions. The longer version included an additional section measuring health related quality of life with the Finnish 15D instrument. 8 Two different questionnaires were used in order to build a dose-response relationship on any potential effect. The questionnaire type was also randomly allocated in a 1:1 ratio. The questionnaires were sent in Finnish or in Swedish as determined by the respondents’ CPR data, and a form for written informed consent was also included.
Analysis
To assess the association between CRC screening attendance and inclusion in the survey study, two-way tables were used. Statistical significance was tested with χ 2 test. CPR data on background characteristics that included gender, marital status, mother tongue, habitation, and geographical area were available for all participants, and were linked with data on CRC screening for invitations and participation. Marital status was categorized from CPR data as either having a partner (married or civil partnership) or not (single, divorced, separated or widow/er). Place of residence was categorized as urban or rural according to the classification by Statistics Finland, which has been in use since 1989. Geographical area was by place of residence in the five areas: Southern, Western, Middle, Eastern, and Northern Finland.
Screening attendance proportions were compared between those who received a questionnaire and those who did not, and between those who received a short versus a long questionnaire. The differences in attendance were quantified with 1) absolute attendance difference and 2) relative attendance difference, which takes into account the attendance rate for screening in those who did not receive any questionnaire. The absolute difference is the difference in attendance between those who had received a short or long questionnaire, and those who had not received any questionnaire, before their screening invitation. The relative attendance difference is the absolute difference divided by the attendance percent in the referent population not receiving any questionnaire. Response to the questionnaire was designated as “participation” and response to screening as “attendance”.
Statistical analysis was performed using software package STATA 11.0.
Results
In May 2010, 10,648 randomly selected individuals from the study population were mailed the study questionnaires. The rest (n = 21,303) were not contacted (Figure 2). A reminder letter was sent to non-responders after four weeks in June 2010. In December 2010, the questionnaires were resent to those who still had not responded. After exclusions (empty return forms, wrong person responded, returned refusals, same person responded twice) the final survey response rate was 55.1% (n = 5,870) (Figure 2). The response rate in women was higher than that in men (60.5% and 49.8%, respectively).
Flow chart on survey and screening attendance of the survey population.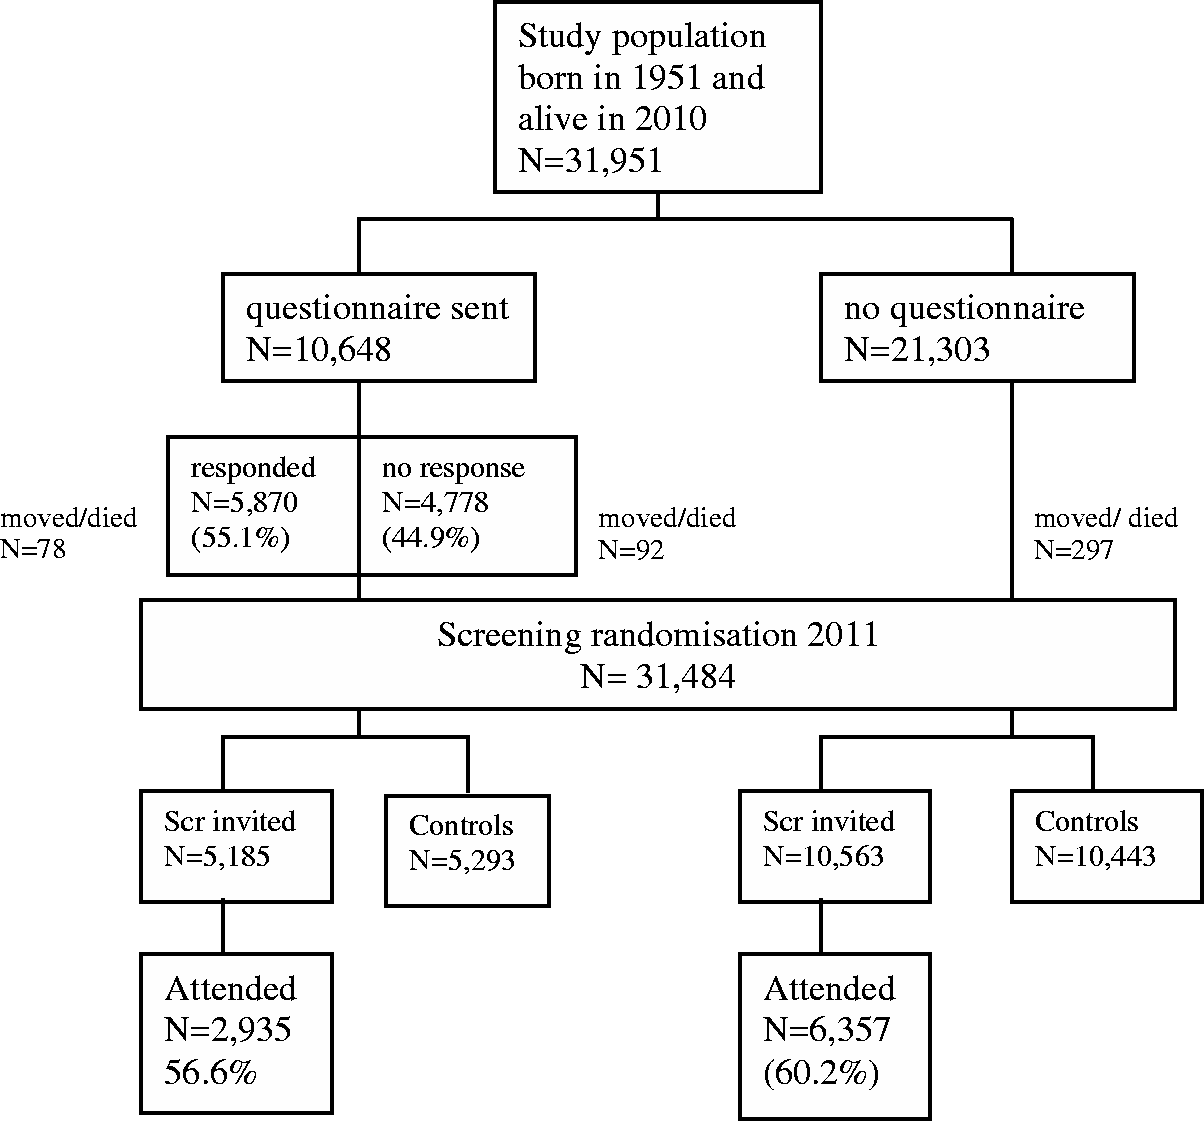
In January 2011, the target population of CRC screening born in 1951 (n = 32,072) was randomized 1:1 into screening arm (n = 16,037) or control arm (n = 16,035). Of the 2010 survey study population 467 individuals had either died or moved to a municipality not involved in colorectal cancer screening programme or abroad, and were no longer in the target population. There were 31,484 individuals randomized twice, first for the survey and later for screening, of whom 15,748 were invited for screening (Figure 2). The overall attendance rate for screening in the 60 year-olds in 2011 was 59.0% (n = 9,292). The attendance rate of 60-year-olds had shown a downward trend in the course of CRC screening in Finland (Figure 3).
Attendance of 60-year-olds in Finnish colorectal cancer screening programme 2004–2010 by sex.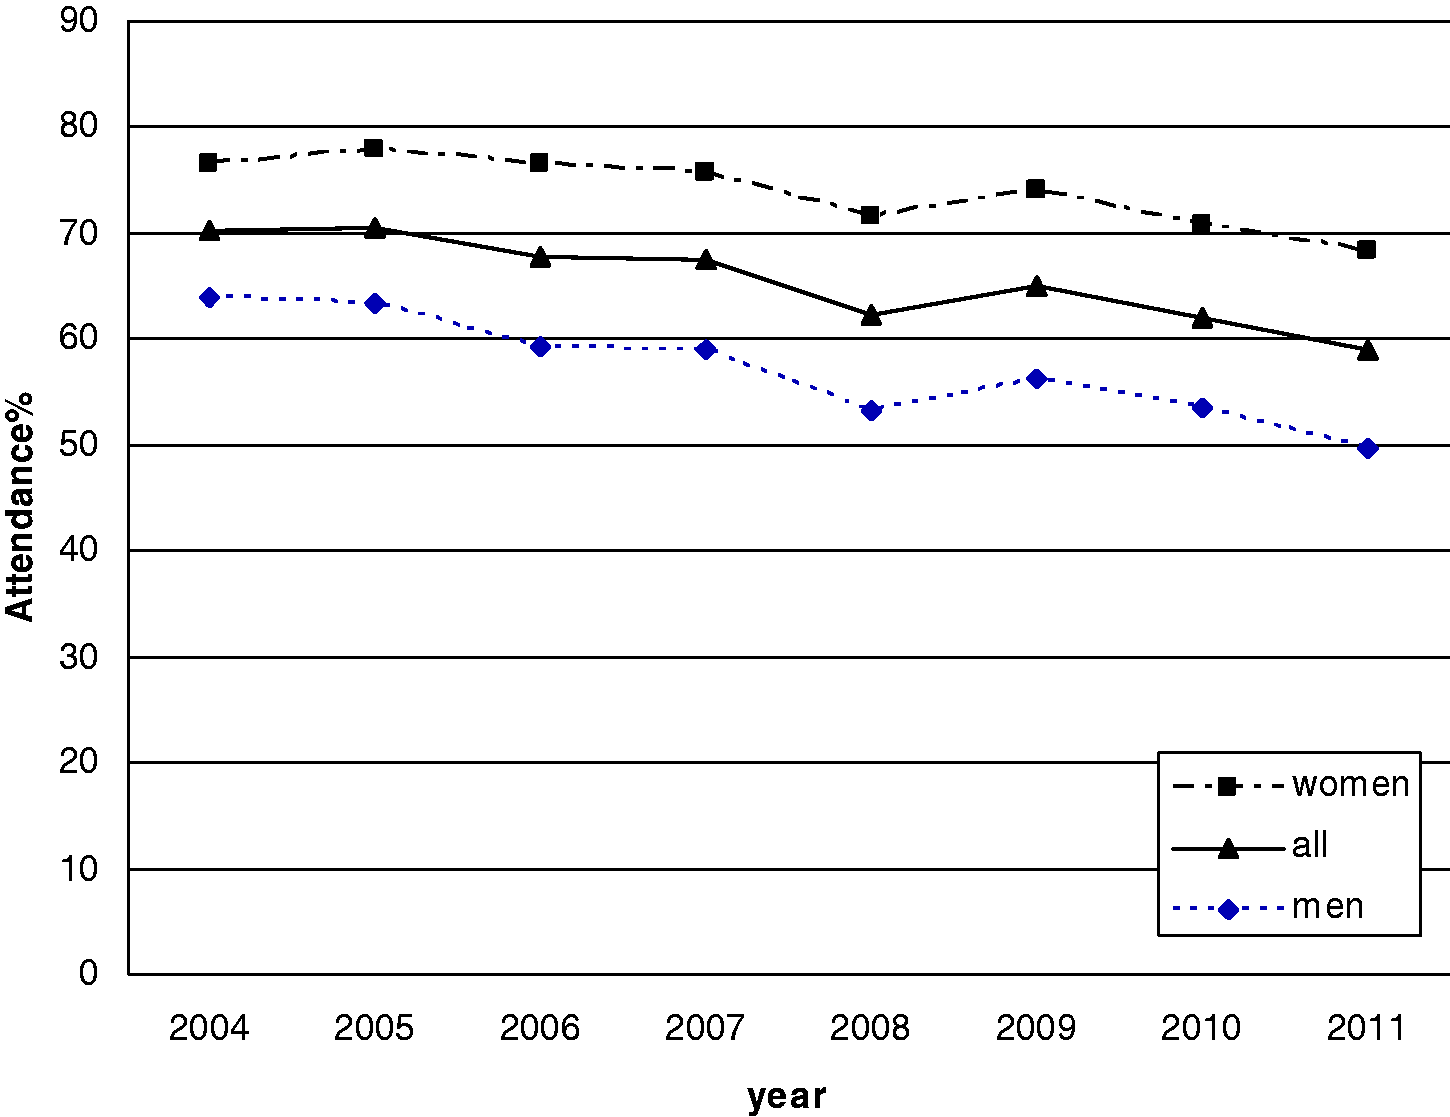
Number of individuals invited, attending and attendance proportions for colorectal cancer screening 2011 in Finland among those who had been sent a survey study questionnaire in 2010 and those with no preceeding questionnaire.
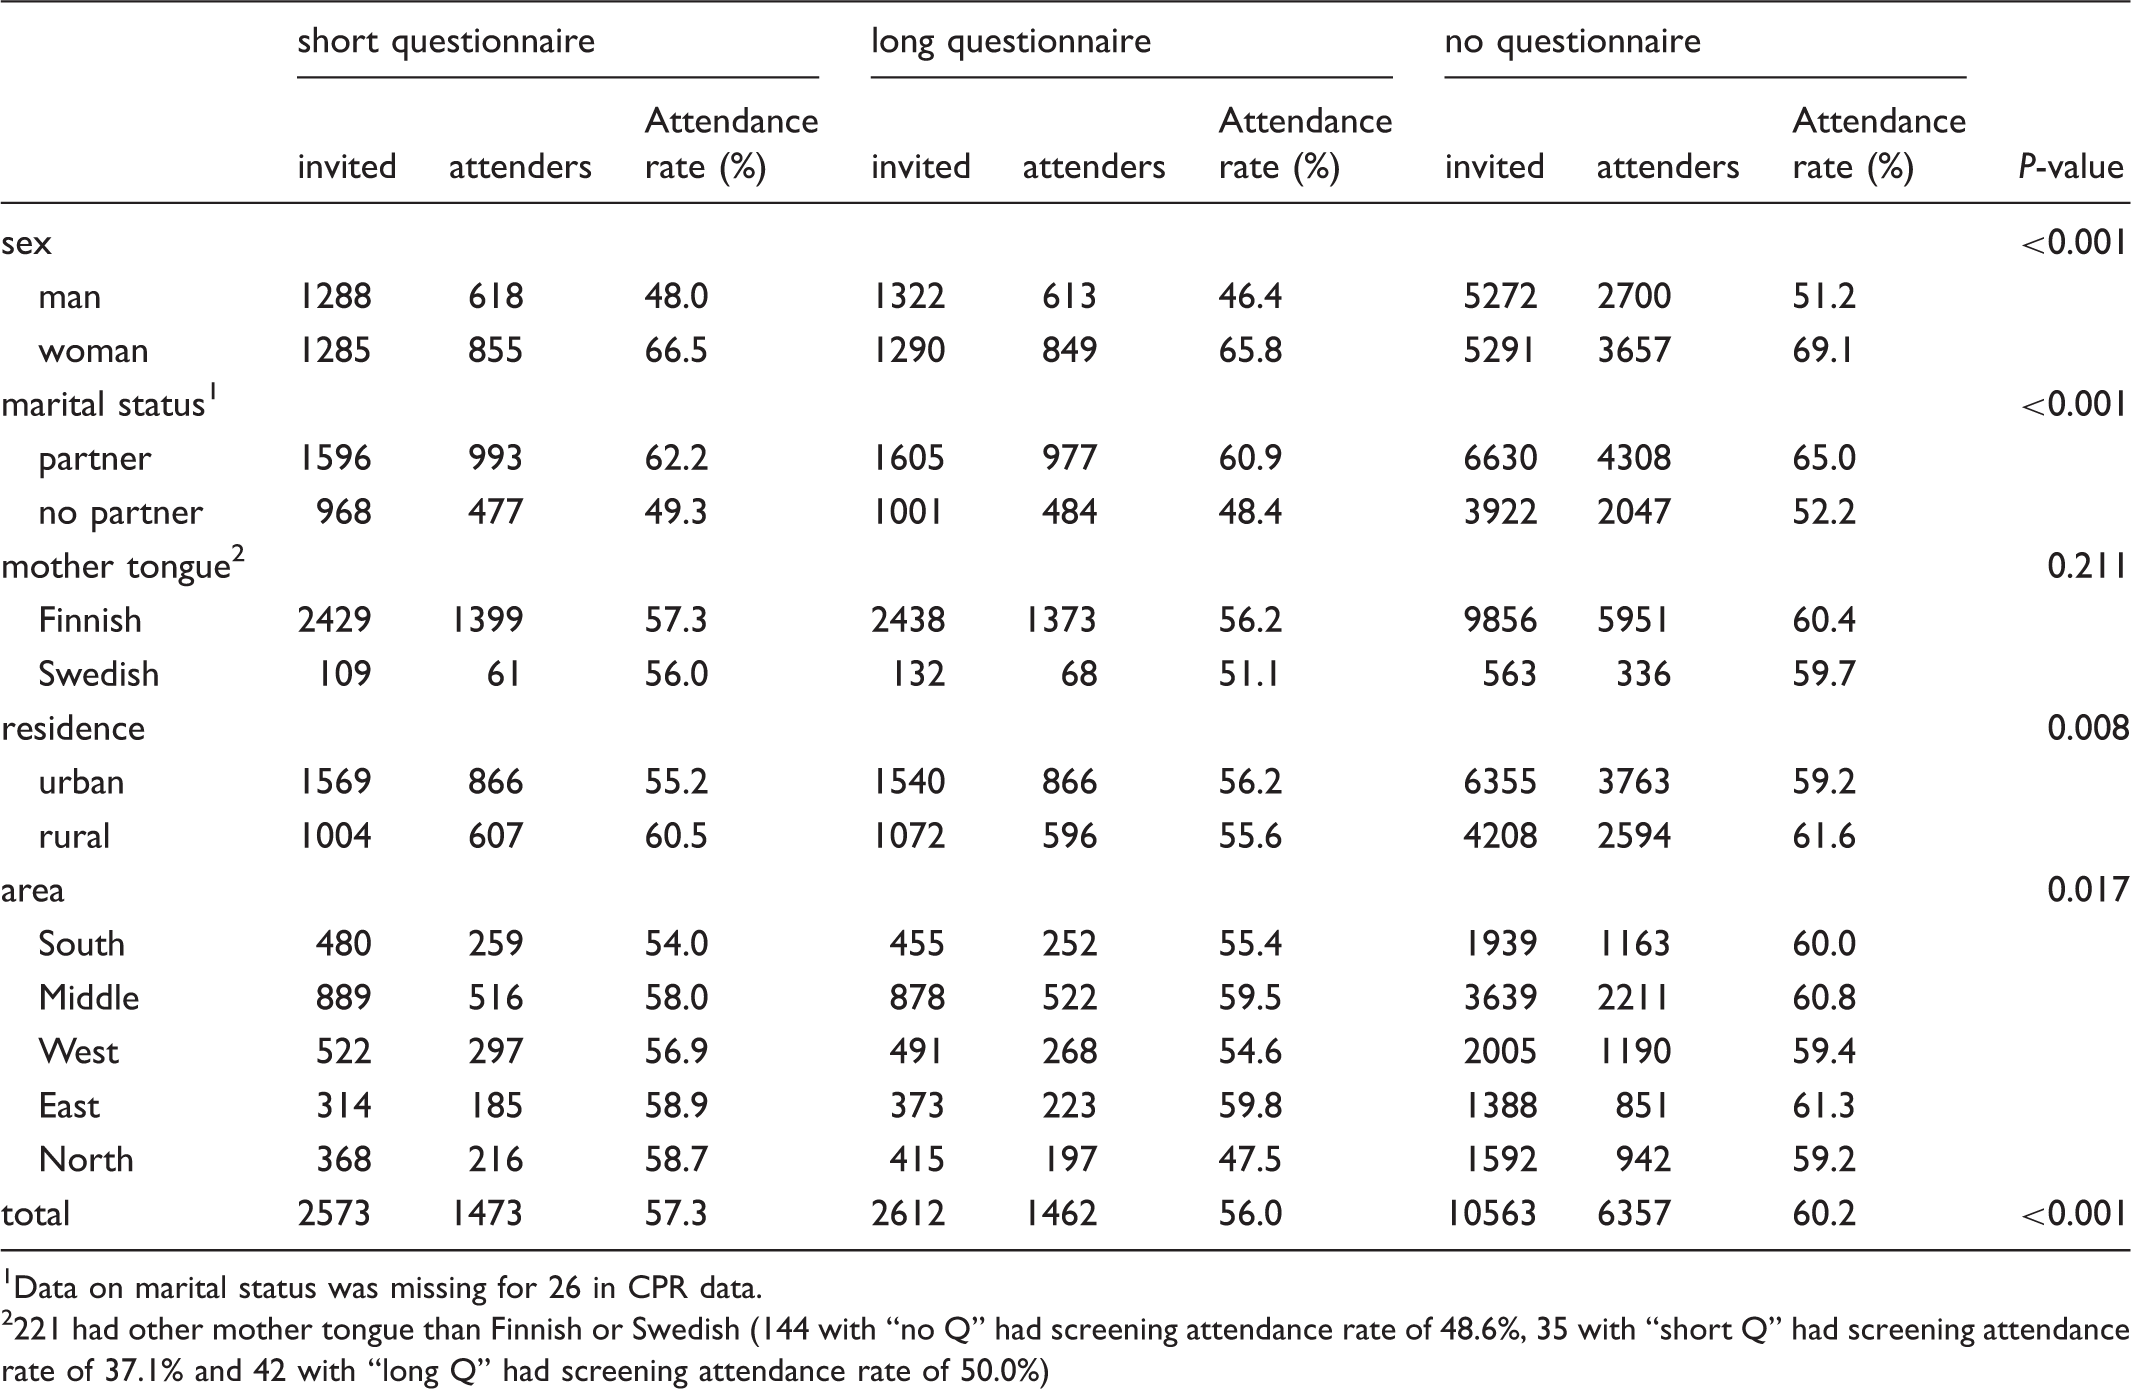
Data on marital status was missing for 26 in CPR data.
221 had other mother tongue than Finnish or Swedish (144 with “no Q” had screening attendance rate of 48.6%, 35 with “short Q” had screening attendance rate of 37.1% and 42 with “long Q” had screening attendance rate of 50.0%)
Attendance to colorectal cancer screening in those with no previous questionnaire (No Q-group) and absolute and relative difference between those who had been sent a short (short Q), long questionnaire (long Q), or any questionnaire (any Q) before.
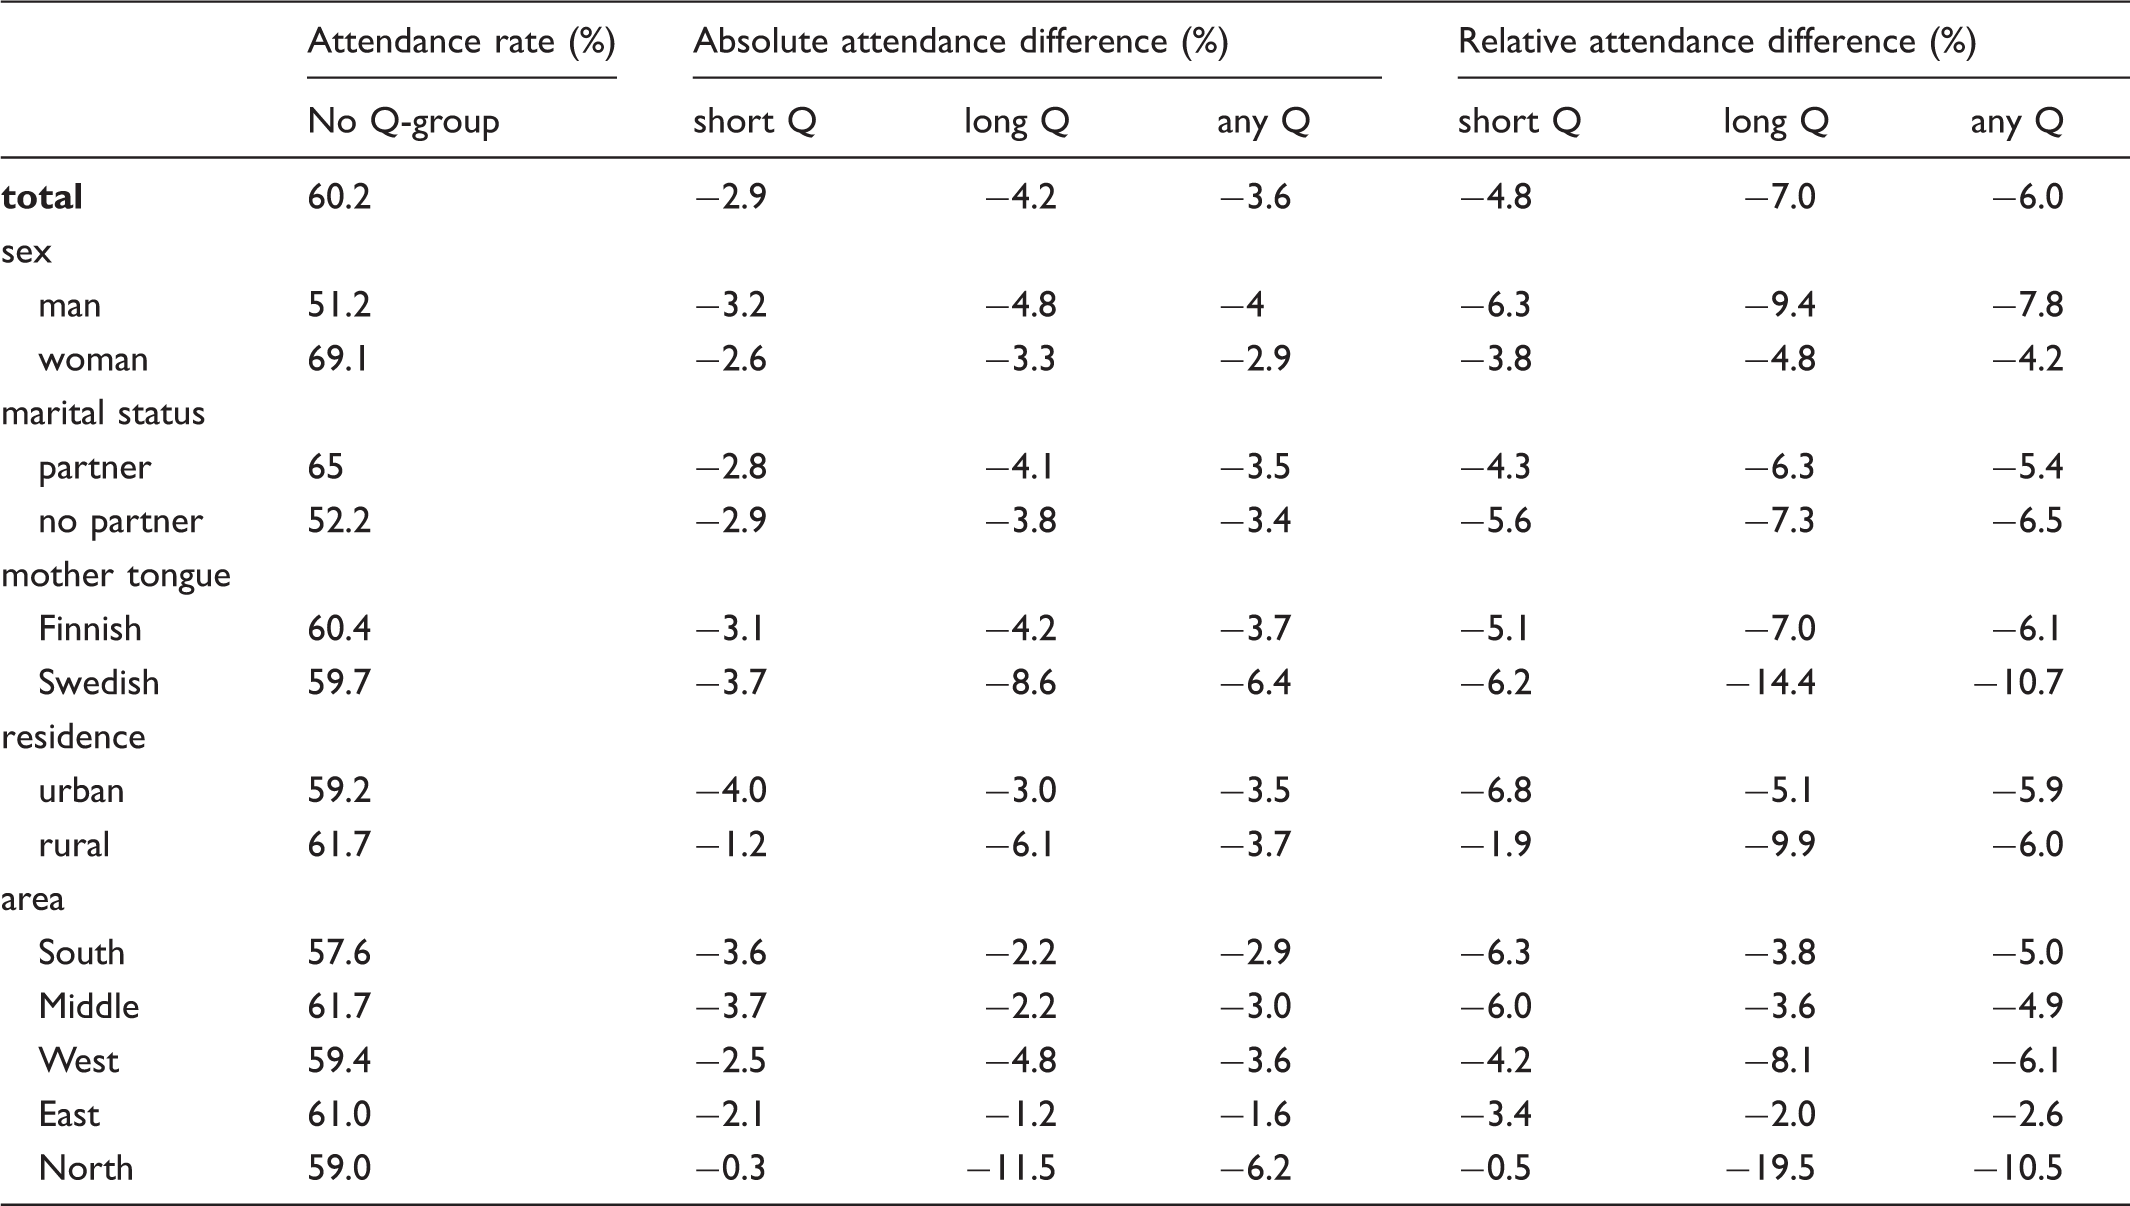
The longer questionnaire was more detrimental for the future screening attendance than the shorter one. This was most obvious in Northern Finland, where the short questionnaire did not affect screening uptake much, but the longer one lowered uptake considerably (19.5%) (Table 2).
Discussion
There were two important considerations in our study design: firstly, the value of a valid control group, and secondly, the necessity for all conclusions to be made based on a randomized design.
For several reasons, organized screening with personal invitations may be an ideal setting for incorporating different kinds of survey initiatives. Population-based screening has the advantage of reaching the total population of a pre-defined target group. Well-established screening may already have gained support within the population, which could also help to diminish the barriers to participation in studies embedded within the screening setting. It is important, however, that combining any extra research into routine medical practice should not have a detrimental effect on screening participation, as this is vital in achieving the primary aim of screening - in this instance, cancer-specific mortality reduction. Two reviews on the determinants of participation in CRC screening9,10 have suggested that participation patterns depend on local circumstances, highlighting the need to acquire information on programme participation.
Our results suggest that sending a 7- or 10-paged questionnaire to potential participants one year prior to the first screening invitation had an effect on screening uptake. Screening attendance rate was 60.2 % among those who were not sent the questionnaire, and 56.6% among questionnaire-receivers. In addition, the longer questionnaire had a more detrimental effect on screening attendance than the shorter one. Sending a questionnaire may adversely affect future screening attendance, and the longer the questionnaire, the greater this effect.
The strengths of our study include the randomized and controlled design, with no exclusions in the invited population-based sample.
Inclusion of a self-administered questionnaire accompanying the invitation to routine breast cancer screening did not affect the screening uptake in a randomized setting in the Netherlands in 1992, nor in southern England in 1994–1996.11,12 It is noteworthy that these studies only contacted target individuals once, whereas in our study target individuals were contacted 1–3 times (questionnaire, reminder, resending of questionnaire). In the Dutch and UK studies, conducted over a decade ago, target groups consisted only of women aged 50–70 11 or 50–64. 12 Our study included only one age cohort of 60-year-olds.
In general, women and married individuals tend to participate in surveys more actively than men and single or divorced people. The same pattern can be observed in screening attendance, and has been evident since the launch of the Finnish CRC screening programme in 2004. 13 The youngest age group has the lowest attendance in Finland, and there has been a downward trend for many years. Compared with 2010, attendance rates in 2011 were worse, even without the extra lowering effect of survey (60.2% vs. 62.1% in 2010; men 51.2% vs. 53.4%, women 69.1% vs. 70.8%). It could be argued that the survey manifested a strengthening of an existing trend.
The absolute differences in attendance rates by various background factors were mostly modest. For example, the absolute difference in attendance rates by marital status was 2.9% in women and 4% in men. After correcting for attendance relative to those who had not received a survey, these rates changed to 4.2% and 7.8%. Overall, the absolute differences in screening attendance rates were not large, but after correcting for attendance relative to those with no survey, the relative differences were larger and had more variability. Using the same method to assess the effect of marital status showed that sending a questionnaire decreased attendance at screening more in those without a partner than in those with a partner (6.5% vs. 5.4%).
In 2011 the Finnish CRC screening programme carried out 9,462 primary tests in 60-year-olds, resulting in 343 positive results, equating to 3.6% of participants. We estimate that, if there had been no survey in 2010, the overall screening attendance rate would have been similar to that among those who did not receive the pre-screening questionnaire, ie. 60.2%. This would mean that 192 more individuals would have attended screening (60.2% out of 16,037 invited, instead of 59.0% now reached in the 60-year old population). We therefore calculated that, because of the survey, an estimated seven positive test results were not produced (3.6% x 192). Out of 343 test positives in 2011, 86 (25%) were diagnosed as having an adenoma (n = 76) or CRC (n = 10) in the follow-up colonoscopy. With seven test positives, there would have been two more expected adenomas. However, if we had sent a questionnaire to all of the cohort and gained an overall attendance rate of 56.6% (attendance in those who were actually sent the questionnaire in 2010), the loss of people attending would have been close to 577 individuals (56.6% out of 16,037 invited instead of 60.2%). Especially in the subgroups where the relative decrease in attendance was most marked (eg. in Northern Finland), this could also affect screening results, as non-attendance may be selective. Even if no substantial harm was caused, on this occasion, to our target population, we do not generally recommend a policy of combining surveys with screening programmes.
We will monitor the future CRC screening behaviour of this study group. The same invited individuals were re-invited to CRC screening in 2013, after a two year interval. In the previous year (2012) the study group had been subjected to the follow-up questionnaire of “Psychosocial effects of colorectal cancer screening”. Extending monitoring until 2015 (when there will no longer be any further pre-screening questionnaire) will ultimately disclose whether or not the effect of questionnaires on screening attendance is long-term.
Why does sending and receiving a questionnaire lower future screening uptake? Though the questionnaires were mostly about general life style in terms of diet, physical activity, smoking and alcohol use, the accompanying covering letter referred to the study ”Psychosocial effects of colorectal cancer screening” as a whole. In this way, the questionnaire was linked to screening. The screening invitation may then have been perceived by the recipients as burdensome when dealing with the same matter again, even though it was clearly stated that participation in the survey was completely voluntary and it would not affect screening randomization. In previous studies on colorectal cancer screening participation, sending a pre-screening notification two weeks prior the screening invitation has had a positive effect on screening participation.14,15 We therefore suggest that the nature of the pre-screening contact, not the contact per se, is pivotal. Requesting effort on the part of the recipient may be harmful for future screening willingness.
Simultaneous mailing in the same envelope is the standard method to incorporate an extra survey into routine health activity. It is reasonable to assume that such extra effort reduces the willingness to participate even more than was observed in our study with a one year lag between these two activities (survey and screening). Therefore, in a real life situation, the observed effect may be sufficient to preclude incorporating any extra material in an activity like a screening invitation.
In conclusion, sending a pre-screening survey reduced attendance in colorectal cancer screening. This risk of lowering participation should be taken into account when planning to exploit the screening context in conducting epidemiological surveys or other intervention studies.
Footnotes
Funding
This research received no specific grant from any funding agency in the public, commercial, or not-for-profit sectors. The Finnish Cancer Organisations are thanked for issuing psychosocial cancer research grants for the project.