
Abstract
Biocomposites of poly(lactic acid) (PLA) and micrometre-sized graphite (GP) flake powder with 0–30 wt% GP contents have been prepared using extrusion moulding followed by compression moulding. The pure PLA and PLA-GP composites (PGC) have been examined by Fourier transform infrared (FTIR) spectroscopy, Raman spectroscopy (RS), X-ray diffraction (XRD) technique, scanning electron microscopy (SEM), transmission electron microscopy (TEM), mechanical and micromechanical testing, differential thermal analysis (DTA) and thermogravimetric analysis (TGA). FTIR spectra confirm the physical bond formation between GP and PLA. RS distinguishes the D-band spectra of pure PLA and PGC. XRD shows a partially crystalline structure in the PLA. SEM and TEM exhibit a clear dispersion of GP particles in PLA matrix at lower loading and aggregates at higher loading. With an increase of filler content, the tensile and flexural strengths decrease, but the Young’s and tangent moduli are observed to increase by 58% and 77%, respectively. These increments represent an increase in the stiffness of the materials and are found to be consistent with the theoretical values. A decrease in microhardness with increase in filler content is also observed. Both the DTA and TGA reveal an increased thermal stability of the composites.
Introduction
Recently, there has been a rising demand for biodegradable polymers due to increased environmental awareness and a growing concern about the disposal of synthetic plastic waste. These ecological and disposal problems make the consumers more reluctant to use commodity materials manufactured from synthetic plastics. As a consequence, research on biopolymers is very attractive to researchers. Many biopolymers are derived from renewable resources, such as plant-based feedstock. Poly(lactic acid) (PLA) is such a biopolymer; it has compostable characteristics and has become a material of choice due to its high strength and moderate barrier properties like synthetic plastics. 1 Hence, it is believed that neat PLA or PLA composites can meet the requirements for end-of-life disposal issues. PLA is a highly transparent and rigid material with a relatively low crystallization rate that makes it a promising candidate for the fabrication of films, containers, stretch-blown bottles, drug delivery and packaging materials, 2,3 and its composites have potential or actual applications in the construction sectors. 4 -9 With a tremendous increase in production capacity over the past years, PLA has become an interesting material for engineering applications (electronic and electrical devices, mechanical and automotive parts, etc.), but it is necessary to tailor its properties to reach the end-user demands. For further applications, the profile of PLA properties can be tuned by combining its matrix with uniformly dispersed fillers, impact modifiers, flame retardants, plasticizers and so on. 3,5 -8
However, PLA has drawbacks for some applications owing to its brittleness. 10 Therefore, increasing the crystallization speed of PLA is desirable. 11 In order to increase the crystallinity in PLA, three main routes can be considered: (i) addition of a suitable nucleating agent, (ii) addition of a plasticizer and (iii) selection of moulding conditions. 12 Several potential nucleating agents for PLA crystallization have been examined previously and reported in the literature. 13 -16 However, no report on the use of graphite (GP) flakes for PLA crystallization can be found. Although GP has been employed for properties reinforcement in synthetic polymers, the use of GP in PLA reinforcement has just started. 17 -20 GP can be used as a potential alternative reinforcement, because it contains a graphene nano-layered structure with superior mechanical and thermal properties like carbon nanotubes (CNTs) and is much cheaper than CNTs. It has high conductivity of electric current and heat, low thermal expansion coefficient, high thermal stability, relatively low specific gravity, high resistance to aggressive chemical compounds and valuable tribological properties (self-lubrication).
To the best of our knowledge, although a few investigations on PLA-GP composites (PGC) have been conducted so far, 17 -20 studies of the effects of micrometre-sized GP flakes having GP contents in a wide range (0–30 wt%) on structural, surface morphological, mechanical, micromechanical and thermal properties of PLA composites are scarce. Moreover, in this work, the mixture of PLA and GP flakes was twice extruded to have a better dispersion of the filler into polymer matrix during fabrication. Double extrusion was not previously used for fabrication of GP-reinforced polymer composites. Generally, the addition of nanofillers can provide PLA with specific properties but sometimes triggers problems such as loss of mechanical and thermal properties, degradation of the polymer matrix and so on – aspects that need to be considered when targeting a potential application. 21,22
Based on the above facts, investigation of the influence of a wide range of micrometre-sized GP loadings to PLA matrix for disclosing structure–properties relationships of the resulting composites is the main aim of this article. To obtain green products with specific end-use properties, commercially available GP has been added to PLA by direct dosing using melt-compounding technology and the resulting composites have been characterized in detail by various techniques for highlighting their performance.
Experimental
Materials and sample preparation
PLA thermoplastic used in this study was a product of NatureWorks® PLA, 2002D, Germany, with melt index of 5–7 g/10 min at a temperature 210°C and specific gravity of 1.24, derived from renewable resources. The GP flake produced by Zhengzhou Sino Chemical Co., Ltd, China, was purchased from the local market. It looks shiny ash colour with particle size of 10−50 μm and density of ≈2200 kg m−3. The GP powder was then prepared by grinding the flakes using a mortar and pestle.
PLA and GP were thoroughly mixed with the weight ratio of PLA:GP as 100:0, 95:5, 90:10, 85:15, 80:20, 75:25, 70:30 and extrusion moulded twice by an extruder machine (Axon AB, Sweden). The extruder has five heating zones with blending temperature profiles of 180°C, 185°C, 190°C, 195°C and 200°C. During preparation of samples, the screw rotating speed of the extruder was 100 r/min. The extrudates obtained after twice extruded were shredded by a chopper machine and again moulded in both dumbbell- and bar-shaped dice at 190°C using a compression moulding machine with a load of 100 kN. The compressed melts were rapidly cooled through circulation of water. The compression moulded neat PLA is abbreviated as PGC0, and 5, 10, 15, 20, 25 and 30 wt% GP-loaded PLA composites are hereinafter abbreviated as PGC5, PGC10, PGC15, PGC20, PGC25 and PGC30, respectively. The prepared PGC were then subjected to various investigations.
Fourier transform infrared spectroscopy
Fourier transform infrared (FTIR) spectra of the samples were recorded at room temperature by using a double beam FTIR spectrophotometer (Shimadzu, FTIR 8700 spectrophotometer, Japan) in the wave number range 500–4000 cm−1. For these measurements, the samples were cut to appropriate size and put on a sample holder for recording the FTIR spectra in the reflectance (%) mode.
Raman spectroscopy
Raman spectra were obtained using a Raman spectrometer (JASCO, NR-1800, Japan) equipped with a triple monochromator having radiation of wavelength λ = 532 nm from a solid-state laser of power 5 mW, and a charged-couple device was used to detect the backscattered Raman spectrum. The size of the focused laser spot on the sample was about 5 µm and the resolution of the spectra was 1 cm−1. The exposure time of the sample under the laser beam was 10 s. To determine the effect of laser heating upon the PGC, glass slides on which the samples were placed were kept on the Raman microscope stage. All the spectra were curve-fitted using Gaussian routines, from which the various band positions and intensities were obtained.
X-ray diffraction measurements
The bar samples having the same thickness were used for X-ray diffraction (XRD) measurements. Wide-angle XRD (WAXD) studies were performed by an X-ray diffractometer (model JDX-8P, JEOL Ltd, Tokyo, Japan) using the copper (Cu) K α radiation of wavelength, λ = 1.5418 Å, through a step-wise scan over the scattering angle (2θ) from 5° to 85°, with a step size of 0.02°. The operating voltage and the tube current of the X-ray generator were maintained as 30 kV and 200 mA, respectively. The degree of crystallinity (χc) was calculated using the equation 23

where I cr and I am are the integrated intensities of crystal and amorphous parts of the samples, respectively. The crystalline thicknesses of the samples were calculated using the formula 24

where k equals 0.98, λ is the wavelength of X-ray, B is the full-width at half-maximum of the diffraction peak measured in radians and θ is the Bragg angle.
Scanning electron microscopy
The surface morphologies of the samples were studied by a scanning electron microscope (SEM) (JSM-6510 LV, JEOL, Japan) with a maximum operating voltage of 20 kV of the apparatus. Samples were mounted on aluminium stubs with carbon tape and sample surface was coated with a thin gold layer in a sputtering machine prior to SEM measurements.
Transmission electron microscopy
Transmission electron microscope (TEM) images were obtained by a TEM 1400 Plus electron microscope (JEOL, Hitachi, Japan) with 100 kV acceleration voltage. Before measurements, each PGC sample was crushed into powder, and then separately dissolved in propanol and ultrasonicated until homogeneous mixtures in the solvent were obtained. Thereafter, drops of the mixtures were put on carbon-coated Cu grids and dried before TEM measurements.
Mechanical testing
Tensile tests of the samples were conducted by a universal testing machine (Hounsfield UTM 10KN (UK); ASTM D-638–98) at a crosshead speed of 0.001 m min−1, keeping a gauge length of 0.06 m. Tensile strength (TS) and Young’s modulus (Y o) of the samples were evaluated. Five samples of each composition were measured to obtain the average value.
Micromechanical testing
A software-controlled Vicker’s square-based diamond indenter (Shimadzu, Japan) was employed to measure the microhardness (H) from the residual impression on the sample surface after an indentation time of 6 s. Loads of 0.098, 0.245, 0.490 and 0.980 N were used to derive a load-independent value of H in MPa by the following relation 25

where d (m) is the length of indentation diagonal, P (mN) is the applied load and K is a geometrical factor equal to 1.854. At least eight imprints were taken on the surface of each sample for each load, and H was evaluated from the average value of all impressions.
Thermal measurements
Thermal properties of the samples were simultaneously monitored by a coupled differential thermal analyser (DTA) and thermogravimetric analyser (TGA) (Rigaku, Thermo Plus TG 8120, Japan). The measurements using DTA and TGA were carried out from room temperature 25°C to 700°C at a heating rate of 20°C/min under air atmosphere.
Results and discussion
FTIR structural analyses
Figure 1 illustrates the FTIR spectra of all PGCs, recorded as the reflectance (%) versus wave number in the range of 4000–500 cm−1. The principal absorbance peaks obtained for the PLA are: (i) the peak around 3500 cm−1, which may be attributed to OH stretching, (ii) the strong peaks at 2981 and 1323 cm−1 that can be assigned to the asymmetric and symmetric modes of C–H stretching and C–H bending, respectively, (iii) the C=O stretching (from ester linkage) observed at 1700 cm−1, (iv) the C–H deformation appearing at 1386 cm−1 and (v) the O–C asymmetric mode of the ester groups observed at 1083 cm−1. 26
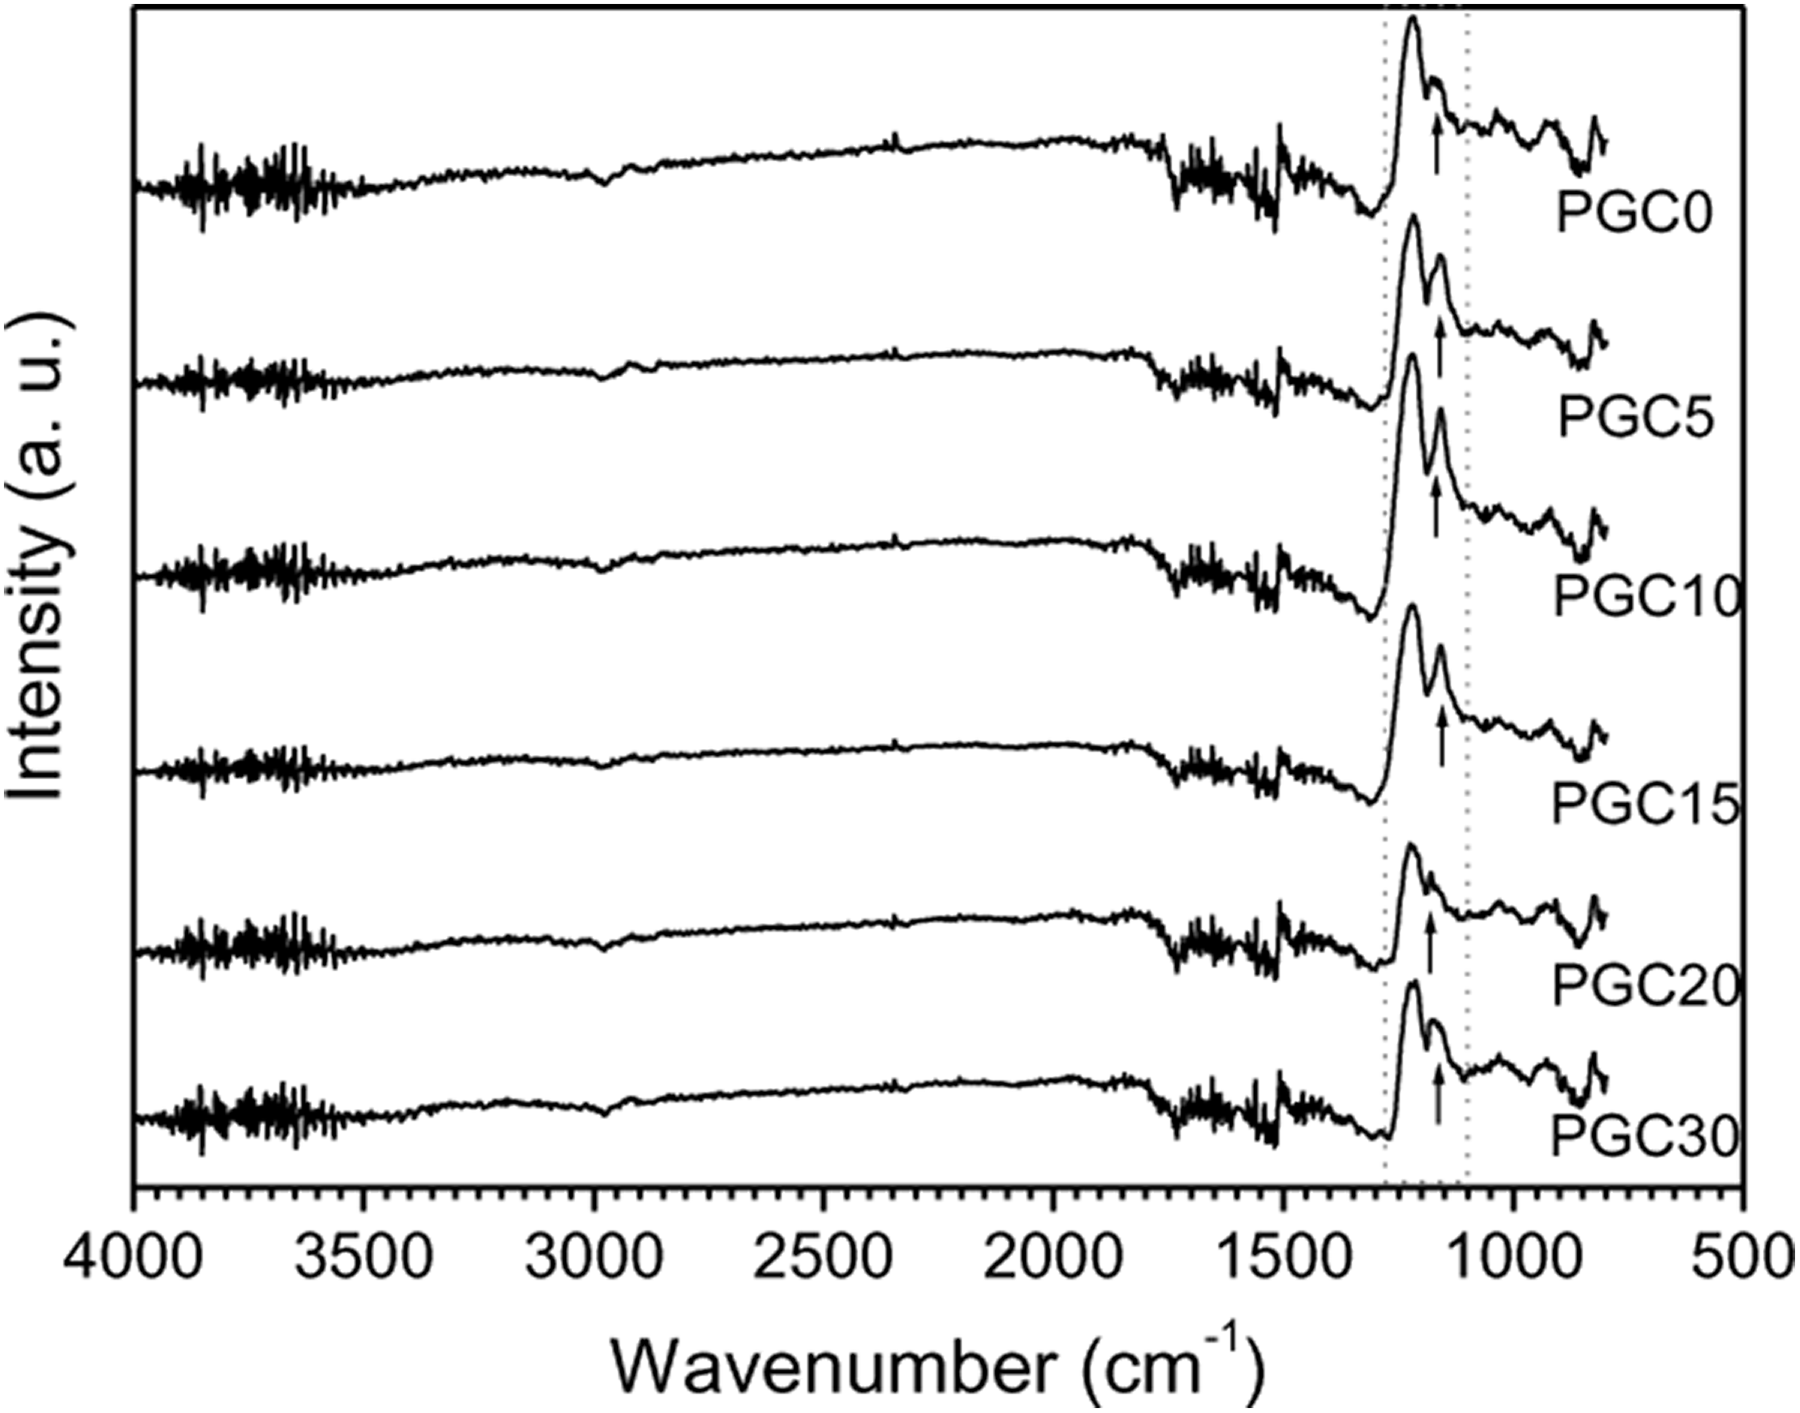
FTIR spectra of neat PLA and its composites.
On the other hand, GP usually shows a broad, intense band at 3430 cm−1 for O–H stretching vibrations, bands at 2650 cm−1 for vibrations of OH in H2O and 2920 cm−1 for dimeric COOH, and 1103 cm−1 for C–O stretching vibrations. In addition, there are other band at 1414 cm−1 for carboxyl C–O stretching vibrations, 1560 cm−1 for skeletal vibrations from unoxidized graphitic domains and 1726 cm−1 for C=O stretching vibrations from carbonyl and carboxylic groups. 27
However, the peak at 1160 cm−1, as indicated by arrows under the spectra, have higher intensity for all PGCs except for PGC0 and the peak position is shifted to a higher frequency in case of composites. Besides, as can also be seen in the figure, the intensity of C=O stretching decreases with the increase of GP content. These types of change in bond and change in intensity correspond to physical bond formation in the composites. Other peaks of FTIR spectra of PLA and GP composites are almost unchanged.
Raman spectral analyses
The Raman spectrum of the pure PGCs is shown in Figure 2. The peak at 395 cm−1 corresponds to C=O deformation for amorphous PLA fraction, 28 and that at 411 cm−1 arises from C=O deformation from PLA crystalline fraction, being particularly sensitive to segmental orientation and chain conformation. The C–COO stretching of PLA appears at 873 cm−1, while CH3 bending of PLA is found at 1128 cm−1. The peak at 1455 cm−1 comes from CH3 asymmetric wagging of PLA. The ester C=O stretch appearing at 1770 cm−1 indicates that the polymer is amorphous. The G-GP tangential mode appears at 1582 cm−1 due to the E2g vibration mode of GP, attributed to the vibration of carbons within the polyaromatic structure, and the D-mode for GP appears at 1355 cm−1 due to a change in the selection rules for the Raman effect. It is well known that the intensity ratio of D (I D) to G (I G) band can be used as an indicator of defect quantity. 18 The fewer the defects, the lower the I D/I G value. The intensity ratios of D and G bands are evaluated to be 0.855, 0.963, 0.989 and 1.008 for PGC5, PGC10, PGC20 and PGC30, respectively.
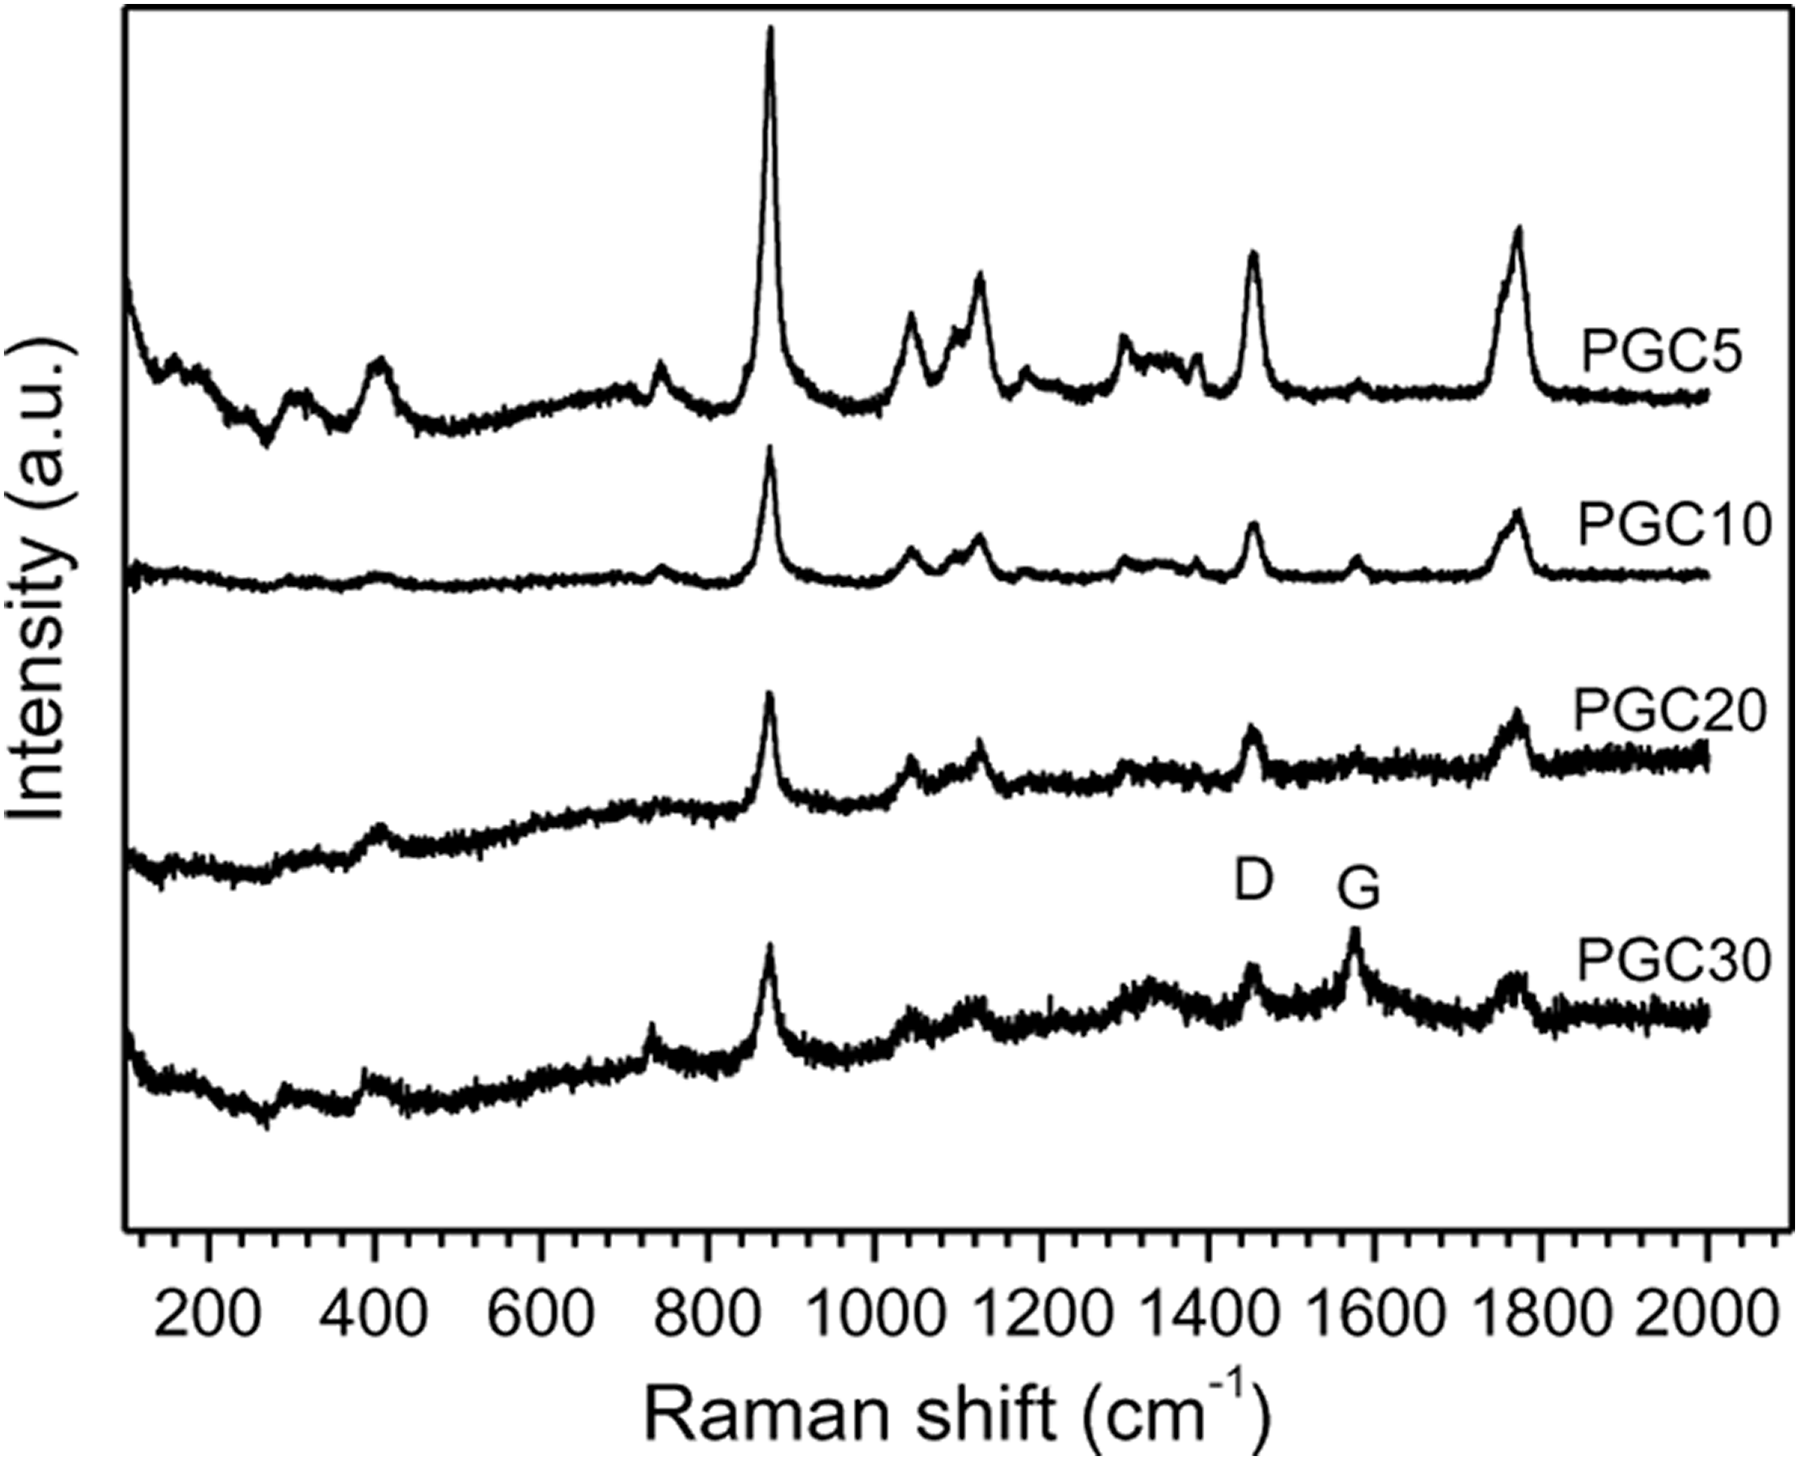
Raman spectra of neat PLA and some of its composites.
XRD structural analysis
Figure 3 shows the XRD profiles of PGCs. The most important peak originates from the amorphous region of PLA. This broad peak suggests that PLA chains are poorly ordered, due to the rapid cooling of the compression moulding process. The peak position for PLA is observed close to 2θ ≈15.67° and 31.91°, as indexed by (200)α and (400)α, respectively. To analyse these results, we invoke the data of reported crystalline structures of PLA. 29,30 From these data, calculation shows that the 200 reflection of the β-phase appears at 2θ ≈17.28° and that of the α-phase at 2θ ≈16.56°. This analysis, therefore, dictates us to consider the appearance of α-crystals in both the pure PLA and the biocomposites. There is no evolution of new peaks of PLA with increasing content of GP, except for the sharp peaks (002)GP and (004)GP appearing from GP structure. The decrease in X-ray intensity of the (200)α peak clarifies that an increasing amount of GPs degrades the crystallinity of the biocomposites. The average lattice spacing estimated from the peak is about 5.81 Å. Increased GP content also decreases the PLA-peak width. This result indicates a change in the average thickness of the PLA crystallites. Moreover, the origin of two sharp peaks, of which one overlaps with (200)α and the other one appears at a slightly higher angle than (200)α, is not clearly known. They may arise from complex GP structure or from other impurities in GP.
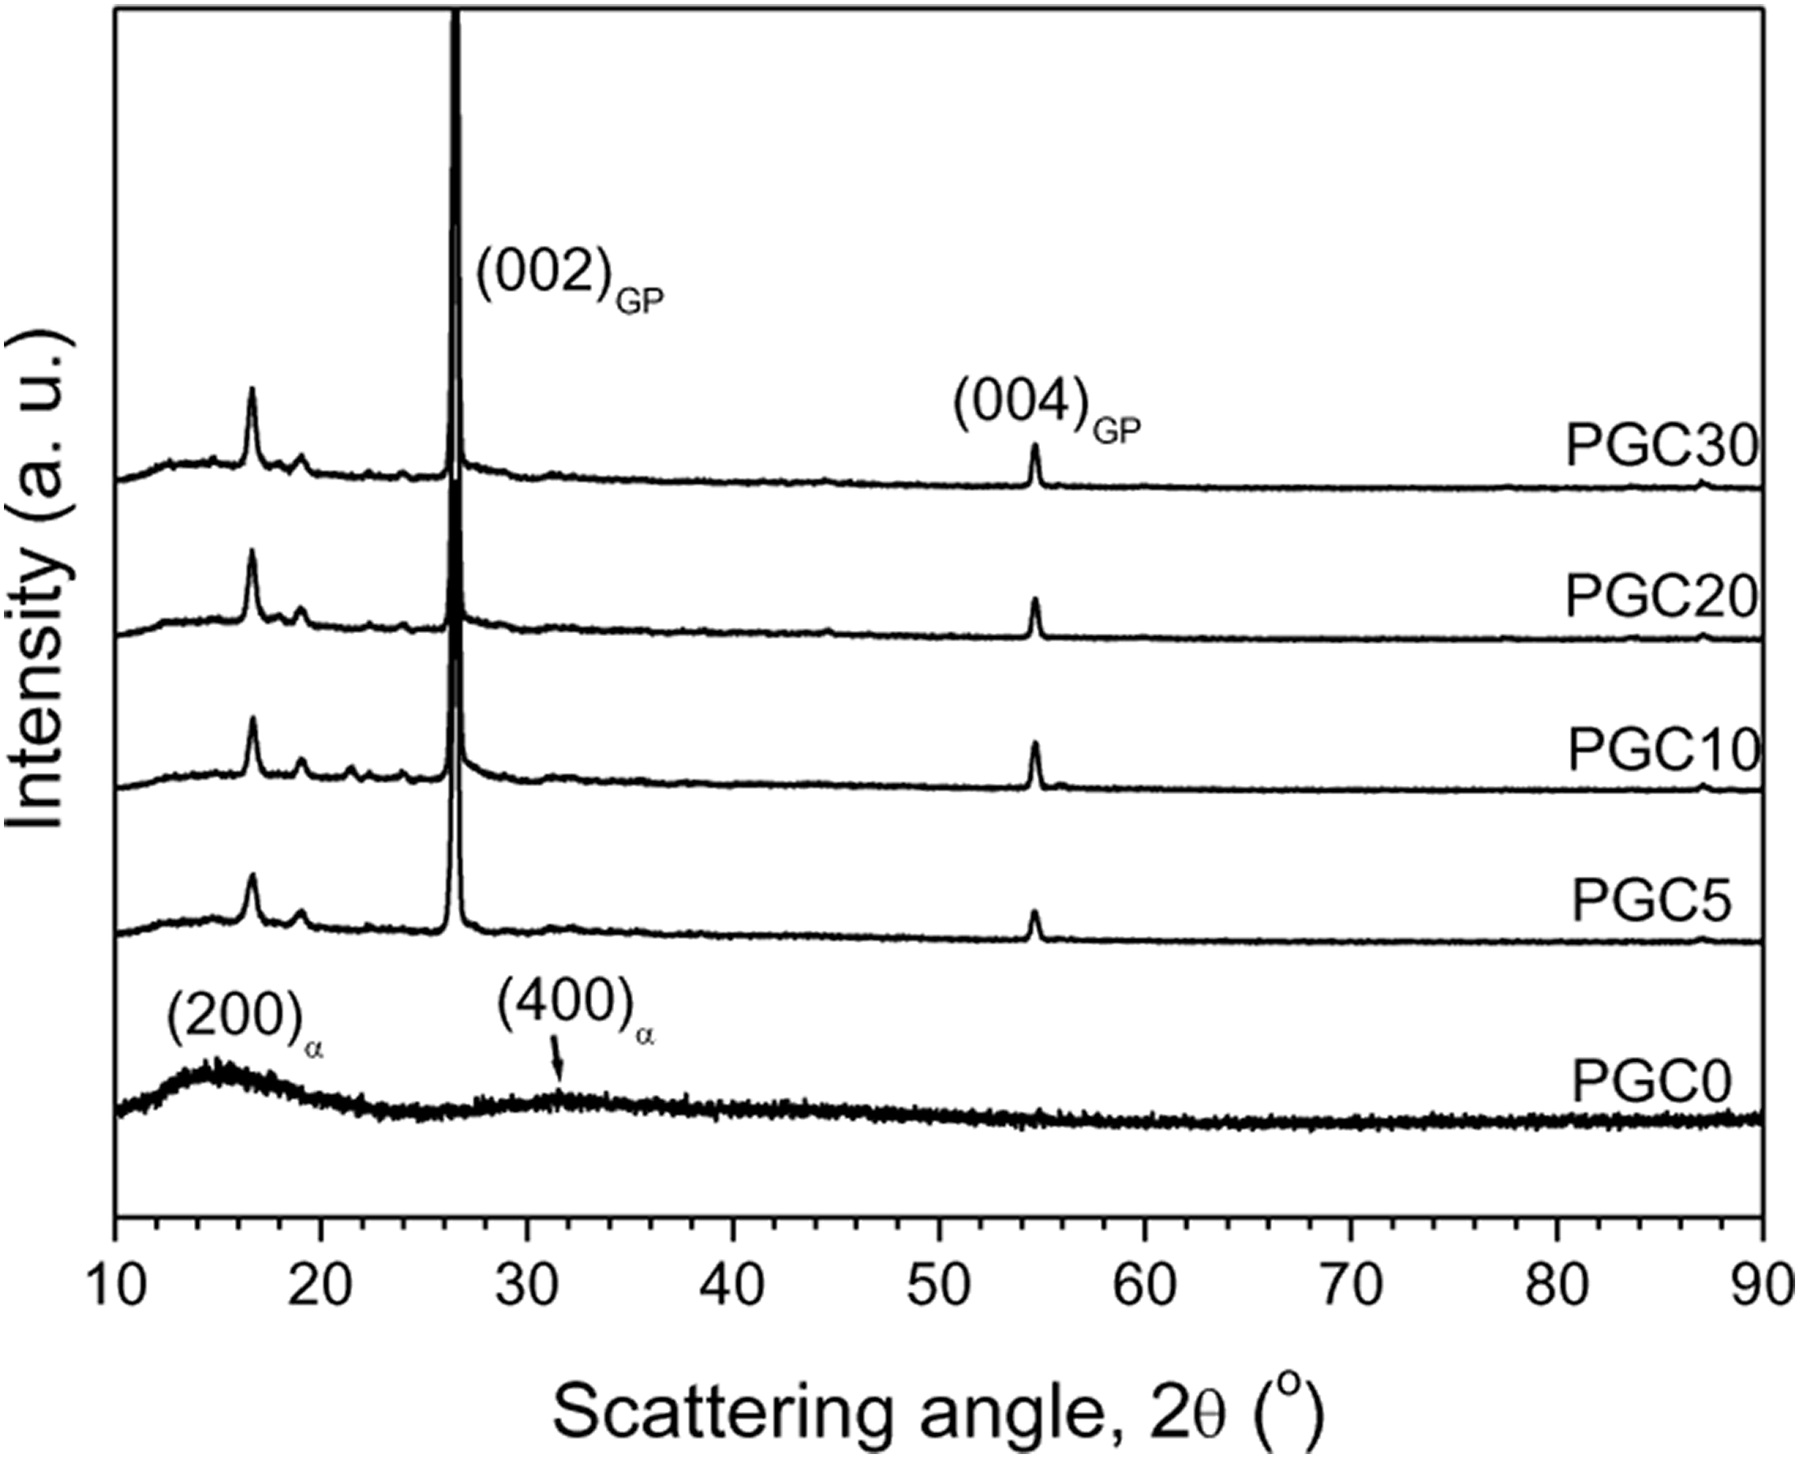
XRD profiles of neat PLA and its composites.
The degree of crystallinity, χc, for the samples has been calculated and shown in Figure 4. It is seen that the χc value decreases with increasing GP content in the composites. This indicates that the GP particles are not suitable nucleating agents for PLA crystallization. The average crystallite thickness, t, estimated for various samples is also shown in Figure 4, revealing a slight decrease in the size of the PLA crystallites.

Changes of crystallinity and crystallite size with particle loading.
Mechanical properties
The average TS and Y o evaluated from mechanical tests for various samples are shown in Figure 5. The TS value for the pure PLA sample is 55 MPa, while it gradually falls down to a value of 4 MPa for composite with 30 wt% GP content. On the other hand, contrary to the decrease in the TS value, the Y o is found to increase with increasing GP content. The minimum value of Y o observed for the pure PLA sample is 1.46 GPa and the maximum Y o value obtained for composite sample of 30 wt% GP is 2.31 GPa. Hence, the greatest increase in the tensile modulus obtained herein is 58%.

Variations of TS and modulus with particle loading.
The lower TS of the composites at increasing volume fraction could be due to a number of reasons, such as weak interfacial bonding at GP and PLA matrix interfaces, agglomeration of GP particles, process-related defects such as porosity and so on. The TS of a material is the maximum stress exhibited by it under deformation. Under tensile deformation, the position and movement of GP aggregates, PLA molecules and developed pores during fabrication inside the material may affect the resulting interaction among PLA-PLA molecules, GP-GP aggregates and PLA-GP molecules. The consequent lessening of interaction is assumed to reduce the TS values of the composites with increasing GP content. Moreover, the GP filler’s limited wettability in the PLA matrix phase may result in poor interfacial adhesion of GP particles to the matrix, and inefficient stress transfer at the particle–matrix interface occurs while the load is applied.
A number of researchers have documented TS variations with changing filler contents in various polymers, and they have reported that TS decreases with increasing filler content. Some of them have explained this fact using the following Nielson model 31

where TSC and TSP denote the TS of the composite and the polymer matrix, respectively; ϕ represents the weight fraction of the filler and accounts for the adhesion quality between polymer and filler. According to the above formula, if a discontinuity in stress transfer at the polymer–filler interface occurs, then the value of AQ decreases. Hence, a decrease in the TS of the composites with the addition of filler content is reasonable, because the TSC value decreases, according to equation (4). Thus, the Neilson model is more suitable to explain the observed TS decrease with an increase of filler content.
On the other hand, if the gradual increment in Y o with increasing GP content is supposed to take place via increased interactions between PLA-PLA, PLA-GP and GP-GP molecules, this is in apparent strong contradiction with the concomitant TS decrease. To surmount this apparent anomaly, it is necessary to differentiate the two physical parameters Y o and TS and how they are measured. Y o is principally associated with the interactions among the molecules, whereas TS is associated both with the interactions among the molecules and the deformation processes involved in the material. As mentioned above, there exist three categories of molecule–molecule interactions of which at least one is predominant for the gradual increase in Y o. Since Y o increases with an increase in GP content, it is, therefore, logical to consider that this may be due to the increase of filler–filler or GP-GP interactions. However, the change in Y o may also relate to the degree of dispersion of GP in the PLA matrix. Usually, due to their large surface area, GPs have a greater contact either with PLA or with themselves. If the GP particles find a good dispersion in the PLA matrix, the well-dispersed particles may get greater interfacial contact, which essentially plays a role to increase the tensile modulus of the material. A theoretical model has been given by Guth-Smallwood to predict the theoretical modulus (Y th) by a widely used equation in polymer–filler composites 32

where V
GP is the volume of GP as determined from the relation:
Figure 6 shows the plots of flexural strength (FS) and tangent modulus (TM) versus GP content. The trends of TM-increase and FS-decrease are similar to those of Y m and TS, respectively. Thus, similar arguments to those set out for the Y m and TS changes can also be proposed for the changes of TM and FS with increase in filler contents. The TM values for PGC30 is 6.98 GPa and for PGC0 is 3.98 GPa. Therefore, the increase of TM for PGC30 from PGC0 is about 77%.

Changes of flexural strength and modulus with particle loading.
Micromechanical properties
Figure 7 shows the change in microhardness with increasing load, P, for pure PLA and various contents of GP-loaded composites. The microhardness apparently remains unchanged with increasing load up to 1000 mN. Nevertheless, a slight variation of hardness with load is observable. To remove this variation or to observe the load-independent hardness for different concentrations of GP, d 2 versus P for pure PLA, 5, 10 and 20 wt% of GP-loaded PLA composites are shown in Figure 8. The microhardness gradually decreases with the increase of GP content and reaches a minimum at 30 wt% GP content, as shown in Figure 9. The microhardness for pure PLA is 220 MPa and for 30 wt% GP-loaded composite is 143 MPa. Therefore, the maximum decrease in H values is 54%. The microhardness provides information on the micromechanical properties of a material within a micro region. The observed reduction in H can be attributed to the increased GP content, increased surface roughness and decreased crystallinity of the resulting material.

Plots of microhardness versus load for different samples.

Plots of diagonal length square versus load for different samples.
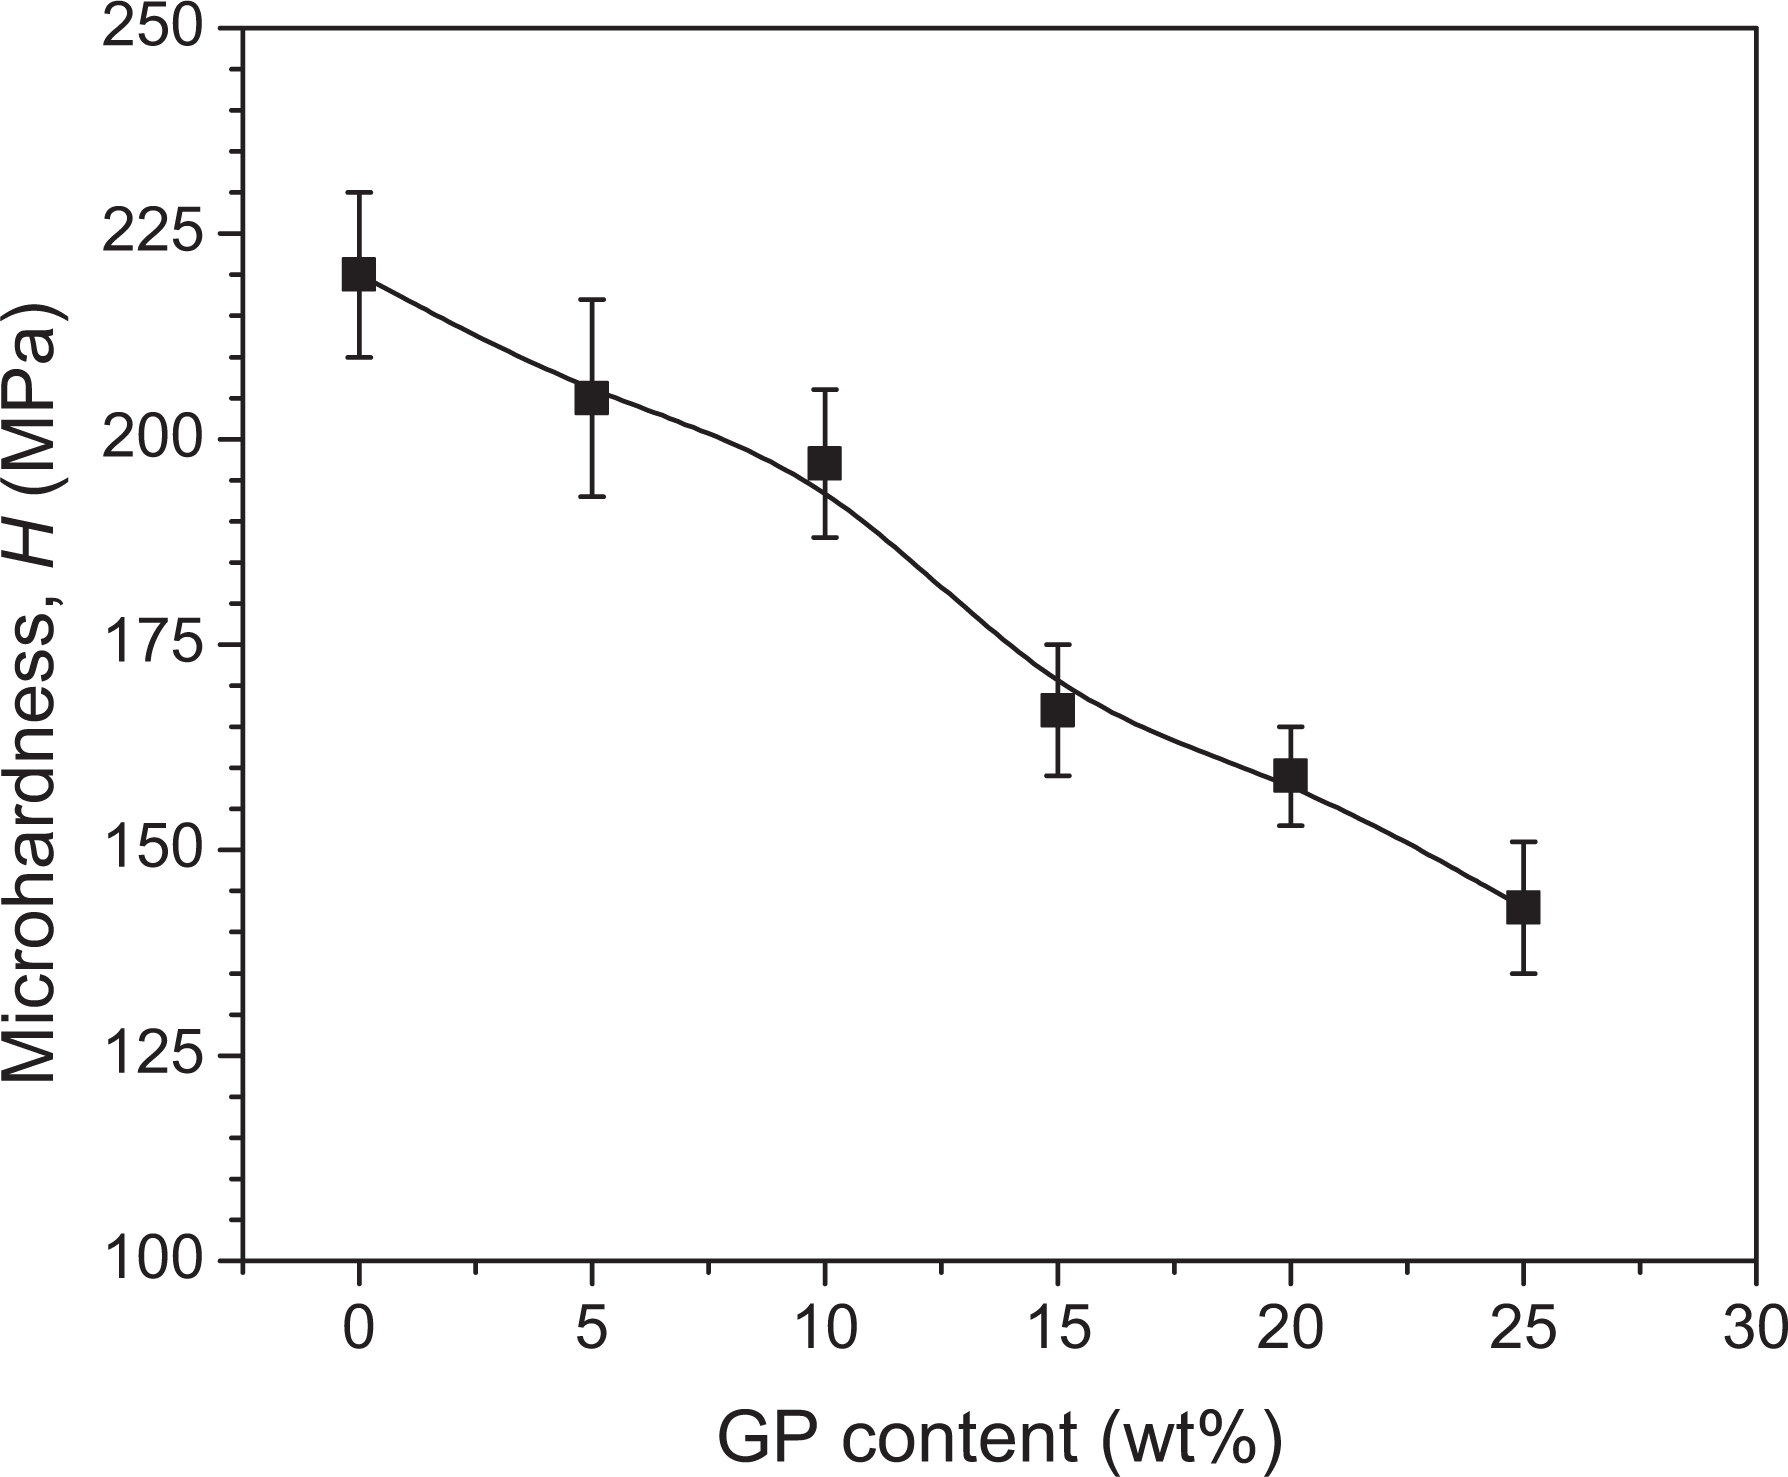
Change of microhardness with GP content.
The hardness of a polymer or a polymer composite can be described in terms of their crystalline hardness H c, and amorphous hardness H a, according to the additivity law 33

Moreover, the H c of a polymeric material related to the crystal thickness, t, and surface energy parameter, b, through the following expression 25

where
On the other hand, a slight decrease in the crystalline thicknesses or t values is observed from XRD studies. As a result, the term b/t in the denominator increases sufficiently, thereby causing a decrease in hardness, according to equation (7). Moreover, GP particle is comparatively softer than PLA. Therefore, the decrease in hardness with the increase in GP content is also plausible. A detailed review on the strength of particulate–polymer composites has been presented with many phenomenological and semi-empirical models, relying on the parameters of particle size, interface adhesion and particle loading, 34 where it is claimed that a few weight per cent of particulates with weak interfacial adhesion can significantly deteriorate micromechanical properties.
Surface morphology
Figure 10 shows SEM micrographs of virgin PLA, and PGC with 5, 10, 15, 20 and 30 wt% GP content. The surface micrographs of PGC0 and PGC5 are almost smooth, whereas the surface roughness increases with increasing GP content. The roughest surface is found to be for PGC30. The increase in roughness can decrease the Δh value and hence the value b increases, thereby decreasing the hardness according to equation (7). TEM micrographs of PGC0, PGC10, PGC20 and PGC30 are displayed in Figure 11. PLA shows a smooth surface, while small GP flakes of the order of nanometre to micrometre are embedded in the PLA matrix. The surfaces of GP-loaded samples are found to be uneven, thereby causing an increase in b parameter of microhardness. The dispersion of GP in the PGC10 samples is apparently good. In contrast, random distribution and clusters of GP are found in the TEM images of PGC20 and PGC30, whose surface structure is found to be relatively rough. It seems that in the images of PGC with higher GP content (>20 wt%), GP channels or pathways are apparently formed. Clusters or agglomerations are formed due to the particle–particle interactions of GP. Slight voids are also developed at highly GP-loaded PLA composites. The random distributions of GP in PGC can change nature of physical bonding of GP with PLA. The surface morphology of PGC apparently supports the results of microhardness.
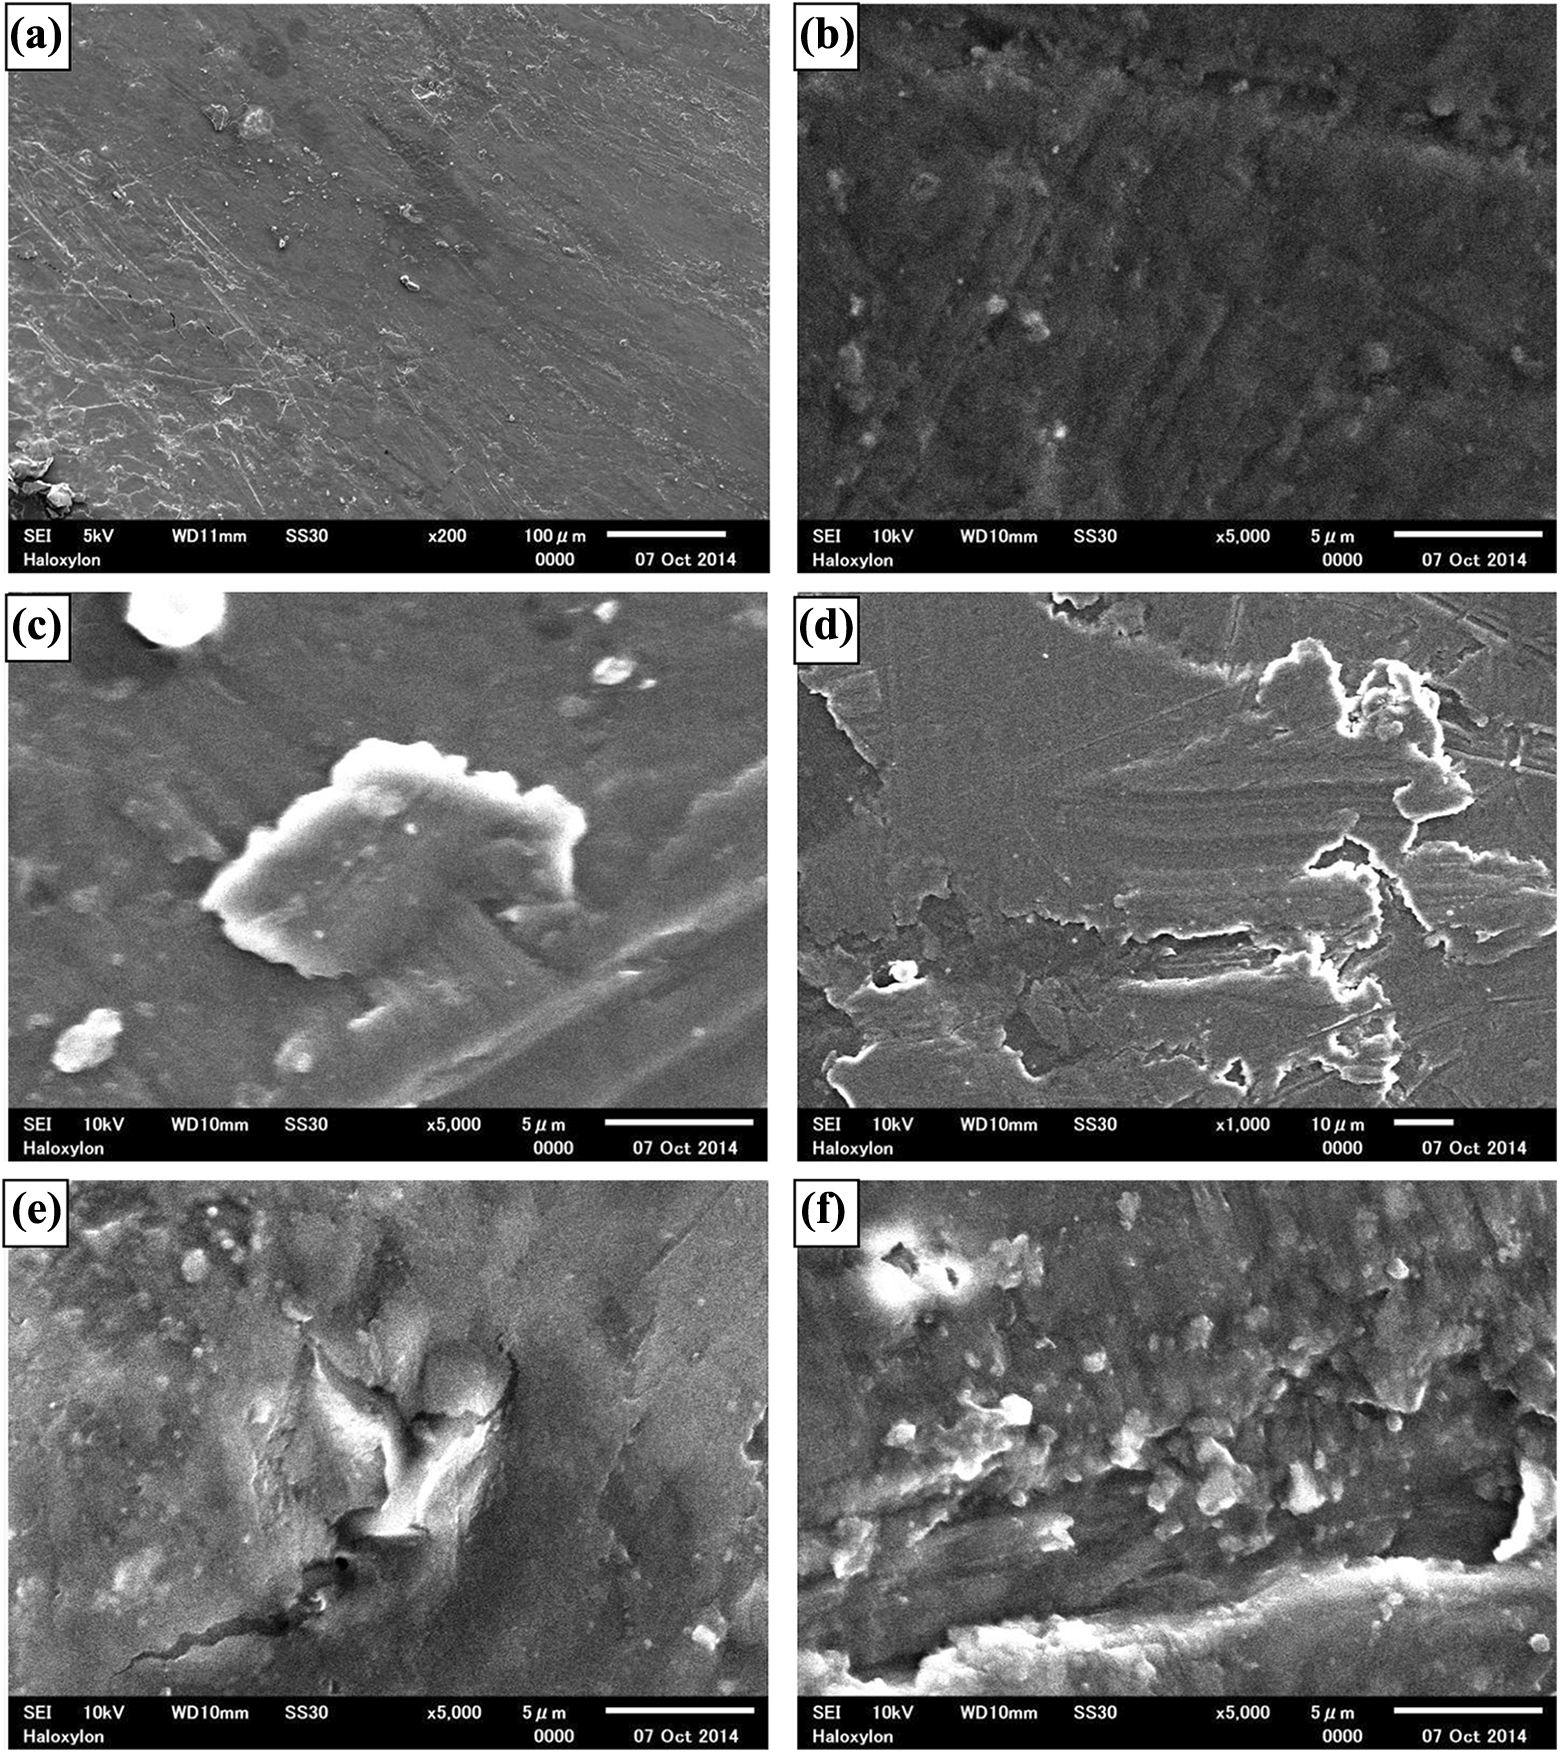
SEM micrographs for (a) PGC0, (b) PGC5, (c) PGC10, (d) PGC15, (e) PGC20 and (f) PGC30.

TEM micrographs for (a) PGC0, (b) PGC10, (c) PGC20, (d) PGC30.
Thermal properties
DTA curves of the samples are shown in Figure 12. All the thermograms feature a small endothermic peak at around 155°C (dotted line) with similar pattern. This peak indicates the melting temperature (T m) of PLA which does not seem to change at all with particle loading. On the other hand, two broad exothermic peaks (dashed line and solid line) for all samples appear at higher temperature. These are probably the degradation temperatures (T d) of PLA observed by DTA. Clearly, PLA degradation occurs at two stages. For pure PLA, first exothermic peak occurs at 370°C and second one occurs at 420°C, whereas for the composites, the first peak occurs at 380°C and the second one at 458°C.

DTA thermograms for different samples.
TGA measurements were performed to observe the amount and rate of changes in the mass of the samples as a function of temperature in air atmosphere. Figure 13 illustrates the TGA thermograms of various samples. It seems that the weight loss starts at about 190°C and the loss pattern is apparently found to be different for different samples. Clearly, the weight loss delays with the increase of GP content. Two indicators commonly practised to characterize the onset and structural degradation are the onset temperature (T o) and destabilization temperature at 50% weight loss (T 50). 35 As the GP content is increased, the onset of decomposition moves to higher temperatures. For instance, the T o gradually increases from 304°C for PLA to 315°C for PGC30. On the other hand, T 50 successively increases from 343°C for PLA to 388°C PGC30. Thus, the thermal stability of the composites considerably increases. There are several chemical/physical mechanisms that could affect the thermal stabilization effect of composites due to GP. These mechanisms include the reaction of free radicals coming from the PLA matrix with GP, the adsorption of volatile degraded components on GP surface, barrier effect of GP and the reduction of molecular mobility of the PLA molecules surrounding the GP. The significant increase in T 50 under inert atmosphere could be related to the barrier effect of GP which may decrease the diffusion of released oxygen from the PLA into GP. Besides, adsorption of volatile components on GP surfaces may retard the degradation process. Therefore, the increase of interfacial area between PLA and GP content up to 30 wt% enhances the thermal stability of composites considerably. From this TGA measurement, it can be noted that the thermal stability of the PGC is enhanced with the inclusion of GP content. Moreover, with the increase of the GP content agglomeration of GP particles occurs for which each PLA molecule faces a large surface area of GP particles that encounter the segmental mobility of PLA molecules. On the other hand, the residue content (wt%) at 600°C is increasing with the increase of the GP content, as shown in the thermograms. This is due to fact that for the high degradation temperature of GP much greater than 600°C, the GP virtually remains as a residue and is not degraded at all.

TGA runs for different samples.
Conclusions
Micrometre-sized GP powders have been mechanically dispersed in PLA with 0, 5, 10, 15, 20, 25 and 30 wt% GP content by extrusion moulding followed by compression moulding. FTIR spectra demonstrate the formation of physical bonds (van der Waals) between GP and PLA. Raman spectroscopy distinguishes amorphous and crystalline phases in PLA as well as defect structure due to the presence of GP. Inclusion of GP shows a decrease in crystallinity and crystallite size in PLA. SEM exhibits an increase in surface roughness at higher loading of GP particles and TEM reveals a good dispersion of GP particles in PLA matrix at lower loadings and inhomogeneous dispersion at higher loadings. The tensile and flexural strengths of the composite decrease with an increase of filler content, and this decrease is explained on the basis of Nielson’s model. Significant increases in Young’s and tangent moduli of about 58% and 77% respectively, are observed. There is a remarkable decrease in microhardness for increasing GP content up to 30 wt%. This change in micromechanical properties is due to the decrease of crystallinity in PLA and more especially due to the inclusion of paracrystalline GP particles. TGA shows an increased thermal stability of the samples, as obvious from the T 50-increase from 343°C to 388°C. The observed properties of the resulting composites can be useable in any suitable applications like indoor and outdoor panels, structures, furniture and commodities.
Footnotes
Acknowledgments
The authors greatly acknowledge the financial support provided by the Bangladesh University of Engineering and Technology (BUET) for performing this investigation. They are also grateful to the Industrial Physics Division, BCSIR for technical supports of some measurements. Acknowledgments are also to the Centre for the Instrumental Analysis, Shizuoka University, Japan for partial measurements of this work.
Declaration of conflicting interests
The author(s) declared no potential conflicts of interest with respect to the research, authorship, and/or publication of this article.
Funding
The author(s) received no financial support for the research, authorship, and/or publication of this article.