
Abstract
Introduction
Bardoxolone methyl (Bardo), a Kelch-like ECH-associated protein 1 (Keap1)–Nrf2 pathway activator, has demonstrated efficacy in slowing eGFR decline in diabetic kidney disease (DKD). However, its Phase 3 trial in stage 4 DKD was terminated owing to unexpected cardiovascular complications.
Methods
To explore the underlying mechanisms, the human cardiomyocyte cell line AC16 was subjected to various concentrations of Bardo. Nuclear translocation of Nrf2 and the expression of its downstream antioxidant factors, heme oxygenase-1 (HO-1) and NAD(P)H quinone oxidoreductase 1 (NQO1), were quantified. Cell injury was assessed using microscopy, crystal violet staining, and lactate dehydrogenase release assays. The research employed ferroptosis, apoptosis, and necrosis inhibitors to identify the mechanisms of cell death. Additional analyses included measurements of glutathione peroxidase 4 (GPX4), solute carrier family 7 member 11 (SLC7A11), reactive oxygen species (ROS), ferrous ions, and malondialdehyde (MDA), while mitochondrial ultrastructure was evaluated by transmission electron microscopy.
Results
Bardo induced dose-dependent Nrf2 activation and increased AC16 cell death, which was attenuated by the ferroptosis inhibitor Ferrostatin-1 (Fer-1) but not by apoptosis or necrosis inhibitors. Mechanistically, Bardo suppressed SLC7A11 and GPX4 expression while elevating ROS, ferrous ions, and MDA levels. Ultrastructural analysis further revealed mitochondrial volume reduction, disrupted cristae, and increased membrane density.
Discussion
These findings establish that Bardo induces ferroptosis in cardiomyocytes, potentially explaining the cardiotoxic effects observed in clinical trials.
Introduction
Bardoxolone methyl (C32H43NO4) is a semi-synthetic triterpenoid that potently activates the Kelch-like ECH-associated protein 1 (Keap1)/nuclear factor erythroid 2-related factor 2 (Nrf2) pathway while inhibiting NF-κB signaling, functioning as both an antioxidant and anti-inflammatory agent. 1 Originally developed to treat inflammation-associated carcinogenesis, 2 Bardo unexpectedly demonstrated significant improvements in estimated glomerular filtration rate (eGFR) during oncology clinical trials. 3 This unanticipated renal benefit led to subsequent clinical trials specifically examining renal function in patients with type 2 diabetes, where Bardo treatment consistently led to eGFR improvements, with effects persisting up to 24 weeks after treatment discontinuation. 4 However, a Phase 3 clinical trial involving patients with type 2 diabetes and stage 4 chronic kidney disease (CKD) was terminated early owing to safety concerns, specifically an increased incidence of heart failure events in the Bardo treatment group. 5 While fluid retention has been suggested as a potential mechanism contributing to the elevated heart failure risk, the exact pathophysiological mechanisms underlying these adverse cardiovascular events remain unclear.
The therapeutic efficacy of Bardo in kidney disease is predominantly mediated through activation of the Nrf2 signaling pathway. Under physiological conditions, cytoplasmic Nrf2 forms a complex with Keap1, enabling ubiquitination and subsequent proteasomal degradation. 6 Bardo competitively inhibits this interaction through high-affinity binding to Keap1, thereby stabilizing free Nrf2 and promoting its nuclear translocation. Once in the nucleus, Nrf2 acts as a transcription factor that binds to antioxidant response elements in target gene promoter regions, initiating transcription of various cytoprotective genes and enhancing cellular antioxidant defenses. 7 The antioxidant response system is essential for maintaining redox homeostasis by neutralizing reactive oxygen species (ROS). 8 However, excessive activation of this system may paradoxically induce reductive stress (RS). 9 Nrf2 plays a critical role in the pathogenesis of various RS-associated disorders. In cardiomyocytes, transgenic mice with constitutive Nrf2 activation (CaNrf2-TG) exhibit significantly elevated glutathione (GSH) redox potential, resulting in chronic RS. This condition triggers adaptive cardiac remodeling in murine models of cardiac disease, particularly hypertrophic cardiomyopathy (HCM), manifesting as paradoxical elevation of ejection fraction with impaired diastolic function. 10 Prolonged RS ultimately leads to maladaptive cardiac remodeling and the progression to heart failure.11–13 Further evidence comes from transgenic mouse models overexpressing the mutant human αB-crystallin gene (hR120GCryAB), in which Nrf2 is constitutively activated in cardiac tissues. This persistent Nrf2 activation enhances enzymatic reduction of GSSG to GSH, resulting in abnormally elevated GSH levels. Paradoxically, this sustained antioxidant response leads to pathological protein aggregation and progressive cardiomyopathy. 14 Similarly, keap1-deficient murine models, lacking keap1-mediated degradation, exhibit persistent nuclear accumulation of Nrf2, resulting in sustained cellular reducibility and chronic RS. 15
Given the established association between Nrf2 activation and RS, an important question emerges regarding the potential cytotoxic effects of RS. Several lines of direct evidence support a significant correlation between RS and cell death. For example, treatment of hepatocellular carcinoma HepG2 cells with sodium selenite (Na2SeO3) generates substantial amounts of the reducing agent hydrogen selenide (H2Se), leading to elevated intracellular levels of NADPH and GSH, thereby inducing RS. Notably, H2Se reduces high-mobility group Box-1 (HMGB1) by cleaving its disulfide bonds, promoting its conversion to the reduced form and subsequent extracellular secretion. HMGB1, a redox-sensitive protein, functions as a critical signaling molecule when released into the extracellular space and plays a crucial role in regulating cell survival and death pathways. 16 In its reduced state, HMGB1 suppresses the Akt/mTOR signaling pathway, thereby promoting autophagy and ultimately triggering autophagy-associated cell death in HepG2 cells. 17
Additional evidence directly linking RS to apoptosis emerged from a study involving organic diselenide 2,2′-dipyridyl diselenide (Py2Se2). In human non-small-cell lung carcinoma (A549) cells, Py2Se2 significantly induced DNA damage, G1 phase cell cycle arrest, and apoptosis via RS-dependent mechanisms. Py2Se2 reduced the GSSG/GSH ratio and simultaneously inhibited key redox-regulating enzymes, including glutathione peroxidase, thioredoxin reductase (TrxR), glutathione S-transferase, and glutathione reductase. Inhibition of TrxR activity disrupts deoxyribonucleotide biosynthesis, leading to impaired DNA replication, strand breaks, and ultimately apoptosis. 18 This mechanism has also been experimentally validated in Spirulina platensis, which exerts potent anti-tumor effects through its strong reductive activity that effectively suppresses cancer cell proliferation while promoting apoptosis. 19 In addition to apoptosis, RS exerts cytotoxic effects through multiple pathways, including autophagy, 20 mitochondrial energy deprivation, 21 and endoplasmic reticulum stress. 22 Therefore, the cardiotoxicity observed in the Bardo methyl clinical trial for CKD may be mediated by Nrf2 activation-induced RS. To test this hypothesis, we investigated the effects of Bardo on cardiomyocytes by quantifying cell death and elucidating the underlying mechanisms of injury.
Methods
Cell culture and treatment
The AC16 human cardiomyocyte cell line (Catalog No. SCC109) was sourced from MilliporeSigma (Sigma-Aldrich, Merck, Shanghai, China) and confirmed mycoplasma-free prior to use. Cells were cultured in Dulbecco’s modified Eagle’s medium (DMEM; Gibco, Thermo Fisher Scientific, Waltham, MA, USA) supplemented with 10% fetal bovine serum (Biological Industries, Beit Haemek, Israel) under a humidified atmosphere of 5% CO2 at 37°C. The medium was refreshed every 24 h, and cells were passaged at a 1:3 ratio upon reaching 80%–90% confluence, typically every 3–4 days. For experimental treatments, AC16 cells were exposed to Bardo (MCE, Shanghai, China) at concentrations ranging from 25 to 400 nM or to the ferroptosis agonist erastin (MCE) at 10 µM. A vehicle control group treated with dimethyl sulfoxide (DMSO; Merck) was included in all experiments. To investigate cell death mechanisms, cells were co-treated with Bardo (200 nM) and one of the following inhibitors: the ferroptosis inhibitor Fer-1 (10 μM, GlpBio, Montclair, CA, USA), the necrosis inhibitor Necrostatin-2 (30 μM; GlpBio), the apoptosis inhibitor Z-VAD-FMK (50 μM; MCE), or the iron chelator deferoxamine (DFO; 50 μM; MCE).
Cell viability assay
AC16 cells were seeded into 96-well plates (Corning, NY, USA) at a density of 1 × 10⁴ cells per well. Cell viability was evaluated using the MTT assay. Following Bardo treatment, MTT solution (Merck) was added to the culture medium and incubated for 4 h. The resulting formazan crystals were dissolved in DMSO, and the absorbance was measured at 490 nm using a microplate reader (BioTek Instruments, Winooski, VT, USA). To complement the MTT findings, cell viability was further assessed through crystal violet staining and lactate dehydrogenase (LDH) release assays. For crystal violet staining, treated cells were rinsed twice with PBS, fixed with methanol for 15 min at room temperature, and stained with 0.5% crystal violet solution (Sigma-Aldrich) overnight in the dark. After removing excess stain, images were acquired under bright-field microscopy. For the LDH release assay, culture supernatants were collected and centrifuged at 3500× g for 10 min at 4°C to remove cellular debris. LDH activity was quantified using a commercial kit (Nanjing Jiancheng Bioengineering Institute, Nanjing, China) according to the manufacturer’s instructions. Absorbance was read at 440 nm on a microplate reader (BioTek Instruments), and LDH concentrations were determined based on a standard curve.
Detection of caspase-3 activity
AC16 cells were seeded in 96-well plates at a density of 1 × 10⁴ cells per well to achieve 80%–90% confluence. Following a 24-h treatment with Bardo, doxorubicin (Dox, 5 μM; MCE) as a positive control, or erastin as a negative control, cells were washed twice with pre-warmed PBS and incubated with 5 μM GreenNuc™ Caspase-3 Substrate (Beyotime Biotechnology, Shanghai, China) in serum-free medium for 30 min at room temperature in the dark. Fluorescence intensity was measured using a SpectraMax M5 microplate reader (Molecular Devices, San Jose, CA, USA) at excitation/emission wavelengths of 485/515 nm. Caspase-3 activity was normalized to the total protein concentration as determined by a bicinchoninic acid assay.
Western blot analysis
Total protein was extracted from washed cells using radioimmunoprecipitation assay (RIPA, Solarbio, Beijing, China) buffer supplemented with phenylmethylsulfonyl fluoride (PMSF; Beyotime Biotechnology) and a protease inhibitor cocktail (Beyotime Biotechnology). Lysates were centrifuged at 12,000× g for 15 min at 4°C to collect the supernatant. Nuclear and cytoplasmic proteins were isolated using a Nucleoprotein Extraction Kit (Solarbio) according to the manufacturer’s instructions. Briefly, cells were washed, resuspended in cytoplasmic protein extraction buffer, and incubated on ice for 30 min. The mixture was centrifuged at 2000× g for 5 min, the supernatant was collected as the cytoplasmic fraction. The pellet was washed, resuspended in nuclear protein extraction buffer, vortexed, incubated on ice for 30 min, and centrifuged at 12,000× g for 10 min to obtain the nuclear protein fraction. Protein concentration was quantified using a Pierce BCA Protein Assay Kit (New Cell & Molecular Biotech, Suzhou, China). Equal amounts of protein were mixed with SDS-PAGE loading buffer, separated on 10% SDS-polyacrylamide gels, and transferred onto nitrocellulose membranes. Membranes were blocked with 5% non-fat milk for 1 h at room temperature and incubated overnight at 4°C with the following primary antibodies: Nrf2 (1:1000; Cell Signaling Technology; Cat. #12721S), heme oxygenase-1 (HO-1; 1:1000; Abclonal; Cat. #A1346), GPX4 (1:1000; Proteintech; Cat. #67763-1-1g), solute carrier family 7 member 11 (SLC7A11) (1:1000; Proteintech; Cat. #26864-1-AP), HSP27 (1:1000; Proteintech; Cat. #A11156), β-actin (1:1000; Proteintech; Cat. #66009-1-1g), GAPDH (1:1000; Proteintech; Cat. #60004-1-1g), and lamin B1 (1:1000; Proteintech; Cat. #12987-1-AP). After washing, membranes were incubated with corresponding secondary antibodies for 1 h at room temperature. Protein bands were visualized with an enhanced chemiluminescence (ECL, Tanon, Shanghai, China) detection reagent and quantified using ImageJ software (National Institutes of Health, Bethesda, MD, USA).
Detection of ROS
Intracellular ROS levels were measured using a commercial ROS assay kit (Elabscience, Wuhan, China). AC16 cells were seeded in 6-well plates at a density of 1 × 10⁵ cells per well and cultured overnight to 70%–80% confluence. Cells were then incubated with 10 μM 2′,7′-dichlorodihydrofluorescein diacetate (DCFH-DA) in serum-free medium for 30 min at 37°C in the dark. This cell-permeable probe is hydrolyzed by intracellular esterases to non-fluorescent DCFH, which is oxidized by ROS to yield highly fluorescent dichlorofluorescein (DCF). After incubation, cells were washed twice with PBS to remove residual probe. Fluorescence intensity was measured using a microplate reader at excitation/emission wavelengths of 488/525 nm and quantified with ImageJ software.
Detection of malondialdehyde levels
Cellular malondialdehyde (MDA) levels, a biomarker of lipid peroxidation, were quantified using a commercial assay kit (Elabscience). Briefly, cells were washed, harvested with a cell scraper, and transferred to pre-chilled tubes. The samples were homogenized in lysis buffer containing 1% cocktail, sonicated on ice, and centrifuged at 12,000× g for 15 min at 4°C. The supernatant was collected for protein quantification via BCA assay. For MDA detection, 100 μL of lysate was mixed with 200 μL of thiobarbituric acid working solution and heated at 100°C for 15 min. After cooling to room temperature, the mixture was centrifuged at 1000× g for 10 min, and 200 μL of supernatant was transferred to a 96-well plate. Absorbance was measured at 532 nm using a microplate reader. MDA concentration was determined using a standard curve prepared from 1,1,3,3-tetramethoxypropane and normalized to total protein content. Results are expressed as nanomoles per milligram of protein (nM/mg protein).
Quantification of intracellular Fe2+ levels
Intracellular ferrous ion (Fe2+) levels were measured using a commercial colorimetric assay kit (Elabscience). AC16 cells were resuspended in ice-cold assay buffer and lysed by ultrasonication on ice. After centrifugation at 12,000× g for 10 min at 4°C, the supernatant was collected and mixed with an equal volume of chromogenic reagent. The mixture was incubated at 37°C for 10 min, followed by a second centrifugation under the same conditions to remove any precipitate. Absorbance of the resulting supernatant was measured at 593 nm in a 96-well plate using a microplate reader. Fe2+ concentration was determined from a standard curve and normalized to total protein content.
Transmission electron microscopy
Transmission electron microscopy (TEM) was used to examine cellular ultrastructure. Cells were harvested by scraping and centrifuged at 300× g for 5 min at 4°C. The pellets were fixed in 2.5% glutaraldehyde/0.1 M phosphate buffer (pH 7.4) for 1 h at 4°C, washed three times with buffer, and post-fixed in 1% osmium tetroxide for 2 h at room temperature. Samples were dehydrated through a graded ethanol series (30%–100%), infiltrated with propylene oxide, and embedded in Epon 812 resin (Sigma-Aldrich). After polymerization at 60°C for 48 h, ultrathin sections (70–90 nm) were cut using a Leica Ultracut UCT ultramicrotome (Leica Microsystems, Wetzlar, Germany) and mounted on copper grids. Sections were double-stained with 2% uranyl acetate and Reynolds lead citrate, and observed under a JEM-1400Plus transmission electron microscope (JEOL, Tokyo, Japan) operating at 80 kV. Images were acquired with an AMT XR81 CCD camera (USA).
RNA extraction and quantitative real-time PCR
Total RNA was extracted from AC16 cells using TRIzol reagent (Accurate Biotechnology, Hunan, China). Complementary DNA (cDNA) was synthesized using a reverse transcription kit (Accurate Biotechnology) according to the manufacturer’s instructions. Quantitative real-time PCR was performed on an Agilent Mx3000P system (Agilent Technologies, Santa Clara, CA, USA) and SYBR Premix Ex Taq II (Accurate Biotechnology). Gene-specific primers were designed using Primer Premier 5.0 with the following sequences (5′ to 3′):
HO-1.
Forward: AAGACTGCGTTCCTGCTCAAC,
Reverse: AAAGCCCTACAGCAACTGTCG;
NQO1.
Forward: ATGTATGACAAAGGACCCTTCC,
Reverse: TCCCTTGCAGAGAGTACATGC;
GAPDH.
Forward: CCTGTTCGACAGTCAGCCG,
Reverse: GAGAACAGTGAGCGCCTAGT.
Gene expression was normalized to GAPDH and calculated using the 2−ΔΔCT method.
Measurement of lipid peroxidation using C11-BODIPY probe
Lipid peroxidation was assessed using the fluorescent probe C11-BODIPY 581/591 (Thermo Fisher Scientific). Briefly, AC16 cells were seeded in black 96-well plates at a density of 1 × 10⁴ cells per well. After adherence, cells were treated with the indicated compounds for 24 h, followed by incubation with 5 μM C11-BODIPY 581/591 in serum-free medium at 37°C for 30 min in the dark. Cells were then washed twice with PBS and incubated in serum-free medium for an additional 10 min to reduce background fluorescence. Fluorescence was measured using a SpectraMax M5 microplate reader (Molecular Devices) with excitation/emission wavelengths of 488/520 nm (oxidized form) and 581/591 nm (reduced form). Lipid ROS levels were expressed as the ratio of oxidized-to-reduced fluorescence intensity and presented as fold change relative to untreated controls.
Statistical analysis
Data are presented as mean ± SEM from at least three independent experiments. Statistical analyses were performed using GraphPad Prism (version 9.5.1; GraphPad Software, San Diego, USA). Differences between two groups were evaluated by Student's t-test. For comparisons involving two independent variables, two-way analysis of variance (ANOVA) was applied, followed by Tukey’s post hoc test. Multiple group comparisons under a single variable were analyzed by one-way ANOVA with Tukey’s test. A p-value of less than 0.05 was considered statistically significant.
Results
Bardo induces cardiomyocyte cell death in a concentration-dependent manner
The chemical structure of Bardo is shown in Figure 1(A). AC16 cell viability was significantly reduced following treatment with Bardo (25–400 nM) in a concentration- and time-dependent manner (Figure 1(B)). Exposure to 100 nM and 200 nM Bardo for 24 h reduced cell viability by 55.8% and 45.9%, respectively. Morphological analysis by light microscopy after 24 h of Bardo exposure revealed notable cell shrinkage and detachment (Figure 1(C)), and crystal violet staining showed a clear dose-dependent reduction in cell survival following 24 h of treatment (Figure 1(D)). Consistently, LDH release was significantly elevated in the culture supernatant of Bardo-treated cells, further confirming the induction of cell death (Figure 1(E)). Bardoxolone induces concentration-dependent cell death in cultured cardiomyocytes. (A) Chemical structure of bardoxolone. (B) AC16 cardiomyocytes were treated with bardoxolone (25–400 nM) for 0–24 h, and cell viability was assessed by MTT assay. Data were analyzed by two-way ANOVA followed by Tukey’s multiple comparisons test. A significant interaction between concentration and time was observed (F (15, 36) = 22.05, ****p < 0.0001). For clarity, statistical significance is denoted only for key comparisons: Bardo at 50, 100, 200, and 400 nM significantly reduced viability compared to their time matched control groups at 6, 12, and 24 h. Symbols indicate significant comparisons (p < 0.05) with control groups at different time points: *vs. 6 h control; #vs. 12 h control; $vs. 24 h control. (C) Phase-contrast images of AC16 cells treated with bardoxolone (50, 100, or 200 nM) for 24 h, showing concentration dependent morphological alterations. Scale bar = 25 μm. (D) Representative images of crystal violet staining showing viable adherent cells after 24 h treatment with bardoxolone. Scale bar = 4 mm. (E) Quantitative analysis of LDH release in cell culture supernatants. U/g protein: one unit of enzyme activity is defined as the amount required to catalyze the formation of 1 µmol of pyruvate in 15 min at 37°C. Data were analyzed by one-way ANOVA (F (3, 8) = 1.388, ****p < 0.0001) followed by Tukey’s test. Significant comparisons versus the control group are as follows: 50 nM (mean difference = 0.2143, 95% CI: 0.1293 to 0.2993, **p = 0.0022); 100 nM (0.7247, 0.4020 to 1.047,**p = 0.0034); 200 nM (1.347, 1.039 to 1.655, ***p = 0.0003). All quantitative data are expressed as mean ± SEM from three independent biological replicates (n = 3).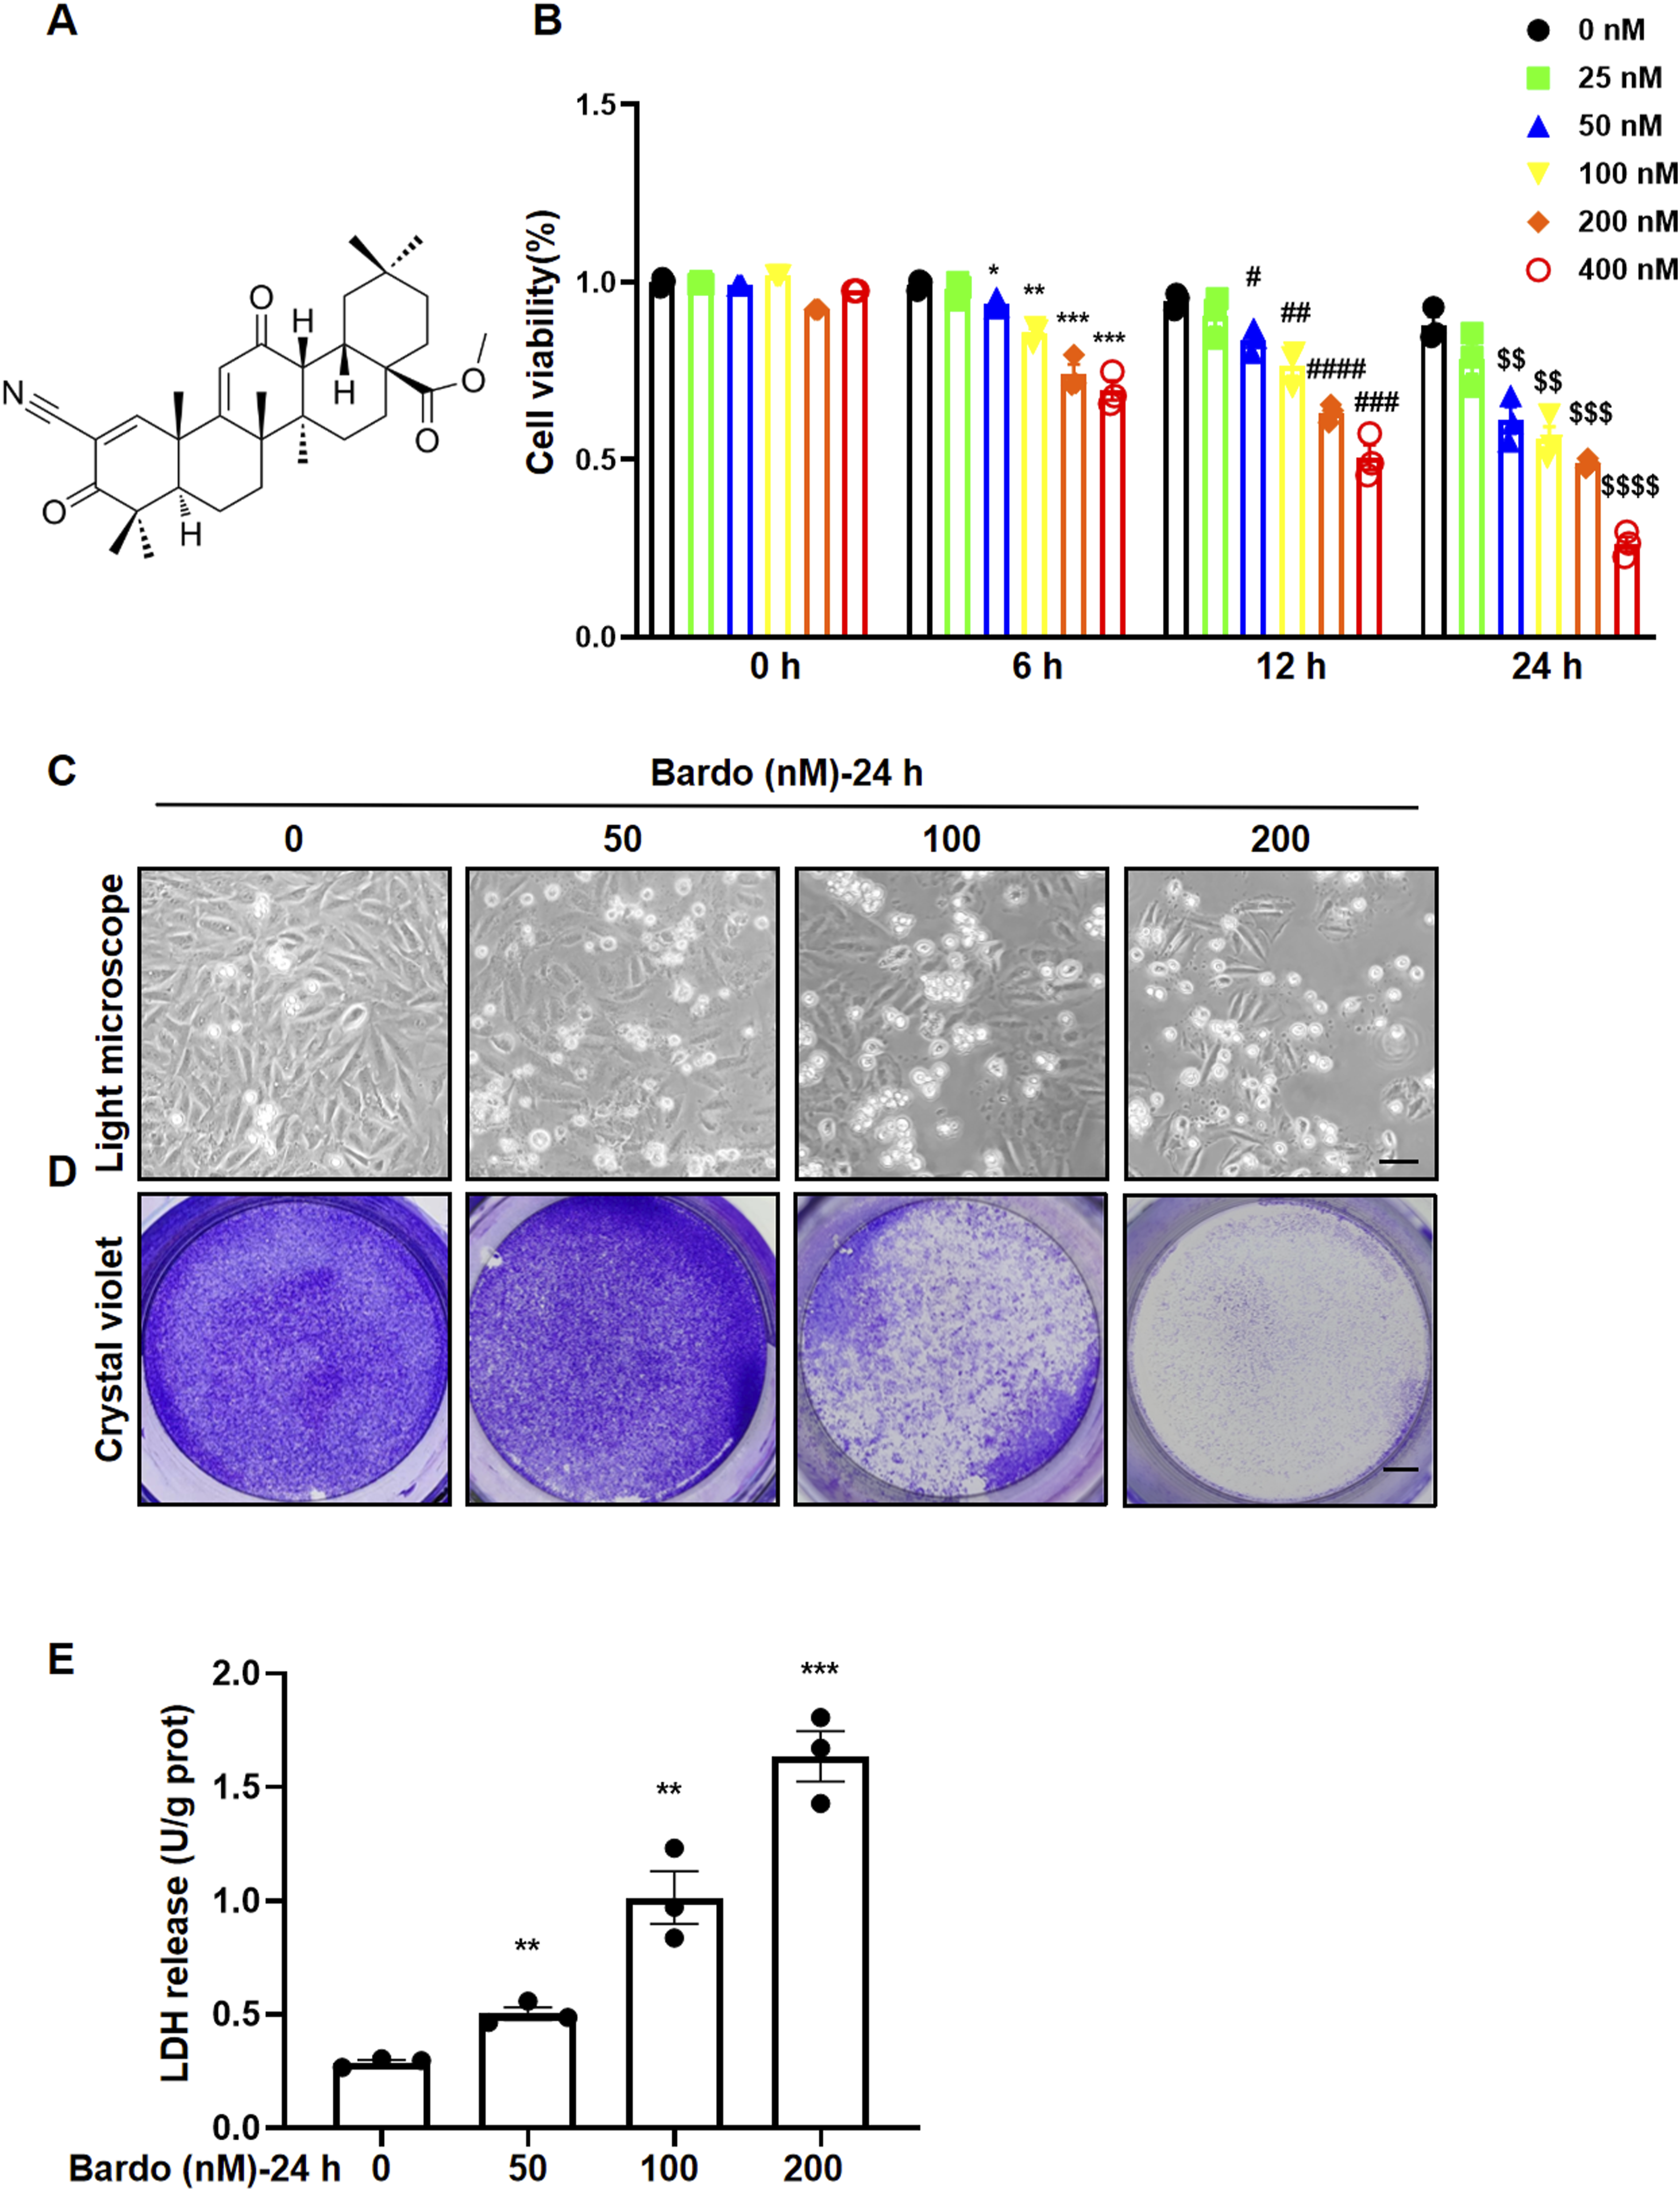
Bardo induces time-dependent cardiomyocyte cell death
To characterize the temporal dynamics of Bardo-induced cytotoxicity, AC16 cells were treated with 100 nM or 200 nM Bardo over a time course.. Morphological analysis by light microscopy revealed a time-dependent increase in cell shrinkage and detachment following exposure to both concentrations of Bardo (Figure 2(A) and (C)). Correspondingly, crystal violet staining showed a progressive decline in adherent cell density with extended exposure (Figure 2(B) and (D)). Moreover, LDH release into the culture supernatant was significantly elevated in Bardo-treated cells in a time-dependent manner, further confirming the progressive increase in cell death (Figure 2(E) and (F)). Bardoxolone induces time-dependent cell death in cultured cardiomyocytes. (A, C) Phase-contrast images of AC16 cells treated with 100 or 200 nM bardoxolone for 0–24 h, showing time-dependent morphological alterations. Scale bar = 25 μm. (B, D) Representative images of crystal violet staining showing time-dependent reduction of viable adherent AC16 cells following treatment with 100 or 200 nM bardoxolone for 0–24 h. Scale bar = 4 mm. (E, F) Quantitative analysis of LDH release. Data were analyzed by one-way ANOVA followed by Tukey’s multiple comparisons test. For cells treated with 100 nM bardoxolone, a significant effect of time was observed (F (3, 8) = 63.52, ****p < 0.0001). Significant comparisons versus the 0 h control are as follows: 6 h (mean difference = 0.1987, 95%CI: 0.1453 to 0.2521, ***p = 0.0005); 12 h (0.4194, 0.2624 to 0.5763,**p = 0.0018); 24 h (0.8330, 0.6422 to 1.024, ***p = 0.0003). For cells treated with 200 nM bardoxolone, a significant effect of time was observed (F (3, 8) = 70.11, ****p < 0.0001). Significant comparisons versus the 0 h control are as follows: 6 h (mean difference = 0.2260, 95%CI: 0.1268 to 0.3251, **p = 0.0032); 12 h (0.7312, 0.4299 to 1.033,**p = 0.0025); 24 h (1.292, 1.063 to 1.521, ****p < 0.0001). All quantitative data are expressed as mean ± SEM from three independent biological replicates (n = 3).
Bardo enhances Nrf2 translocation to the nucleus, subsequently increasing antioxidant levels
Nrf2 is a crucial transcription factor regulating genes involved in antioxidant defense and detoxification.23,24 As an Nrf2 activator, Bardo facilitates the nuclear translocation of Nrf2, resulting in upregulation of downstream target genes such as HO-1, NQO-1, glutamate cysteine ligase catalytic subunit (GCLC), and glutamate cysteine ligase modifier subunit (GCLM).25,26 To examine Bardo’s effects on the Nrf2 pathway, AC16 cells were exposed to Bardo (100 nM or 200 nM) for 24 h. Bardo exposure significantly enhanced Nrf2 nuclear translocation (Figure 3(A)). Moreover, RT-qPCR and western blot analyses demonstrated substantial increases in both mRNA and protein levels of HO-1 and NQO1 in Bardo-treated cardiomyocytes (Figure 3(B) and (C)). Bardoxolone promotes Nrf2 nuclear translocation and upregulates antioxidant expression in cardiomyocytes. AC16 cardiomyocytes were treated with bardoxolone (0, 100, or 200 nM) for 24 h. (A) Representative Western blots and quantitative analysis of Nrf2 protein levels in cytoplasmic and nuclear fractions. Data were analyzed by one-way ANOVA. In the nuclear fraction, Nrf2 levels were significantly increased at 100 nM (mean difference = 1.43, 95%CI: 0.13 to 2.72, *p = 0.038) and 200 nM (1.093, 0.48 to 1.71, **p = 0.008) versus control. Similarly, in the cytoplasmic fraction, levels were elevated at 100 nM (0.937, 0.503 to 1.371, **p = 0.0039) and 200 nM (1.325, 0.328 to 2.322, *p = 0.021). (B) qPCR analysis of mRNA expression for the Nrf2 target genes HO-1 and NQO1. Data were analyzed by one-way ANOVA. HO-1 mRNA was markedly induced by 100 nM (mean difference = 16.55, 95%CI: 15.15 to 17.96, ****p < 0.0001) and 200 nM (31.94, 28.23 to 35.6, ****p < 0.0001). NQO1 mRNA was also significantly upregulated at 100 nM (20.39, 16.11 to 24.67, ***p = 0.0002) and 200 nM (23.86, 20.68 to 27.04, ****p < 0.0001). (C) Representative Western blots and quantitative analysis of HO-1 and NQO1 protein levels. HO-1 protein levels were significantly higher at 100 nM (mean difference = 3.082, 95%CI: 0.8687 to 5.296, *p = 0.0181) and 200 nM (2.87, 0.8341 to 4.907, **p = 0.0173). NQO1 protein expression was also elevated at 100 nM (4.239, 2.954 to 5.52, ***p = 0.00084) and 200 nM (4.52, 3.385 to 5.651, ***p = 0.0004). All quantitative data are presented as mean ± SEM from three independent biological replicates (n = 3).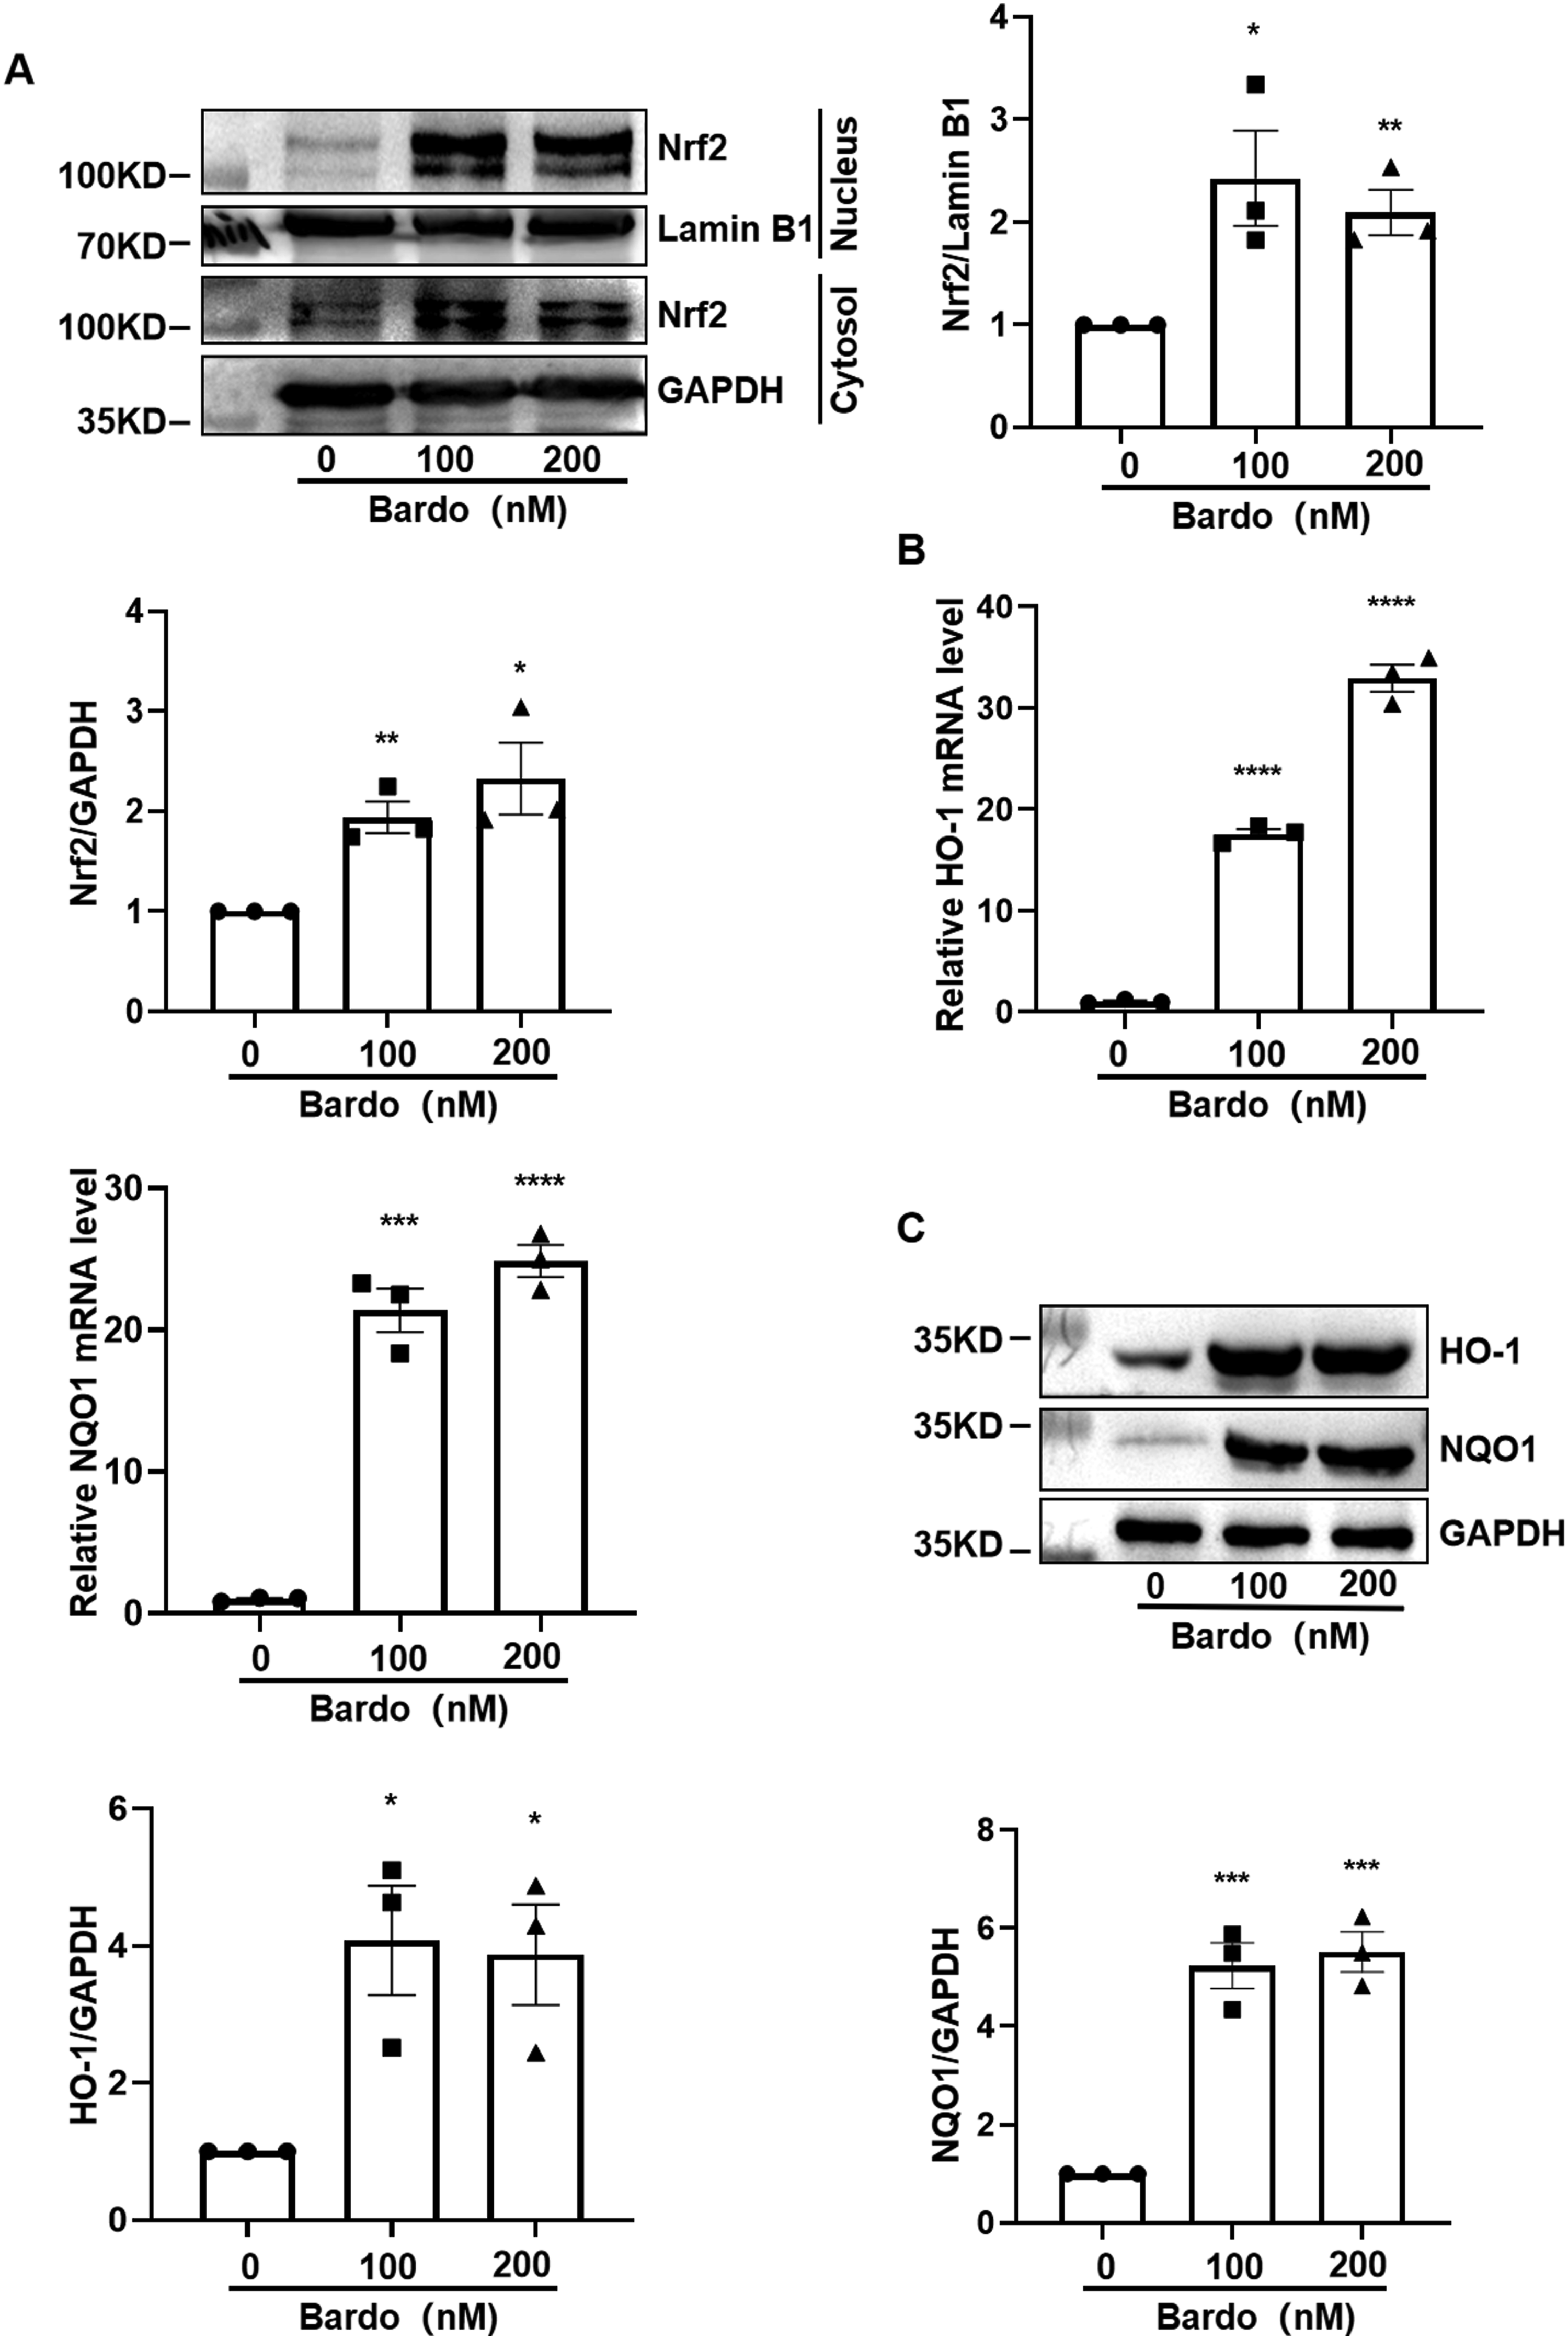
Fer-1 attenuates bardo-induced cardiomyocyte cell death
To investigate the specific mode of cell death induced by Bardo, AC16 cells were co-treated with Bardo and either the pan-caspase inhibitor Z-VAD-FMK, the RIP1 kinase inhibitor Necrostatin-2, or the ferroptosis inhibitor Fer-1. Light microscopy, crystal violet staining, and LDH assays demonstrated that Fer-1 significantly reduced Bardo-induced cytotoxicity at 200 nM (Figure 4(A)–(C)). In contrast, Z-VAD-FMK and Necrostatin-2 failed to protect AC16 cells from Bardo-induced cell death (Figure 4(D)–(i)). These results suggest that Bardo induces cardiomyocyte damage through ferroptosis. To further distinguish ferroptosis from apoptosis, caspase-3 activity was evaluated using Dox as a positive control
27
and erastin as a negative control. As expected, Dox significantly increased caspase-3 activity, while neither erastin nor Bardo affected caspase-3 activity. These observations provide indirect evidence that Bardo-induced cardiomyocyte death occurs through a non-apoptotic, ferroptotic pathway (Figure 4(J)). Fer-1 protects against bardoxolone-induced cardiomyocyte death. (A) Phase-contrast images of AC16 cells. Scale bar = 25 µm. (B) Crystal violet staining of viable adherent cells. Scale bar = 4 mm. (C) Quantitative analysis of LDH release. Data were analyzed by one-way ANOVA (F (2, 6) = 162.5, ****p < 0.0001) followed by Tukey’s test. Bardoxolone significantly increased LDH release versus control (mean difference = 33.8, 95%CI: 27.91 to 39.69, ****p < 0.0001); Bardo + Fer-1 versus Bardo (−23.78, −30.33 to −17.24, ###p = 0.0005). (D, E, G, H) Representative images assessing effects of alternative inhibitors. Phase-contrast (D, G) and crystal violet staining (E, H) of cells co-treated with Bardo and Z-VAD-FMK (D, E) or Necrostatin-2 (G, H). Scale bars = 25 µm (phase-contrast) and 4 mm (crystal violet). (F, I) Quantitative LDH analysis confirming that neither Z-VAD-FMK nor Necrostatin-2 conferred protection. In (F), one-way ANOVA (F (2, 6) = 76.57, ****p < 0.0001) with Tukey’s test showed bardoxolone increased LDH versus control (mean difference = 28.44, 95%CI: 19.38 to 37.50, ***p < 0.001), which was not reversed by Z-VAD-FMK (Bardo + Z-VAD-FMK vs Bardo: 3.211, −6.36 to 12.78, p = 0.4041, NS). In (I), one-way ANOVA (F (2, 6) = 28.97, ***p = 0.0008) with Tukey’s test showed bardoxolone increased LDH versus control (32.61, 22.61 to 42.62, ***p = 0.0008), which was not reversed by Necrostatin-2 (Bardo + Nec-2 vs Bardo: 0.6988, −16.31 to 17.71, p = 0.9147, NS). (J) Caspase-3 activity assay. Bardoxolone (100-200 nM) did not activate caspase-3, unlike the Dox positive control. Specific comparisons versus control: Bardo 100 nM (mean difference = 0.092, 95%CI: −0.16 to 0.34, p = 0.367, NS); Bardo 200 nM (0.255, −0.27 to 0.78, p = 0.248, NS); Dox (22.66, 13.66 to 31.66, **p = 0.0022); erastin (0.326, −0.062 to 0.714, p = 0.080, NS). All quantitative data are expressed as mean ± SEM from three independent biological replicates (n = 3). *vs. control group, # versus Bardo group, NS, not significant.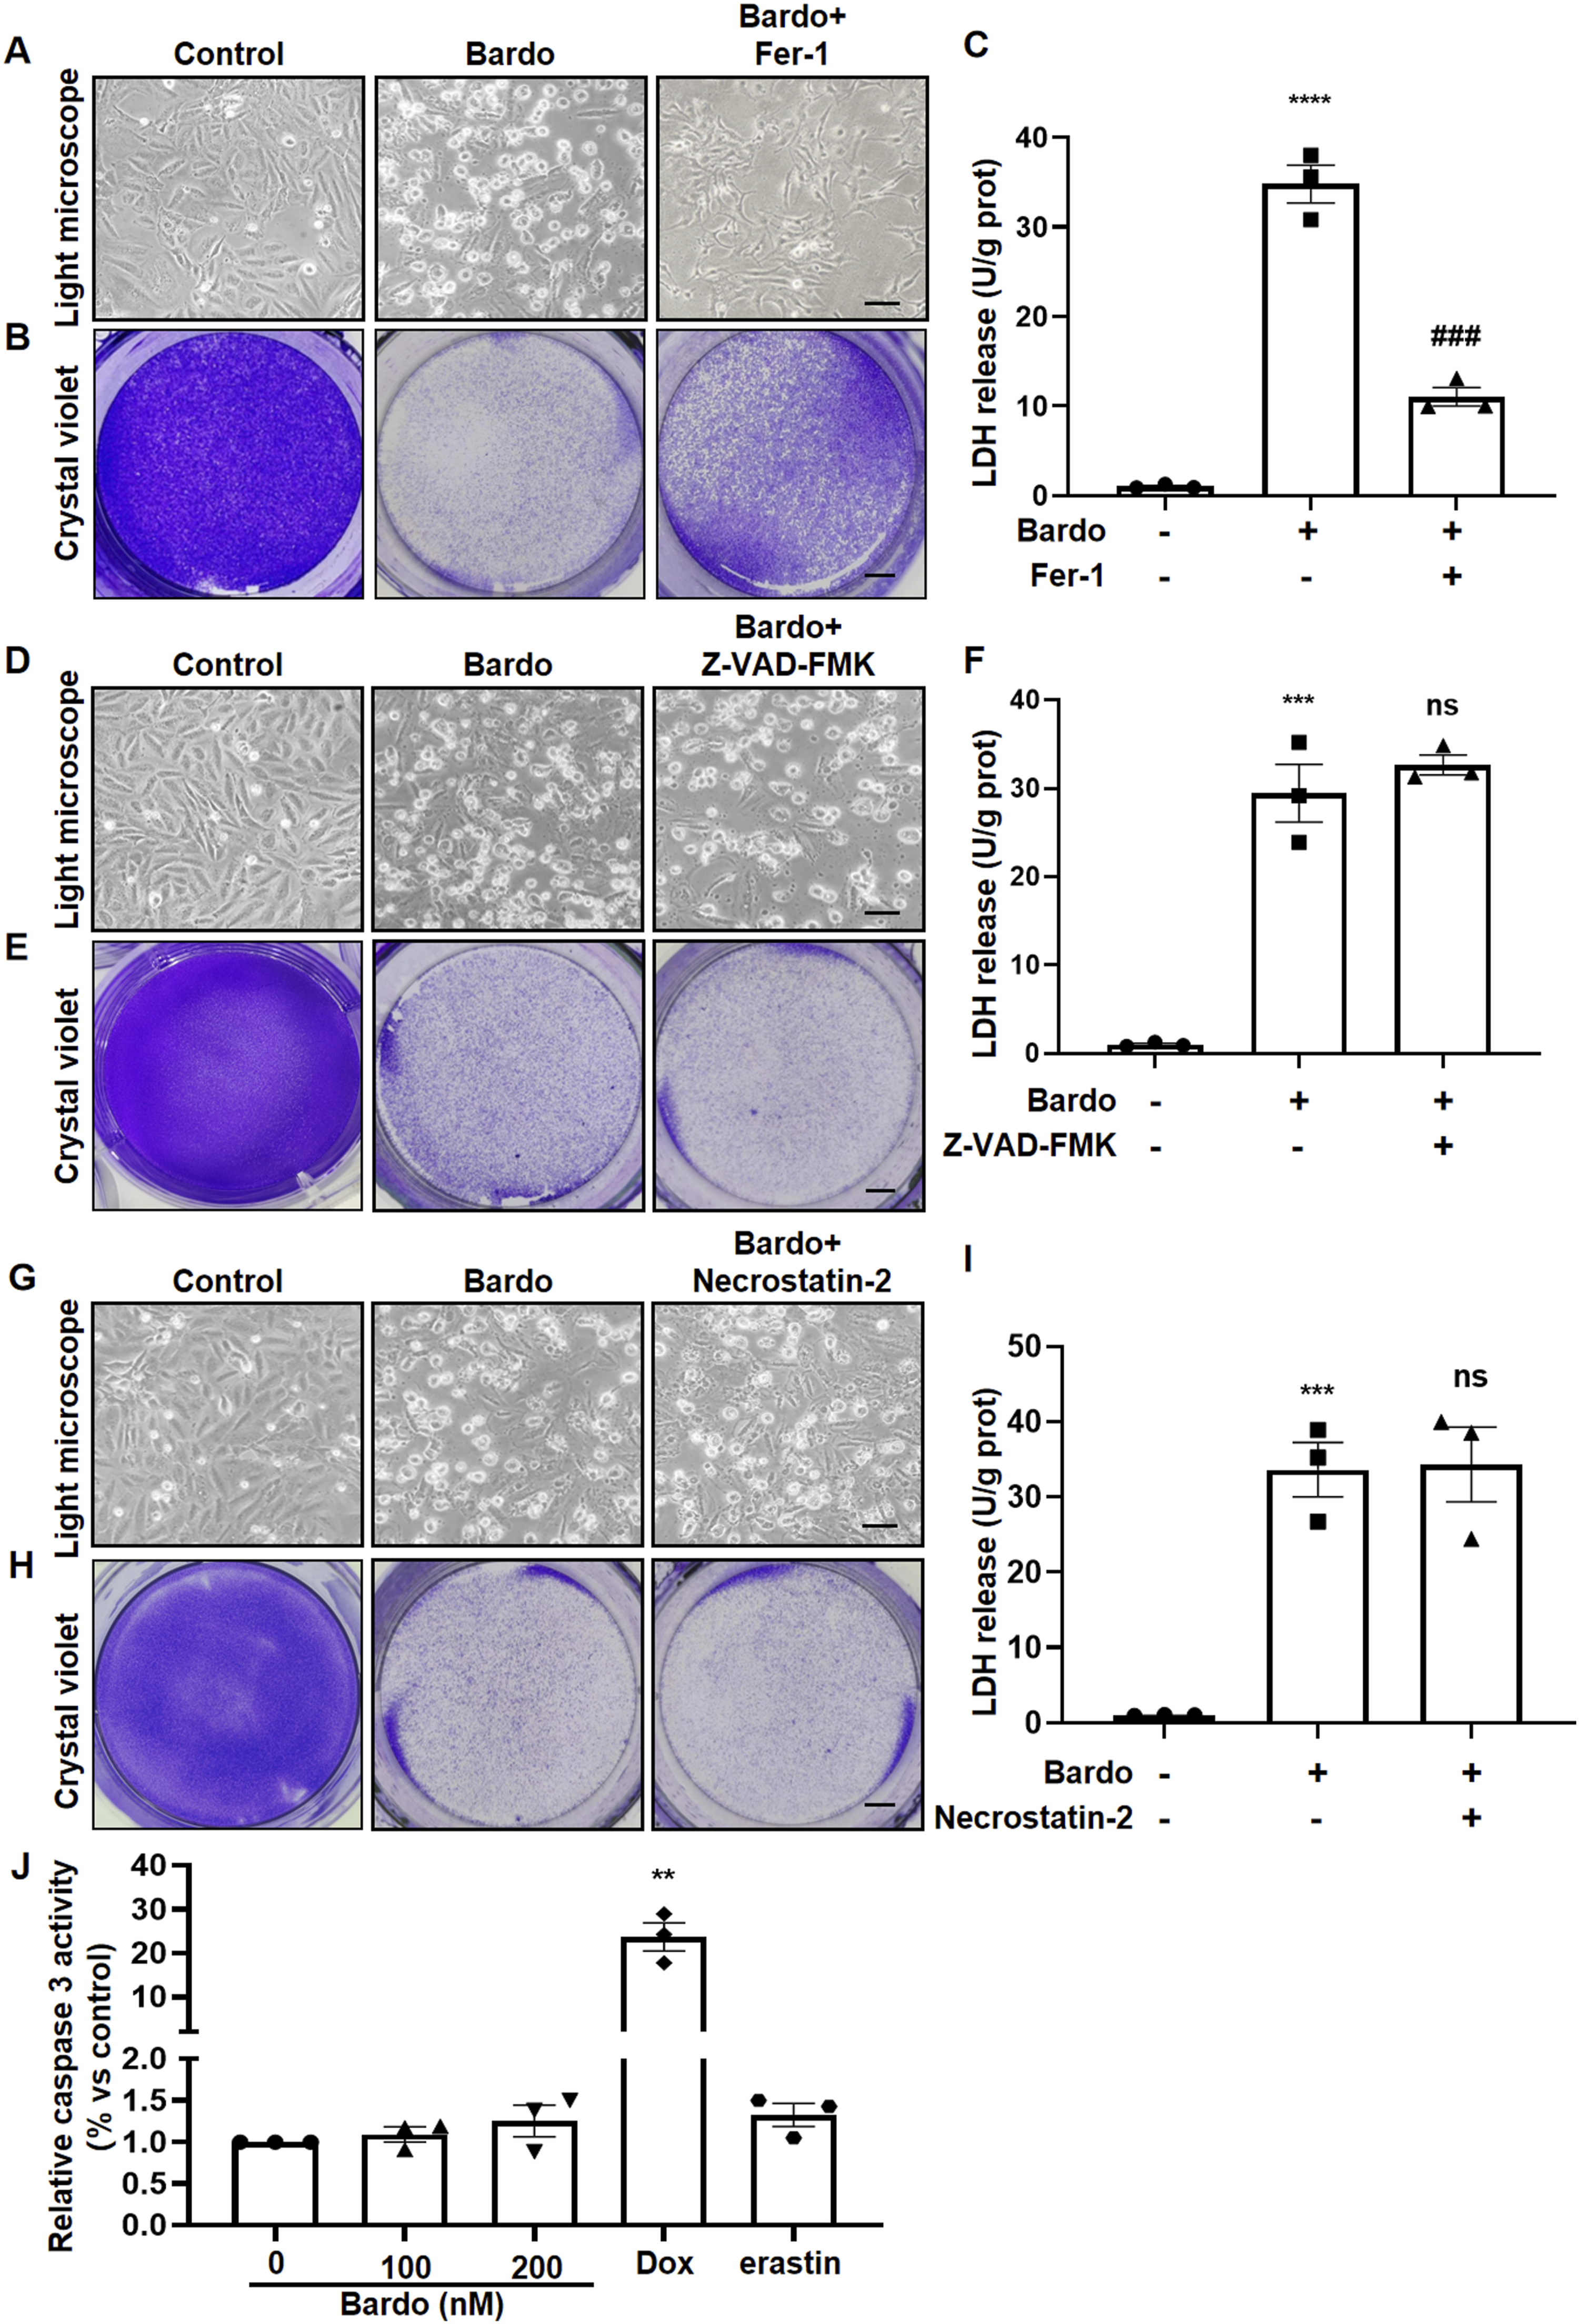
Bardo induces alterations in molecules associated with ferroptosis
To further examine the role of Bardo in ferroptosis, AC16 cells were treated with Bardo or erastin, a well-established ferroptosis inducer. Western blot analysis of two key ferroptosis markers, GPX4 and SLC7A11,28–30 revealed that Bardo significantly reduced their expression, consistent with the effects of erastin (Figure 5(A)). Ferroptosis is characterized by iron-dependent lipid peroxidation that results in membrane damage.31,32 Excessive iron promotes ferroptosis by enhancing ROS generation through the Fenton reaction and lipoxygenase activity.
33
In Bardo-treated AC16 cardiomyocytes, intracellular ferrous ion levels were markedly elevated, accompanied by elevated ROS production and lipid peroxidation, as reflected by higher MDA content (Figures. 5(B)–5(D)). These findings support the conclusion that Bardo induces ferroptosis in cardiomyocytes. Bardoxolone modulates key ferroptotic regulators and hallmarks in cardiomyocytes. (A) Representative Western blots and quantitative analysis of the ferroptosis-related proteins, including GPX4 and SLC7A11. Data were analyzed by one-way ANOVA. GPX4 protein levels were significantly decreased by Bardo 100 nM (mean difference = −0.326, 95%CI: −0.407 to −0.245, ***p = 0.0004), Bardo 200 nM (−0.519, −0.718 to −0.319, **p = 0.0019), and erastin (−0.599, −0.780 to −0.418, *p = 0.0008) versus control. SLC7A11 protein levels were also significantly reduced by Bardo 100 nM (mean difference = −0.4765, 95%CI: −0.5414 to −0.4117, ****p < 0.0001), Bardo 200 nM (−0.6867, −0.9552 to −0.4183, **p = 0.0021), and erastin (−0.7530, −1.081 to −0.4250, **p = 0.0031). (B) Quantitative measurement of intracellular ROS levels using DCFH-DA fluorescence. Data were analyzed by one-way ANOVA. ROS levels increased significantly versus control in Bardo 100 nM (mean difference = 2.396, 95%CI: 1.751 to 3.042, ***p = 0.0005), Bardo 200 nM (2.750, 1.251 to 4.250, **p = 0.0070), and erastin (4.356, 2.376 to 6.336, **p = 0.0036) treatments. (C) Intracellular Fe2 + levels measured by colorimetric assay (μmol/g protein). Data were analyzed by one-way ANOVA. Fe2 + concentration was significantly elevated versus control in Bardo 100 nM (mean difference = 2.523, 95%CI: 0.6626 to 4.382, *p = 0.0197), Bardo 200 nM (6.825, 3.187 to 10.46, **p = 0.0065), and erastin (5.968, 3.835 to 8.101, **p = 0.0015). (D) Lipid peroxidation assessed by MDA quantification (μmol/g protein). Data were analyzed by one-way ANOVA. MDA levels increased significantly versus control with Bardo 100 nM (mean increase = 13.06, 95%CI: 5.59 to 20.53, **p = 0.0083), Bardo 200 nM (27.07, 14.42 to 39.71, **p = 0.0040), and erastin (26.52, 23.36 to 29.69, **p < 0.0001). All quantitative data are expressed as mean ± SEM from three independent biological replicates (n = 3).
Fer-1 largely blocks bardo-induced ferroptotic damage
To further confirm that Bardo causes ferroptotic cell death, AC16 cells were co-treated with Bardo (200 nM) and Fer-1.
34
As anticipated, Fer-1 significantly reduced Bardo-induced cell death. Quantitative analysis revealed a significant upregulation of both GPX4 and SLC7A11 expression in the Bardo + Fer-1 group compared to the Bardo-only group (Figure 6(A)). Additionally, biochemical assays demonstrated a marked reduction in key ferroptosis-associated markers, including ROS, MDA, and intracellular ferrous ion levels, in the Bardo + Fer-1 group compared to Bardo treatment alone (Figures. 6(B)–6(D)). Together, these results indicate that Fer-1 protects against Bardo-induced ferroptosis in human cardiomyocytes through modulation of antioxidant defense systems and iron homeostasis. Fer-1 protects against bardoxolone-mediated ferroptosis in cardiomyocytes. AC16 cells were pretreated with 10 μM Fer-1 for 2 h before exposure to 200 nM bardoxolone. (A) Representative Western blots and quantitative analysis of ferroptosis-related proteins GPX4 and SLC7A11. For GPX4, one-way ANOVA revealed significant differences (F (2, 6) = 25.25, **p = 0.0012). Tukey’s test: Bardo significantly decreased GPX4 versus control (mean difference = −0.5203, 95%CI: −0.7461 to −0.2946, **p = 0.0031); Bardo + Fer-1 significantly increased GPX4 versus Bardo (0.2494, 0.0003 to 0.4985, #p = 0.0498). For SLC7A11, one-way ANOVA revealed significant differences (F (2, 6) = 53.10, ***p = 0.0002). Tukey’s test: Bardo significantly decreased SLC7A11 versus control (mean difference = −0.6697, 95%CI: −0.8681 to −0.4712, ***p = 0.0007); Bardo + Fer-1 significantly increased SLC7A11 versus Bardo (0.3403, 0.1194 to 0.5613, #p = 0.0129). (B) Quantitative assessment of intracellular ROS production. One-way ANOVA revealed significant differences (F (2, 6) = 16.26, **p = 0.0038). Tukey’s test: Bardo significantly increased ROS versus control (mean difference = 2.750, 95%CI: 1.251 to 4.250, **p = 0.0070); Bardo + Fer-1 (−2.135, −3.856 to −0.4133, #p = 0.0262). (C) Measurement of intracellular Fe2 + levels. One-way ANOVA revealed significant differences (F (2, 6) = 41.03, ***p = 0.0003). Tukey’s test: Bardo significantly increased Fe2 + vs. control (mean increase = 6.808, 95%CI: 4.126 to 9.490, **p = 0.0021); Bardo + Fer-1 significantly decreased Fe2 + versus Bardo (−5.352, −8.019 to −2.684, ##p = 0.0051). (D) Analysis of MDA content. One way ANOVA revealed significant differences (F (2, 6) = 52.87, ***p = 0.0002). Tukey’s test: Bardo significantly increased MDA versus control (mean increase = 23.86, 95%CI: 16.92 to 30.79, ***p = 0.0007); Bardo + Fer-1 significantly decreased MDA versus Bardo (−15.67, −23.56 to −7.785, ##p = 0.0053). (E) Representative TEM images of mitochondrial ultrastructure. For each condition, the top panel shows a low magnification overview (scale bar = 250 nm), with the area of interest outlined. The bottom panel displays a corresponding 5x magnified view (scale bar = 50 nm). All quantitative data are expressed as mean ± SEM from three independent biological replicates (n = 3). *vs. control group, # versus Bardo group.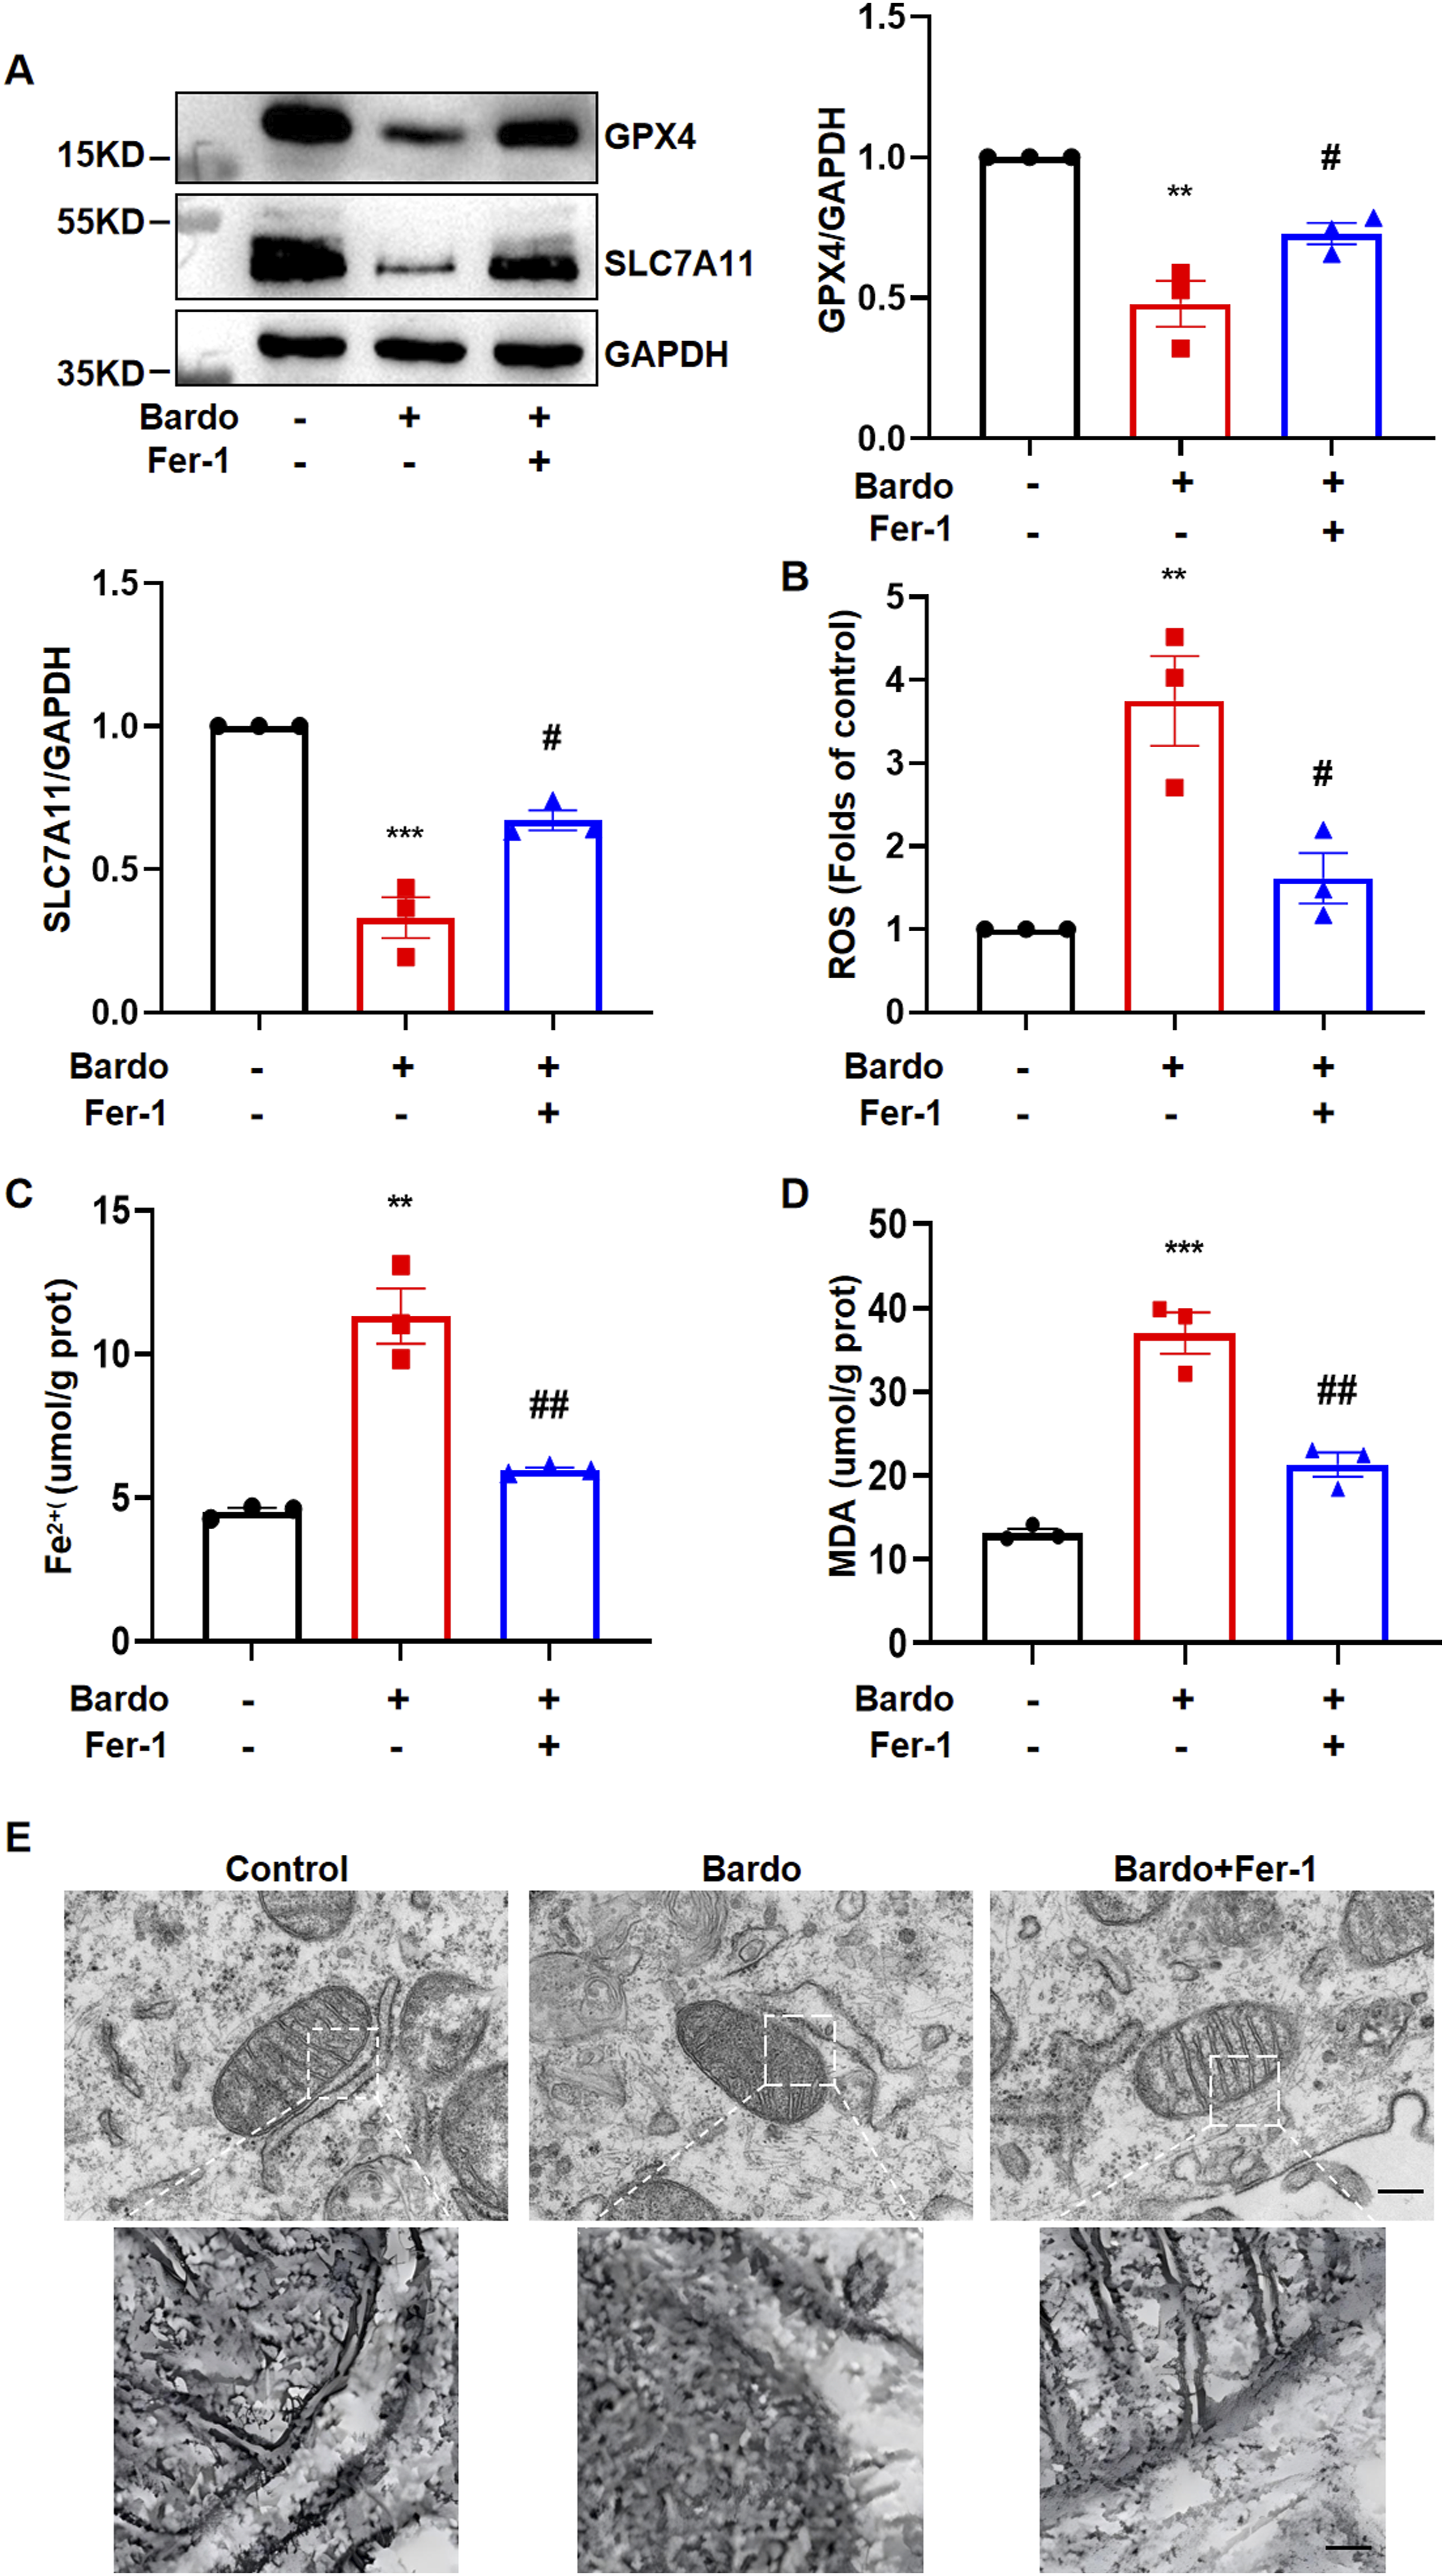
Ferroptosis is pathologically characterized by distinct mitochondrial alterations, including reduced mitochondrial volume, increased bilayer membrane density, and loss or fragmentation of cristae, 35 while nuclear morphology and plasma membrane integrity remain preserved.36–38 TEM demonstrated that Bardo induced significant mitochondrial structural disorganization in AC16 cardiomyocytes, manifesting as crista fragmentation and matrix condensation. Importantly, co-treatment with Fer-1 substantially ameliorated these morphological abnormalities and preserved mitochondrial ultrastructure (Figure 6(E)). These findings provide compelling ultrastructural evidence that ferroptosis underlies Bardo-induced cardiomyocyte injury and demonstrate the protective effects of Fer-1 in maintaining mitochondrial integrity.
Deferoxamine and Fer-1 cooperatively ameliorate bardo-induced ferroptotic damage
To further elucidate the mechanistic role of ferroptosis in Bardo-induced cardiotoxicity, we specifically targeted key ferroptotic pathways using the iron chelator DFO and Fer-1, both individually and in combination. As demonstrated in Figure 7(A), treatment with either Fer-1 or DFO alone significantly rescued the expression of the key ferroptosis-related proteins GPX4 and SLC7A11, which were substantially suppressed by Bardo. Notably, the combined application of Fer-1 and DFO resulted in a near-complete restoration of GPX4 and SLC7A11 levels, indicating a synergistic protective effect against Bardo-induced ferroptotic signaling. DFO and Fer-1 cooperatively ameliorate bardoxolone-induced ferroptotic damage. AC16 cells were pretreated with 10 μM Fer-1, 50 μM DFO, or their combination for 2 h prior to exposure to 200 nM bardoxolone. (A) Representative Western blots and quantitative analysis of ferroptosis-related proteins GPX4 and SLC7A11. For GPX4, one-way ANOVA revealed significant differences (F (4, 10) = 11.5, **p = 0.0011). Tukey’s test: Bardo significantly decreased GPX4 versus control (mean difference = −0.5510, 95%CI: −0.5754 to −0.5267, ****p 0.0007); Erastin significantly decreased SLC7A11 versus control (−0.7747, −0.8762 to −0.6733, ****p. <0.0001). (B) Quantitative analysis of lipid peroxidation levels measured by C11-BODIPY 581/591 probe. One-way ANOVA revealed significant differences (F(4, 10) = 53.83, ****p <0.0001). Tukey’s test: Bardo significantly increased lipid peroxidation vs. control (mean difference =0.9270, 95%CI: 0.7130 to 1.141, ***p = 0.0003); This increase was significantly inhibited by Fer−1 (Bardo+Fer–1 vs. Bardo: –0.7272, –0.9970 to –0.4573, ##p = 0.0017); DFO (Bardo+DFO vs. Bardo: –0.6684, –0.8614 to –0.4755, ###p = 0.0007); and their combination (Bardo+Fer–1+DFO vs. Bardo: –0.9762, –1.185 to –0.7672, ###p = 0.0002); Erastin significantly increased lipid peroxidation vs. Control (1.234, 0.8314 to 1.637, **p=0.0010). All quantitative data are expressed as mean ± SEM from three independent biological replicates (n = 3). *vs. control group, # vs. Bardo group.
To directly quantify lipid peroxidation–a hallmark of ferroptosis–we employed the C11-BODIPY 581/591 fluorescent probe. As shown in Figure 7(B), Bardo treatment induced a pronounced increase in lipid peroxidation, similar to the effect observed with the ferroptosis inducer erastin. This oxidative damage was markedly attenuated by either Fer-1 or DFO alone, and most effectively suppressed by their combination. Together, these results mechanistically confirm that Bardo triggers ferroptosis in cardiomyocytes through iron-dependent lipid peroxidation, and that co-inhibition of iron accumulation and lipid peroxidation offers superior cytoprotection.
Discussion
Bardo, a potent Nrf2 activator, has demonstrated significant therapeutic potential in managing CKD and diabetic kidney disease by improving glomerular filtration rate and renal function via its antioxidant activity. However, its clinical application has been constrained by associated cardiovascular adverse events.4,5 Several mechanisms have proposed to explain the mechanism underlying Bardo-induced cardiovascular toxicity. The leading hypothesis posits that Bardo may promote hemodynamic changes through volume expansion and tachycardia, thereby increasing cardiac preload and afterload and potentially culminating in heart failure in vulnerable individuals. Furthermore, clinical studies have reported pronounced weight loss in patients receiving Bardo, suggesting potential disruption of fluid homeostasis—either through intracellular fluid depletion (particularly in skeletal muscle) or extracellular fluid redistribution (interstitial fluid alterations).39–41 Nevertheless, the direct impact of Bardo on cardiomyocytes has remained unclear. In this study, we demonstrate that Bardo triggers cardiomyocyte death despite promoting Nrf2 nuclear translocation and subsequent upregulation of downstream antioxidant enzymes, including HO-1 and NQO1.
Notably, pharmacological inhibition experiments revealed that only Fer-1 effectively attenuated Bardo-induced cardiomyocyte death, indicating ferroptosis as the predominant cell death mechanism. Molecular analyses demonstrated that Bardo exposure led to: (1) downregulation of key ferroptosis-defense proteins GPX4 and SLC7A11; (2) elevated intracellular ROS levels; (3) increased ferrous ion accumulation; and (4) enhanced lipid peroxidation. TEM revealed characteristic mitochondrial alterations, including shrinkage, increased membrane density, disorganized or lost cristae, and outer membrane rupture.36,42 These changes were substantially reversed by co-treatment with Fer-1. Furthermore, both DFO alone and its combination with Fer-1 conferred protection against Bardo-induced cytotoxicity, further underscoring the central role of ferroptosis in this process. Ferroptosis, an iron-dependent form of regulated cell death driven by lipid peroxidation and characterized by mitochondrial contraction, has emerged as a critical contributor to cardiovascular disease.43–45 Extensive in vivo and in vitro studies have established its pathophysiological role in diverse cardiovascular conditions, including myocardial ischemia–reperfusion injury, anthracycline-induced cardiotoxicity, sepsis-associated cardiac dysfunction, hypertrophic cardiomyopathy, and diabetic cardiomyopathy. The underlying mechanisms involve dysregulation of multiple metabolic pathways, particularly iron homeostasis, lipid peroxidation, and glutathione metabolism.46–49 For instance, iron chelators mitigate anthracycline-induced cardiotoxicity by sequestering free iron, thereby reducing iron-anthracycline complex formation and inhibiting iron-dependent lipid peroxidation, which attenuates free radical-mediated cardiac damage. 50
Ferroptosis is traditionally characterized by its strong association with elevated oxidative stress. 51 Paradoxically, while Bardo is a potent antioxidant that acts primarily through Nrf2 activation, 52 it promoted Nrf2 nuclear translocation and upregulated downstream factors (e.g., HO-1 and NQO1) in our cardiomyocyte model, enhancing cellular antioxidant capacity. These observations challenge the conventional view that ferroptosis is solely driven by oxidative stress.
Several mechanisms may explain this apparent discrepancy. Following Nrf2 activation by Bardo, the ensuing increase in cellular antioxidant capacity may paradoxically lead to a state of reductive stress (RS). 53 Accumulating evidence indicates that both oxidative and reductive stress, when exceeding physiological thresholds, can elevate ROS levels. 54 RS is characterized by abnormal accumulation of reducing equivalents such as NADH, NADPH, and GSH, accompanied by redox imbalance and metabolic dysregulation. 55 Mechanistically, it promotes ROS generation via: (1) over-reduction of the mitochondrial electron transport chain; (2) metabolic redox imbalance; (3) iron-mediated Fenton reactions; and (4) impairment of antioxidant defense systems.56,57 The resulting ROS disrupts intracellular redox homeostasis, initiating a self-perpetuating cycle of thiol oxidation and depletion of cellular reducing capacity. Notably, RS also facilitates intracellular Fe2+ accumulation through multiple pathways, thereby amplifying Fenton reaction-driven damage. NADH/NADPH overaccumulation activates ferric reductases that convert stored ferric iron (Fe3+) to Fe2+ and facilitate its release. 58 Concurrently, RS-associated ROS (e.g., O2•-) can disrupt iron-sulfur cluster proteins, liberating free Fe2 + .59,60 Under these conditions, H2O2 derived from the electron transport chain may react with accumulated Fe2+ to yield highly toxic hydroxyl radicals (·OH), 61 which are known to induce lipid peroxidation, disrupt cellular membranes, and trigger ferroptosis. Thus, we speculate that reductive stress could potentially be involved in Bardo-induced ferroptosis. This dual-stress hypothesis offers a novel perspective on ferroptosis regulation and suggests that maintaining redox homeostasis within a precise physiological range is crucial for cellular survival.
The magnitude of Nrf2 activation induced by Bardo is strongly dose-dependent and may critically influence the extent of RS regulation. Therefore, establishing an appropriate Bardo dosage is essential for balancing therapeutic efficacy and clinical safety. Dosage regimens for Bardo have been established through preclinical and clinical investigations, supported by comprehensive pharmacokinetic and pharmacodynamic data. An initial phase I clinical trial demonstrated that Bardo methyl was well tolerated at doses up to 900 mg/day, achieving a maximum plasma concentration (Cmax) of 24.7 ± 13.3 ng/mL (equivalent to 22.54–75.16 nM). 3 Subsequent pharmacokinetic studies in healthy volunteers revealed that a single 20 mg oral dose produced peak plasma concentrations of 6.09 ± 2.48 ng/mL (7.14–16.95 nM) at 3 h and 10.6 ± 4.8 ng/mL (11.47–30.45 nM) at 6 h post-administration. Under fasting conditions, 60 mg and 80 mg doses yielded Cmax values of 16.7 ± 7.84 ng/mL (17.52–48.53 nM) and 17.2 ± 4.93 ng/mL (24.26–43.76 nM), respectively. 62 In oncology settings, Bardo has been administered at doses ranging from 5 to 1300 mg/day over 28-days cycles, with some treatment durations extending up to 8 months. 63 These collective findings highlight the considerable dose flexibility of Bardo.
In our study, comprehensive dose-response analyses (0–400 nM) revealed significant cardiomyocyte death at 100 nM (55.8% reduction in viability) and 200 nM (45.9% reduction), which were consequently selected for subsequent mechanistic investigation. Although these concentrations exceed typical plasma levels observed after a single clinical dose, the complex pharmacokinetic profile of Bardo—particularly under chronic exposure over months—may promote cumulative toxicity. Moreover, the use of supraphysiological concentrations is a well-established practice in in vitro systems to elicit measurable and reproducible pharmacological responses.64,65 For example, Bardo at 100 nM has been employed in renal podocyte models to demonstrate protection against doxorubicin-induced injury. 66 We acknowledge the use of elevated concentrations as a methodological consideration of our study, while emphasizing that the selected doses remain biologically relevant and appropriate for delineating Bardo-induced toxicity mechanisms in a cellular context.
Although this study offers valuable mechanistic insights, a primary limitation is its reliance on in vitro models, which cannot replicate the physiological complexity of the intact heart. Future studies using animal models are therefore essential to validate the pro-ferroptotic cardiotoxicity of Bardo in vivo. As noted previously, the concentrations of Bardo employed herein exceeded clinical Cmax values to elicit a robust cellular response in vitro, an approach well-precedented in mechanistic pharmacology studies. Furthermore, while our data suggest Bardo may promote ferroptosis via RS, this interpretation remains preliminary and would be strengthened by direct measurement of RS biomarkers, such as the NADPH/NADP+ ratio or the GSH/GSSG ratio. Subsequent research will build upon these findings using primary cardiomyocytes and in vivo models to further elucidate the iron-dependent mechanisms governing Bardo-induced cardiotoxicity.
Conclusion
This study demonstrates that Bardo induces ferroptosis in cardiomyocytes, providing a mechanistic basis that may partially explain the cardiac adverse events observed in clinical trials (Supplemental material).
Supplemental Material
Supplemental material - Bardoxolone Methyl Triggers Ferroptosis in Cardiomyocytes
Supplemental material for Bardoxolone Methyl Triggers Ferroptosis in Cardiomyocytes by Hongmin Li, Mengting Hong, Yikun Liu, Shafiq ur Rahman, Xuejuan Li, Feng Zheng in Human & Experimental Toxicology.
Footnotes
Acknowledgments
We acknowledged funding from the National Key Research and Development Program of China (2020YFC2005002); the National Natural Science Foundation of China (No. 81970642, 81370460, 81700580, 81670668); China Postdoctoral Science Foundation (No.309972); Key Research and Development grant from the Department of Science and Technology, Liaoning Province; Innovative Leading Researcher grant from the Department of Science and Technology, Dalian; and Key Laboratory of Immune, Genetic and Metabolic Kidney Diseases, Dalian. The 973 Program of China (No. 2015CB553800).
Ethical consideration
This study did not involve human participants or animal models, and no ethical approval was required. All experimental procedures were conducted in accordance with institutional and international standards for laboratory research.
Author Contributions
Hongmin Li: Methodology, Investigation, Data curation, Visualization, Writing - original draft. Mengting Hong: Investigation, Data curation. Yikun Liu: Investigation, Software. Shafiq ur Rahman: Data curation, Software. Xuejuan Li: Methodology, Validation, Project administration. Feng Zheng: Conceptualization, Writing-review and editing, Supervision, Resources.
Funding
The fund support comes from the National Key Research and Development Program of China (2020YFC2005002); the National Natural Science Foundation of China (No. 81970642, 81370460, 81700580, 81670668); China Postdoctoral Science Foundation (No.309972); Key Research and Development grant from the Department of Science and Technology, Liaoning Province; Innovative Leading Researcher grant from the Department of Science and Technology, Dalian; and Key Laboratory of Immune, Genetic and Metabolic Kidney Diseases, Dalian. The 973 Program of China (No. 2015CB553800).
Declaration of conflicting interests
The authors declared no potential conflicts of interest with respect to the research, authorship, or publication of this article.
Data Availability Statement
All data generated or analysed during this study are included in this published article. The raw, unprocessed Western blot images are archived and available upon request to the journal or readers.
Supplemental Material
Supplemental material is available online.
References
Supplementary Material
Please find the following supplemental material available below.
For Open Access articles published under a Creative Commons License, all supplemental material carries the same license as the article it is associated with.
For non-Open Access articles published, all supplemental material carries a non-exclusive license, and permission requests for re-use of supplemental material or any part of supplemental material shall be sent directly to the copyright owner as specified in the copyright notice associated with the article.