
Abstract
Objective
To explore the mechanisms by which microplastic toxicity leads to DNA damage in mouse spermatocytes.
Methods
We randomly divided GC-2 cells into a control group and a polystyrene microplastic (PS) group and then evaluated the DNA fragmentation index (DFI) in these cells via a comet assay. Whole-transcriptome sequencing was performed on the basis of DFI results. GO and KEGG enrichment analyses were based on the results of the entire transcriptome sequencing. At the same time, we also performed q-PCR validation on some significantly expressed genes and drew a toxicological network diagram on PS and mouse spermatocytes.
Results
Comet assay results revealed that the intake of PS increased the DFI of mouse spermatocytes. Whole-transcriptome sequencing revealed that 61 circRNAs, 132 lncRNAs, 40 miRNAs, and 140 mRNAs were differentially expressed between the control and PS groups. GO and KEGG analyses revealed some notable enrichment in cellular components, molecular functions, biological processes, and gene expression pathways such as the defense response to viruses, the defense response to symbionts, the RIG-I-like receptor, the NOD-like receptor, and the calcium signaling pathways. Q-PCR and the network analysis revealed that PS affects the DFI of mouse spermatocytes mainly by influencing immune responses.
Conclusion
PS may damage the sperm DNA and increase the DFI by affecting cellular immunity-related pathways and redox pathways such as the RIG-I-like receptor and NOD-like receptor signaling pathways.
Keywords
Introduction
In recent decades, infertility disorders have increased in incidence significantly due to a decline in human male sperm quality. Many scholars have shown that a number of pollutants in the atmosphere can cause a series of inflammatory reactions in the human body, which can lead to a decrease in sperm quality.1,2 The sperm DNA fragmentation index (DFI) is a new and important indicator for evaluating male infertility, and it can be a better and more comprehensive indicator of male fertility than routine semen examination.3,4
Studies have shown that sperm DFI is also closely related to the outcome of fertilization and pregnancy.5–8 However, exposure to air pollutants such as polystyrene microplastics (PS), including through PS ingestion, inhalation, and skin contact, can lead to an increase in sperm DFI. 9 Moreover, other physiological factors, such as genital tract infection, exposure to high-temperature environments, poor living habits, and underlying diseases, lead to an increase in sperm DFI. 10 This study selected mouse spermatocytes because the culture conditions and methods for these cells are relatively mature, making the experiment more feasible and reproducible. Moreover, the genome of mice has been extensively studied, and there are numerous gene knockout and mouse models available, which contribute to a deeper understanding of the role of specific genes in spermatogenesis. More importantly, the conditions for spermatogenesis in mouse testes are extremely similar to those in humans, making this study clinically significant. 11
PS is a genotoxic air pollutant 12 and is produced mainly through the degradation of plastic products. 13 Numerous studies have shown that PS can affect hormone levels in living organisms, inhibit the expression of hormone receptors, induce an inflammatory response in the body, reduce the body’s oxidative stress response, 14 and destroy the blood-testicular barrier.15–20 Presently, PS are ubiquitous in air and water,21–24 which leads to a greater threat to male reproductive ability, 25 and this threat gradually increases with the degradation of more plastics, which requires increased vigilance. This study used 1 μm polystyrene microspheres, which are commonly found in daily life. Studies have shown that 1 μm PS can significantly affect cell activity and have little effect on cell permeability. 26 Using this concentration of PS in this study can ensure experimental results while reducing experimental errors caused by microplastic permeability.
This study mainly adopted whole-transcriptome sequencing technology as a technical means and explored potential regulatory network mechanisms by integrating multiple types of RNA information for a comprehensive analysis. 27 In using this technology, we can better elucidate the effect of PS on sperm DFI at the gene level. 28
This study investigated the effects of PS on male reproductive health via the induction of sperm DNA damage in mouse spermatocytes via PS. This study examined transcriptomic features to understand the potential mechanisms underlying these effects. The main objectives were to assess the DFI through sperm chromatin structure analysis (SCSA), compare differentially expressed circRNAs, lncRNAs, miRNAs, and mRNAs via whole-transcriptome sequencing, and explore key genes and pathways involved in PS-induced DNA damage through enrichment analysis. The goal of this study was to gain valuable insights into the potential reproductive risks associated with PS exposure in males.
Materials and methods
Experimental materials
Reagent preparation
DMEM high glucose medium (Cat No. PM150210, Procell), fetal bovine blood (Cat No. 164210, Procell), KTA3040 comet DNA damage analysis reagent (Cat No. KTA3040, Abbkine), polystyrene microspheres (Cat No. 951688, CAS: 9003-53-6), NaCl powder (Cat No. 7647-14-5, Hengxing reagent), NaOH capsules (Cat No. 82001, Hengxing reagent), absolute ethanol (Cat No. 64-17-5, Hengxing reagent), and TBE electrophoresis buffer (5 ×) (Cat No. PS104S, Yarase Biotech) were used.
Cell line selection and instrument preparation
Mouse spermatocytes (GC-2, BeNa Culture Collection, China), and a CO2 incubator (311, Thermo Company, Germany), comet-based DNA damage analysis kit (KTA3040, Abbkine, USA), inverted microscope (ICX4I, SOPTOP, China), fluorescence microscope (ICX4I, SOPTOP, China), digital display thermostat water bath (HH-4A, China Guohua Instrument Company), electrophoresis instrument power supply/horizontal electrophoresis tank (DYY-6C, Beijing Liuyi Biological Company, China), and Chorus1 ultrapure water instrument (PURELAB, ELGA, UK) were used.
Experimental methods
Cell culture
After the recovery of GC-2 cells, DMEM high-glucose medium supplemented with 10% fetal bovine serum and 1% bispecific antibody was added to a CO2 incubator containing 5% FBS at 37°C for culture. Then, cells were allowed to reach 80%-90% confluence for passage, and 1/4 of the medium was added to the new medium for further culture.
Grouping and modeling
GC-2 cells were randomly divided into two groups: the control group (10% blank serum) and the PS group (10% blank serum +1 μm polystyrene microspheres), and cells were collected for experiments after culture for some time.
Comet assay to detect sperm DNA damage
We used a comet assay to detect the degree of DNA damage caused by PS in GC-2 cells. First, we placed 37°C warm, 29 low-melting-point agarose in a volume of 100 μL and poured it onto a comet slide. Then, we mixed the cell sample with agarose at a ratio of 1:10, immediately transferred 75 μL of the mixture to the top of the agarose-based layer to cover it completely, and protected it in the dark at 4°C for 15 min. Second, we transferred slides to avoid light for 30-60 min and aspirated them from the lysis buffer. Then, we replaced it with a precooled alkaline uncoiling solution and uncoiled the DNA in the dark at 4°C for 30 min. Next, we transferred the glass slide to an electrophoresis tank and applied a voltage of 1 V/cm to the electrophoresis chamber for 10-15 min. Then, we transferred the glass slide from the electrophoresis chamber to a clean container filled with precooled deionized water, soaked it for 2 min, repeated it 3 times, removed it with deionized water, added precooled 70% ethanol, soaked it for 5 min and removed it from the 70% ethanol and air dried it. Finally, 50 μL/well of 1 × PI dye was added, and samples were stained in the dark at room temperature for 10 min and then observed under a fluorescence microscope. Each slide was photographed via a 200x fluorescence microscope, and three nonoverlapping comet images were randomly selected from each group for imaging. Then, CASP was used for analysis. Since spermatocytes are extremely sensitive to temperature, even at 37°C, we are particularly strict in terms of temperature and humidity control during experiments to avoid any impact on the experimental results. In addition, when storing cell samples, we transferred the samples to a refrigerator at −80°C as quickly as possible.
Whole-transcriptome sequencing
Once the total RNA was extracted from the sample, we proceeded to eliminate ribosomal RNA to ensure the highest retention possible of both coding RNA and ncRNA. Next, the obtained RNA undergoes random fragmentation into smaller segments. These fragments served as templates for synthesizing the first strand of cDNA through the use of six random primers. We subsequently incorporated a buffer solution, deoxynucleotide triphosphates (substituting dUTP for dTTP), RNase H enzyme, and DNA polymerase I to facilitate the synthesis of the second strand of complementary DNA (cDNA). Purification of cDNA was conducted via a QiaQuick PCR kit, which was followed by elution with EB buffer. This was done in preparation for end repair, the addition of an adenine base (A), the attachment of sequencing adapters, and degradation by the Uracil N-Glycosylase (UNG) enzyme. Fragment size selection was conducted via agarose gel electrophoresis, and PCR amplification was performed. The percentage of gel used for fragment size selection and PCR product analysis is 1%. 30 The sequencing library was ultimately prepared and sequenced via an Illumina HiSeqTM 4000 platform.
Q-PCR
We washed the cell sample with phosphate buffer saline and added a Trizol reagent to lyse the cells. Then, we added chloroform, vigorously shook and mixed until the aqueous and organic phases were fully in contact, then centrifuged to separate the aqueous phase containing the RNA. After that, we added isopropanol to precipitate RNA, centrifuged again, and collected the RNA precipitate. We washed the RNA precipitate with 75% ethanol to remove impurities, then air dried and dissolved it in an appropriate amount of ultrapure water, and used a nucleic acid protein detector to detect the concentration and purity of RNA. We synthesized high-quality PCR primers from the designed primer sequences and added the reaction solution into a qPCR tube or reaction plate, with at least three parallel wells set for each sample to improve data reproducibility. After that, we used a micropipette to accurately add samples and avoid cross-contamination. At last, we placed the sample qPCR tube into a real-time fluorescence quantitative PCR instrument and set the fluorescence signal acquisition mode to monitor the cumulative amount of PCR products in real time.
Data control
To guarantee the quality of data, filtering the original data before information analysis is imperative, as it can minimize the interference from invalid data during analysis. We utilized FastP (0.23.4, HaploX) to manage the quality of raw reads originating from offline machines and eliminate low-quality data to procure clean reads.
Steps for filtering reads are as follows 1 : discarded reads containing adapter sequences, 2 excluded reads with an N content exceeding 10%, 3 eliminated reads composed entirely of A bases, and 4 excluded reads of poor quality and specifically those in which over half of the bases exhibit a quality score (Q) of 20 or lower.
Differential expression analysis
Once offline data was filtered to yield clean data, reads were aligned to the reference genome via hisat2. Subsequently, string-tie was employed to reconstruct both known and novel transcripts from these alignments. To predict the coding potential of novel transcripts, we utilized software tools such as CPC and CNCI to acquire newly identified lncRNA sequences. The expression levels of mRNAs and lncRNAs in the samples were subsequently and separately analyzed, and an association analysis of the lncRNAs and mRNAs was performed. Furthermore, a structural analysis was conducted on acquired transcripts that encompassed the refinement of gene structures and the examination of alternative splicing patterns, among others.
Genes with differential expression (DEGs) software was used to analyze the differential expression of genes between groups, with two samples analyzed using edgeR. DEGs were defined as genes with an FDR (false discovery rate) ≤0.05 and an absolute fold change ≥2. The genes that were differentially expressed, also known as DEGs, were subsequently subjected to Gene Ontology (GO) and KEGG pathway enrichment studies. After correcting for FDR, the results of hypothesis testing revealed a significant abundance of GO terms or pathways. These findings were statistically significant, as indicated by P ≤ 0.05 and a Q value ≤0.05.
GO enrichment analysis
We transferred differentially expressed genes to the GO database. We subsequently mapped each term and calculated the number of differentially expressed genes for each term to compile a list of genes exhibiting differential expression and possessing a specific GO function. We subsequently conducted the analysis. In addition, we utilized hypergeometric testing to pinpoint GO terms that were notably overrepresented among the differentially expressed genes, relative to the background.
KEGG enrichment analysis
Enrichment analysis of pathway significance employs KEGG pathways as the fundamental unit and utilizes hypergeometric tests to pinpoint those pathways that exhibit substantial enrichment among differentially expressed genes relative to the overall background. The identification of significant enrichment within these pathways permits the elucidation of key biochemical, metabolic, and signal transduction mechanisms associated with differentially expressed genes.
Network toxicology analysis
We obtained the main chemical components of PS from databases such as ToxNet and obtained its SMILES structure from the PubChem database. Then, we searched for these components in databases such as ChEMBL, STITCH, PharmMapper, and DrugBank to identify their targets for mouse spermatocytes. Next, we downloaded PS-related target genes from databases such as Genecards and OMIM, and performed intersection analysis with target genes in mouse spermatocytes to identify potential targets for PS-induced changes in mouse spermatocytes. Then we use the CentiScaPe 2.2 plugin to calculate various centrality indicators in the network for ranking and standardization, and identify core targets. Finally, we used STRING to construct a network of relationships between PS and mouse spermatocyte-related target genes, and visualized their expression using Cytoscape.
Statistical analysis
Data were analyzed via IBM SPSS Statistics software, version 29.0.1.0. Both sample groups demonstrated a normal distribution and homogeneity of variance. A comparison was conducted via a t-test. Statistical significance was established at P < 0.05, which indicated significant differences between the two groups.
Results
Differences in DFI of mouse spermatocytes
Figure 1 displays the comet assay results for mouse spermatocytes in the control group and PS group. Compared with those in the control group, spermatocytes in the PS group presented obvious comet-like tails, which indicated that their DNA was damaged and detached. Compared with control mice, mice exposed to PS had a much greater proportion of tail DNA (20.40% vs 1.26%, P < 0.01) and a much greater proportion of the olive tail moment (19.14% vs. 0.55%, P < 0.01). Comet assay results. (a): Fluorescence images of the control group. There is no tailing in this image, indicating that the integrity of sperm DNA is relatively perfect. (b): Fluorescence images of the PS group. The obvious tail in this figure indicates that DFI has begun to rise. (c): A histogram of the olive tail moment. This figure reflects that the PS group has a higher DFI. (d): A histogram of the percentages of tailDNA. This figure reflects that the PS group has a higher DFI.
These findings indicate that the intake of PS is a reason for the increase in the DFI of mouse spermatocytes.
Whole-transcriptome sequencing results
circRNA sequencing results
When the fold change (FC) reached a threshold of ≥2.0 and the p-value was <0.05, the differential expression of circRNAs was observed between the control and PS groups and involved 61 genes (Figure 2(a)). Specifically, 32 genes were downregulated, whereas 29 genes were upregulated (Figure 2(b)). Characteristics of the antisense lncRNA transcriptome. The transcriptome characteristics of circRNAs are presented through a heatmap (a) and a volcano plot (b), which show the differentially expressed circRNAs. The volcano plot uses red dots to signify upregulated circRNAs, blue dots for downregulated circRNAs, and gray dots for those with insignificant expression changes. Dotted lines denote statistical significance with vertical lines depicting the -log10 transformation of the p value, and the horizontal lines showing the log2 (fold change). GO enrichment analysis (c) of the regulated circRNAs revealed a number of terms within the Biological Process (GO-BP), Cellular Component (GO-CC), and Molecular Function (GO-MF) categories. Additionally, the bubble map from KEGG enrichment analysis (d) of the differentially expressed circRNAs identified the top 20 pathways.
GO analysis revealed that cellular process (GO 0009987), biological regulation (GO 0065007), metabolic process (GO 0008152), regulation of biological process (GO 0050789), and developmental process (GO 0032502) were the five GO terms with the most significant differences in the biological process (BP) category. The two most different GO terms regarding cellular component (CC) were as follows: cellular anatomical entity (GO 0110165) and protein-containing complex (GO 0032991). The two GO terms with the most significant differences in the molecular function (MF) category were binding (GO 0005488) and catalytic activity (GO 0003824) (Figure 2(c)). Transcriptomic and proteomic data were used to analyze the KEGG pathway, and the three enrichment pathways with the most significant differences between the control and experimental groups were lipid and atherosclerosis (ko05417), Yersinia infection (ko05135), and P13K-Akt signaling pathway (ko04151) (Figure 2(d)).
lncRNA sequencing results
When the fold change (FC) reached a threshold of ≥2.0 and the p-value was <0.05, the differential expression of circRNAs was observed between the control and PS groups and involved 132 genes (Figure 3(a)). Specifically, 70 genes were downregulated, whereas 62 genes were upregulated (Figure 3(b)). Characteristics of the antisense lncRNA transcriptome. The image types of the four groups ABCD are consistent with Figure 2. The transcriptome characteristics of lncRNAs are presented through A and B, which show differentially expressed lncRNAs. The volcano plot uses red dots to signify upregulated lncRNAs, blue dots for downregulated lncRNAs, and gray dots for those with insignificant expression changes. Dotted lines denote statistical significance, with the vertical lines depicting the -log10 transformation of the p value and the horizontal lines showing the log2 (fold change). The (c) revealed a number of terms of lncRNAs within the GO-BP, GO-CC, and GO-MF categories. Additionally, the (d) identified the top 20 pathways of differentially expressed lncRNAs.
GO analysis has revealed that the cellular process (GO 0009987), biological regulation (GO 0065007), regulation of biological process (GO 0050789), and metabolic process (GO 0008152) were the four GO terms with the most significant differences in the BP category. The two most different GO terms regarding the CC were as follows: cellular anatomical entity (GO 0110165) and protein-containing complex (GO 0032991). The two GO terms with the most significant differences in the MF category were binding (GO 0005488) and catalytic activity (GO 0003824). (Figure 3(c)). Transcriptomic and proteomic data were used to analyze KEGG pathways, and the two enrichment pathways with the most significant differences between the control and experimental groups were as follows: Renin secretion (ko04924), the cGMP-PKG signaling pathway (ko04022), and pentose and glucuronate interconversions (ko00040) (Figure 3(d)).
miRNA sequencing results
When the fold change (FC) reached a threshold of ≥2.0 and the p-value was <0.05, the differential expression of circRNAs was observed between the control and PS groups and involved 40 genes (Figure 4(a)). Specifically, 13 genes were downregulated, whereas 27 genes were upregulated (Figure 4(b)). Characteristics of the miRNA transcriptome. The image types of the four groups ABCD are consistent with Figure 2. The transcriptome characteristics of the miRNAs are presented through (a) and (b), which show the differentially expressed miRNAs. The volcano plot uses red dots to signify upregulated miRNAs, blue dots for downregulated miRNAs, and gray dots for those whose expression did not significantly change. The dotted lines denote statistical significance with the vertical lines depicting the −log10 transformation of the p value and the horizontal lines showing the log2 (fold change). The (c) revealed a number of terms of miRNAs within the GO-BP, GO-CC, and GO-MF categories. Additionally, the (d) identified the top 20 pathways of differentially expressed miRNAs.
GO analysis revealed that cellular process (GO 0009987), biological regulation (GO 0065007), regulation of biological process (GO 0050789), and metabolic process (GO 0008152) were the four GO terms with the most significant differences in the BP category. The two most different GO terms regarding the cellular CC were: cellular anatomical entity (GO 0110165), and protein-containing complex (GO 0032991). The two GO terms with the most significant differences in the MF category were binding (GO 0005488) and catalytic activity (GO 0003824) (Figure 4(c)). Transcriptomic and proteomic data were used to analyze KEGG pathways, and the three enrichment pathways with the most significant differences between the control and experimental groups were as follows: Olfactory transduction (ko04740), Neuroactive ligand-receptor interaction (ko04080), and Cytokine-cytokine receptor interaction (ko04060) (Figure 4(d)).
mRNA sequencing results
When the fold change (FC) reached a threshold of ≥2.0 and the p-value was <0.05, the differential expression of circRNAs was observed between the control and PS groups and involved 140 genes (Figure 5(a)). Specifically, 95 genes were downregulated, whereas 45 genes were upregulated (Figure 5(b)). Characteristics of the mRNA transcriptome. The image types of the four groups ABCD are consistent with Figure 2. The transcriptome characteristics of mRNAs are presented through (a) and (b), which show the differentially expressed mRNAs. The volcano plot uses red dots to signify upregulated mRNAs, blue dots for downregulated mRNAs, and gray dots for those with insignificant expression changes. The dotted lines denote statistical significance with the vertical lines depicting the −log10 transformation of the p value and the horizontal lines showing the log2 (fold change). The (c) revealed a number of terms of mRNAs within the GO-BP, GO-CC, and GO-MF categories. Additionally, the (d) identified the top 20 pathways of differentially expressed mRNAs.
GO analysis revealed that cellular process (GO 0009987), biological regulation (GO 0065007), regulation of biological process (GO 0050789), and response to stimulus (GO 0050896) were the four GO terms with the most significant differences in the BP category. The two most different GO terms regarding the CC were cellular anatomical entity (GO 0110165) and protein-containing complex (GO 0032991). The three GO terms with the most significant differences in the MF category were binding (GO 0005488), catalytic activity (GO 0003824), and molecular function regulator (GO 0098772) (Figure 5(c)). Transcriptomic and proteomic data were used to analyze the KEGG pathway, and the three enrichment pathways with the most significant differences between the control and experimental groups were Influenza A (ko05164), Hepatitis C (ko05160), and Measles (ko05162) (Figure 5(d)).
circRNA/lncRNA-miRNA-mRNA network construction
We plotted the relationships between four types of RNA into two network structure diagrams, and the specific images and RNA correspondence tables are as follows.
lncRNA-miRNA-mRNA network construction
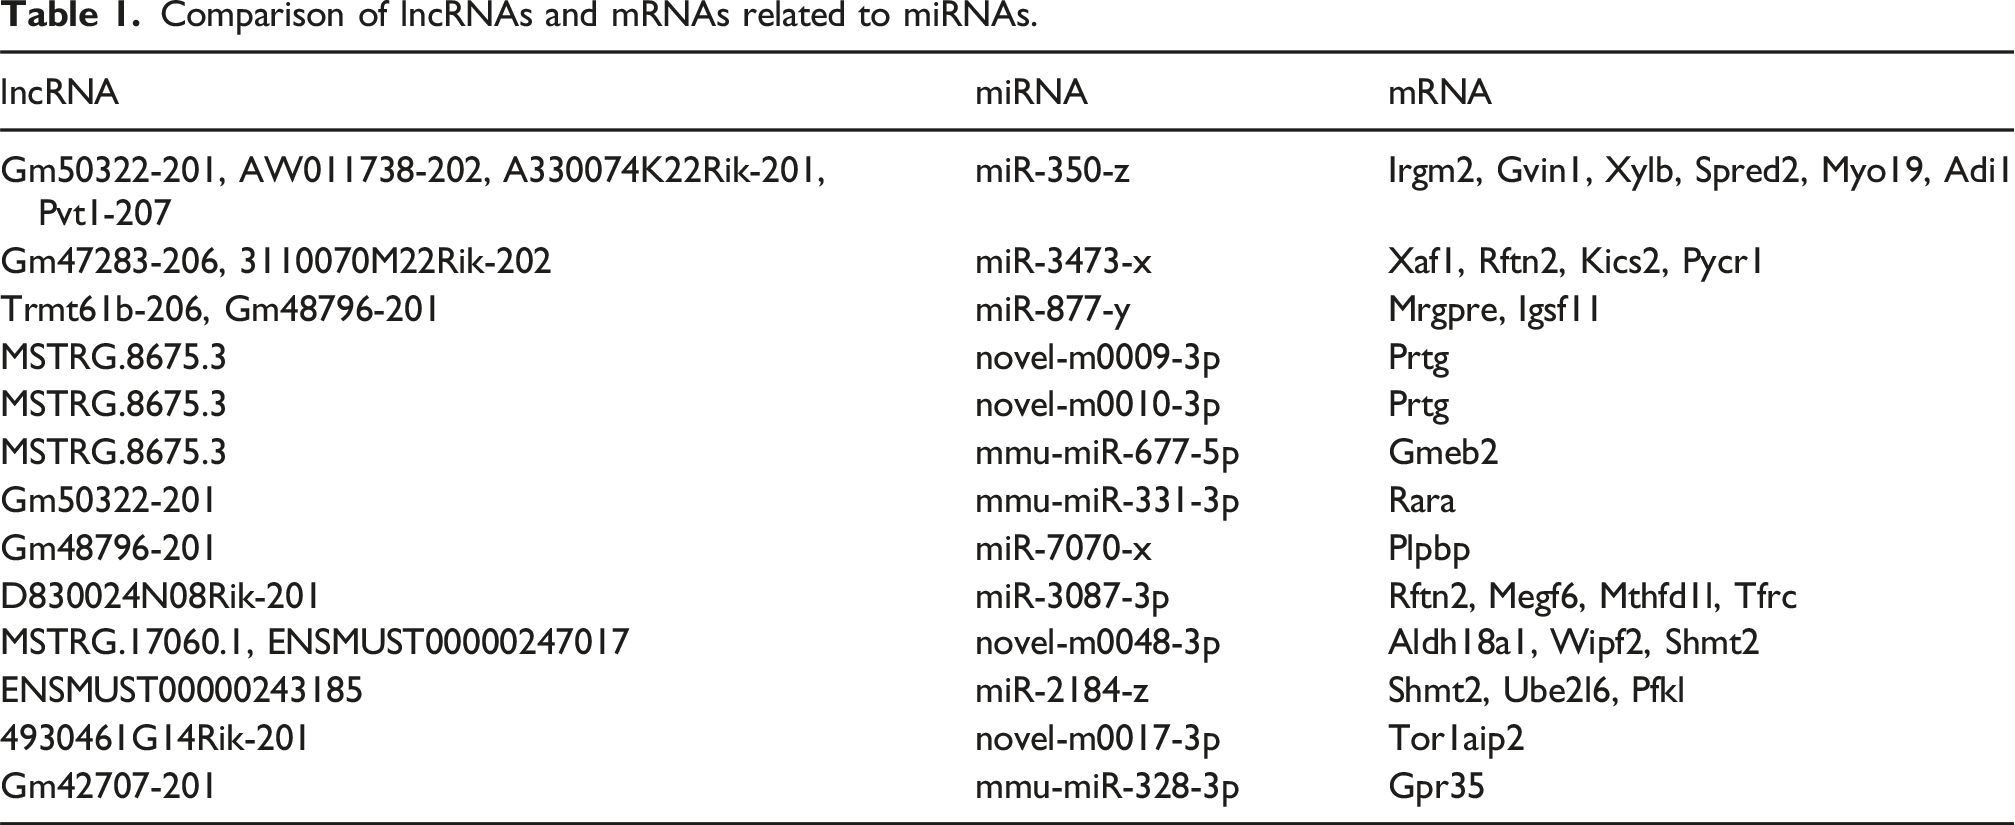
According to the analysis of the lncRNA-miRNA-mRNA network, the lncRNAs with the greatest expression differences between the control group and the PS group were MSTRG.8675.3, Gm50322-201, D830024N08Rik-201, and Gm48796-201. The miRNAs with the greatest expression differences are miR-350-z, miR-3473-x, and miR-877-years. The mRNAs with the greatest expression differences are Prtg, Shmt2, Plpbp, and Rftn2. Among them, the most significantly expressed pathway was Gm50322-201-miR350-z-Rftn2. Importantly, most of the differentially expressed genes and their corresponding pathways mentioned above are related to cellular immune pathways. (Figures 6, and 7). lncRNA-miRNA-mRNA network diagram. The diagram illustrates the interplay of regulation among lncRNA, miRNA, and mRNA. The red boxes represent lncRNAs, the blue arrows represent mRNAs, the yellow dots represent miRNAs, and the lines connecting the various shapes represent the mutual regulatory relationships between those different types of RNAs. The larger the size of the shape, the higher the expression level of the RNA. circRNA-miRNA-mRNA network diagram. The diagram illustrates the regulatory interactions among circRNA, miRNA, and mRNA. Red boxes represent circRNAs, yellow dots represent miRNAs, blue arrows represent mRNAs, and lines connecting the various shapes represent the mutual regulatory relationships between different types of RNAs. The larger the size of the shape, the higher the expression level of the RNA.

circRNA-miRNA-mRNA network construction
According to the analysis of the circRNA-miRNA-mRNA network, the circRNAs with the greatest expression differences between the control group and the PS group are circ_006739, circ_000348, and circ_003384. The miRNAs with the greatest expression differences are miR-2184-z, miR-331-3p, and miR-181-years. The mRNAs with the greatest expression differences are Atp1a2, Rimklb, Fez1, and Fzd9. Overall, the most significantly expressed pathway is circ_003384- miR-181-years- Atp1a2. Importantly, most of the differentially expressed genes and their corresponding pathways previously mentioned are related to cellular immune pathways.
Q-PCR results
We selected several RNAs with significant differences in expression between the two sample groups for q-PCR detection. The results are shown in Figure 8, and these RNAs indeed have expression differences, which are likely to cause an increase in DFI. q-PCR results. A: The expression results of three RNAs with significant differences in lncRNA expression, namely MSTRG.8675.3, GM48796-201, and D830024N08Rik-201, in the control group and PS group, showed that the expression of MSTRG.8675.3 and D830024N08Rik-201 in the PS group was higher than that in the control group, while the expression of GM48796-201 in the control group was higher than that in the PS group. B: The circ_003384 gene, which showed significant expression differences in circRNA, was upregulated in the PS group compared to the control group. C: The miR-350-Z, which exhibits significant differential expression in miRNA, was higher in the control group compared to the PS group in the image. D: The Rftn2, which has significant differences in mRNA expression, was upregulated in the PS group compared to the control group.
Network toxicology results
We have created a toxicological network diagram on the relationship between PS and mouse spermatocytes by screening relevant targets, as shown in Figure 9. The results showed that PS can cause damage to mouse spermatocytes and also affect their gene transcription, further indicating that PS can induce gene damage in mouse spermatocytes. Network toxicology results. This is the Protein-protein interaction (PPI) chart we created; each node in the graph represents a protein, and the edges represent the interaction between two proteins. The thickness of the edges can indicate the strength or confidence of the interaction. The thicker the edges, the stronger the interaction between the nodes. The image shows that there are some significantly correlated targets between PS and mouse spermatocytes. These targets, such as BCL2 and CYCS, are well known for their close association with cell apoptosis, further indicating that PS can indeed cause damage to mouse spermatocytes through multiple pathways. Other targets such as AKT1, are closely related to intracellular gene transcription and expression signaling pathways, which is consistent with the previous enrichment results, indicating that PS can induce gene damage in mouse spermatocytes.
Discussion
Several scientific studies have shown that PS can have adverse effects on living organisms, these effects include disrupting hormone levels, inhibiting the expression of hormone receptors, inducing inflammation in the body, reducing the oxidative stress response, and damaging the integrity of the blood-testicular barrier. However, the mechanism by which PS reduces biological reproductive capacity through increasing the rate of DNA fragmentation remains understudied. Exposure to high concentrations of PS for a long period exposes organisms to reproductive toxicity, such as gene expression disruptions,31,32 which leads to genome instability in biological germ cells, and when the cell’s DNA has been damaged, it promotes the generation of genetic variation in offspring. 33
The above significant differences in GO analysis are related to the biological mechanism of cell resistance to viruses, which indicates that PS affects the DNA fragmentation index of cells mainly by affecting their resistance to viruses, and the mechanism may be related to pathways strongly correlated with the main enrichment results of KEGG, for example, the RIG-I-like receptor and the NOD-like receptor signaling pathways.
RIG-I-like receptors may play an important role in antiviral innate immunity, and they can recognize viral nucleic acid components and are mostly localized to the structure of the intracellular membrane.34,35 After a virus infects the body, it invades the cells and releases nucleic acid substances in the internal acidic environment. These substances are recognized by RIG-I-like receptors. 36 Therefore, in the antiviral signaling pathway of the RIG-I-like receptor, the RIG-I-like receptor first recognizes the viral component, induces the production of type 1 interferon, and then relies on its protein structure to transmit the viral signal downward.37,38 In the process of virus internalization, the viral nucleic acid material in the cytoplasm is recognized by TLR receptors and other factors, which induce the activation of antiviral signaling pathways. Various signaling pathways cooperate in the cell, which constitutes an innate immune signaling network against viruses. Damage to the RIG-I-like receptor signaling pathway leads to a decrease in cellular immunity to the virus, and the rate of DNA destruction by viruses also increases, which can increase the rate of DNA fragmentation in cells. 39
A variety of cellular processes, such as proliferation, differentiation, transcription, cell metabolism, and cell death, are regulated by intracellular calcium signaling.40,41 Moreover, changes in calcium ions can also activate NL‐RP3 inflammasomes. 42 The NL-RP3 inflammasome is a NOD-like receptor that is an important component of innate immunity, 43 can respond to a variety of stimuli, such as invading pathogens, and plays an important role in the body’s immune response. 44 Damage to the NOD signaling pathway causes synchronous changes in the calcium ion pathway, 45 which is consistent with the results of the relevant pathway enrichment analysis in this study. This finding further illustrates that PS can damage the integrity of cellular DNA by damaging the immune network of cellular pathogens and results in an increase in the spermatocyte DNA fragmentation index. Regarding the above inferences, there are no research results in related fields that hold other views.
Moreover, disruption of the cellular immune system can also lead to an increased risk of cellular carcinogenesis, 46 which further results in an increase in the DFI. Network analysis confirmed that PS affects the expression of genes related to cellular carcinogenesis, such as Rftn2 and Prtg, 47 which are closely related to genetic carcinogenesis and strongly differ in expression. Studies have shown that the expression of these cancer-related genes can lead to an increase in sperm DFI,48,49 but the mechanism underlying this change is not yet clear.
In summary, PS can cause DNA damage in spermatocytes, which also leads to an increase in their DNA fragmentation index. The mechanism may be related to damage to the cellular immune network caused by the PS, which can also invade cells via viruses or cause autogenetic disorders leading to DNA strand breaks.
Conclusion
Comparison of lncRNAs and mRNAs related to miRNAs.
Comparison of circRNAs and mRNAs related to miRNAs.

Footnotes
Acknowledgment
We sincerely appreciate the financial support provided by Henan University of Traditional Chinese Medicine and the equipment support provided by Henan Provincial Hospital of Traditional Chinese Medicine. In addition, we sincerely thank all the participants who voluntarily participated in the on-site experiment. We also thank all the experts who generously shared their insights and professional knowledge during the research discussion.
Ethical considerations
This article dose not contain any studies with human or animal participants.
Informed Consent
This article does not contain any studies with human or animal participants. This study used purchased mouse spermatocytes throughout the entire process.
Author contributions
Chenming Zhang is responsible for designing experiments and conducting data processing, Zhelin Chen is responsible for cell culture and data analysis, Chenmin Zhang and Zhelin Chen jointly wrote the initial draft of the article and participated in subsequent discussions and revisions. Zixue Sun and Jianshe Chen provided experimental equipment and technical support for this experiment, and supervised and led the progress of this study. Wenbang Liu and Sicheng Ma provided insightful revision suggestions for the initial draft of the article and participated in the experiment. Yitong Xue, Qixin Pang, and Hangsai Chen participated in the data collection and subsequent processing of the relevant experiments.
Funding
The author(s) disclosed receipt of the following financial support for the research, authorship, and/or publication of this article: This work was supported by the National Natural Science Foundation of China (No. 82274536 and No. 82474522), the China Postdoctoral Science Foundation (No. 2023T160201 and No. 2022M721068), the Key Scientific Research Project of Colleges and Universities in Henan Province (No. 23A360005), Henan Province Undergraduate Young Backbone Teacher Training Program (No. 2024GGJS067), Henan Province Traditional Chinese Medicine Science Popularization Talent Project, Henan Province Higher Education Student Innovation Training Program (No. 202510471027 and No. 202510471021), Research and Practice Project on Education and Teaching Reform at Henan University of Traditional Chinese Medicine (No. 2024JX89).
Declaration of conflicting interests
The author(s) declared no potential conflicts of interest with respect to the research, authorship, and/or publication of this article.
Data Availability Statement
You can view the raw transcriptome data of this article in the public database SRA(NCBI), with data item number: PRJNA1230696.