
Abstract
The role of sodium caprate (C10) in enhancing drug absorption is well established; however, little information is available on its role as an anticancer drug. This study aimed to evaluate the anticancer effect of C10 in gastric cancer cells. The mechanism of cytotoxicity of C10 was evaluated by western blotting following treatment of the gastric cancer cells with various concentrations of C10. C10 cytotoxicity was measured via MTS (3-(4, 5-dimethylthiazol-2-yl)-5-(3-carboxymethoxyphenyl)-2-(4-sulfophenyl)-2H tetrazolium), lactate dehydrogenase (LDH), cAMP, and ATP assays. Gastric cancer cells were observed by electron microscopy following treatment with C10. Then, xenograft mice that were inoculated with gastric cancer cells were treated with C10 for 4 weeks, after which the changes in tumor size were measured. C10 triggered apoptosis in the gastric cancer cells through the mitochondrial pathway at concentrations of more than 0.2 mM. However, 15 mM of C10 induced necrosis in gastric cancer cells by causing cellular swelling and the formation of holes in the cell membrane. Levels of cAMP and ATP decreased significantly following exposure to 15 mM C10 for 1 h. Additionally, the size of the xenograft tumors was significantly reduced by 24% after 4 weeks of C10 treatment (p < 0.05). This study indicates that C10 induces apoptosis and necrosis in a concentration-dependent manner and has clear anticancer effects on gastric cancer cells.
Introduction
The peritumoral injection of anticancer agents has been studied for suppressing tumor growth.1–4 In one study, 250 mg of 5-fluorouracil (5-FU), an anticancer agent, was locally injected at the tumor margins for 4 weeks at 1-week intervals. The results demonstrated that the tumor size was reduced by 30–40%, and no distinct side effects were observed. 4 However, there are several limitations to the topical administration of anticancer drugs. It is difficult to continually inject high concentrations of the drug in the desired area, and in the case of vesicant drugs, it is not feasible to inject the drug into the target tissue. Additionally, if the tumor is large, it is difficult to treat the entire tumor by topical injection alone. 5 Therefore, novel anticancer drugs and drugs that enhance the tissue permeability of other drugs need to be discovered for local chemotherapy.
Sodium caprate (C10) is a medium-chain fatty acid (MCFA) that is present in natural products, including coconut and palm kernel oils and milk. C10 promotes the permeability of hydrophilic compounds in Caco-2 cells by redistributing the cytoskeleton and opening the tight junctions via the inositol triphosphate and diacylglycerol signal transduction pathways, which are mediated by phospholipase C (PLC). 6 Therefore, C10 can enhance the absorption of drugs by modifying tight junction proteins, which increases the delivery of drugs with low oral availability. 7 Furthermore, C10 has anti-proliferative effects in human breast, colorectal, and skin cancer cells by upregulating genes involved in apoptosis and downregulating genes that regulate the cell cycle. 8 However, a relatively high concentration of the drug is necessary for use. A previous study demonstrated that 3 mM caprylic acid failed to inhibit the migration and invasion of bladder cancer cells. 9
Information on the anticancer effects of C10 is scarce. Therefore, this study aimed to investigate the anticancer mechanism of C10 on gastric cancer cells using in vitro and in vivo studies.
Materials and methods
Animals
All animal experiments were approved by the Ethics Committee for Animal Experiments of Kangbuk Samsung Hospital, Sungkyunkwan University School of Medicine, and conducted according to the Animal Experiment Guidelines of this university. Five-week-old male nude mice (Crj: BALB/c-nu/nu) were obtained from Orient Bio (Seongnam, Gyeonggi, Korea) and acclimated for 1 week under normal laboratory conditions. A single-cell suspension containing 5 × 10⁶ cells/100 μL of phosphate-buffered saline (PBS) was subcutaneously injected into the right side of the dorsal surface of the mice. The growth of the xenograft tumors was observed for 4 weeks.
Materials
C10 was purchased from Sigma-Aldrich (St Louis, MO, USA). All primary antibodies were purchased from Cell Signaling Technology (Danvers, MA, USA). All other chemicals and proteins were purchased from Sigma-Aldrich unless otherwise indicated.
Cell culture
Human gastric cancer cells (NCI-N87 and AGS) were obtained from the Korean Cell Line Bank (Seoul, Korea) and cultured in Dulbecco’s modified Eagle medium (DMEM; Thermo Fisher Scientific, Rockford, IL, USA) supplemented with 10% fetal bovine serum (FBS), 1 mM sodium pyruvate, and 2 mM L-glutamine at 37°C in an atmosphere of 5% CO2.
MTS assay
MTS (3-(4, 5-dimethylthiazol-2-yl)-5-(3-carboxymethoxyphenyl)-2-(4-sulfophenyl)-2H tetrazolium) assay was performed to determine the cytotoxicity of C10 to gastric cancer cells. NCI-N87 cells were seeded into 96-well plates at a density of 5 × 10⁴ cells/well and cultured at 37°C for 24 h. The cells were subsequently incubated with DMEM containing various concentrations of C10 for 1, 5, and 10 h. After washing with PBS, the cells were incubated with fresh DMEM for 48 h. Then, 20 μL of CellTiter 96 Aqueous One Reagent (Promega Corp, Madison, WI, USA) was added, and the cells were incubated at 37°C for 1 h. The absorbance of the samples was detected at a wavelength of 490 nm using a microplate reader (Model 680; Bio-Rad, Richmond, CA, USA). For each assay, eight replicates were performed.
Western blotting
Cell extracts were lysed with RIPA buffer (25 mM Tris-HCl (pH 7.6), 150 mM NaCl, 1% NP-40, 1% sodium deoxycholate, and 0.1% SDS) in the presence of Halt Protease and Phosphatase Inhibitor Cocktail (Thermo Fisher Scientific). Samples were subsequently centrifuged at 13,000 g for 20 min to pellet the cell debris. The concentrations of the proteins in the cell lysates were determined using a Pierce BCA Protein Assay Kit (Thermo Fisher Scientific), and bovine serum albumin (BSA) was used as the standard. The proteins were resolved by electrophoresis on Bolt 4–12% Bis-Tris Plus gels (Thermo Fisher Scientific) and transferred onto polyvinylidene fluoride (PVDF) membranes (Thermo Fisher Scientific). The membranes were then blocked with Pierce Clear Milk Blocking Buffer (Thermo Fisher Scientific) for 1 h and subsequently incubated overnight at 4°C with the primary antibodies against PARP, cytochrome C, Bcl-2, BAK, SQSTM1, LC3 A/B, and β-actin. HRP-conjugated anti-rabbit or anti-mouse IgG antibodies (Santa Cruz Biotechnology, Dallas, TX, USA) were used as secondary antibodies. Immune complexes were detected using an ECL Prime Western Blotting Detection Reagent system (Amersham, Piscataway, NJ, USA).
Lactate dehydrogenase assay
Cytotoxicity was measured by the amount of LDH released due to the damage to the cell membrane. The released LDH was quantified with an LDH assay kit (EZ-LDH1000; DoGenBio, Seoul, Korea) according to the manufacturer’s protocol. Briefly, 5 × 10⁴ cells/well were seeded into 96-well polystyrene plates and incubated at 37°C for 24 h. C10 and the LDH substrate were added to each well, followed by incubation at 37°C for an additional 10 min. The plate was centrifuged at 600 g for 5 min. The supernatant (10 μL) was transferred from the well of the culture plate to the assay plate. The LDH Reaction Mixture reagent (100 μL) was subsequently added to the supernatant in each well of the assay plate in rapid succession. After 30 min of reaction, the absorbance of the samples was measured at a wavelength of 450 nm using a microplate reader (Model 680; Bio-Rad).
cAMP and ATP assays
NCI-N87 cells were incubated with C10 and subsequently centrifuged at 1000 g for 10 min. The supernatants were subsequently aspirated and treated with 1 mL of 0.1 M HCl at 37°C for 10 min. The lysed cells were centrifuged at 1300 g for 10 min. Supernatants were collected to measure levels of cAMP using a direct immunoassay kit according to the manufacturer’s instructions. The intracellular ATP content was measured using a fluorometric ATP assay kit (Abcam, Cambridge, MA, USA) according to the manufacturer’s protocol. Briefly, the cells were incubated for 24 h at 37°C, lysed in 100 μL of the ATP assay buffer, and centrifuged. An aliquot of the supernatant was subsequently mixed with the ATP Probe, Converter, and Developer Mix. The fluorescence intensity of the samples was measured using a microplate reader (Tecan Spark; Tecan, Männedorf, Switzerland).
Scanning electron microscopy and transmission electron microscopy
For sample preparation, the C10-treated NCI-N87 cells were fixed with 3.2% glutaraldehyde followed by buffering with 0.1 mol/l sodium phosphate (pH 7.4) at 4°C for 1 h. After washing once with PBS, cells were post-fixed with 1% OsO4 at 4°C for 1 h, washed again with PBS, and rapidly dehydrated using ethyl alcohol. Cells were mounted on an aluminum stub and coated with a thin gold film for 2 min. Samples were then observed and photographed using a TESCAN Vega TS 5130 SB scanning electron microscope (Brno, Czech Republic).
Evaluation of in-vivo tumor suppression
The tumors reached a size of approximately 300–500 mm3 4 weeks after inoculation with the NCI-N87 cells. C10 was subcutaneously administrated into the normal tissue precisely adjacent to the tumor mass. Based on the protocols used in preliminary experiments, C10 was administered once at a dose of 500 mM, and tumor growth was observed for a month. The dimensions of the tumor were measured every week for 1 month using a pair of Vernier calipers, and the tumor size was calculated using the following equation: tumor size = 0.5 × largest diameter × (smallest diameter). 2
Statistical analyses
All data are presented as the means ± standard deviations. All statistical analyses were performed using the IBM SPSS Statistics software, version 24.0 (Armonk, NY, USA). The data were assessed using paired t-tests and one-way analysis of variance (ANOVA). The difference was statistically significant when p < 0.05.
Results
Assessment of in vitro cytotoxicity
We evaluated the effects of C10 on NCI-N87 and AGS cells at various concentrations. An MTS assay was performed for measuring the death rate of the cancer cells following treatment with C10. Tumor cell viability of N87 cells was not reduced following treatment with 5 mM C10 for 1, 5, and 10 h (82.44 ± 7.28, 77.20 ± 7.51, and 69.09 ± 4.43%, respectively) or 10 mM C10 for 1, 5, and 10 h (79.48 ± 4.82, 73.94 ± 3.88, and 67.88 ± 7.51%, respectively) (Figure 1(a)). However, the cell viability of N87 cells decreased significantly following exposure to 15 mM C10 (38.08 ± 11.62%) for 1 h. A few of the cancer cells survived after exposure to 15 mM C10 for 5 and 10 h (0.06 ± 0.52 and 0.09 ± 0.39%, respectively). The viability of cells that were treated with 15 mM C10 for 1, 5, and 10 h was significantly lower than that of cells treated with 5 mM or 10 mM C10 (p < .01). In the case of the AGS cells, there was no change in the tumor cell viability to 5 mM C10 for 1, 5, and 10 h or 10 mM C10 for 1 h. However, it decreased significantly with the treatment of 10 mM C10 for 5 and 10 h and 15 mM C10 for 1, 5, and 10 h, resulting in higher toxicity to AGS cells than to N87 cells (Figure 1(b)). In summary, at least 15 mM C10 is required to induce cancer cell death, and the death induction time is so rapid that an hour is sufficient. Viability of gastric cancer cells (N87 & AGS) treated with 5, 10, and 15 mM of C10. Cell viability of N87 (a) and AGS (b) was determined using the MTS assay after 1, 5, and 10 h of treatment. Data are presented as the mean ± standard deviation. The differences between the treatment groups were statistically significant and are denoted as **p < .01.
Apoptosis and autophagy
Mechanisms of cancer cell death were evaluated by pretreating cells with 1, 10, and 100 μM of C10 for 12 h. The results of western blotting revealed no significant changes in the expression of the major regulators of apoptosis, namely, PARP, pro-caspase 3, and cytochrome C. These findings confirmed that apoptosis was not induced by treatment with C10 less than 100 μM for 12 h. However, higher concentrations of C10 could induce apoptosis. Application of C10 at 0.2, 0.4, and 0.6 mM for 12 h increased the expression levels of cytochrome C and BAK and decreased the expression levels of Bcl-2 and PARP (Figure 2(a)). The relationship between C10 and autophagy of the cancer cells was subsequently investigated by western blotting. After treatment with C10 at concentrations of 0.2, 0.4, and 0.6 mM, the expression levels of the major autophagy markers LC3 A/B and SQSTM1 strongly increased (Figure 2(b)). Taken together, C10 caused cancer cell death by inducing apoptosis and autophagy at concentrations of more than 0.2 mM. Expression of proteins related to apoptosis and autophagy in gastric cancer cells treated with at 0.2, 0.4, and 0.6 mM of C10. The expression of proteins related to apoptosis (a) and autophagy (b) was measured after 12 h of treatment. The expression levels of the proteins were determined by western blotting.
Necrosis and LDH, cAMP, and ATP assay
Apoptosis and autophagy take at least 24 h to induce cell death, so it was difficult to explain how cancer cell death was induced within 1 h in the MTS results of this study. Therefore, LDH, cAMP, and ATP assays were performed to investigate the mechanism of necrosis that can cause cell death in a short time. The toxicity of C10 to the NCI-N87 cells was determined by the amount of LDH released (Figure 3). The amount of LDH released increased significantly following treatment with 15 mM C10 just for 10 min (p < .01). The cAMP and ATP assays were then performed for determining the association between intracellular cAMP and ATP levels and the occurrence of necrosis. The results demonstrated that intracellular cAMP levels decreased significantly (9.38 ± 0.43 nM) following treatment with 15 mM C10 for 1 h (p < .01) (Figure 4(a)), and the ATP levels also decreased significantly (0.22 ± 0.01 nM) following exposure to 15 mM C10 for 20 min (p < .01) (Figure 4(b)). The cytotoxic effect of C10 in gastric cancer cells following treatment with C10 at 5, 10, 15, and 20 mM. Following incubation for 10 min, the death rate of cancer cells (LDH release) was determined using the LDH assay. Data are presented as the mean ± standard deviation. Statistical significance is denoted as **p < .01. Levels of cAMP and ATP in the gastric cancer cells following treatment with C10 at high concentrations (10, 15, and 20 mM). The intracellular cAMP (a) and ATP levels decreased significantly following treatment with 15 mM C10. Data are presented as the mean ± standard deviation. Statistical significance is denoted as **p < 0.01.

Scanning electron microscopy and transmission electron microscopy analysis
To investigate the mechanism by which C10 induced necrosis in gastric cancer cells at high concentrations, cell membranes were observed with a scanning electron microscope and a transmission electron microscope following treatment with 15 mM C10 for 10 min. Untreated gastric cancer cells showed the presence of contours and microvilli in the cell membrane (Figure 5(a)), while those treated with C10 had convoluted membranes covered by debris (Figure 5(b)). In addition, treatment with C10 induced the formation of large lesions in the membranes of the target cells. Most commonly, a large cavity was observed in the cell membrane (Figure 5(c)); numerous smaller cavities were also observed (Figure 5(d)). When the swelling of C10-treated cells was compared to that of control cells, cell and nuclear membranes ruptured after treatment with 15 mM C10 for 10 min (Figure 5(e)) and the number of phagosomes increased. After 1 h of treatment, all organelles in the cytosol underwent destruction (Figure 5(f)). Images of untreated and C10-treated gastric cancer cells were obtained by scanning electron microscopy (SEM) and transmission electron microscopy (TEM). (a) SEM image of the control cells (magnification 5K×). (b) SEM image of the C10-treated cells following exposure to C10 for 10 min (magnification 5K×) showing the initiation of the loss of microvilli (white arrow) and loosening of tight junctions. (c) SEM image of C10-treated cells following exposure to C10 for 1 h (magnification 5K×) showing large and tiny cavities (white arrow), blebs in the plasma membranes, and scattered cellular debris. (d) TEM image of the control cells (magnification 8K×). (e) TEM image of C10-treated cells (magnification 8K×) showing the rupture of the cell membrane (white arrow) and nuclear membrane (black arrow), and the increased number of phagosomes (white, dotted arrow) and multivesicular bodies (black, dotted arrow). (f) TEM image of C10-treated cells (magnification 8K×) showing the extensive destruction of organelles in the cytosol.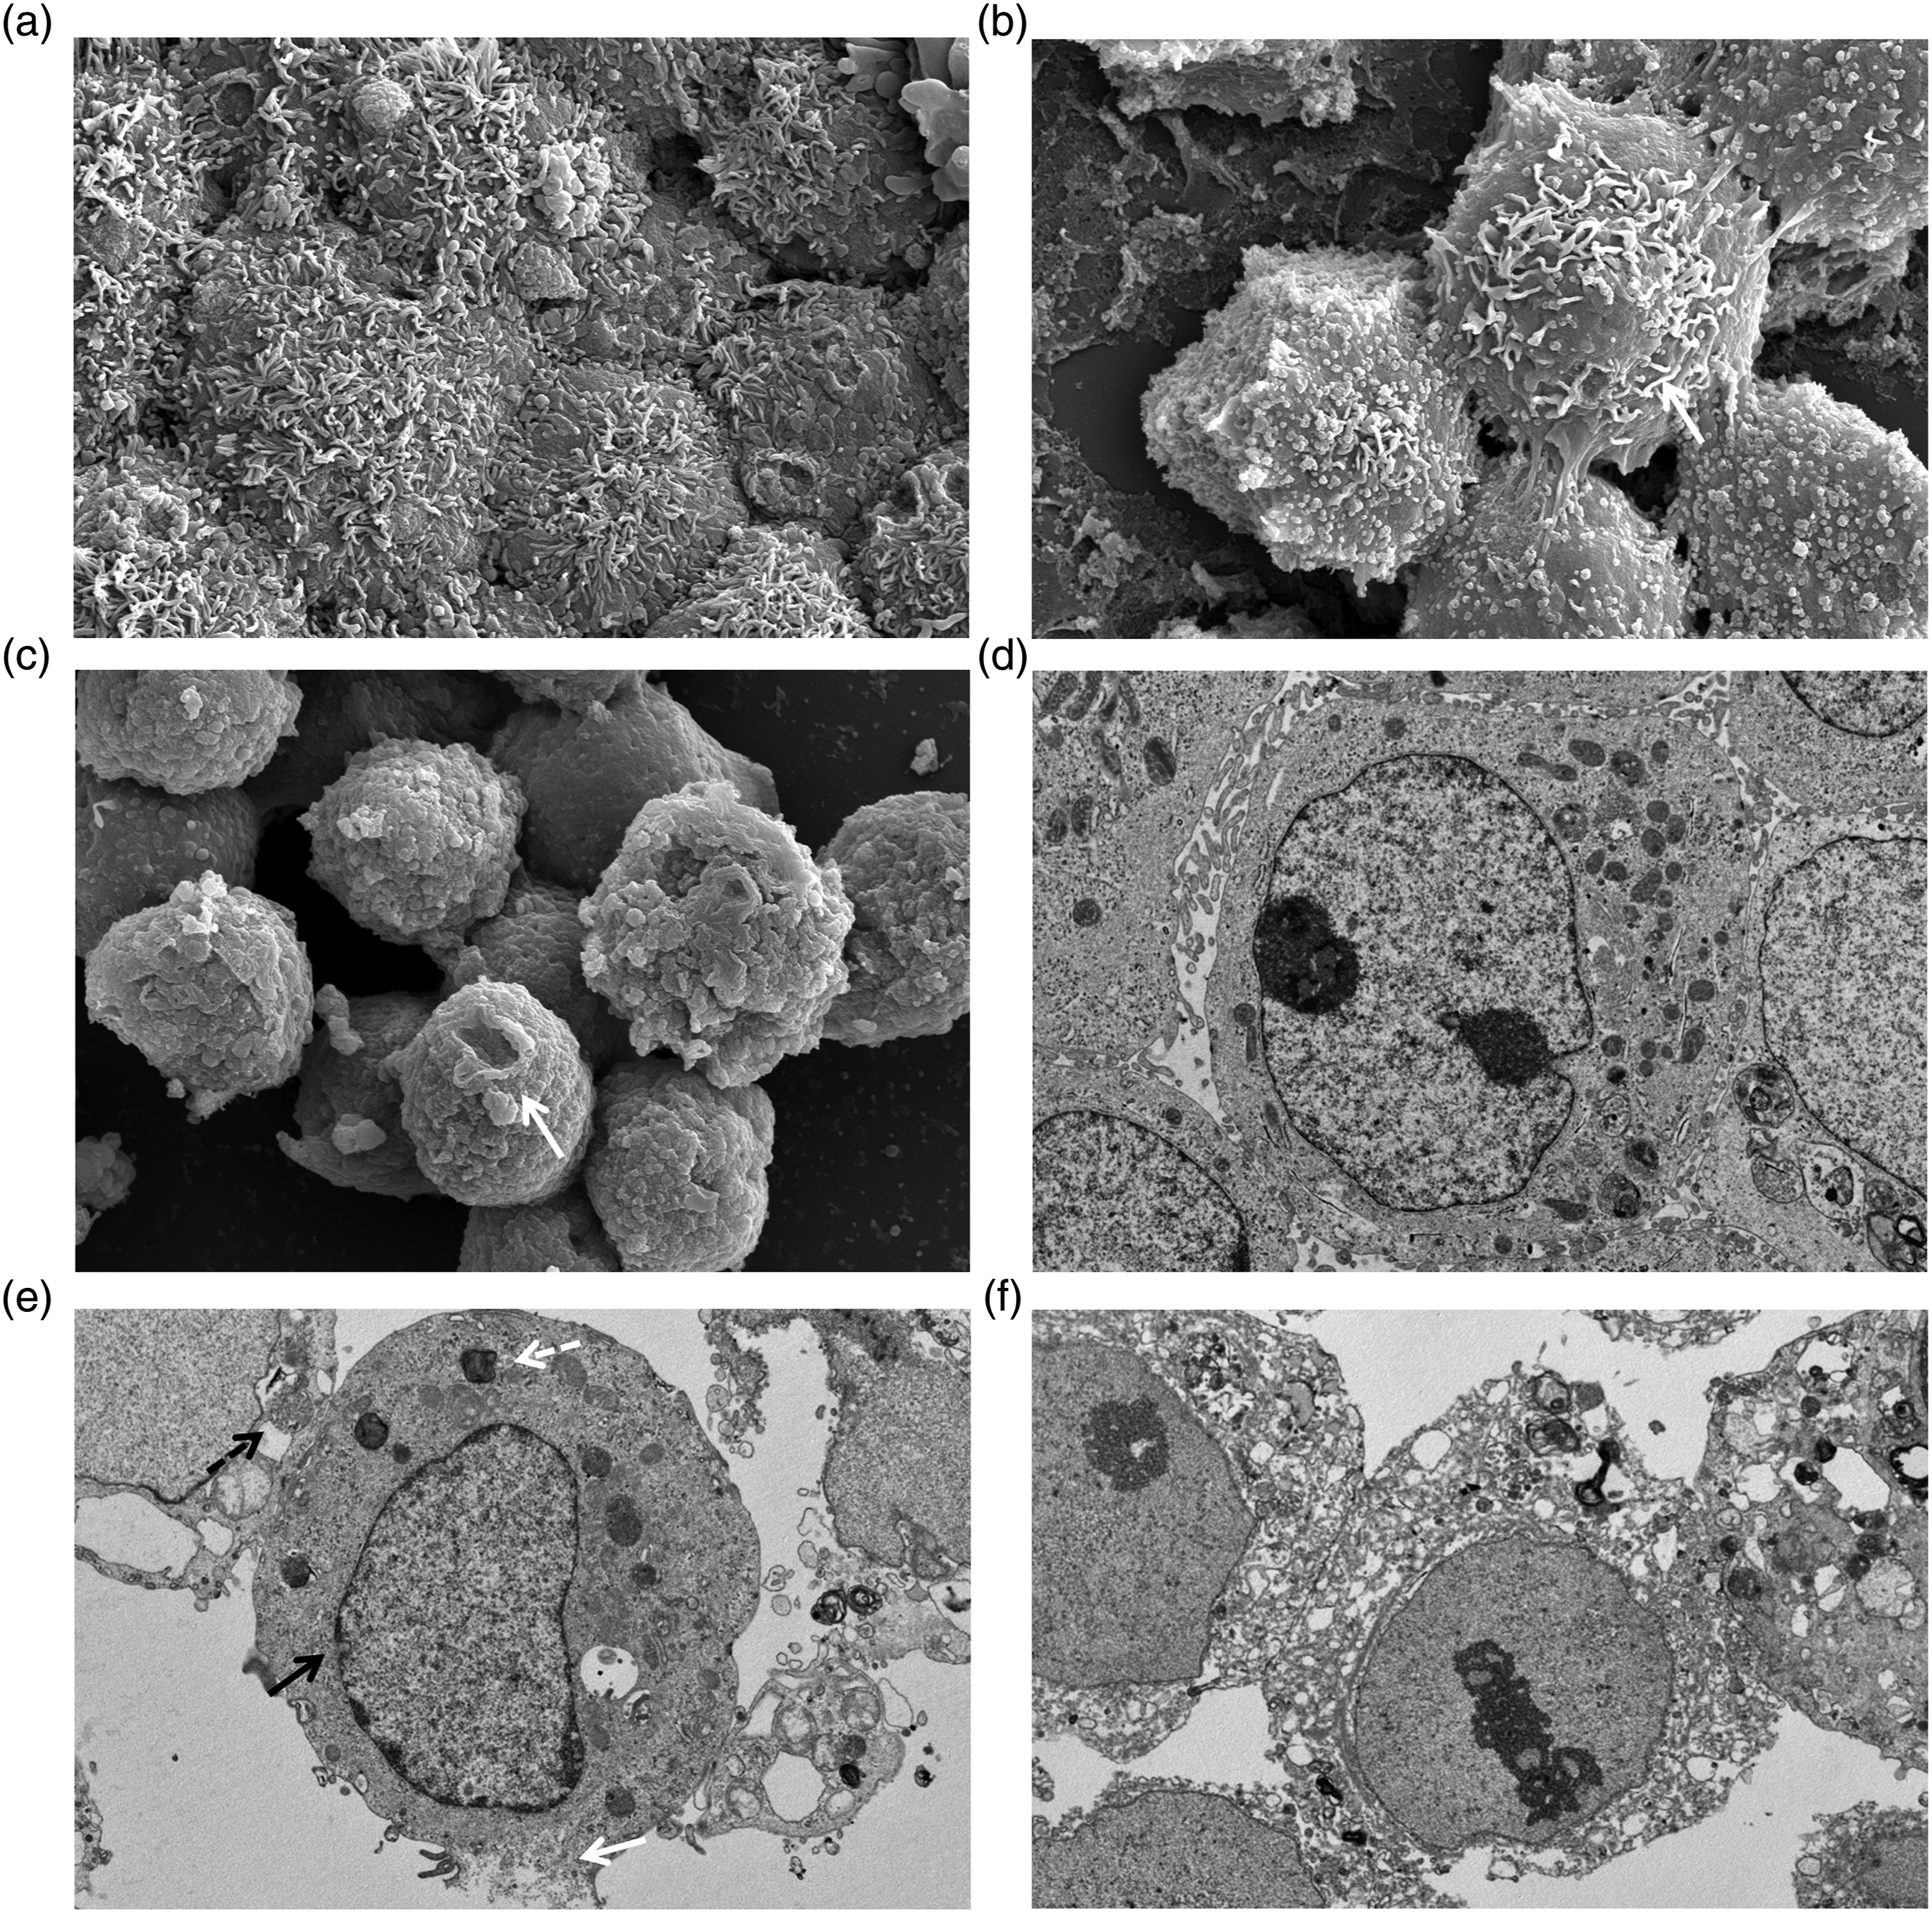
In vivo anti-tumor activity
A murine model of human gastric cancer was used for investigating whether C10 inhibited tumor growth in vivo. When the xenograft tumors reached a size of 300–500 mm3 at 4 weeks, 16 mice were randomized into two groups: a control group with 8 mice that received PBS, and a treatment group with 8 mice that were treated with a single injection of 500 mM C10. The changes in tumor size were measured every week for 1 month. As demonstrated in Figure 6(a) and (b), the tumor volumes in the mice significantly decreased by 24% after 4 weeks of treatment with C10 in comparison to those of the control treatment (p < .05). To further investigate the mechanism by which C10 inhibited the growth of the xenograft tumors in vivo, sections of tumor tissue were directly examined under a light microscope. It was observed that the collagen fibers were surrounded by a band around the edges of the tumor, and fibrin webs formed on the left side of the tumor (Figure 6(c)). Lymphocytic infiltration was also observed between the tumor and muscle layer. Extensive necrotic changes were observed in the tissues at the center of the tumor. In vivo antitumor activity of C10. (a) Changes in tumor size and (b) comparison of the mean tumor volume after the administration of PBS (control) and C10. The data are represented as the means ± standard deviations. The differences between the treatment groups were statistically significant, and are denoted by *p < .05, pre-treatment versus post-treatment. (c) Histological findings of the xenograft tumor after the administration of C10. Hematoxylin and eosin-stained images of the tumor tissues at a magnification of ×40. Extensive necrotic changes were observed in the center of the tumor tissue.
Discussion
The present study investigated the anticancer effect of the MCFA C10 on gastric cancer cells, both in vitro and in vivo. The results of this study demonstrate that C10 induces apoptosis and necrosis in a concentration-dependent manner, leading to the death of gastric cancer cells.
Fatty acids are carboxylic acids with a long aliphatic chain. Fatty acids belong to three categories, namely, the short-chain, medium-chain, and long-chain fatty acids, based on the number of carbon atoms in the aliphatic chain. Of these, the MCFAs have 6–12 carbon atoms, and natural sources include coconuts, palm kernel oil, and animal milk. MCFAs serve as enhancers that promote the absorption of drugs by modifying the proteins in the tight junctions, including ZO-1 or occludin, and by opening the tight junctions via PLC-dependent signal transduction pathways.6,7 Recent studies have reported that MCFAs exert potential anti-proliferative activity by inducing apoptotic responses.8,10–14
Lauric acid (C12) is an MCFA that triggers the apoptosis of Caco-2 cells by inducing the accumulation of reactive oxygen species (ROS) and depletion of the antioxidant glutathione (GSH). 10 Lauric acid can also reduce the proportion of cells in the G0/G1 phase of the cell cycle, and induce cell cycle arrest at the S and M phases. 10 ROS are reactive molecules with crucial roles in cellular function and signaling. A moderate increase in the levels of ROS can induce cell differentiation and proliferation, whereas genetic instability triggered by oxidative stress can induce cell death.12,13 Additionally, C12 can induce apoptosis of breast cancer cells or endometrial cancer cells by inducing the accumulation of ROS and triggering the EGFR/ERK transduction pathway. 11 EGFR and ERK are signaling proteins that regulate cell proliferation and differentiation and can also trigger the apoptotic response of cancer cells. 14 It has been demonstrated that the anticancer effects of C10 are mediated via the downregulation of genes involved in cell proliferation, including CDK2, CDK4, CKSIb, CCNA2, and CCFD1, and the upregulation of genes involved in apoptosis, including NR4A1 and P21. 8 Furthermore, C10 enhances the activity of caspase-8, a member of the cysteine-aspartic acid protease family of proteins, that triggers programmed cell death. 8
To confirm the anti-proliferative properties of C10, molecules related to the apoptotic pathway were investigated. The results of the western blotting analyses revealed that C10 increased the expression levels of proteins related to apoptosis, including cytochrome C and BAK. These results are consistent with those of previous studies that demonstrated that the short-chain fatty acid butyrate can induce the mitochondrial apoptotic pathway in Caco-2 cells. 15 BAK, a member of the Bcl-2 family, controls cellular apoptosis by regulating the permeability of the outer mitochondrial membrane16–18 and forming pores on the outer mitochondrial membrane, which induces the release of cytochrome C in the mitochondria. 18 Generally, the cytochrome C released into the cytoplasm participates in the caspase pathway and eventually induces apoptosis.16–18
A previous study assessed the viability of cancer cells after 48 h of treatment with 4.4 mM C10 (high concentration) and reported that cell viability decreased by up to 70–90%, owing to apoptosis. 8 Other studies have also demonstrated that polyunsaturated fatty acids (PUFAs) and gamma-linoleic acid induce apoptosis at moderate concentrations and necrosis at higher concentrations.19,20 In the present study, C10 induced cell death at concentrations of 5 mM or higher in a dose-dependent and time-dependent manner, and this could be mainly attributed to the occurrence of necrosis rather than apoptosis. 21 The death rate of the cancer cells was approximately 40% after exposure to 15 mM C10 for the first 1 hour, and all cancer cells were killed following exposure to 15 mM C10 for more than 5 h. Because 0.2 mM C10 requires a minimum reaction time of 48 h for inducing apoptosis, the early death of cancer cells was the result of necrosis. Furthermore, increased LDH levels within 10 min of the administration of C10 indicated that the process of cell death occurred very rapidly, and cellular swelling was the characteristic feature of necrosis under electron microscopy.
The production of ATP is promoted by cAMP via complex V and ATP plays a role in suppressing the permeability of the mitochondrial membrane. 22 In this study, the intracellular cAMP and ATP levels significantly decreased with the treatment of C10. These results were consistent with those of previous studies.23,24 A reduction in the levels of cAMP by C10 inhibited ATP production and, subsequently, depletion of ATP led to cellular death. A decreased level of intracellular ATP usually occurs under the condition of restricted blood circulation or in the presence of chemical stimuli and leads to the suppression of apoptosis and increase of necrosis. 25 This finding is consistent with our result that C10 causes necrosis at higher concentrations. Moreover, inflammation and scar formation are especially prominent after necrotic cell death. 26 As seen in the pathologic report of our in vivo experiment, inflammation and scar formation after treatment of C10 supported that cell death occurred due to necrosis.
Interestingly, autophagy was triggered in the tumor cells when the concentration of C10 was increased. Autophagy is an intracellular degradative process of auto-digestion that delivers the cytoplasmic constituents to the lysosome. Recent studies reported that autophagy has very diverse physiological roles,23,27 including both tumor-suppressive and tumor-promoting functions. Autophagy’s tumor-suppressive properties are frequently observed at the initial stage of cancer development and are later transformed into tumor-promoting potential during cancer progression. 24 Higher concentrations of C10 can induce membrane solubilization, cell extrusion, and cell death. 28 Therefore, autophagy could have been triggered under the stressful condition of cell death by C10 in a protective way but failed to stop tumor cell death. In conclusion, C10 induces apoptosis and necrosis in a concentration-dependent manner, and when C10 is injected locally into a gastric cancer mass, the tumor size is successfully reduced. Further study is required on the role of C10 in the treatment of gastric cancer.
Footnotes
Author contributions
Conceptualization, funding acquisition, and writing, review, & editing: Jung Ho Park
Investigation and data curation: Nam-Hee Kim, Jeong-Yoon Yang, Taeheon Lee and Hee-Young Lee
Writing - original draft: Nam-Hee Kim
Methodology and supervision: Jung Ho Park, Dong-Hoe Koo
Approval of the final manuscript: all authors
Data availability statement
Requests for data and materials should be addressed to the corresponding author.
Declaration of conflicting interests
The author(s) declared no potential conflicts of interest with respect to the research, authorship, and/or publication of this article.
Ethical approval
The protocol of this study was approved by the Ethics Committee for Animal Experiments of Kangbuk Samsung Hospital, Sungkyunkwan University School of Medicine, and conducted according to the Animal Experiment Guidelines of this university.
Funding
This research was supported by a grant from Basic Science Research Program [NRF-2017R1A2B4004988 & NRF-2016R1D1A1B03933759] through the National Research Foundation of Korea (NRF) funded by the Ministry of Education.