
Abstract
Background:
The programmed cell death-ligand 1 (PD-L1) combined positive score is used as a patient selection tool and predictive factor for anti-programmed cell death-1 (PD-1)/PD-L1 therapy in gastric cancer. However, the expression of PD-L1 and major histocompatibility complex class I (MHC-I) can be affected by conventional treatment approaches.
Objective:
In this study, we examined the effects of chemotherapy on surface PD-L1 and surface MHC-I expression in living and apoptotic gastric cancer cells. AGS (moderately differentiated) and SNU-1 (poorly differentiated) cells were treated 5-Fluorouracil (5-Fu), cisplatin, mitomycin c (MMC), and FOLFOX (5-Fu, leucovorin, and oxaliplatin).
Methods:
To quantify the expression levels of surface PD-L1 or surface MHC-I on living and apoptotic cells, the cells were co-stained with annexin V and PD-L1 or MHC-I antibodies. The percentages of single positive (annexin V-negative, PD-L1-positive; annexin V-negative, MHC-I-positive) and double positive (annexin V-positive, PD-L1-positive; annexin V-positive, MHC-I-positive) cells were analyzed by flow cytometry.
Results:
Every tested chemotherapeutic agent increased the levels of surface PD-L1 and surface MHC-I, although the extents of increase differed in AGS and SNU-1 cells. In AGS cells, 5-Fu caused the largest increases in surface PD-L1 and surface MHC-I. However, 5-Fu caused the weakest increases in surface PD-L1 and surface MHC-I in SNU-1 cells. Notably, chemotherapy-mediated increases in surface PD-L1 and surface MHC-I mostly occurred on apoptotic cells.
Conclusion:
Our findings reveal that chemotherapy mainly increases surface PD-L1 and surface MHC-I on apoptotic gastric cancer cells.
Introduction
Gastric cancer is the fifth most common cancer worldwide. 1 Several standard approaches are used to treat gastric cancer, including surgery, chemotherapy, and targeted therapy. 1 Surgery is only suitable for patients with resectable gastric cancer. 1 For metastatic disease, chemotherapy is the main treatment option. 1 Many chemotherapeutic agents are used to treat gastric cancer, including 5-Fluorouracil (5-Fu), cisplatin (Cis), etoposide, mitomycin c (MMC), and paclitaxel.2,3 Chemotherapy may be given single agent or as multiple agents. Common combination chemotherapy regimens for gastric cancer include FOLFOX (5-Fu, leucovorin, and oxaliplatin), FLOT (5-Fu, leucovorin, oxaliplatin, and docetaxel), ECF (epirubicin, Cis, 5-fluorouracil), and DCF (docetaxel, Cis, 5-Fu). 2 Although chemotherapy provides some survival benefits, chemoresistance frequently occurs within a few months, resulting in therapeutic failure. 3 Moreover, the targeted therapeutic agents trastuzumab and ramucirumab have been approved by the US FDA for treatment of gastric cancer. 4 Trastuzumab and ramucirumab can respectively suppress tumors by neutralization of human epidermal growth factor receptor 2 (HER2) and vascular endothelial growth factor receptor-2 (VEGFR2). 4 However, only patients with HER2 overexpression or VEGFR2 overexpression receive therapeutic benefits from these agents.5,6 Although several approaches are approved to treat gastric cancer, the 5-year survival is still below 20%. 7
Recently, multiple programmed cell death protein-1 (PD-1)/programmed cell death-ligand 1 (PD-L1) inhibitors have been approved for treating gastric cancer; these treatments include pembrolizumab, nivolumab, and sintilimab. 8 This new treatment option provides new hope for patients with gastric cancer; however, its clinical application still needs to be optimized. PD-1/PD-L1 inhibitors exert tumor suppressive activity by blocking the interaction between PD-L1-expressing cancer cells and PD-1-expressing T cells, which restores the tumor-killing activity of the T cells. 9 Currently, PD-L1 combined positive score (CPS) is widely used to select appropriate gastric cancer patients for treatment with PD-1/PD-L1 inhibitors. 10 Theoretically, gastric cancer patients with greater PD-L1 CPS should have better response to PD-1/PD-L1 inhibitors. 11 However, real-world studies have demonstrated that the response rate of patients with gastric cancer to PD-1/PD-L1 inhibitors is disappointing (<20%).12–14 These findings might suggest that our current understanding of PD-1/PD-L1-targeted therapies is still insufficient. Furthermore, increasing evidence suggests that the involvement of major histocompatibility complex class-I (MHC-I) in therapeutic response to PD-1/PD-L1 inhibitors should be reconsidered.15–18 MHC-I is responsible for presenting cancer neoantigens to T cells and natural killer (NK) cells, which is crucial for the recognition of cancer cells by the innate immune system.16,17 Yet, the expression of MHC-I is downregulated in 40%–90% of tumors. 15 Thus, downregulation of MHC-I has been implicated in cancer immune escape.15–18 and anti-PD-1/PD-L1 therapeutic failure. 15 Previous work showed that the expression levels of PD-L1 and MHC-I vary at different stages of gastric cancer. 19 In particular, non-metastatic tumors possess high MHC-1 and low PD-L1 expression, while metastatic tumors possess low MHC-1 and high PD-L1 expression. Moreover, the levels of MHC-I and PD-L1 appear to be upregulated or downregulated by different cancer therapies, including chemotherapy, targeted therapy, and radiation therapy.20–24 Nevertheless, it remains unclear how the expression levels of MHC-I and PD-L1 are modulated by chemotherapy in living and apoptotic cancer cells. In the present study, we analyzed how chemotherapy treatments modulate PD-L1 and MHC-I expression patterns in living and apoptotic gastric cancer cells.
Materials and methods
Reagents
5-Fluorouracil (5-Fu) and phenazine methosulfate (PMS) were purchased from Merck (Germany). Cisplatin (Cis), mitomycin c (MMC), leucovorin, and oxaliplatin were purchased from MedChemExpress (USA). 3-(4,5-dimethylthiazol-2-yl)-5-(3-carboxymethoxyphenyl)-2-(4-sulfophenyl)-2H-tetrazolium, inner salt (MTS) was purchased from Promega (USA).
Cell culture
Two human gastric cancer cell lines (AGS and SNU-1) were used in this study. Both were purchased from the Bioresource Collection and Research Center (Taiwan). AGS is a moderately differentiated gastric carcinoma cell line. 25 SNU-1 is a poorly differentiated gastric carcinoma cell line. 26 Both cell lines were maintained in RPMI 1640 (Thermo Fisher Scientific, USA) supplemented with penicillin/streptomycin (Sartorius, Germany) and 10% fetal bovine serum (Peak, USA).
Cell viability analysis and treatment
Cells were seeded onto 96-well plates and treated with increasing doses of 5-Fu, Cis, and MMC. Cell viability was measured with the MTS/PMS activity assay. 27 The results obtained from the MTS/PMS activity assay after 48 h treatments were used for calculating the half-maximal inhibitory concentration (IC50). IC50 was calculated using GraphPad Prism 8. For FOLFOX treatment, cells were treated with FOLFOX (leucovorin: 14 μM; 5-Fu: 200 μM; oxaliplatin: 6 μM) for 48 h. 28
Assessments of annexin V, surface PD-L1, and surface MHC-I
To measure the cell surface levels of phosphatidylserine (PS), PD-L1, and MHC-I, cells were treated with IC50 of 5-Fu, Cis, and MMC or FOLFOX for 48 h. Cell surface PS, PD-L1, and MHC-I were stained by PE annexin V (BioLegend, USA), extracellular domain-specific Alexa Fluor 488-conjugated PD-L1 antibody (Cell signaling Technology, USA), and Alexa Fluor 488-conjugated MHC-I antibody (Santa Cruz, USA), respectively. 29 In addition, cells were incubated with isotype control antibody, either Alexa Fluor 488-conjugated mouse IgG2 isotype control (for MHC-I) or Alexa Fluor 488-conjugated rabbit IgG isotype control (for PD-L1). Then, cells were rinsed with PBS. The intensities of cell surface annexin V, PD-L1, and MHC-I were measured by flow cytometry (Beckman Coulter Life Science, USA).
Western blot analysis
Cells were treated at the IC50 of 5-Fu, Cis, and MMC for 48 h. Cell lysates were collected in RIPA buffer (Merck, USA), and then proteins were separated by gradient gel. The separated proteins were transferred onto PVDF membranes, which were probed with anti-PD-L1, anti-MHC-I, and anti-β-actin. All antibodies were purchased from Cell Signaling Technology (USA). Protein band intensities were measured by ImageJ software (bundled with 64-bit Java 8).
Statistical analysis
Results are presented as ±SEM. Student’s t-test was used to assess the statistical differences. p < 0.05 was considered statistically significant.
Results
Effects of 5-Fu, Cis, and MMC on cell viability of gastric cancer cells
To validate the effects of 5-Fu, Cis, and MMC on cell viability of AGS and SNU-1 cells, the cultures were treated with the indicated doses of 5-Fu, Cis, and MMC for 24 h (Figure 1(a)) and 48 h (Figure 1(b)). 5-Fu only slightly reduced viabilities of AGS and SNU-1 cells at 24 h. Cis reduced cell viability at concentrations above 25 μM and 3.128 μM in AGS and SNU-1 cells, respectively. In contrast, MMC markedly reduced the cell viabilities of AGS and SNU-1 cells, even at low dosages. All the tested chemotherapeutic agents exhibited stronger cell killing activities at 48 h in both AGS and SNU-1 cells, as compared to 24 h. The IC50 for each chemotherapeutic agent was therefore obtained from the cell viability assays at 48 h (Figure 1(c)). Furthermore, we found that treatment of chemotherapeutic agents at the IC50 elevated the levels of total PD-L1 in AGS and SNU-1 cells (Figure 1(d)). Notably, only 5-Fu and MMC elevated the levels of MHC-I in AGS cells.
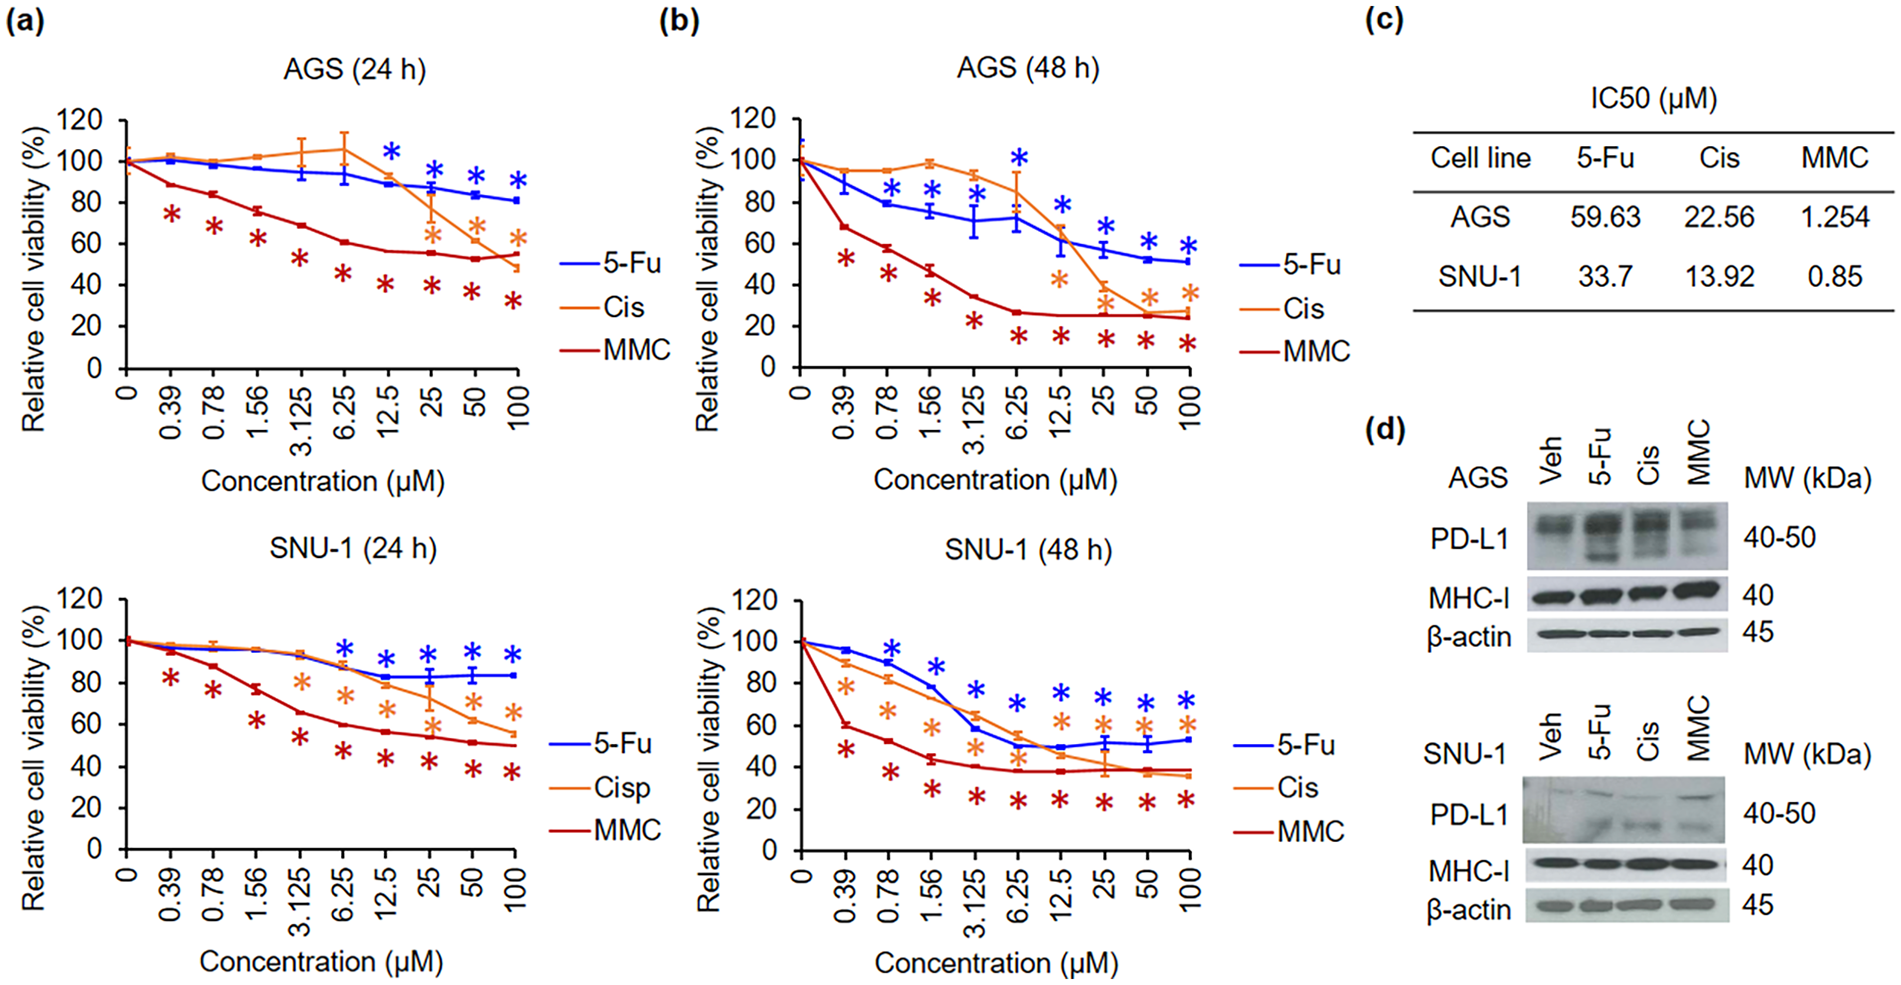
Effect of 5-Fu, Cis, and MMC on viability of AGS and SNU-1 cells. Cells were treated with indicated doses of 5-Fu, Cis, and MMC for 24 h (a) and 48 h (b). Cell viability was quantified by the MTS/PMS activity assay. (c) IC50 values were calculated for 5-Fu, Cis, and MMC treated to AGS and SNU-1 cells. (d) Cells were treated with the IC50 of chemotherapeutic agents. The expression levels of total PD-L1 and total MHC-I were assessed by western blot analysis.
Effects of single-agent chemotherapy on surface PD-L1 expression in living and apoptotic gastric cancer cells
To analyze the PD-L1 expression patterns in gastric cancer cells treated with chemotherapeutic agents (5-Fu, Cis, and MMC), AGS and SNU-1 cells were treated with the IC50 of chemotherapeutic agents. Then, cells were co-stained with annexin V and PD-L1 antibodies. Side scatter (SSC) versus annexin V dot plots showed that the chemotherapeutic agents increased the intensity of cell surface annexin V, indicating that early apoptosis was induced in both AGS and SNU-1 cells (Figure 2(a) and (b)). A gated region was defined to include annexin V-positive cells. Of note, the IC50 of chemotherapeutic agents only induced approximately 25%–30% apoptosis in the cell populations. This result might be due to differences in detection principle or sensitivity between the MTS/PMS activity assay and annexin V assay.30,31 All chemotherapeutic agents upregulated surface PD-L1 signals in both AGS and SNU-1 cells (Figure 2(c) and (d)). 5-Fu exhibited the strongest PD-L1-inducing activity in AGS cells. In contrast, MMC possessed the strongest PD-L1-inducing activity in SNU-1 cells. Notably, the gated cells (annexin V positive cells; blue arrow) possessed surface PD-L1 signals. To measure the percentages of annexin V-positive cells that also exhibit surface PD-L1, a PD-L1 versus annexin V dot plot analysis was performed (Figure 2(e) and (f)). Chemotherapeutic agents elevated surface PD-L1 in both living and apoptotic AGS cells, but the chemotherapeutic agents only upregulated surface PD-L1 in apoptotic SNU-1 cells. In addition, most of the PD-L1-positive cells were also positive for annexin V signals. These findings were consistent for both AGS and SNU-1 cells. Furthermore, surface PD-L1 levels were reduced by Cis and MMC in living SNU-1 cells.

Effects of chemotherapeutic agents on surface PD-L1 expression in gastric cancer cells. Cells were treated with the IC50 of 5-Fu, Cis, and MMC for 48 h. Then, cells were co-stained with annexin V and PD-L1 antibody. (a) Cells were gated on SSC-A versus annexin V plots. Gated cells: annexin V-positive cells. (b) Percentages of annexin V-positive cells. (c) Representative histogram showing surface PD-L1 expression. Red histogram: total cells. Purple histogram: annexin V-positive cells. (d) Quantification of relative cell surface PD-L1 intensity. (e) Representative dot plots showing the expression of annexin V and surface PD-L1 on AGS and SNU-1 cells. (f) Quantification of annexin V-positive and surface PD-L1-positive cells, and annexin V-negative and surface PD-L1-positive cells.
Effects of single-agent chemotherapy on surface MHC-I expression in living and apoptotic gastric cancer cells
Expression of MHC-I is associated with anti-PD-1/PD-L1 efficacy. 15 Thus, we analyzed the MHC-I expression patterns in gastric cancer cells treated with chemotherapeutic agents (5-Fu, Cis, and MMC). For these experiments, the cells were co-stained with annexin V and MHC-I antibody. The results showed that all chemotherapeutic agents induced apoptosis (Figure 3(a) and (b)) and increased surface MHC-I (Figure 3(c) and (d)). We also noted that apoptotic cells (annexin V-positive cells; blue arrow) exhibited strong surface MHC-I signals. Thus, we further analyzed the expression patterns of surface MHC-I separately in living and apoptotic cells (Figure 3(e) and (f)). This analysis revealed that chemotherapeutic agents elevate surface MHC-I in both living and apoptotic AGS cells, but the chemotherapeutic agents mostly increased surface MHC-I in apoptotic SNU-1 cells. Of note, Cis reduced the levels of surface MHC-I in living SNU-1 cells.

Effects of chemotherapeutic agents on surface MHC-I expression in gastric cancer cells. Cells were treated with the IC50 of 5-Fu, Cis, and MMC for 48 h. Then, cells were co-stained with annexin V and MHC-I antibody. (a) Cells were gated on SSC-A versus annexin V plots. Gated cells: annexin V-positive cells. (b) Percentages of annexin V-positive cells. (c) Representative histogram showing surface MHC-I expression. Red histogram: total cells. Purple histogram: annexin V-positive cells. (d) Quantification of relative cell surface PD-L1 intensity. (e) Representative dot plots showing the expression of annexin V and surface PD-L1 on AGS and SNU-1 cells. (f) Quantification of annexin V-positive and PD-L1-positive cells, and annexin V-negative and surface PD-L1-positive cells.
Effects of FOLFOX on surface PD-L1 and surface MHC-1 expression in living and apoptotic gastric cancer cells
We also validated the effects of combination chemotherapy on the regulation of surface PD-L1 and MHC-1 expression in living and apoptotic gastric cancer cells. AGS cells were treated with FOLFOX for 48 h, and then cells were co-stained with annexin V, and PD-L1 or MHC-I antibodies. We found that apoptosis was induced by FOLFOX in AGS cells (Figure 4(a), (b), (g), and (h)). In addition, FOLFOX elevated the levels of surface PD-L1 (Figure 4(c) and (d)). A further PD-L1 versus annexin V dot plot analysis revealed that FOLFOX mostly elevated levels of surface PD-L1 in apoptotic cells (Figure 4(e) and (f)). Furthermore, FOLFOX increased the levels of surface MHC-1 (Figure 4(i) and (j)), and most of the MHC-I-positive cells were apoptotic cells (Figure 4(k) and (l)).

Effects of FOLFOX on surface MHC-I or PD-L1 expression on AGS cells. Cells were treated with FOLFOX for 48 h. Then, cells were co-stained with annexin V and MHC-I or PD-L1 antibody. (a) Cells were gated on SSC-A versus annexin V plots. Gated cells: annexin V-positive cells. (b) Percentages of annexin V-positive cells. (c) Representative histogram showing surface PD-L1 expression. Red histogram: total cells. Purple histogram: annexin V-positive cells. (d) Quantification of relative cell surface PD-L1 intensity. (e) Representative dot plots showing the expression of annexin V and surface PD-L1 on AGS cells. (f) Quantification annexin V-positive and surface PD-L1-positive cells, and annexin V-negative and surface PD-L1-positive cells. (g) Cells were gated on SSC-A versus annexin V plots. Gated cells: annexin V-positive cells. (h) Percentages of annexin V-positive cells. (i) Representative histogram showing surface MHC-I expression. Red histogram: total cells. Purple histogram: annexin V-positive cells. (j) Quantification of relative cell surface MHC-I intensity. (k) Representative dot plots showing the expression of annexin V and surface MHC-I on AGS cells. (l) Quantification of annexin V-positive and surface MHC-I-positive cells, and annexin V-negative and surface MHC-I-positive cells.
Discussion
Currently, a combined treatment of anti-PD-1/PD-L1 plus chemotherapy is frequently used to treat gastric cancer patients.1,14,32,33 Furthermore, according to clinical practice guidelines in Europe, China, Japan, and Korea, only patients with high expression of PD-L1 are suitable for anti-PD-1/PD-L1 therapy.12,32–34 Patients have higher PD-L1 CPS were expected to have better response to anti-PD-1/PD-L1 therapy. Thus, PD-L1 CPS is commonly used to select gastric cancer patients for anti-PD-1/PD-L1 therapy. PD-L1 CPS is defined as the PD-L1-positive cells (viable tumor cells, lymphocytes, and macrophages) divided by the total viable tumor cells, multiplied by 100.35,36 Although only “selected patients” receive anti-PD-1/PD-L1 therapy, the objective response rate of anti-PD-1/PD-L1 therapy in gastric cancer is still below 15%. 12 Thus, there is a growing concern about the suitability of PD-L1 as a marker for patient selection.37–39
Studies have shown that tumor cells exhibit dynamic PD-L1 and MHC-I expression at different stages of cancer.40,41 Compared with primary gastric tumors, metastatic gastric tumors have relatively lower levels of MHC-I and higher PD-L1 expression. 19 In addition, previous studies demonstrated that PD-L1 and MHC-I are modulated by conventional treatments for gastric cancer.20,22,29 Here, we obtained similar results, finding that both single-agent and combination chemotherapy treatments upregulated surface expression of PD-L1 and MHC-I (Figures 2–4). We also found that 5-Fu, Cis, and MMC concentrations that induce similar levels of cytotoxicity in cells (Figures 2 and 3) possess different modulating activities on surface PD-L1 and surface MHC-I in AGS and SNU-1 cells. 5-Fu exhibits the most potent induction of surface PD-L1 and surface MHC-I in AGS cells (Figures 2(d) and 3(d)). In contrast, 5-Fu exhibits the weakest modulating activity on surface PD-L1 and surface MHC-I in SNU-1 cells (Figures 2(d) and 3(d)). These results suggest that chemotherapy-mediated modulation of surface PD-L1 and surface MHC-I are independent of cytotoxicity.
Little is known about how expression patterns of PD-L1 and MHC-1 may be affected by chemotherapy in living and dying/dead cells. Our results indicate that chemotherapy preferentially upregulates surface PD-L1 (Figures 2(e) and (f) and 4(e) and (f)) and surface MHC-I (Figures 3(e) and (f) and 4(e) and (f)) in apoptotic gastric cancer cells. These findings raise a major concern that PD-L1 CPS analysis might not accurately reflect relevant PD-L1 levels. Early apoptosis is difficult to identify by morphological features in H&E-stained tissue sections. 42 Thus, some dead or early apoptotic tumor cells with PD-L1 signals might be counted as viable tumor cells with PD-L1 signals, which could lead to an overestimation of the PD-L1 CPS and result in inappropriate patient selection. Co-staining for PD-L1 and apoptosis or cell death markers might greatly improve the accuracy of PD-L1 CPS-based selection. Furthermore, chemotherapy only slightly increases surface PD-L1 and MHC-I on living AGS (moderately differentiated) cells and has little effect in SNU-1 (poorly differentiated) cells. However, it remains unclear why chemotherapy would have different effects on the regulation of surface PD-L1 and MHC-I in moderately and poorly differentiated gastric cancer cell lines. Further investigation is required. Since most clinical cases of gastric cancer are poorly differentiated,10,43 our findings lead us to speculate that chemotherapy might not consistently elevate surface PD-L1 and MHC-I on viable cancer cells in patients.
Downregulation of MHC-I is implicated in anti-PD-1/PD-L1 resistance.44,45 Chemotherapy could elevate surface MHC-I, yet this elevation mostly occurs in apoptotic cells (Figures 3(e) and (f) and 4(e) and (f)). Thus, we suspect that viable cancer cells might be largely resistant to anti-PD-1/PD-L1 therapy due to low expression of surface MHC-I. Increasing surface expression of MHC-I could render cancer cells more easily recognized by T cells due to enhancement of neoantigen presentation. Moreover, an in vivo study showed that upregulation of MHC-I enhanced response to anti-PD-1/PD-L1 therapy, 46 and a clinical study showed that melanoma patients who responded to anti-PD-1/PD-L1 therapy had higher MHC-I expression. 47 As such, strategies to increase surface MHC-I expression on viable cancer cells could be a feasible means of enhancing the therapeutic efficacy of anti-PD-1/PD-L1 therapy. 46 Furthermore, our findings suggest that the levels of MHC-I on viable tumor cells should be considered as another patient selection criteria for anti-PD-1/PD-L1 therapy.
It is generally accepted that patients with higher PD-L1 CPS should have better response to anti-PD-1/PD-L1 therapy.12,32–34 Also, an in vivo study revealed that cisplatin nanoparticles enhance response to PD-1/PD-L1 inhibitors via increasing tumor PD-L1. 48 However, the effects of increasing PD-L1 on response to PD-1/PD-L1 inhibitors remains a topic of debate. Importantly, it is difficult to precisely induce an appropriate amount of surface PD-L1 expression, and excessive upregulation of PD-L1 could enhance cancer malignancy. 49 Thus, more work is needed to investigate the possible effects of increasing PD-L1 expression to modulate the efficacy of PD-1 and PD-L1 inhibitors.
Several signaling molecules and mechanisms have been implicated as modulators of MHC-I and PD-L1 expression, including ERK, JNK, NFκB, Akt, JAK/STAT3, interferon-γ, Epstein-Barr virus, and epigenetic alterations.18,50 However, not all of these signal molecules and mechanisms regulate both “total” and “surface” levels of MHC-I and PD-L1. For instance, ERK is essential for 5-Fu-induced total PD-L1 expression, but not surface PD-L1 expression. 51 In this study, we found that chemotherapy increases surface PD-L1 and MHC-I expression in gastric cancer cells (Figures 2–4); yet, the precise mechanisms underlying these effects remain unclear. There are several signal axes and molecules known to regulate surface MHC-I and surface PD-L1. These include the Surface protein sushi domain-containing 6 (SUSD6)/Transmembrane protein 127 (TMEM127)/E3 ubiquitin ligase WWP2 (WWP2) axis, which is essential for degradation of surface MHC-I. 52 Of note, this signaling axis is often activated in acute myeloid leukemia (AML), and low surface MHC-I expression in AML cells. 52 Surface PD-L1 is known to be internalized and recycled. 53 Prevention of its lysosomal degradation by CKLF-like MARVEL transmembrane domain containing protein 6 (CMTM6) and trafficking protein particle complex (TRAPPC4) was further shown to stabilize surface PD-L1 expression. 53 Interestingly, both CMTM6 and PD-L1 are highly expressed in gastric cancer, and the expression of these two factors is correlated with poor prognosis. 54 Moreover, IKAROS family zinc finger 4 (IKZF4) and Non-POU domain-containing octamer-binding (NONO) can regulate the RAB11 family-interacting protein 3 (RAB11FIP3) and stabilize the surface PD-L1 in gastric cancer cells. 55 However, the involvement of theses signaling molecules in chemotherapy-mediated upregulation of surface MHC-I and surface PD-L1 remains unclear. Further research will be required to delineate the signaling mechanisms underlying our current findings.
To our knowledge, this is the first study to demonstrate that chemotherapy-mediated increases in surface MHC-I and PD-L1 preferentially occur in apoptotic cells. However, it is still unclear whether these findings are relevant to cancer animal models or patient tumors. Therefore, further clinical investigations are needed to understand the clinical relevance of our findings. Also, a large-scale trial is needed to test whether the level of MHC-I on viable cancer cells can serve as a potential prognostic biomarker for anti-PD1/PD-L1 therapy.
Conclusions
Our findings provide important clues for improving anti-PD-1/PD-L1 therapy. First, we showed that chemotherapy-mediated increases of surface PD-L1 are mostly limited to apoptotic cells. If early apoptotic cells cannot be clearly identified by pathological examination, this effect could lead to an overestimation of the PD-L1 CPS. Second, chemotherapy-mediated increases in surface MHC-I also preferentially occur in apoptotic cells. Low surface MHC-I on viable cancer cells could mean that immune cells cannot effectively recognize and target viable cancer cells, even in the context of anti-PD-1/PD-L1 therapy. Third, in addition to PD-L1 CPS, the level of MHC-I on viable cancer cells should be considered as a patient selection criterion for anti-PD-1/PD-L1 therapy.
Footnotes
Acknowledgements
We thank Marcus J. Calkins, PhD for language editing.
Author contributions
Declaration of conflicting interests
The author(s) declared no potential conflicts of interest with respect to the research, authorship, and/or publication of this article.
Funding
The author(s) disclosed receipt of the following financial support for the research, authorship, and/or publication of this article: This research was supported by the National Science and Technology Council (NSTC), NSTC 113-2313-B-038-003. This research was also funded by the Taipei Medical University–Wan Fang Hospital, 110TMU-WFH-20, 112-wf-eva-21, 113TMU-WFH-18. This work was also financially supported of the Higher Education Sprout Project by the Ministry of Education (MOE) in Taiwan, DP2-TMU-113-C-02.
Ethical statement
Not applicable.
Informed consent
Not applicable.
Trial registration
Not applicable.
ORCID iDs
Data availability
The data that support the findings of this study are available from the corresponding author, S.B.C. and Y.H.H., upon reasonable request.