
Abstract
Cardiovascular disease and type 2 diabetes mellitus (T2DM) patients have low level of adiponectin, however, till now the role of adiponectin in progression of ‘T2DM with cardiac dysfunction’ in animal model has not been characterized. Therefore, the aim of the present study was to develop and characterize T2DM animal model with cardiac dysfunction and to study the role of cardiac adiponectin expression in cardiac dysfunction. For this, Wistar rats (M/F) were fed a high-fat diet for different time periods: 3, 4 and 5 weeks and given a single, low-dose streptozotocin (25mg/kg), intraperitoneal injection 1 week prior to the experiments. Rats in T2DM group (3 weeks) developed hyperglycaemia, hyperlipidaemia, oxidative stress with normoinsulinaemia and mild cardiac dysfunction suggesting onset of T2DM with cardiac dysfunction. Extended high-fat feeding, that is, 4 and 5 weeks induced insulin resistance accompanied with cardiac hypertrophy, cardiac dysfunction and reduced baroreflex sensitivity indicating development of T2DM with cardiac dysfunction. Cardiac adiponectin expression did not change in rats of T2DM group (3 weeks), however, it significantly decreased in rats of two T2DM groups (4 and 5 weeks) along with increased intracellular adhesion molecule-1 levels. Thus, the present study for the first time indicates that in the present T2DM animal model, as T2DM progresses cardiac adiponectin expression also decreases which might be the precipitating factor for cardiac hypertrophy and decrease in baroreflex sensitivity, which induces cardiac dysfunction.
Keywords
Introduction
Adiponectin is the main secretion of adipose tissue and is responsible for the regulation of appetite, satiety, inflammation, fat distribution, insulin sensitivity and energy expenditure. 1,2 In the last two decades, there has been a significant amount of experimental evidence supporting the role of adiponectin as an insulin-sensitizing hormone. 3 Replenishment of adiponectin significantly improves high-fat diet (HFD)-induced insulin resistance and hypertriglyceridaemia, which leads to the conclusion that adiponectin is an insulin-sensitizing adipocytokine. 4 More recent studies have suggested that low adiponectin levels are more strongly correlated with insulin resistance and hyperinsulinaemia than the conventional parameters like degree of adiposity and glucose tolerance. 5 Adiponectin is now considered an important link between obesity, insulin resistance and the development of type 2 diabetes mellitus (T2DM). 6
Cardiovascular disease is the foremost reason for mortality among patients of T2DM, and low levels of adiponectin are also found in patients with cardiovascular diseases. 7 Hypoadiponectinaemia is associated with progression of left ventricular hypertrophy in many obesity-related conditions, and several clinical studies have investigated the interaction of adiponectin level with cardiac hypertrophy. 8 Thus, it has been suggested to be an independent predictor for cardiovascular risk. 9 As the cardioprotective effects of adiponectin are attributed to its anti-inflammatory, antioxidant and anti-apoptotic properties, 9 its role in progression of diabetes-induced cardiac dysfunction is crucial. Although genetically engineered animal models of diabetes are available 10 and are useful in assessing the specific role of various pathways, vital for the development of diabetes-induced cardiac dysfunction, these genetically engineered models cannot be used to study multiple pathways. Several animal models of T2DM with HFD and low dose of streptozotocin (STZ) have been developed, 11,12 however, in all such ‘T2DM model with cardiac dysfunction’ the cardiac dysfunction and role of adiponectin has still not been well characterized. Therefore, the aim of the present study was to investigate mechanical, neural, biochemical alterations that occur in a novel animal model that mimics human T2DM-induced cardiac dysfunction. We wanted to identify the role cardiac adiponectin plays in the progression of T2DM-induced cardiac dysfunction.
Materials and methods
All experimental protocols were approved by the Institutional Animal Ethical Committee, IGNOU, New Delhi, India, and experiments were performed according to the guidelines of the Committee for Control and Supervision of Experiments on Animals. During the period of study, both control group and all T2DM group rats (3, 4 and 5 weeks) were housed at constant room temperature, humidity and light cycle (12:12 hours light:dark), with free access to tap water and were fed with standard chow diet/HFD ad libitum.
Grouping of animals
Twenty-eight Wistar rats (60–72 weeks old) of 200–300 g were randomly assigned to four experimental groups, each group having seven Wistar rats: T2DM (3 weeks), T2DM (4 weeks) and T2DM (5 weeks) and control. Rats of T2DM (3 weeks), T2DM (4 weeks) and T2DM (5 weeks) were fed HFD for 3, 4 and 5 weeks, respectively, and were given 1 week prior to the experiment, a single intraperitoneal (ip) injection of STZ (25 mg/kg) in citrate buffer (pH 4.5, 0.1M, 0.5 mL) after overnight fasting (14 h). Wistar rats of control group (healthy control) were fed with normal pellet diet and 1 week prior to the experiment were given a single ip injection of citrate buffer (pH 4.5, 0.1M, 0.5 mL) after overnight fasting (14 h). The composition of HFD rich in lard and cholesterol is given in Online Supplemental material. 12
All the studies were performed 1 week after administration of STZ injection to analyse the cardiac function and remodelling. In control group, all the studies were performed 1 week after administration of citrate buffer injection, which corresponds to 1-week post STZ injection.
Within this experimental period, the animals were weighed every 10 days to check whether there was any difference in weight gain between the groups. The fasting blood glucose (FBG) was estimated by a glucose meter (Accu-Chek, Roche Diagnostic India Pvt Ltd., Mumbai, Maharashtra ) in all the 28 rats belonging to both control group and all T2DM groups (3, 4 and 5 weeks) before the start of the study to ensure that the rats were euglycaemic. FBG, glucose tolerance test, serum insulin and insulin sensitivity were also measured in control group and all T2DM groups (3, 4 and 5 weeks) prior to sacrifice for assessing their hyperglycaemic condition. After haemodynamic evaluations, for ponderal evaluations the rats were euthanized and hearts were weighed. The ratio between heart weight and body weight (HW/BW) was calculated. 13
Biochemical estimations
The effect of HFD and STZ on the total cholesterol (TC), triglycerides (TG), high-density lipoprotein-cholesterol (HDL-C) concentrations and levels of cardiac injury marker creatinine kinase-muscle/brain (CK-MB) was estimated from the serum of control group and all the T2DM groups (3, 4 and 5 weeks) using commercially available kits.
Oxidative stress
Malondialdehyde (MDA), a stable product of lipid peroxidation, which is generally used as an index of free radical production was determined in rats of control group and all the T2DM groups (3, 4 and 5 weeks) by a thiobarbituric acid reaction. 14
TNF-alpha and ICAM-1
Serum tumour necrosis factor-alpha (TNF-α) and intracellular adhesion molecule-1 (ICAM-1) concentrations were determined in rats of control group and all the T2DM groups (3, 4 and 5 weeks) by ELISA kit (Merck Millipore, Burlington, MA, USA).
Immunohistochemistry for cardiac NADPH oxidase expression
Nicotinamide adenine dinucleotide phosphate hydrogen (NADPH) oxidase expression in heart was determined by immunohistochemistry. The processed heart tissues were preserved in the 10% paraformaldehyde overnight followed by dehydration in 30%, 20% and 10% sucrose solution successively up to 3 days and were fixed after that in formaldehyde fixative until immunochemical staining. Then, 5–15-mm-thick sections of paraffin-embedded tissues were cut using grading-type Lieca microtome and boiled in 0.1 M citrate buffer (pH 6.0) for 5 min for antigen retrieval process and then incubated in 0.3% hydrogen peroxide in methanol, followed by incubation in blocking buffer containing 0.1 M phosphate-buffered saline, 0.04% Triton X-100 and 10% normal goat serum. Sections were incubated in antibodies and anti-NADPH oxidase (1:100, ABCAM, Cambridge, Massachusetts, USA) for overnight at 4°C. After rinsing in buffer, sections were processed using a three-layer peroxidase staining kit (Thermo Scientific System, Waltham, Massachusetts, USA). The peroxides complex was visualized with ‘3,3′-diaminobenzidine’ (DAB Plus substrate; Thermo Fisher Scientific, Waltham, MA, USA). The slides were counterstained with haematoxylin for 5 s. Slides were cleaned in xylene, gradually dehydrated with ethanol medium and then photographed under Olympus microscope BX51 (Hamburg, Germany).
Immunohistochemistry for cardiac adiponectin expression
Adiponectin expression in heart was determined by immunohistochemistry. Sections of heart tissue which had been formalin-fixed and paraffin-embedded were placed on poly-
Haemodynamic evaluation and ventricular function
One week post citrate buffer/STZ injection, the rats of control group and all the three T2DM groups (3, 4 and 5 weeks) were anesthetized using urethane (1 g/kg, ip), for haemodynamic and ventricular evaluation. The femoral artery was cannulated with a polyethylene catheter, which was attached to a pressure transducer (MLT0699-DC-06A) in conjunction with PowerLab data-acquisition system (85 2OB; AD Instruments, Australia) provided with a computerized analysis programme (Chart v.8.1.8, AD Instruments). The right common carotid artery was catheterized with polyethylene catheter, and the catheter was pushed inside the left ventricle so that the left ventricular pressure maximum (LVPmax), left ventricular pressure minimum (LVPmin), left ventricular end diastolic pressure (LVEDP) and positive and negative pressure derivatives (LV(dP/dt)max, LV(dP/dt)min) were determined. 15
Measurement of baroreflex sensitivity
Baroreflex sensitivity (BRS) was measured by administering vasoconstrictor phenylephrine (PE) (20 µg/mL/kg, iv) and vasodilator sodium nitroprusside (SNP) (20 µg/mL/kg, iv) as bolus injections through a venous catheter. The femoral vein was cannulated for administration of drugs. The resultant changes in heart rate (HR) at corresponding rise or fall in systolic blood pressure (SBP) were measured at different time intervals (every 2 s) as a ratio of bradycardia response to rise in arterial pressure due to vasoconstrictor PE and ratio of tachycardia response to fall in arterial pressure by vasodilator SNP in the rats of control group and all the three T2DM groups (3, 4 and 5 weeks). The relationship between increase in SBP (associated bradycardia) evoked by PE and decrease in SBP evoked by SNP (associated tachycardia) was assessed by regression analysis for each rat. The regression coefficient (slope of regression line), expressed as beats/min/mmHg, was taken as an index of BRS. 16
Data analysis and statistics
All values are expressed as mean ± standard error of the mean of the number of rats used in each experiment. The results were analysed using two-way ANOVA for comparison between groups, followed by the Tukey test. The value of p < 0.05 was considered statistically significant.
Results
Development of animal model of T2DM
In rats of all the three T2DM groups (3, 4 and 5 weeks), no significant percentage change in BW was observed. A significant increase (b p < 0.05) in FBG was observed in all the three T2DM group rats (3, 4 and 5 weeks) which was significantly more severe in rats of T2DM groups (4 and 5 weeks; Table 1). Reduction in glucose tolerance, insulin sensitivity was observed only in rats of the two T2DM groups (4 and 5 weeks; Figure 1(a) and (b) implying that prolonged HFD feeding (4 and 5 weeks) decreased insulin sensitivity (characteristic of T2DM) resulting in a more severe hyperglycaemia. No change in serum insulin levels were observed in rats of all the three T2DM groups (3, 4 and 5 weeks) in comparison to control group rats (Table 1). Furthermore, in all the three T2DM groups (3, 4 and 5 weeks), a significant increase (b p < 0.05) in TC, low-density lipoprotein-cholesterol (LDL-C), very low-density lipoprotein-cholesterol, TG concentrations and decrease in HDL-C concentrations were noted in comparison to control group rats (Table 1). In rats of two T2DM groups (4 and 5 weeks), dyslipidaemia was more severe in comparison to the rats of T2DM group (3 weeks) indicating that dyslipidaemia increases with duration of HFD feeding. No significant change in BW gain was observed in rats of all the three T2DM groups (3, 4 and 5 weeks) in comparison to control group rats (Table 1).
Effect of T2DM on percentage (%) change in body weight, FBG, serum insulin level, TC, HDL-C, LDL-C, VLDL-C, TG and CK-MB levels.a
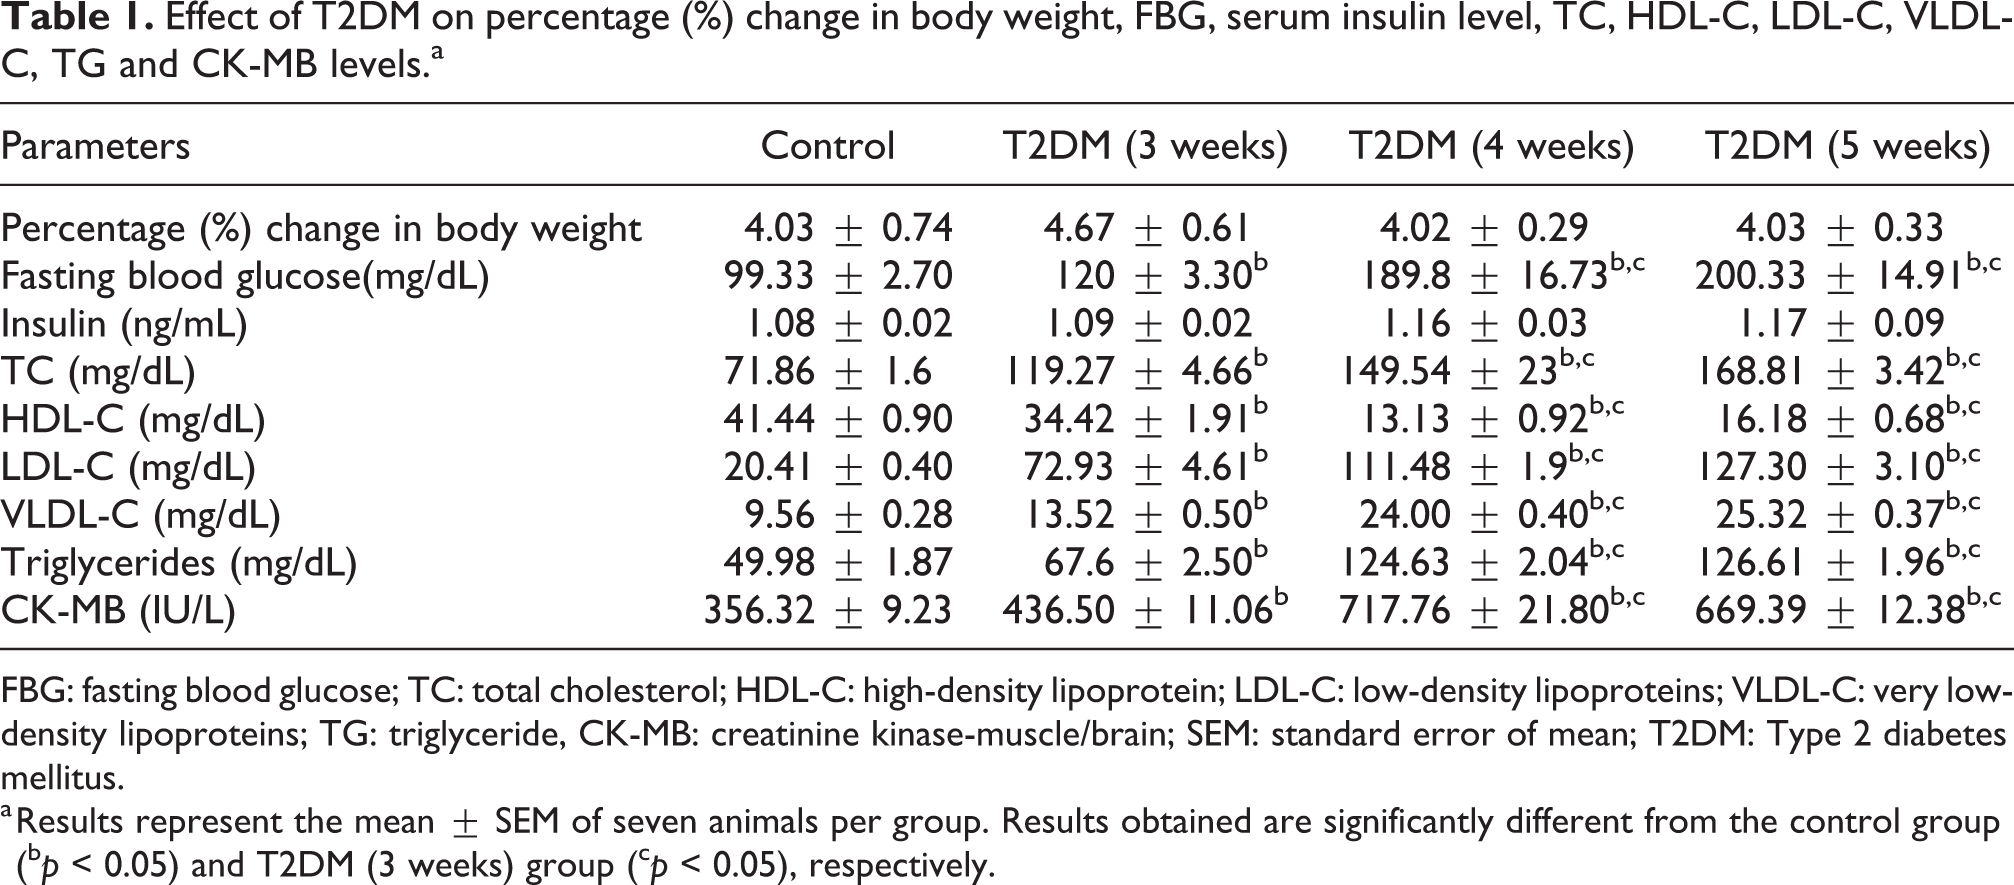
FBG: fasting blood glucose; TC: total cholesterol; HDL-C: high-density lipoprotein; LDL-C: low-density lipoproteins; VLDL-C: very low-density lipoproteins; TG: triglyceride, CK-MB: creatinine kinase-muscle/brain; SEM: standard error of mean; T2DM: Type 2 diabetes mellitus.
a Results represent the mean ± SEM of seven animals per group. Results obtained are significantly different from the control group (b p < 0.05) and T2DM (3 weeks) group (c p < 0.05), respectively.
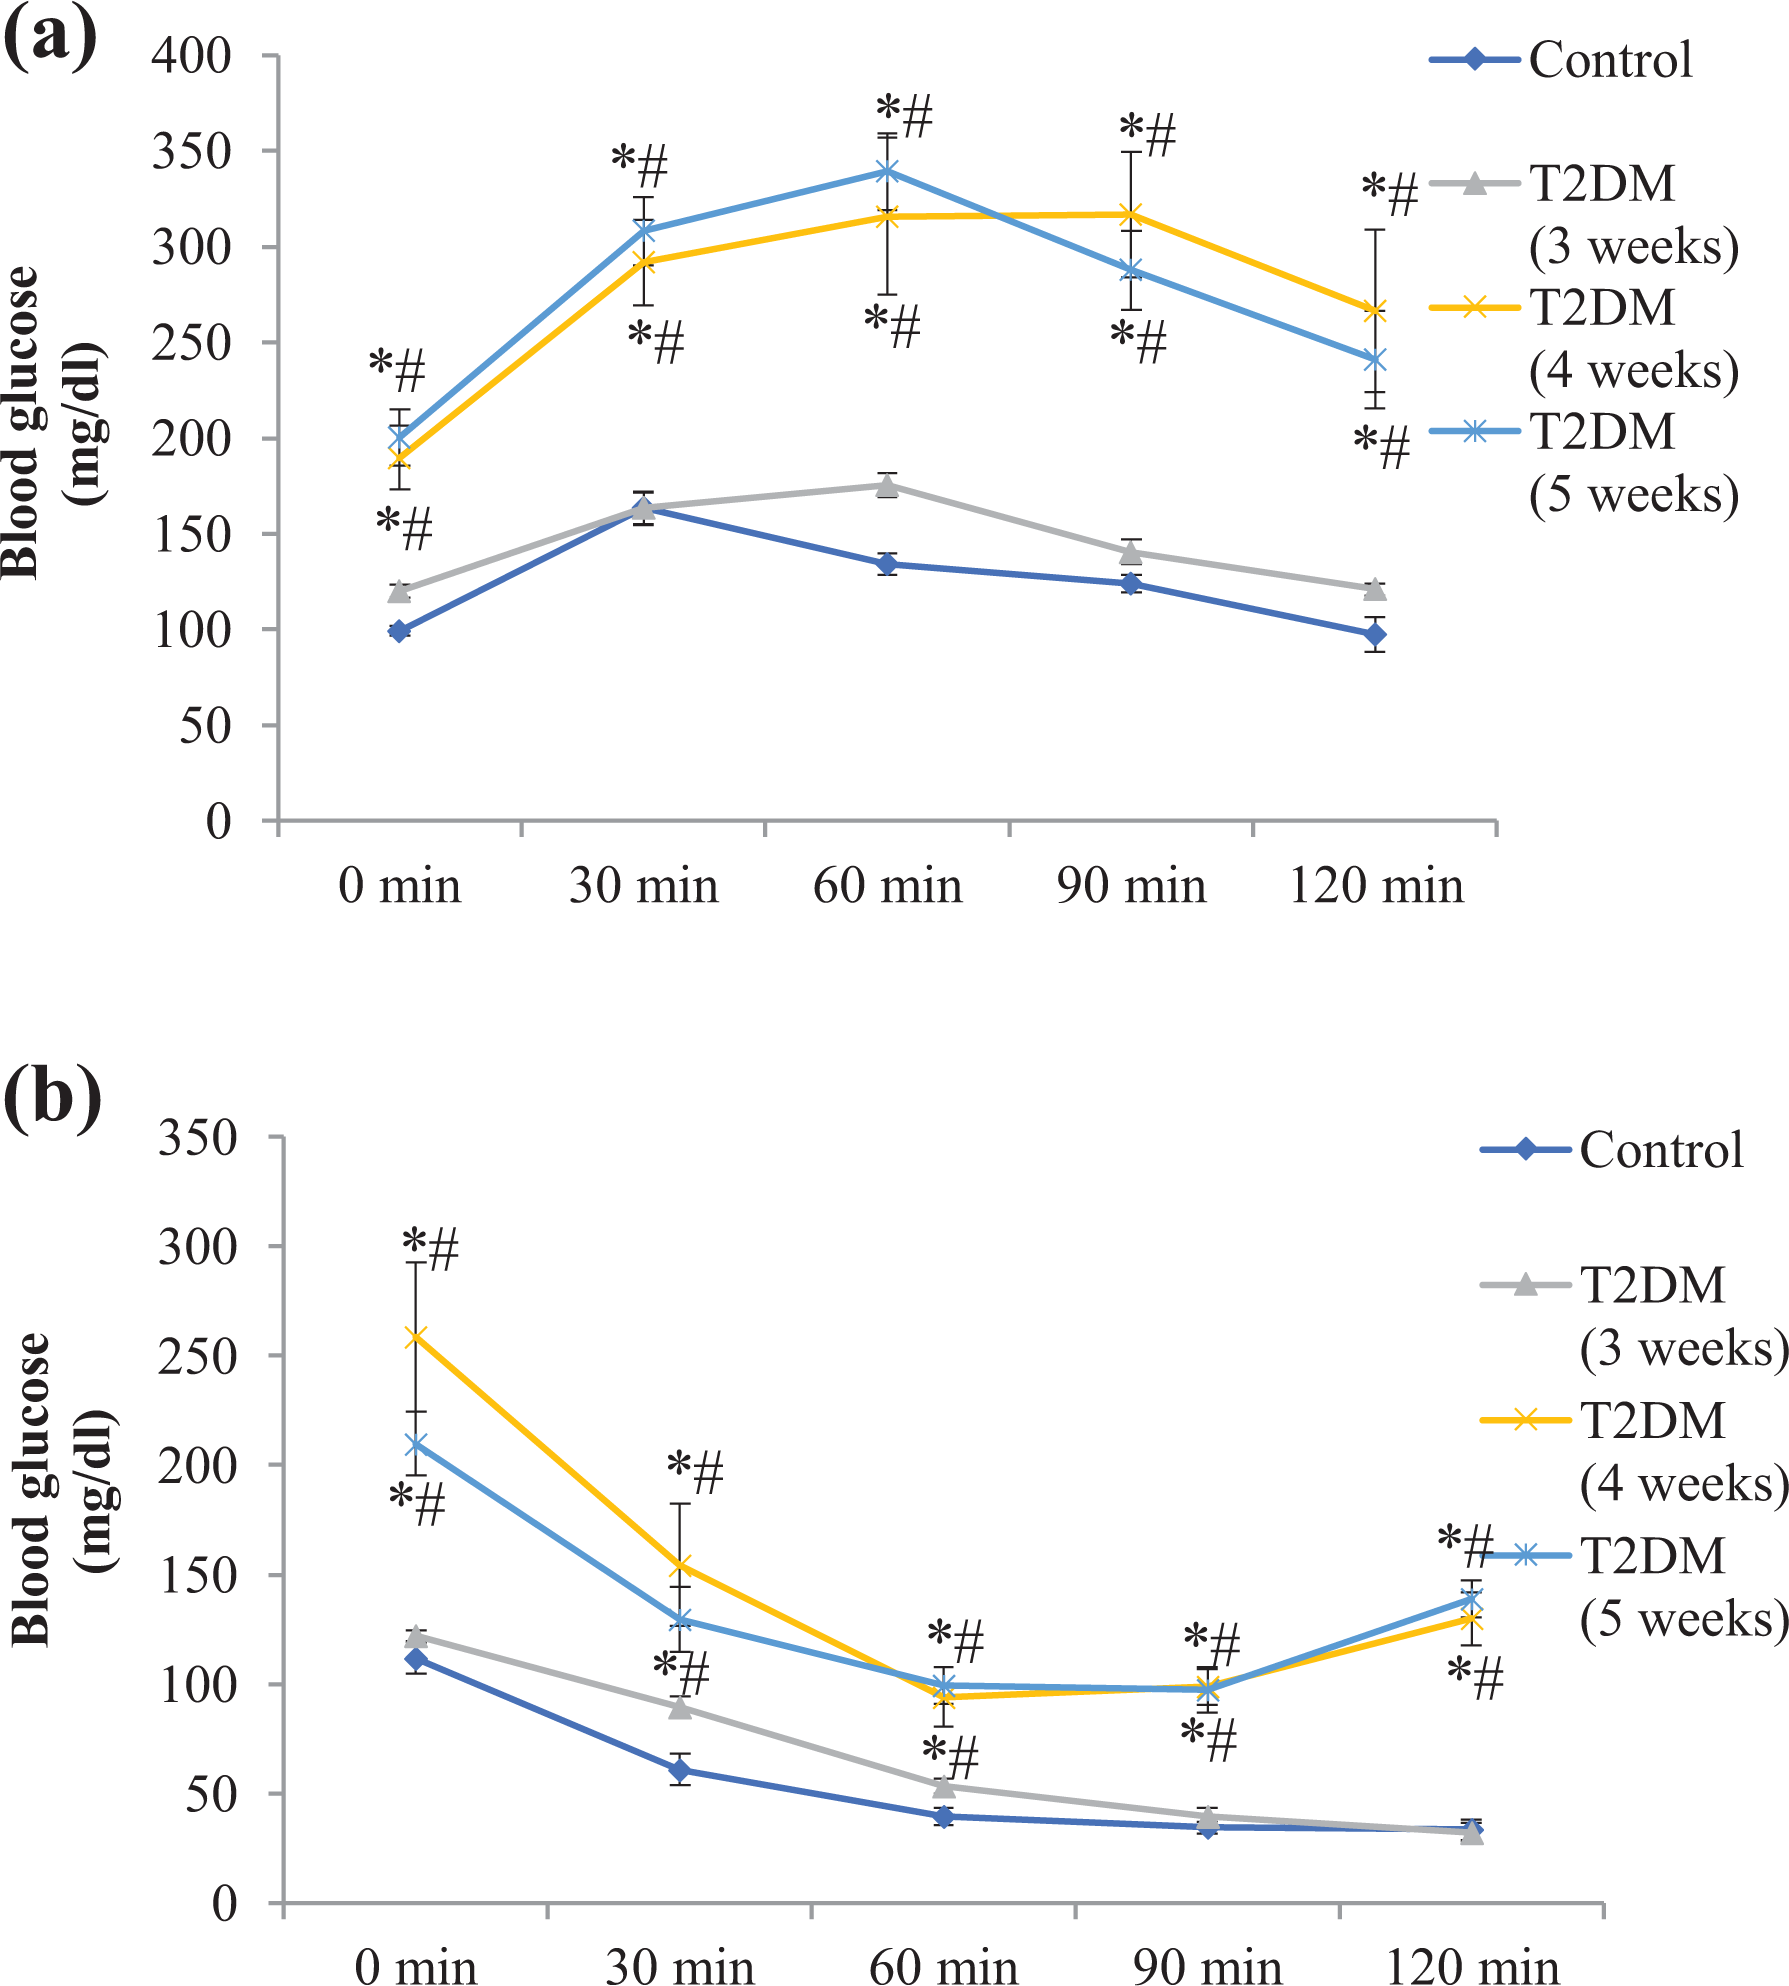
(a) Effect of T2DM on oral glucose tolerance. Results represent the mean ± SEM of seven animals per group. Results obtained are significantly different from the control group (∗p < 0.05) and T2DM (3 weeks) group (# p < 0.05), respectively. (b) Effect of T2DM on insulin sensitivity. Results represent the mean ± SEM of seven animals per group. Results obtained are significantly different from the control group (∗p < 0.05) and T2DM (3 weeks) group (# p < 0.05), respectively. T2DM: Type 2 diabetes mellitus; SEM: standard error of mean.
T2DM-induced cardiac injury and cardiac hypertrophy
The concentrations of CK-MB, a myocardial tissue injury marker was significantly increased (b p < 0.05) in rats of all the three T2DM groups (3, 4 and 5 weeks) compared to the rats of control group (Table 1). In addition to this, a significant increase in the level of serum CK-MB was observed in rats of two T2DM groups (4 and 5 weeks) in comparison to the rats of T2DM group (3 weeks). The HW/BW ratio was significantly more in rats of T2DM groups (4 and 5 weeks) in comparison to the rats of control group and was not observed in rats of T2DM group (3 weeks; Figure 2) suggesting that cardiac hypertrophy occurs with progression of disease and that cardiac injury precedes cardiac hypertrophy.

Effect of T2DM on cardiac hypertrophy index (heart weight/body weight). Results represent mean ± SEM of seven animals per group. Results obtained are significantly different from the control group (∗ p < 0.05) and T2DM (3 weeks) group (# p < 0.05), respectively. T2DM: Type 2 diabetes mellitus; SEM: standard error of mean.
T2DM-induced oxidative stress and inflammatory markers
Serum concentrations of MDA (Figure 3(a)) and TNF-α (Figure 3(b)) were found to be significantly increased (*p < 0.05) in rats of all the three T2DM groups (3, 4 and 5 weeks) (Figure 3(a) and (b)), furthermore it was noted that levels of serum MDA and TNF-α in rats of T2DM groups (4 and 5 weeks) were significantly (Figure 3(a) and (b)) more in comparison to rats of T2DM group (3 weeks). In rats of all three T2DM groups (3, 4 and 5 weeks), an increase in the expression of NADPH oxidase (Figure 3(c)(a′) to (d′)) in the cardiac tissue was noted in comparison to the rats of control group. The concentration of serum ICAM-1 (Figure 3(d)) in rats of two T2DM groups (4 and 5 weeks) was significantly increased (*p < 0.05), while in rats of T2DM group (3 weeks) the serum ICAM-1 concentration did not change (Figure 3(d)).
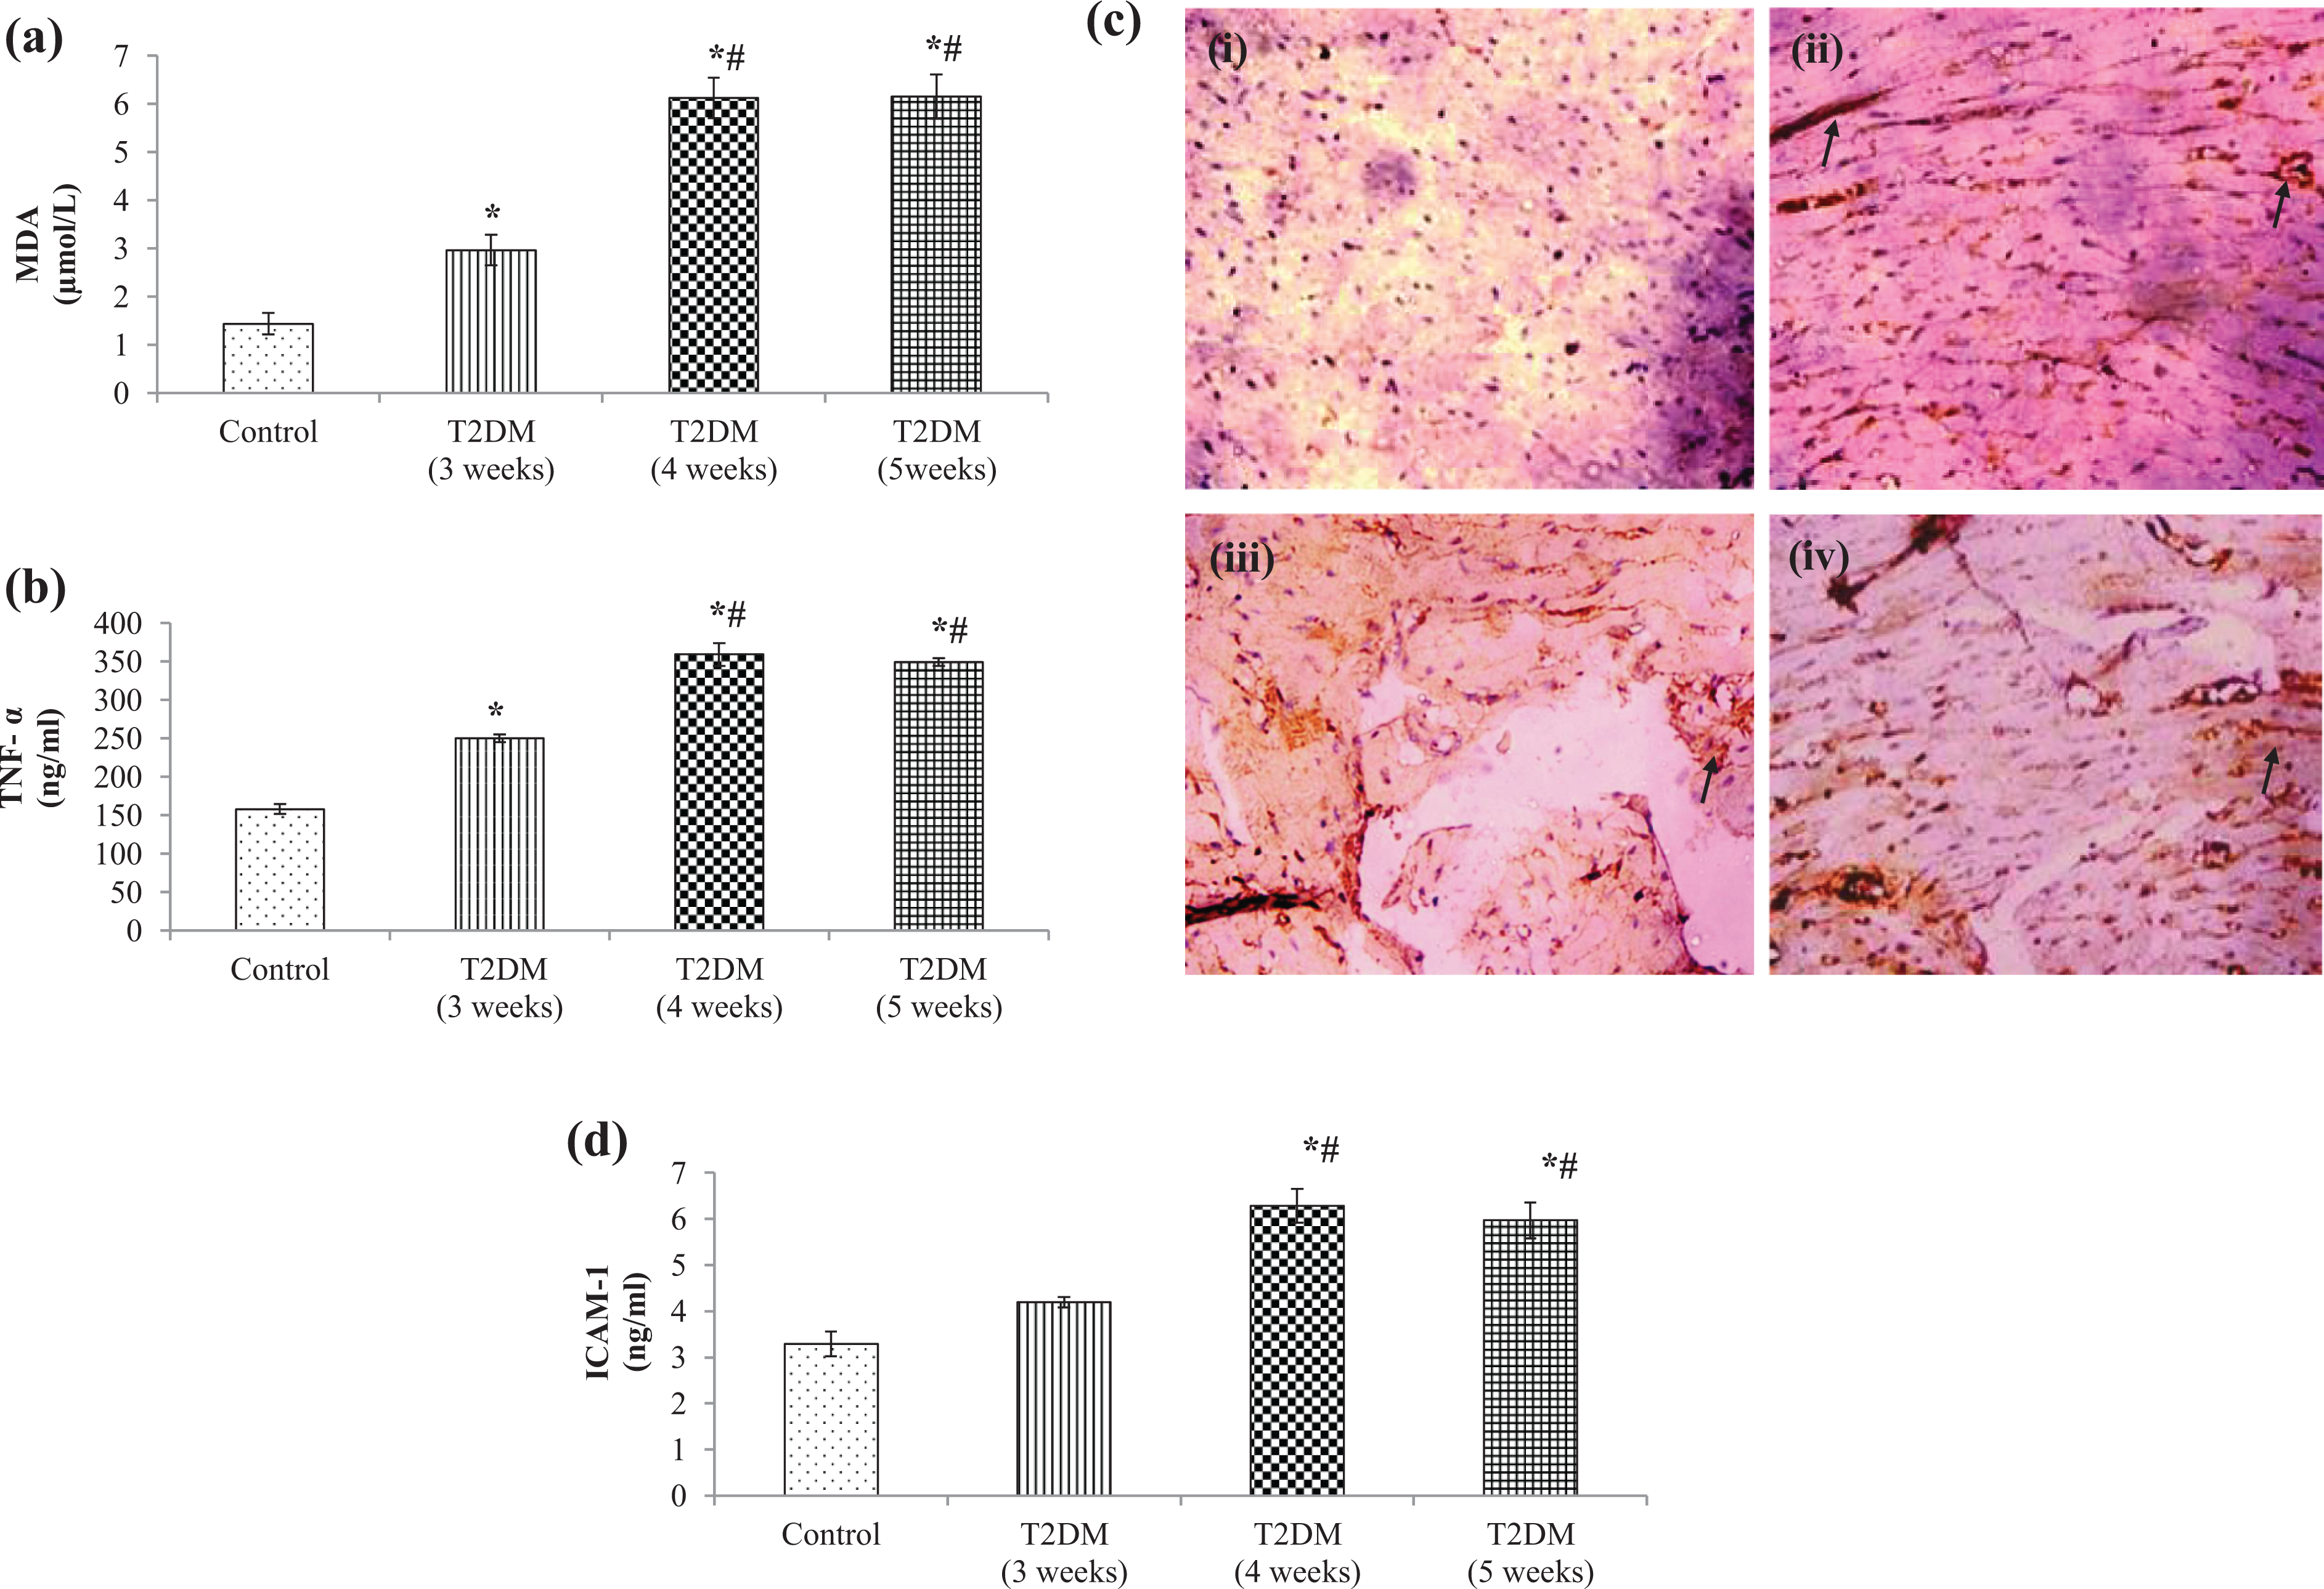
(a) Effect of T2DM on serum MDA levels. Results represent the mean ± SEM of seven animals per group. Results obtained are significantly different from the control group (∗p < 0.05) and T2DM (3 weeks) group (# p < 0.05), respectively.(b) Effect of T2DM on serum TNF-α levels. Results represent the mean ± SEM of seven animals per group. Results obtained are significantly different from the control group (∗p < 0.05) and T2DM (3 weeks) group (# p < 0.05), respectively. (c) Effect of T2DM on NADPH oxidase (photomicrographs) immunostained cardiac sections of (a′) control group showing weak immune reaction in myocardium, (b′) T2DM (3 weeks) group showing immune-positive reactions in myocardium, (c′) T2DM (4 weeks) group and (d′) T2DM (5 weeks) showing wide patches of strong immune-positive reactions in the inflammatory cells and surrounding myocardium. (d) Effect of T2DM on serum ICAM-1 levels. Results represent the mean ± SEM of seven animals per group. Results obtained are significantly different from the control group (∗p < 0.05) and T2DM (3 weeks) group (# p < 0.05), respectively. T2DM: Type 2 diabetes mellitus; MDA: malondialdehyde; SEM: standard error of mean; NADPH: nicotinamide adenine dinucleotide phosphate hydrogen; TNF-α: tumour necrosis factor-α; ICAM-1: intracellular adhesion molecule-1.
Cardiac adiponectin expression
In rats of two T2DM groups (4 and 5 weeks), a decrease in the expression of adiponectin (Figure 4(c) and (d)) in the cardiac tissue was noted in comparison to the rats of control group and T2DM group (3 weeks; Figure 4(a) and (b)).

Adiponectin (photomicrographs) immunostained cardiac sections of (a) control group showing strong immune-positive reactions in myocardium, (b) T2DM (3 weeks) showing weak immune-positive reactions in myocardium, (c) T2DM (4 weeks) and (d) T2DM (5 weeks) groups showing immune-negative reactions in myocardium. T2DM: Type 2 diabetes mellitus.
Effect of T2DM on haemodynamic and ventricular functions
In rats of all the T2DM groups (3, 4 and 5 weeks), SBP, diastolic blood pressure (DBP), mean arterial pressure (MAP), and pulse pressure (PP) were found to be similar, while the HR was seen to be significantly (*p < 0.05) decreased only in rats of two T2DM groups (4 and 5 weeks; Table 2), which suggest the compensatory activation of the sympathetic nervous system in T2DM.
Effect of T2DM on haemodynamic parameters: SBP, DBP, MAP, PP, HR and left ventricular functions: LVPmax, LVPmin, LV(dP/dt)max, LV(dP/dt)min, LV(dP/dt)max/LVP and LVEDP.a
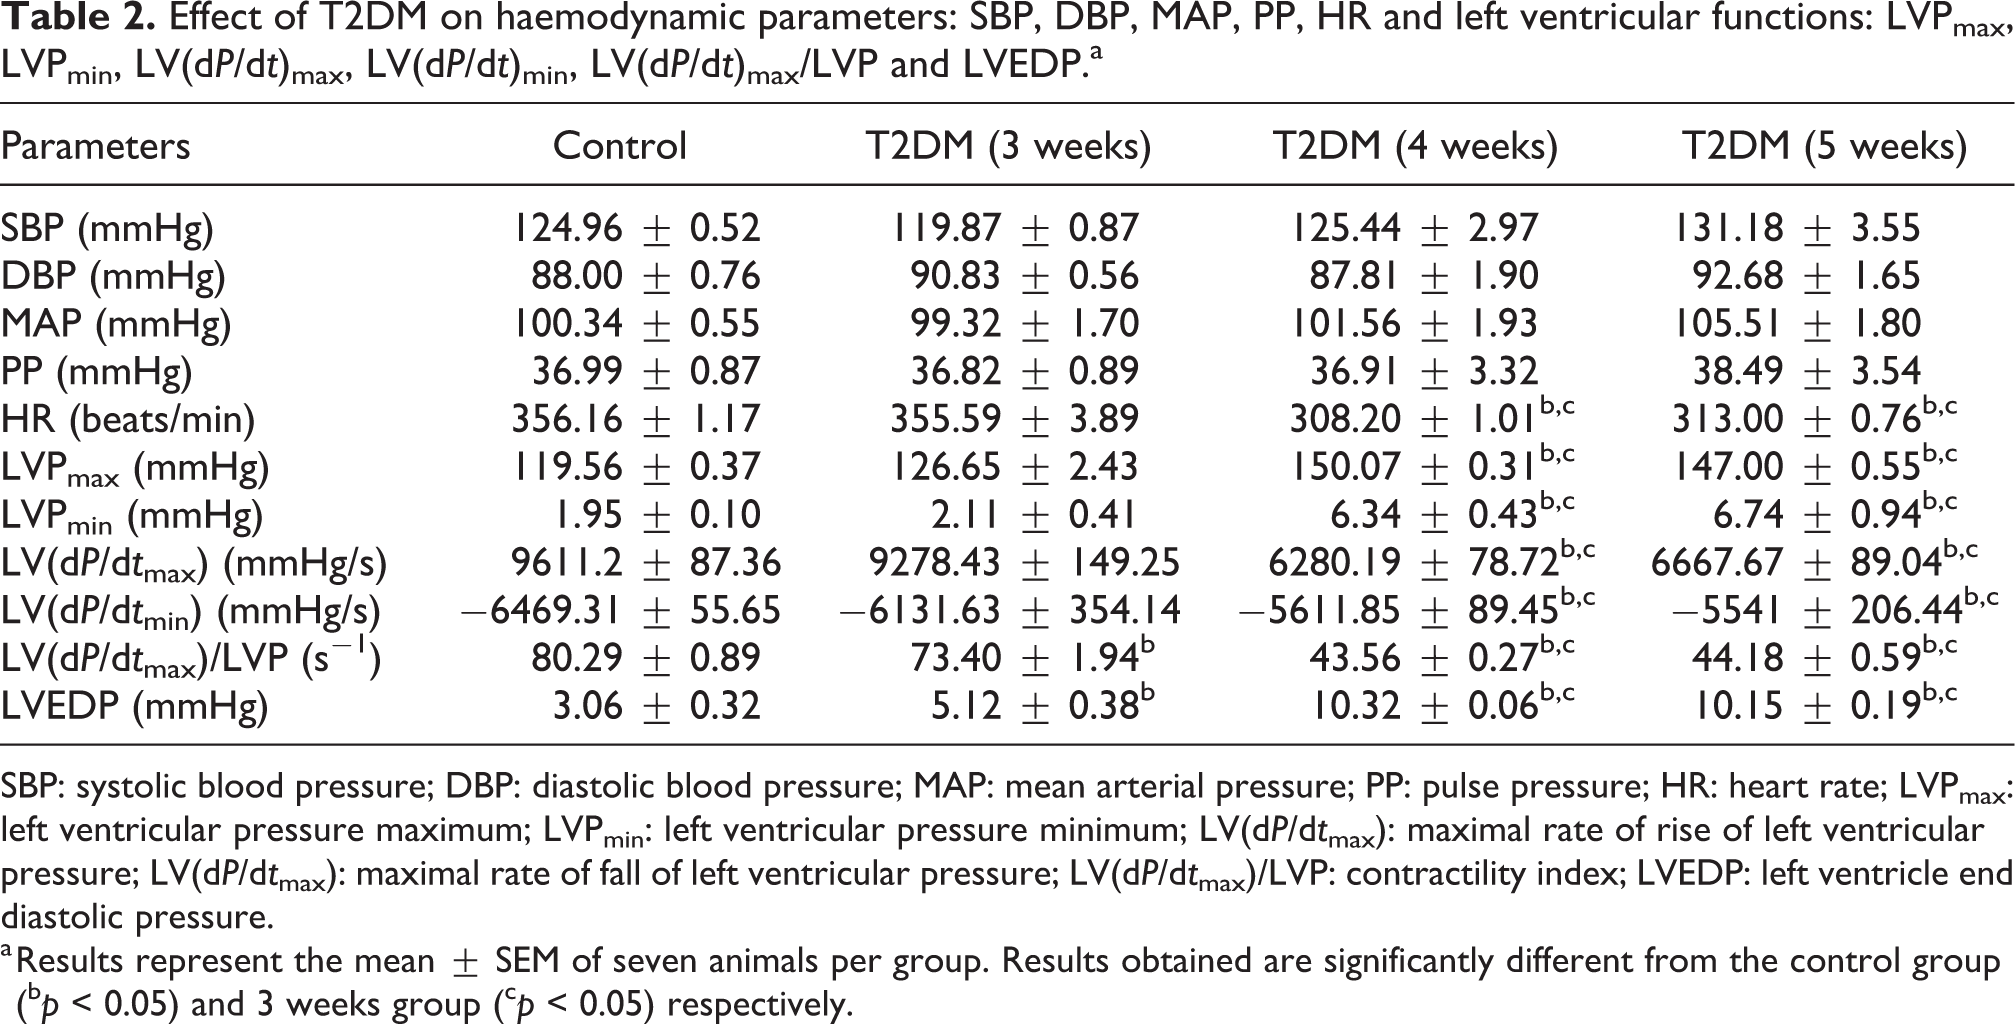
SBP: systolic blood pressure; DBP: diastolic blood pressure; MAP: mean arterial pressure; PP: pulse pressure; HR: heart rate; LVPmax: left ventricular pressure maximum; LVPmin: left ventricular pressure minimum; LV(dP/dt max): maximal rate of rise of left ventricular pressure; LV(dP/dt max): maximal rate of fall of left ventricular pressure; LV(dP/dt max)/LVP: contractility index; LVEDP: left ventricle end diastolic pressure.
a Results represent the mean ± SEM of seven animals per group. Results obtained are significantly different from the control group (b p < 0.05) and 3 weeks group (c p < 0.05) respectively.
LVEDP was significantly increased (*p < 0.05) in rats of all T2DM groups (3, 4 and 5 weeks) in comparison to rats of control group (Table 2). In addition, LVEDP was observed to be significantly higher in rats of T2DM groups (4 and 5 weeks; Table 2). This increase in LVEDP may be a consequence of the depression of the left ventricular performance that occurs after T2DM-induced cardiac injury (Table 2). LVPmax, LVPmin, maximal rate of rise of left ventricular pressure (LV(dP/dt)max) and maximal rate of fall of left ventricular pressure (LV(dP/dt)min) were found to be significantly elevated in only T2DM groups (4 and 5 weeks) compared to rats of control group and T2DM group (3 weeks; Table 2) indicating that onset of ventricular dysfunction/myocardial dysfunction begins after 3 weeks HFD feeding and sets in after 4 weeks of HFD feeding.
Baroreflex sensitivity index
A marked reduction in baroreflex sensitivity to PE and SNP was noted in rats of T2DM groups (4 and 5 weeks, respectively) as a significant (*p < 0.05) fall in both reflex bradycardia (Figure 5(a)) and tachycardia (Figure 5(b)) were observed. However, in rats of T2DM group (3 weeks), change in baroreflex sensitivity was not observed (Figure 5(a) and (b)).

(a) Effect of T2DM on Baroreflex sensitivity to phenylephrine (vasoconstrictor). Results represent mean ± SEM of seven animals per group. Results obtained are significantly different from the control group (∗p < 0.05) and T2DM (3 weeks) group (# p < 0.05), respectively. T2DM: Type 2 diabetes mellitus; SEM: standard error of mean.
Discussion
Our results for the first time demonstrate that 4 and 5 weeks of HFD feeding and low-dose STZ cause a decrease in cardiac adiponectin expression which may be the precipitating factor for development of cardiac dysfunction in T2DM animal model. We have developed and characterized for the first time two new rat models of T2DM (4 and 5 weeks) with cardiac dysfunction, which closely replicates the onset and advanced stage of T2DM with cardiac dysfunction.
Diabetes has been reported as a defined risk factor of cardiovascular disease in both sexes of the human population. 17 In the present study, 60–72-week-old rats of either sex were used, which corresponds with 40–45 years of human age. 18 Variation in the duration of HFD feeding (3, 4 and 5 weeks) to the experimental rats with fixed dose of STZ was responsible for two different animal models. The animal model of onset of T2DM with cardiac dysfunction was characterized by mild hyperglycaemia, normoinsulinaemia, hypercholesterolaemia, oxidative stress, mild cardiac injury beginning of ventricular dysfunction without cardiac hypertrophy and no change in adiponectin expression and baroreflex sensitivity giving us an insight that changes in cardiac function occur after 3 weeks feeding of HFD. To see the role of cardiac adiponectin in T2DM-induced cardiac dysfunction, we extended the duration of HFD feeding to 4 and 5 weeks which resulted in decreased cardiac adiponectin expression in association with severe hyperglycaemia, significant reduction in glucose tolerance and insulin sensitivity accompanied by normoinsulinaemia (characteristic of T2DM), dyslipidaemia, cardiac injury, cardiac hypertrophy and left ventricular dysfunction along with altered baroreflex.
In our study, the rats of all the three T2DM groups (3, 4 and 5 weeks) did not maintain the percentage change in BW gain though an initial percentage change in weight gain was observed. Previous studies have also reported no change in BW in animal model of T2DM at low doses of STZ (25, 20 and 15 mg/kg) after being fed HFD for 3 weeks and weight loss has been reported in previous studies only in rats, given a high dose of STZ. 12,19 The fact that increased blood glucose concentration and insulin resistance was demonstrated in rats of two T2DM groups (4 and 5 weeks) without impaired insulin secretion, which normally occurs in insulin resistance in the progression of diabetes may be due to an initial compensatory increase in insulin secretion in response to insulin resistance which is then followed by a decrease in insulin concentration. 20 Furthermore, earlier studies have also shown that low dose of STZ mildly impairs the function of the β-cell without completely compromising insulin secretion while HFD causes impaired insulin sensitivity, resulting in a moderate impairment in the glucose tolerance. 19 It is suggested that in the present study prolonged HFD feeding (4 and 5 weeks) increased insulin secretion which was later negated by STZ administration.
In our study, dyslipidaemia, a characteristic of T2DM which indirectly causes cardiovascular dysfunction, 21 developed in the rats of all T2DM groups (3, 4 and 5 weeks). The severity of dyslipidaemia was more in T2DM groups (4 and 5 weeks) signifying that duration of high-fat feeding is correlated to severity of dyslipidaemia and subsequently to insulin resistance. Adipose tissue is specialized for triglyceride storage and has a very high capacity to accumulate TG. Thus, the enhanced lipolysis and consequent free fatty acid flux from adipose tissue in HFD fed rats exposes other tissues to a substantial fatty acid burden. 22,23
These other tissues can accumulate TG, and this is associated with cell pathology and insulin resistance. The increased concentration of free fatty acids (FFAs) and its metabolic products incite the formation and accumulation of toxic FA intermediates (such as ceramide and diacylglycerol). Strong evidence supports a role for diacylglycerol in the blunting of insulin signalling 24 and in promoting the formation of the reactive oxygen species (ROS). 25,26 ROS may aggravate cardiac lipotoxicity and lead to cardiac dysfunction. 27 In rats of all the three T2DM groups, the serum MDA concentrations and cardiac NADPH oxidase expression were significantly increased. However, it was seen that oxidative stress was significantly greater in T2DM groups (4 and 5 weeks) suggesting toxic role of oxidative stress in the progression of diabetes-induced cardiac dysfunction. Oxidative stress has been observed in adipose tissue in obese animal before the development of diabetes which suppresses adiponectin production. 28 Previous studies have noted that adiponectin also suppresses the generation of oxidative stress by suppression of NADPH oxidase, in an adenosine monophosphate (AMP)-activated protein kinase (AMPK) (a stress-responsive kinase) independent manner. 29 Oxidative stress is also one of the inducing factors in promoting inflammation within the vascular wall and causing cardiac injury and promoting cardiac hypertrophy. 30,31
The cardiac adiponectin expression decreased only in two T2DM groups (4 and 5 weeks). Adiponectin regulates metabolism and insulin sensitivity, by phosphorylation and activation of AMPK. AMPK in response to various intra- and extracellular stimuli modulates fatty acid uptake, oxidative metabolism, glucose transport, glycolysis and mitochondrial biogenesis. Adiponectin’s actions in the setting of cardiac hypertrophy can be recognized by its ability to modulate intracellular growth signals in myocardial cells by the AMPK pathway. Adiponectin activates AMPK, which prevents the hypertrophic response to stimulation. 32 The anti-hypertrophic/cardioprotective actions of adiponectin on AMPK occur by the adiponectin receptors AdipoR1 and R2 33 which are expressed on cardiac tissue. 34
In corroboration with our results of cardiac adiponectin expression, it was seen that cardiac hypertrophy did not occur at the onset of diabetes (3 weeks) despite cardiac injury. Cardiac hypertrophy was seen only in two T2DM groups (4 and 5 weeks). Hypertrophy is an adaptive response to cardiac insult or injury and occurs due to overexpression of hypertrophic genes, β-myosin heavy chain, atrial natriuretic peptide, brain natriuretic peptide 35 and due to an increase in water content, development of oedema in the intramuscular spaces, extensive necrotic changes and invasion of inflammatory cells. 36 Decreased cardiac adiponectin in diabetes in the present study may have resulted in a reactive hypertrophic adaptation of viable myocytes as low level of adiponectin does not activate AMPK. 32 Cardiovascular injury, decreased adiponectin and hyperglycaemia stimulated NADPH oxidase which then aggravated oxidative stress and caused the release of the pro-inflammatory cytokine (TNF-α) and consequently ICAM-1 causing cardiac dysfunction. 37,38 Although cardiac NADPH oxidase expression and serum TNF-α level increased at the onset of diabetes (3 weeks), but it was less severe and serum ICAM-1 concentration were similar to control, hence, it is proposed that as the cardiac adiponectin expression did not alter, the stimulation may have not been enough to induce ICAM-1 at the onset of diabetes. As the disease progresses, severity of hyperglycaemia due to insulin resistance decreased adiponectin results in enhanced dyslipidaemia and oxidative stress causing an increase in serum TNF-α inducing ICAM-1 concentration, resulting in cardiac hypertrophy.
Our study also did not find changes in arterial blood pressure (SBP, DBP, MAP and PP) in rats of all the T2DM groups (3, 4 and 5 weeks). However, HR significantly decreased only in two T2DM groups (4 and 5 weeks). This significant decrease in HR can be attributed to change in the sinoatrial node activity, 39 autonomic dysfunction indicated by increase in vagal tone or decline in sympathetic tone 40 or metabolic injury to pacemaker cells and cardiac hypertrophy. 41 Other studies have also demonstrated that a combination of high-fat feeding and low-dose STZ increases diastolic wall stress and arterial stiffness, similar to patients with T2DM. 42 Increased LVEDP which denotes left ventricle function was found to be significantly higher only in two T2DM groups (4 and 5 weeks) in comparison to T2DM group (3 weeks) rats. Our study further showed that myocardial contractility decreased only in rats of two T2DM groups (4 and 5 weeks) indicating an increased preload or incomplete emptying of the left ventricle and impaired left ventricular performance, which may be due to cardiac hypertrophy or conversely as seen in myocardial infarction and heart failure. 43
The bradycardia and tachycardia reflex responses to arterial pressure changes were observed to be significantly reduced only in two T2DM groups (4 and 5 weeks), and no change was seen in BRS of T2DM group rats (3 weeks) indicating that changes in BRS are correlated with decreased cardiac adiponectin expression and occur in later stages in the progression of T2DM disease. 44 The decreased cardiac adiponectin expression and increased cardiac NADPH oxidase expression causes oxidative stress, 45 increased serum TNF-α and ICAM-1 which induces cardiac hypertrophy 46 resulting in significant reduction in BRS by reducing the cardiovagal baroreflex control of sympathetic nerve activity. 45,47
Conclusion
In summary, our results demonstrate that in animal model of T2DM with cardiac dysfunction at the onset of disease (T2DM: 3 weeks) cardiac adiponectin expression does not alter. Extended feeding of HFD (4 and 5 weeks) causes progression of disease with a decrease in cardiac adiponectin expression. Decrease in cardiac adiponectin results in oxidative stress and inflammation inducing cardiac hypertrophy and decreased cardiac function.
Supplemental material
Supplemental Material, Supplimentry_file_Composition_of_HFD_2 - Adiponectin in onset and progression of T2DM with cardiac dysfunction in rats
Supplemental Material, Supplimentry_file_Composition_of_HFD_2 for Adiponectin in onset and progression of T2DM with cardiac dysfunction in rats by C Gupta, P Bubber, M Fahim, B Saidullah and S Omanwar in Human & Experimental Toxicology
Footnotes
Declaration of conflicting interests
The author(s) declared no potential conflicts of interest with respect to the research, authorship, and/or publication of this article.
Funding
The author(s) received no financial support for the research, authorship, and/or publication of this article.
Supplemental material
Supplemental material for this article is available online.
References
Supplementary Material
Please find the following supplemental material available below.
For Open Access articles published under a Creative Commons License, all supplemental material carries the same license as the article it is associated with.
For non-Open Access articles published, all supplemental material carries a non-exclusive license, and permission requests for re-use of supplemental material or any part of supplemental material shall be sent directly to the copyright owner as specified in the copyright notice associated with the article.