
Abstract
The present study focused on the role of peroxisome proliferator–activated receptor-gamma (PPAR-γ) activation on renal oxidative damages, serum visfatin, and advanced glycation end products (AGEs) in high-fat diet (HFD)-induced type 2 diabetes mellitus. Following the institutional animal ethics committee guidelines, Wistar rats were categorized into five groups: group 1: fed on a normal rat diet; group 2: HFD-induced obese rats (HFD for 8 weeks); group 3: HFD-fed rats treated with rosiglitazone (RSG; 3 mg/kg orally for 7 days); group 4: T2DM rats induced by HFD and low dose of streptozotocin (i.p. 35 mg/kg); group 5: T2DM rats treated with RSG (3 mg/kg orally for 7 days). Serum levels of AGEs and visfatin, renal damage, and oxidative stress were analyzed. Results showed that HFD-induced obesity and T2DM caused an elevated blood glucose, serum AGEs, visfatin, insulin, urea, creatinine, and tissue malondialdehyde, whereas a decreased catalase and superoxide dismutase activity were observed. The PPAR-γ activation via agonist restored these changes. Our findings suggest that AGEs and visfatin possess an important role in the progression of renal oxidative stress, which can be reduced by the PPAR-γ agonist that impede deleterious effects of HFD and HFD-induced T2DM on renal damage.
Introduction
The incidence and prevalence of obesity have increased worldwide. Obesity is associated with a large number of health ailments that escalated morbidity and mortality. 1,2 Epidemiological evidence revealed that a high-fat diet (HFD) intake and a lack of physical activity enhanced the development of obesity. Accumulation of subcutaneous and visceral body fat results in hypertrophy of adipocyte and infiltration of macrophage into the adipose tissue. It provokes insulin resistance, chronic inflammation, and impairment of glucose and lipid metabolism by inhibiting insulin signaling pathway in target organs like liver and skeletal muscle. 3,4
Adiposity is a well-recognized risk factor for type 2 diabetes, which is distinguished by a gradual decrease in insulin action (insulin resistance), and makes the β-cells unable to counteract insulin resistance leading to hyperglycemia and other metabolic disturbances. 5 There are various mechanisms that link the obesity and type 2 diabetes mellitus (T2DM) to these metabolic disturbances, and one of them is oxidative stress which causes vascular complications of diabetes. 6 –8 It has been proved by several studies that oxidative stress has a vital role in the progression of diabetes and diabetes-related comorbidities. 9 Increased generation of reactive oxygen species (ROS) in diabetes is due to abnormal metabolism of glucose and free fatty acid (FFA) through multiple pathways, 10 and imbalance in antioxidant defense system is the key cause for precipitation of diabetic renal diseases. 11 Diabetes-induced hyperglycemia is responsible for nonenzymatic glycation of intracellular and extracellular proteins which expedite advanced glycation end products (AGEs) formation. AGEs bind to their cellular receptors and play a vital role in the progression of several diabetic vascular complications. 12
Visfatin is considered as an important adipokine secreted by visceral adipose tissues and also synthesized by renal glomerular mesangial cells. 13,14 Several studies have demonstrated the elevated visfatin level in obesity and T2DM. 15,16 Song et al. revealed that visfatin levels were increased in renal glomerular mesangial cells by increased stimulation of glucose uptake. Studies also showed that visfatin treatment increased the synthesis of profibrotic molecules. Oxidative stress was suggested to have an important role in the progression of diabetic nephropathy. 10 Oxidative stress was also reported to be elevated in vascular endothelium and skeletal muscles after exogenous administration of visfatin. 17 –19 From the above mentioned literature review, it can be hypothesized that visfatin plays a vital role in oxidative stress–induced diabetic nephropathy.
Peroxisome proliferator–activated receptor-gamma (PPAR-γ) has previously been considered as a therapeutic target for the cure of metabolic disorders and renal diseases like diabetic nephropathy, glomerulosclerosis, glomerulonephritis, and hypertensive nephropathy. Emerging evidence suggested that PPAR-γ agonist exerts protective effects on renal damage and improves the renal damage by effectively inhibiting oxidative stress, inflammatory response, apoptosis in the central nervous system, and insulin resistance. 20 –22 PPAR-γ agonist also improves metabolic abnormalities of diabetes and diabetic nephropathy. 22,23
Thiazolidinedione is the class of insulin sensitizer including pioglitazone and rosiglitazone (RSG), which are the PPAR-γ agonists that reportedly suppress NADPH oxidase activity and ROS generation in animal models and humans. 24 It possesses an effective role in the management of T2DM. 25,26
This study thus aimed to determine the role of Visfatin and AGEs in the development of diabetic nephropathy and to evaluate that the PPAR-γ activation by RSG reduces renal damage induced by obesity and T2DM through modulation of antioxidant enzymes activity.
Materials and methods
Animals
Fifty male Wistar albino rats (3–4 weeks of age) with body weight of 180 ± 20 g were purchased from International Center for Chemical and Biological Sciences (ICCBS), University of Karachi (Karachi, Pakistan). The rats were maintained at an ambient temperature (23 ± 4°C) with 12-h light–dark cycles and habituated to housing conditions for 1 week before the experiment. Rats were given ad libitum access to food and water.
Preparation of normal and HFD
Normal rat chow was prepared according to Kim et al. 27 It comprised of 65% carbohydrate (60% starch + 5% sucrose), 5% fat (soya bean oil), 20% protein (casein), 5% vitamins and minerals, 5% fiber (barn), and metabolic energy of this diet is 2813 kcal/kg with 8% from fat. HFD was prepared by following the method of Khalifa et al. HFD comprised of 7% wheat flour, 4% bran, 30% casein, 10% glucose, 6% common salt, 3% vitamin mixture, and 40% raw melted beef fat to make palettes. Almost 54% of the calories from this diet were from fat contents. 28
HFD/streptozotocin animal model of type 2 diabetes
HFD/streptozotocin (STZ) animal model mimicking human type 2 diabetes was designed according to Luo et al. 29 Briefly rats were fed on HFD for 4 weeks and injected a single low dose of STZ (35 mg/kg i.p. in 0.1 M citrate buffer pH 4.5) purchased from Calbiochem, Germany, and continued feeding on HFD for next 4 weeks. HFD for 8 weeks has been used to model the insulin resistance and metabolic syndrome that mimics human type 2 diabetes. A single low dose (i.p. 35 mg/kg body weight) of STZ did not destroy all of the β-cells but killed some of them to render the rats become hyperglycemic. 30,31 Blood glucose level was regularly monitored via tail vein using commercially available glucometer. The animals having blood glucose level more than 250 mg/dl confirming T2DM were included in the experiment. All the animals (groups 4 and 5) used in the experiment developed HFD/STZ-induced T2DM and had blood glucose levels ≥250 mg/dl.
Experimental design
Fifty animals were categorized into five experimental groups (n = 10).
Group 1: Control group, untreated, and fed with normal lab diet.
Group 2: HFD-fed obese group, received HFD daily for 8 weeks, and received equal volume of water by an intragastric tube as a vehicle for RSG (purchased from Sigma-Aldrich, St. Louis MO) for 7 days.
Group 3: HFD-fed obese + RSG-treated group, received HFD daily for 8 weeks, and then received PPAR-γ agonist (RSG) (3 mg/ml/kg body weight) in water daily for last 7 days through an intragastric tube. 32
Group 4: T2DM group, received HFD daily for 8 weeks and a single low dose of STZ injection (in citrate buffer pH 4.5, i.p. 35 mg/ml/kg body weight) 29 and water by an intragastric tube as a vehicle for RSG for 7 days.
Group 5: T2DM + RSG-treated group, received HFD daily for 8 weeks and a low dose of STZ injection (in citrate buffer pH 4.5, i.p. 35 mg/ml/kg body weight), and then treated with PPAR-γ agonist (RSG) (3 mg/kg body weight) in water daily for last 7 days using an intragastric tube.
The study design was approved by the Institutional Animal Ethics Committee (KU-0253/2016), Department of Biochemistry, University of Karachi and follows the principles of the Declaration of Helsinki. Animals from all experimental groups were weighed and their food intake with normal activity was regularly monitored every week.
Sample collection
Animals were fasted overnight and decapitated after 24 h of last dose of treated groups by cervical dislocation. The blood sample was collected in the heparinized tubes and centrifuged at 3000 r min−1 for 10 min to collect the plasma. Kidneys were excised, rinsed with ice cold saline, dried, weighed, and stored at −70°C for biochemical estimations.
Anthropometrical determinations
Anthropometrical determination was carried out by measuring the body weight (g) and body length (nose-to-anus, cm) of individual animal. 33
Body mass index (BMI) was calculated by dividing the body weight (g) of the rats by square of the length (cm, nose-to-anus). 33

Lee index was estimated by dividing the cube root of body weight (g) by nose-to-anus length of the rats. 33

The difference in body weight of each rat was calculated and expressed as a percentage change as 33

Estimation of blood glucose
Weekly random and fasting blood glucose levels were measured using commercially available glucometer (On Call EZ II ACON laboratories, Inc., USA) from the tail vein.
Estimation of serum insulin level
Serum insulin levels were determined by using a commercially available ELISA kit for determination of rat insulin (Lifespan Bioscience Inc., Washington, USA). Briefly, in a microplate, serum sample with enzyme conjugate was incubated with specific anti-insulin antibody to form complex with specific anti-insulin antibody and then substrate tetramethylbenzidine was added to detect bound conjugate. Absorbance was measured spectrophotometrically at 450 nm using Biochrom Anthos 2010, Microplate Reader (Cambridge, England).
Estimation of serum visfatin levels
The serum visfatin level was estimated by commercially available enzyme immunoassay kits (Bioassay Technology Laboratory, Shanghai, China), with the aid of an ELISA reader Bio Tek ELX800TM (Winooski, VT, USA).
Estimation of serum AGEs levels
The serum AGEs level was estimated by commercially available enzyme immunoassay kits (Bioassay Technology Laboratory, Shanghai, China), with the aid of an ELISA reader Bio Tek ELX800TM (USA).
Estimation of plasma urea and creatinine
Plasma levels of urea were quantified by following the method of Butler et al., 34 and the creatinine levels in plasma were determined by Jeff’s method. 35
Preparation of kidney homogenate
Kidney tissue homogenate (1:10 w/v) was prepared in 100 mmol KCl buffer (pH: 7) by using homogenizer. Homogenate was then centrifuged at 600 g for 60 min at 4°C. The supernatant was collected and used for biochemical estimations. 36
Estimation of renal oxidative stress biomarkers
The malondialdehyde (MDA) level in tissue homogenate is a measure of lipid peroxidation. The principle of the method is based on determining the thiobarbituric acid reacting substance, by measuring the absorbance at 530 nm according to the method of Okhawa et al. 37 CAT activity in the kidney homogenate was quantified by the method of Sinha et al. Changes in absorbance were recorded at 570 nm spectrophotometrically. 38 Superoxide dismutase (SOD) level was measured according to the method of Kono. Percent inhibition in the NBT reduction rate was recorded per minute spectrophotometrically at 560 nm. 39 Glutathione reductase activity in tissue homogenates was quantified according to the method of Calberg and Manerwick. 40
Statistical analysis
Results were presented as mean ± SD. Data were tested for statistically significant differences using SPSS 19.0 version (Armonk, NY: IBM Corp.). One-way analysis of variance (ANOVA) was used for multiple comparisons followed by Tukey test for post hoc analysis and significance was accepted at p < 0.05. Pearson Correlation was estimated to find out the association between Serum visfatin, AGEs, and oxidative stress biomarkers in control, HFD, HFD + RSG-treated, T2DM, and T2DM + RSG-treated groups, where (p) and (r) values were recorded.
Results
Anthropometrical determination in control, HFD, T2DM, and effects of PPAR-γ agonist (RSG) treatment on HFD and HFD/STZ-induced T2DM
Table 1 shows the anthropometric indices of control, HFD-fed, and T2DM groups and effect of PPAR-γ agonist RSG treatment among these groups. A marked (p < 0.01) increase in % body weight change was observed in animal fed on HFD for 8 weeks which markedly (p < 0.001) decreased after the treatment of PPAR-γ agonist (RSG) as compared with control. However, T2DM rats treated with RSG showed significant (p < 0.05) reduction in % body weight change when compared with HFD-fed obese group.
Comparison of anthropometrical indices and organ weight in HFD and HFD-induced T2DM with and without PPAR-γ agonist (RSG) treatment.a

HFD: high-fat diet; T2DM: type 2 diabetes mellitus; PPAR-γ: peroxisome proliferator–activated receptor-gamma; RSG: rosiglitazone; ANOVA: analysis of variance.
aValues are expressed as mean ± SD; n = 10 (one-way ANOVA Post hoc Tukey test).
b p < 0.01 with control.
c p < 0.05 with HFD.
d p < 0.001 with control.
e p < 0.05 with control.
f p < 0.001 with HFD.
g p < 0.05 with T2DM.
h p < 0.01 with HFD.
i p < 0.01 with T2DM.
j p < 0.001 with T2DM.
BMI was significantly increased in HFD-fed obese rats (p < 0.001) and HFD-induced T2DM (p < 0.05) as compared with control. However, significant reduction in BMI was observed after RSG treatment of HFD-fed rats (p < 0.05) and T2DM rats (p < 0.001) as compared with HFD-fed obese rats. Treatment of RSG markedly (p < 0.05) decreased BMI of T2DM rats as compared with T2DM.
Significant increased Lee index was observed in HFD-fed (p < 0.001) and HFD-induced T2DM rats (p < 0.05) as compared with control. HFD rats treated with RSG significantly (p < 0.01) reduced Lee index as compared with HFD-fed obese rats. However, marked reduction (p < 0.001) in Lee index was also observed in HFD-induced T2DM rats treated with RSG as compared with HFD-fed rats as well as (p < 0.01) with T2DM.
Effects of RSG treatment on random and fasting blood glucose level of HFD-fed and HFD/STZ-induced T2DM as compared with normal control
Table 2 shows effects of RSG treatment on fasting and random blood glucose level in all groups. Fasting and random blood glucose was markedly (p < 0.001) increased in all groups as compared with control except fasting blood glucose of HFD-fed rats treated with RSG that showed no significant changes. HFD-fed rats treated with RSG significantly (p < 0.001) reduced random blood glucose as compared with HFD-fed obese group. T2DM and T2DM rats treated with RSG markedly (p < 0.001) increased fasting as well as random blood glucose as compared with HFD-fed obese rats, which significantly (p < 0.001) reduced after RSG treatment as compared with T2DM.
Insulin sensitizing effects of RSG on fasting and random blood glucose level, serum insulin level of HFD-fed, and HFD-induced T2DM compared with normal control.a

HFD: high-fat diet; T2DM: type 2 diabetes mellitus; RSG: rosiglitazone; ANOVA: analysis of variance.
aValues are expressed as mean ± SD; n = 10 (one-way ANOVA post hoc Tukey test), p > 0.05 (nonsignificant).
b p < 0.001 with control.
c p < 0.001 with HFD.
d p < 0.001 with T2DM.
e p < 0.01 with HFD.
Effects of RSG treatment on serum insulin level of HFD-fed and HFD/STZ-induced T2DM as compared with normal control
Serum insulin level was markedly (p < 0.001) elevated in HFD-fed obese rats and T2DM (p < 0.05) as compared with control. HFD-fed rats treated with RSG as well as T2DM and T2DM rats treated with RSG significantly (p < 0.001) reduced serum insulin compared with HFD-fed obese rats. However, T2DM rats treated with RSG showed no significant changes when compared with T2DM rats (Table 2).
Effects of RSG treatment on serum visfatin levels of HFD-fed and HFD/STZ-induced T2DM compared with normal control
Effects of RSG treatment on serum visfatin levels are depicted in Table 2. Results showed that there was a significant (p < 0.01) decrease in serum visfatin in HFD-fed RSG treated group as compared with HFD. Marked (p < 0.001) increase in serum visfatin levels was observed in T2DM rats as compared with control and HFD-fed obese rats. However, treatment of T2DM rats with RSG showed markedly (p < 0.001) decreased serum visfatin as compared with T2DM (Table 2).
Effects of RSG treatment on serum AGEs levels of HFD-fed and HFD/STZ-induced T2DM compared with normal control
Table 2 showed the effects of RSG treatment on serum AGEs on HFD and HFD-induced T2DM rats. Results showed significantly increased serum AGEs in HFD-fed obese and T2DM rats as compared with control (p < 0.001). Treatment of HFD-fed rats with RSG showed significant reduction in AGEs levels as compared with HFD (p < 0.01). A significantly decreased serum AGEs levels were also observed in T2DM rats treated with RSG as compared with HFD fed obese rats (p < 0.001). However, T2DM rats treated with RSG showed significantly decreased AGEs levels as compared with T2DM group (p < 0.001).
Effects of RSG treatment on plasma urea levels of HFD-fed and HFD/STZ-induced T2DM compared with normal control
Figure 1 showed markedly increased plasma urea level of HFD, HFD + RSG treated, and T2DM as compared with control (p < 0.001). However, HFD-fed rats treated with PPAR-γ agonist (RSG) showed significantly (p < 0.001) decreased plasma urea level as compared with HFD. Treatment of T2DM rats with PPAR-γ agonist (RSG) significantly decreased plasma urea level as compared to HFD as well as T2DM groups (p < 0.001).
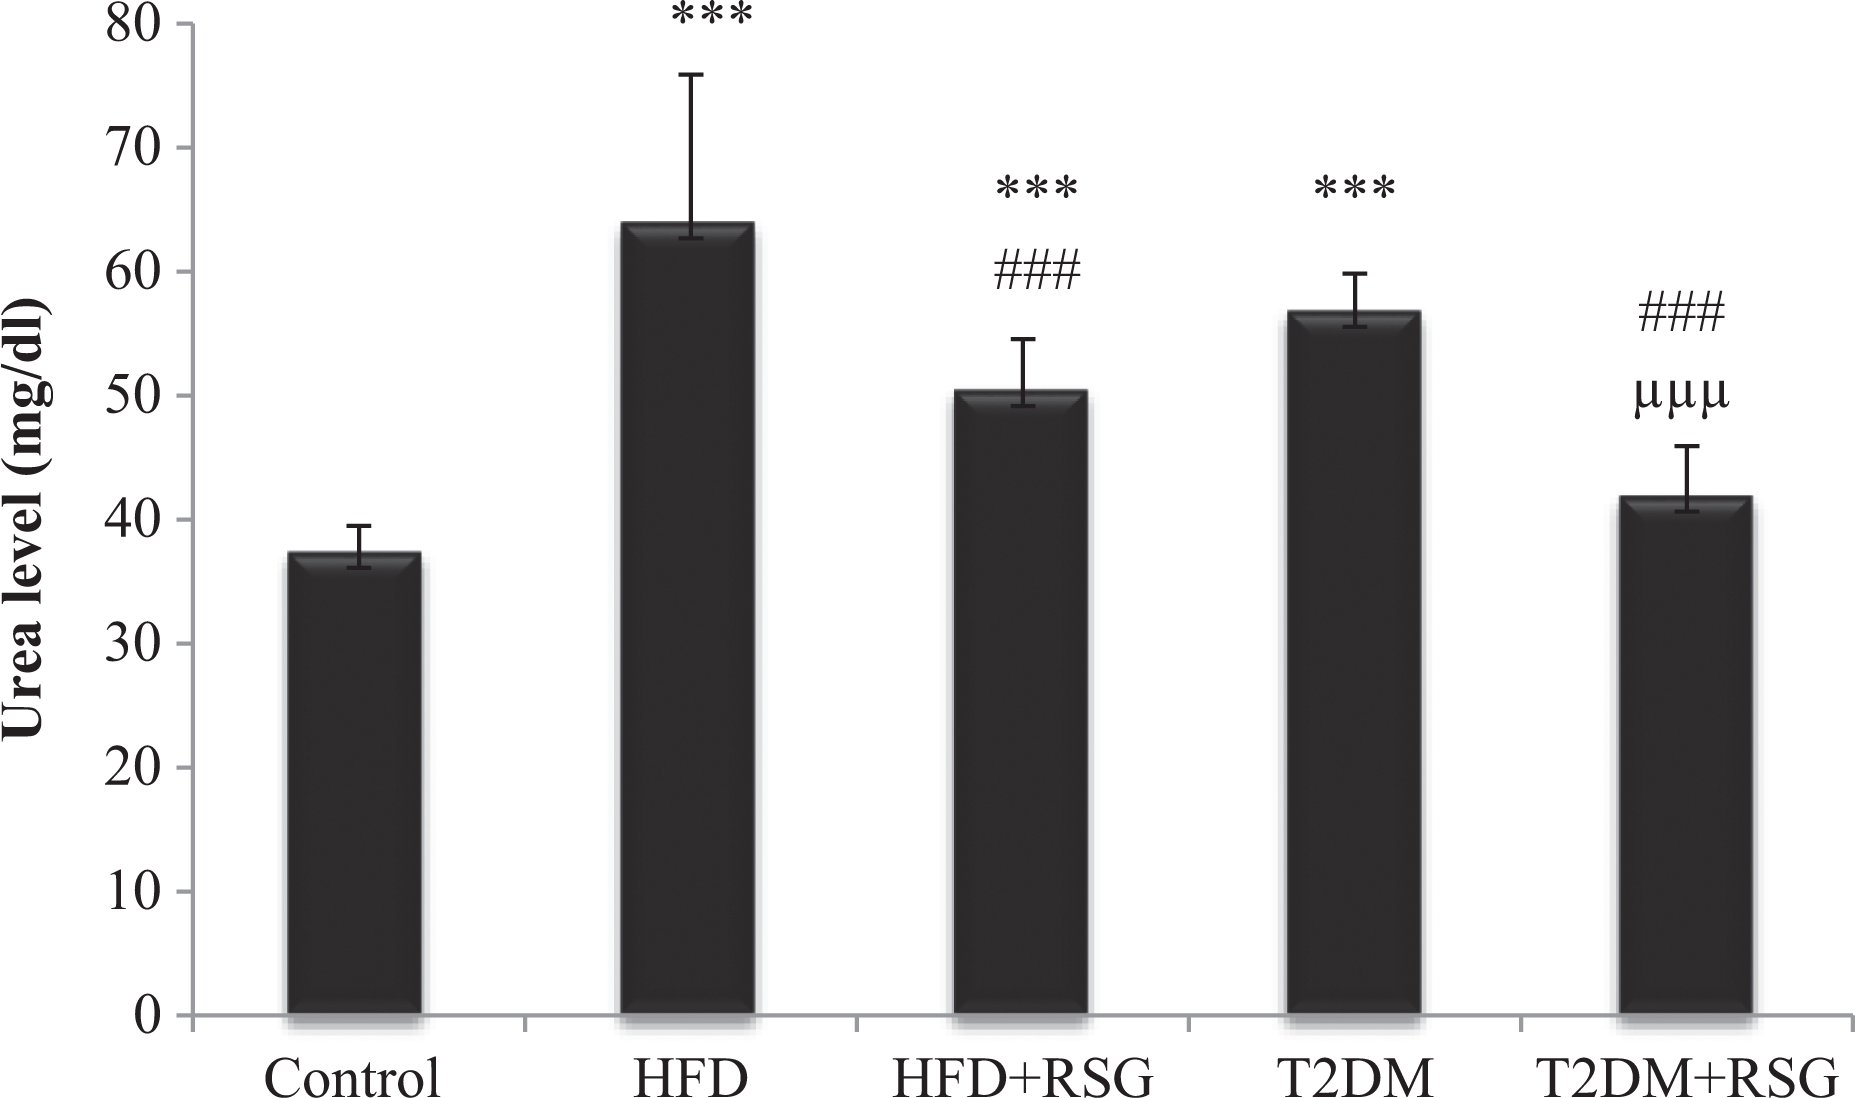
Effect of PPAR-γ agonist (RSG) treatment on serum urea level in HFD-fed and HFD-fed STZ-induced type 2 diabetic rats. Values are represented as mean ± SD (n = 10). ***p < 0.001 with control; ### p < 0.001with HFD; μμμ p < 0.001, with T2DM. PPAR-γ: peroxisome proliferator–activated receptor-gamma; RSG: rosiglitazone; HFD: high-fat diet; STZ: streptozotocin; T2DM: type 2 diabetes mellitus.
Effects of RSG treatment on plasma creatinine levels of HFD-fed and HFD/STZ-induced T2DM compared with normal control
Plasma creatinine level was significantly raised in HFD, T2DM (p < 0.001), and HFD + RSG treated groups (p < 0.05) as compared with control as shown in Figure 2. However, treatment of T2DM with PPAR-γ agonist (RSG) significantly decreased plasma creatinine level in comparison with obese T2DM group (p < 0.001).
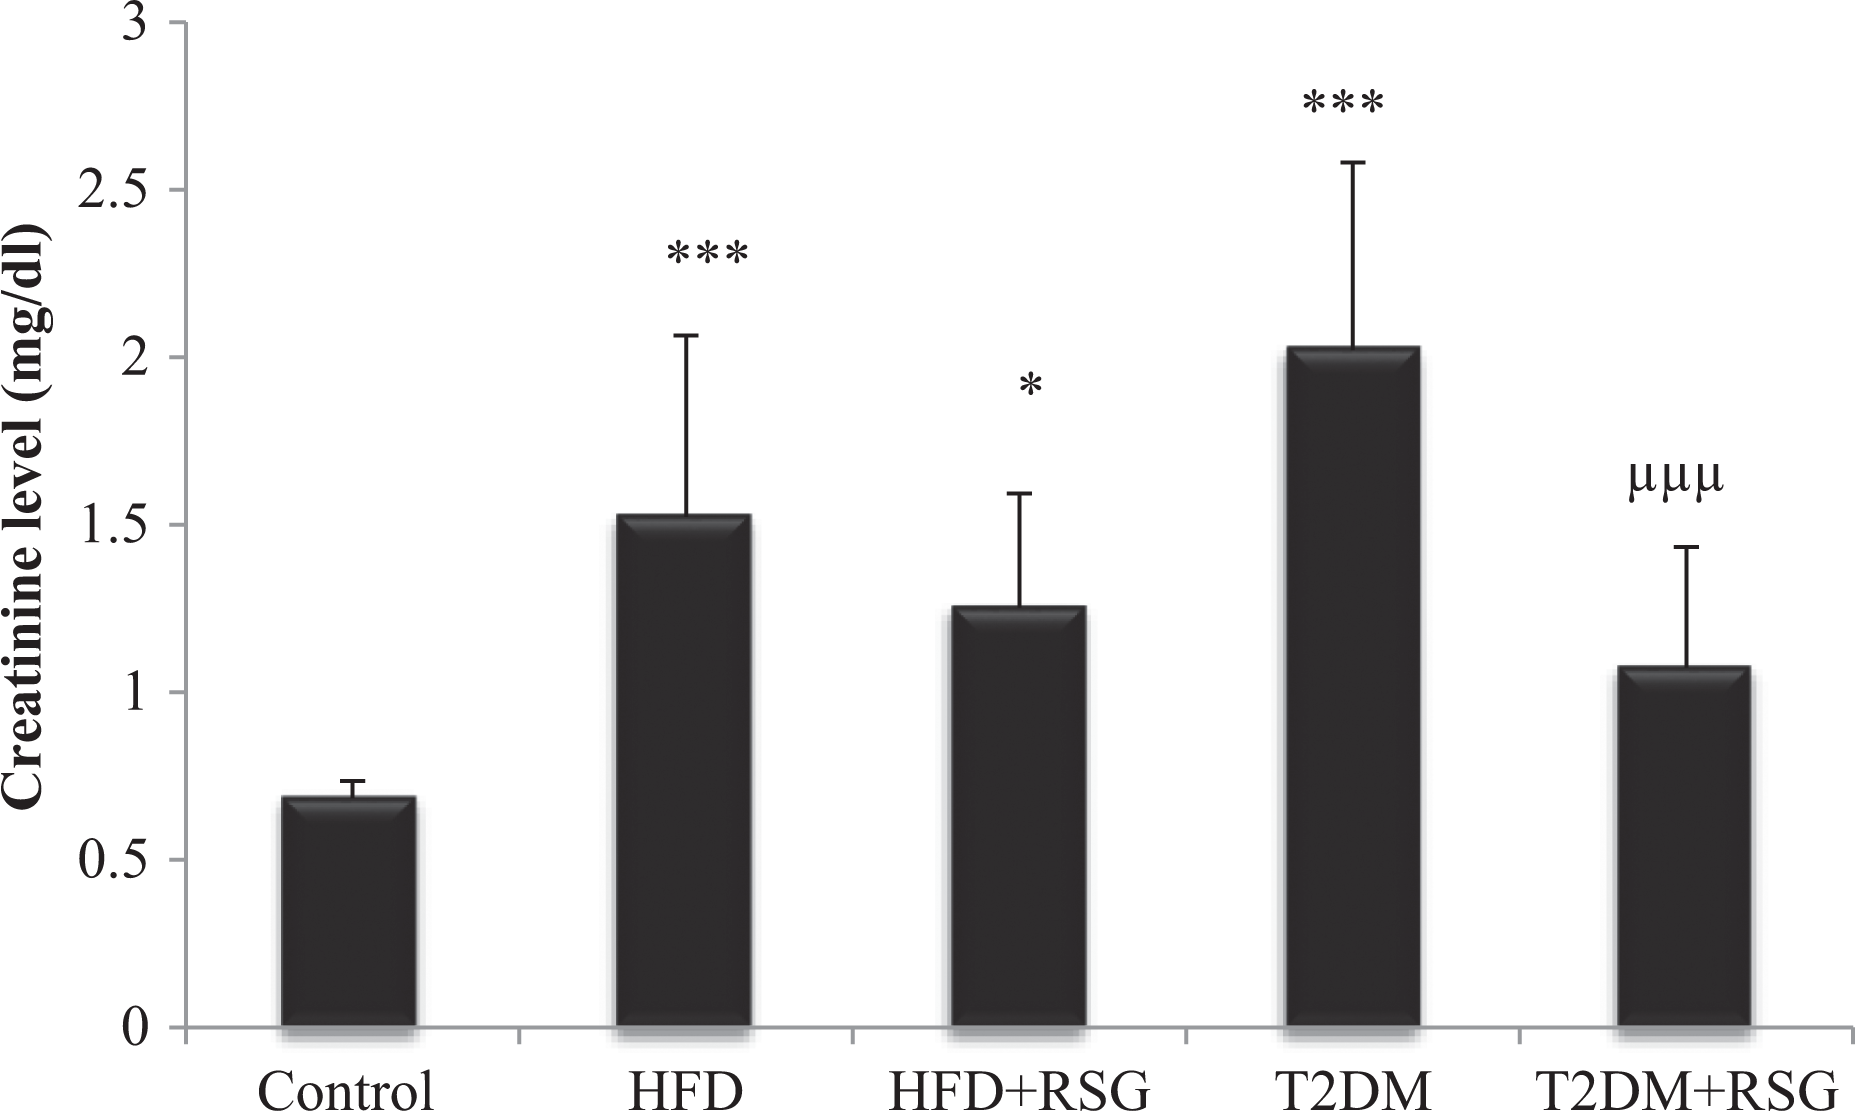
Effect of PPAR-γ agonist (RSG) treatment on serum creatinine level in HFD-fed and HFD-fed streptozotocin-induced type 2 diabetic rats. Values are represented as mean ± SD (n = 10). ***p < 0.001; *p < 0.05 with control, μμμ p < 0.001 with T2DM. PPAR-γ: peroxisome proliferator–activated receptor-gamma; RSG: rosiglitazone; HFD: high-fat diet; STZ: streptozotocin; T2DM: type 2 diabetes mellitus.
Effects of RSG treatment on renal lipid peroxidation of HFD-fed and HFD/STZ-induced T2DM compared with normal control
Level of MDA in renal tissues was raised significantly in T2DM rats when compared with control as well as HFD-fed obese rats (p < 0.001) (Figure 3). Markedly decreased MDA levels were observed in T2DM rats treated with RSG in comparison with control, HFD, and T2DM (p < 0.001). However, no significant changes were observed in HFD-fed rats and HFD-fed rats treated with RSG.

Effect of PPAR-γ agonist (RSG) treatment on renal tissue lipid peroxidation in HFD-fed and HFD-fed streptozotocin-induced diabetic rats. Values are represented as mean ± SD (n = 10). ***p < 0.001 with control; ### p < 0.001with HFD; μμμ p < 0.001 with T2DM. PPAR-γ: peroxisome proliferator–activated receptor-gamma; RSG: rosiglitazone; HFD: high-fat diet; STZ: streptozotocin; T2DM: type 2 diabetes mellitus.
Effects of RSG treatment on renal catalase activity on HFD-fed and HFD/STZ-induced T2DM compared with normal control
Significantly decreased renal tissues catalase (CAT) activity was observed in HFD, T2DM, HFD + RSG, and T2DM + RSG-treated groups as compared with normal healthy control (p < 0.001) (Figure 4). HFD-fed rats treated with RSG markedly increased CAT activity as compared with HFD (p < 0.01). T2DM and T2DM + RSG-treated rats showed significantly decreased CAT activity in comparison with HFD-fed obese rats (p < 0.001). Further, no significant results were observed between T2DM and T2DM treated with RSG.

Effect of PPAR-γ agonist (RSG) treatment on renal tissue CAT in HFD-fed and HFD-fed streptozotocin-induced diabetic rats. Values are represented as mean ± SD (n = 10). ***p < 0.001 with Control, ### p < 0.001, ## p < 0.01 with HFD. PPAR-γ: peroxisome proliferator–activated receptor-gamma; RSG: rosiglitazone; CAT: catalase; HFD: high-fat diet; STZ: streptozotocin; T2DM: type 2 diabetes mellitus.
Effects of RSG treatment on renal SOD activity of HFD-fed and HFD/STZ-induced T2DM compared with normal control
SOD level in the kidney tissues of experimental animals is shown in Figure 5. Renal tissue SOD activity was significantly decreased in HFD, HFD + RSG, and T2DM groups as compared with control (p < 0.001). Treatment of HFD-fed obese rats with PPAR-γ agonist (RSG) showed significantly increased SOD activity as compared with HFD (p < 0.001). T2DM and T2DM treated with RSG also significantly raised SOD level in comparison with HFD-fed obese rats (p < 0.001). Treatment of T2DM with RSG significantly increased SOD levels in comparison with T2DM (p < 0.05).

Effect of PPAR-γ agonist (RSG) treatment on renal tissue superoxide dismutase in HFD-fed and streptozotocin-induced diabetic rats. Values are represented as mean ± SD (n = 10). ***p < 0.001 with control; ### p < 0.001, with HFD; μ p < 0.05 with T2DM. PPAR-γ: peroxisome proliferator–activated receptor-gamma; RSG: rosiglitazone; HFD: high-fat diet; STZ: streptozotocin; T2DM: type 2 diabetes mellitus.
Tissue GSH in control, HFD, HFD + RSG, T2DM, and T2DM + RSG
Glutathione reductase activity was significantly reduced in HFD, HFD-fed rats treated with RSG (p < 0.05), and T2DM rats (p < 0.001) in comparison with control. T2DM rats markedly decreased Glutathione reductase (GSH) activity in comparison with HFD (p < 0.01). Treatment of T2DM with RSG significantly raised GSH activity in comparison with HFD (p < 0.001) and T2DM (p < 0.05) as shown in Figure 6.

Effect of PPAR-γ agonist (RSG) treatment on renal tissue glutathione reductase in HFD-fed and streptozotocin-induced diabetic rats. Values are represented as mean ± SD (n = 10). ***p < 0.001; *p < 0.05 with control; ### p < 0.001; ## p < 0.01with HFD, μ p < 0.05 with T2DM. PPAR-γ: peroxisome proliferator–activated receptor-gamma; RSG: rosiglitazone; HFD: high-fat diet; STZ: streptozotocin; T2DM: type 2 diabetes mellitus.
Pearson’s correlation analysis among serum visfatin and antioxidant biomarkers in renal tissues
Pearson’s correlation analysis is depicted in Table 3. Results showed that there was a strong positive association among fasting blood glucose levels and serum visfatin of control (r = 0.654, p < 0.05), T2DM (r = 0.781, p < 0.01), and T2DM + RSG (r = 0.760, p < 0.001). A strong positive association was observed between renal tissue MDA and serum visfatin levels of HFD (r = 0.747, p < 0.05) and T2DM groups (r = 0.764, p < 0.05), while negative association among MDA and serum visfatin of HFD + RSG group (r = −0.715, p < 0.05). A strong positive association between CAT and serum visfatin was observed in control (r = 0.624, p < 0.05), HFD + RSG (r = 0.696, p < 0.05), and T2DM + RSG groups (r = 0.813, p < 0.01). However, a strong negative correlation was observed among CAT and serum visfatin of HFD (r = −0.758, p < 0.05) and T2DM groups (r = −0.737, p < 0.05). Results showed a strong negative correlation between SOD and serum visfatin in HFD group (r = −0.826, p < 0.01) and T2DM (r = −0.731, p < 0.05). A significant negative correlation was also observed between MDA and SOD levels of control (r = −0.713, p < 0.05) and HFD groups (r = 0.785, p < 0.01). CAT showed a positive association with SOD of HFD (r = 0.674, p < 0.05), with GSH of control (r = 0.788, p < 0.01) and T2DM (r = 0.733, p < 0.01), while negative association with SOD of control (r = −0.634, p < 0.05) and negative association of MDA of HFD (r = −0.799, p < 0.01). Further, no more significant correlations were observed.
Pearson’s correlation analysis between antioxidant biomarkers and visfatin in HFD-fed and HFD-induced T2DM with and without PPAR-γ agonist (RSG) treatment.

FBG: fasting blood glucose; CAT: catalase; SOD: superoxide dismutase; GSH: glutathione reductase; AGEs: advanced glycation end products; HFD: high-fat diet; T2DM: type 2 diabetes mellitus; RSG: rosiglitazone; MDA: malondialdehyde.
aCorrelation is significant at the 0.05 level (2-tailed).
bCorrelation is significant at the 0.01 level (2-tailed).
Discussion
Obesity is considered as the epidemic pathology and it is associated with various metabolic disorders and one of them is T2DM. There are various studies that showed the mechanistic link between obesity and T2DM. Both the obesity and T2DM cause induction of systemic oxidative stress.
In the present study, the effect of the PPAR-γ agonist on renal oxidative damage caused by obesity and diabetes mellitus was investigated. The PPAR-γ is the ligand-activated nuclear receptor known to elevate glucose influx in muscle and adipose tissue by increasing the synthesis and translocation of glucose transporters. 41 Activation of the PPAR-γ increases the insulin sensitization and thus improves glucose metabolism by enhancing the expression of glucose transporter GLUT-4 as described in previous studies. 42 A recent meta-analysis showed that treatment of prediabetic patients with RSG reduced the risk of T2DM progression. 43 Numerous research evidences suggested that ROS increased in the kidney by the exposure of hyperglycemia or in diabetic animals. 43 ROS could be a major cause of hyperglycemia-induced oxidative stress 44 and inflammatory mediator of renal injury that may lead to diabetic nephropathy. 45 RSG was reported to impede the progression of diabetic nephropathy by downregulating the expression of glomerular fibronectin, reducing podocyte loss and reducing glomerular ROS thus confers vascular benefits in diabetes. 46 It also downregulates the gene expression of advanced glycation end products receptors as well as formation of AGEs and delay the progression and development of diabetic complications. 47
Using the experimental models of HFD-induced obesity and type 2 diabetes treated with RSG, we evaluate the blood glucose level, serum levels of insulin, and visfatin. SOD, CAT, and glutathione reductase activities were monitored to determine the antioxidant status, MDA as an index of lipid peroxidation, and serum urea and creatinine level as renal marker were also monitored.
The present study showed that RSG treatment led to improved glycemic control, insulin resistance, serum levels of visfatin, AGEs, and BMI in both HFD and T2DM as shown in Tables 1 and 2. Serum urea and creatinine levels were markedly increased in animal model of obesity as well as T2DM, showing the insufficiency of renal function (Figures 1 and 2). There was a significant change observed in serum urea level after 7 days treatment with RSG in obese rats. Additionally, there was a significant decreased plasma urea and creatinine level in animal model of type 2 diabetes, treated with RSG for 7 days. It shows the attenuation of renal damage induced by type 2 diabetes. Treatment with RSG has been previously manifested to have renoprotective effect as it reduces albuminuria, improved glomerular filtration rate, and normalized glomerulosclerosis and tubulointerstitial fibrosis in obese type 2 diabetic rats. 47
In the present study, there was a significant increased renal tissue level of MDA in T2DM group as compared with control, which significantly decreased in the diabetic rats treated with RSG (Figure 3). Renal tissue CAT activity was significantly decreased in HFD-fed obese rats and T2DM, which eventually increased significantly after RSG treatment (Figure 4). Similarly, SOD activity is significantly decreased in animal models of obesity and T2DM, which significantly increases after RSG treatment (Figure 5). Treatment with RSG showed significant alteration in activity of antioxidant enzymes such as SOD, CAT, and in MDA level of type 2 diabetes. Results also showed significant reduction in glutathione reductase activity in HFD, HFD-fed rats treated with RSG, and T2DM rats in comparison with control. Treatment of T2DM with RSG significantly raised GSH activity in comparison T2DM as shown in Figure 6.
Oxidative stress leads to the progression of structural and functional renal impairments. Productions of ROS can cause alteration in the antioxidant status. 48 PPAR-γ agonist (RSG) attenuates the renal damage and oxidative stress mediated through transactivation of the PPAR-γ that increase the activity of antioxidant enzymes by regulation of blood glucose level and controlling insulin resistance. 49,50 Our study elucidated the vitality of using the PPAR-γ agonist (RSG) against hyperglycemia; furthermore, it provides the clue for further investigation on the underlying mechanisms. It also investigates the correlation between elevated serum visfatin levels in obesity, T2DM, and antioxidant biomarkers. Results showed that there was a significant positive correlation between MDA and serum visfatin levels of HFD and T2DM groups, while a negative correlation between MDA and serum visfatin of HFD + RSG group. The results indicate that elevated serum visfatin levels in HFD and T2DM rats were responsible for increased MDA levels in these groups, while RSG treatment of HFD group decreased serum visfatin which eventually decreased MDA levels in HFD + RSG group. A strong positive association was observed between renal tissue MDA and serum visfatin levels of HFD (r = 0.747, p < 0.05) and T2DM groups (r = 0.764, p < 0.05), while a negative association among MDA and serum visfatin of HFD + RSG group (r = −0.715, p < 0.05). A strong positive association between CAT and serum visfatin was seen in control (r = 0.624, p < 0.05), HFD + RSG (r = 0.696, p < 0.05), and T2DM + RSG groups (r = 0.813, p < 0.01). However, a strong negative correlation was observed among CAT and serum visfatin of HFD (r = −0.758, p < 0.05) and T2DM groups (r = −0.737, p < 0.05). Results showed a strong negative correlation between SOD and serum visfatin in HFD group (r = −0.826, p < 0.01) and T2DM (r = −0.731, p < 0.05) as shown in Table 3.
In brief, our study corroborates the hypothesis that RSG protects from renal damage, from high glucose-induced toxicity through PPARγ- activation. Further studies of the genetic mechanism will open the new therapeutic way for the treatment and prevention of diabetic complications.
Conclusion
It is concluded from the present study that there is a strong association between serum visfatin levels and renal antioxidant biomarkers in obesity and T2DM. Elevated visfatin levels in T2DM eventually result in renal damage and oxidative stress. Treatment with RSG induces beneficial effects to decrease serum visfatin levels, overcome the renal damage, and restore antioxidant enzymes. Our findings suggest that decreased serum visfatin levels by RSG impart renoprotection against T2DM-induced nephrotoxicity.
Footnotes
Declaration of Conflicting Interests
The author(s) declared no potential conflicts of interest with respect to the research, authorship, and/or publication of this article.
Funding
The author(s) received no financial support for the research, authorship, and/or publication of this article.