
Abstract
Bifenthrin, a commonly used pyrethroid pesticide, evokes various toxicological effects in different models. However, the effect of bifenthrin on cytosolic-free Ca2+ level ([Ca2+] i ) and cytotoxicity in human prostate cancer cells is unclear. This study examined whether bifenthrin altered Ca2+ homeostasis and cell viability in PC3 human prostate cancer cells. [Ca2+] i in suspended cells were measured using the fluorescent Ca2+-sensitive dye fura-2. Cell viability was examined by 4-[3-[4-lodophenyl]-2-4(4-nitrophenyl)-2H-5-tetrazolio-1,3-benzene disulfonate] water soluble tetrazolium-1 assay. Bifenthrin (100–400 μM) concentration-dependently induced [Ca2+] i rises. Ca2+ removal reduced the signal by approximately 30%. In Ca2+-free medium, treatment with the endoplasmic reticulum Ca2+ pump inhibitor 2,5-di-tert-butylhydroquinone (BHQ) abolished bifenthrin-evoked [Ca2+] i rises. Conversely, treatment with bifenthrin abolished BHQ-evoked [Ca2+] i rises. Inhibition of phospholipase C (PLC) with U73122 significantly inhibited bifenthrin-induced [Ca2+] i rises. Mn2+ has been shown to enter cells through similar mechanisms as Ca2+ but quenches fura-2 fluorescence at all excitation wavelengths. Bifenthrin (400 μM)-induced Mn2+ influx implicates that Ca2+ entry occurred. Bifenthrin-induced Ca2+ entry was inhibited by 30% by protein kinase C (PKC) activator (phorbol 12-myristate 13 acetate) and inhibitor (GF109203X) and three inhibitors of store-operated Ca2+ channels: nifedipine, econazole, and SKF96365. Bifenthrin at 175–275 μM decreased cell viability, which was not reversed by pretreatment with the Ca2+ chelator 1,2-bis(2-aminophenoxy) ethane-N,N,N′,N′-tetra acetic acid-acetoxymethyl ester. Together, in PC3 cells, bifenthrin-induced [Ca2+] i rises by evoking PLC-dependent Ca2+ release from the endoplasmic reticulum and Ca2+ entry via PKC-sensitive store-operated Ca2+ entry. Bifenthrin also caused Ca2+-independent cell death.
Introduction
Synthetic pyrethroid insecticides were introduced into widespread use for the control of insects and disease vectors for decades. Pyrethroids account for approximately one-fourth of the worldwide insecticide market, and the use of these compounds is increasing. 1 This usage results in an increased potential for human exposure, including exposure to pregnant women, infants, and children. 2 Based on both their chemical structures and biologic responses to acute exposure, pyrethroids are classified into two groups: type I and type II. Type I pyrethroids lack a cyano group at the α carbon of the 3-phenoxybenzyl alcohol moiety and produce hyperexcitation, tremors, and convulsions, whereas type II pyrethroids have a cyano group at the α carbon and produce hypersensitivity, choreoathetosis, salivation, and seizures. 3 Therefore, it is important to explore the toxic action of pyrethroid pesticides in human.
Bifenthrin, a type I pyrethroid pesticide, has been shown to possess different in vitro effects. Bifenthrin caused neurite retraction in the absence of cell death. 4 In differentiating PC12 cells, bifenthrin was reported to inhibit neurite outgrowth. 5 Furthermore, bifenthrin activated homotypic aggregation in human T-cell lines. 6 It is reported that bifenthrin induced apoptosis through mitogen-activated protein kinase signaling pathway in HepG2 cells 7 and evoked oxidative stress in human erythrocytes. 8 At the channel level, bifenthrin altered Ca2+ oscillations and cortical neuron development independent of Na+ channel activity. 9 Bifenthrin was reported to induce stimulation of Ca2+ influx in neocortical neurons 10 and alter activity of Na+ channels expressed in rat cerebral cortical neurons. 11 However, the effect of bifenthrin on Ca2+ homeostasis in human prostate cancer cells has not been explored.
An alteration in [Ca2+] i is a key regulator of many cellular processes such as fertilization, protein activation, gene expression, proliferation, plasticity, apoptosis, secretion, contraction, and so on. 12 To allow a precise regulation of [Ca2+] i and various signaling pathways, cells possess many mechanisms to control [Ca2+] i both globally and at the subcellular level. 13 Among these are many members of the superfamily of G-protein-coupled receptors, which are characterized by the presence of seven transmembrane domains. 14 Typically, these receptors are able to activate phospholipase C (PLC) leading to Ca2+ release from intracellular stores, which subsequently evoked Ca2+ entry across the plasma membrane. Many intracellular molecules can also regulate Ca2+ signal, such as protein kinase C (PKC) 15 and cAMP. 16
A previous study has shown that bifenthrin caused prostate dysfunction and increased risk of the antiandrogenic activity in rats. 17 Therefore, the risk of exposing to bifenthrin in human prostate should be cautioned. This study was aimed to explore the effect of bifenthrin on Ca2+ homeostasis and cell viability and to explore their relationship. The PC3 human prostate cancer cells were used because it produces measurable [Ca2+] i rises upon pharmacological stimulation. It has been shown that in this cell, [Ca2+] i rises and death can be evoked by stimulation with chemicals, such as timolol, 18 carvacrol, 19 and thymol. 20 To understand the physiological significance of this Ca2+ signal, it is important to elucidate the mechanisms underlying the signal. Fura-2 was used as a Ca2+-sensitive dye to measure [Ca2+] i . The [Ca2+] i rises were characterized, the concentration–response plots were established, and the mechanisms underlying bifenthrin-evoked Ca2+ entry and Ca2+ release were examined. The effect of bifenthrin on cell viability was also explored.
Materials and methods
Chemicals
The reagents for cell culture were from Gibco® (Gaithersburg, Maryland, USA). Aminopolycarboxylic acid/acetoxy methyl (fura-2/AM) and 1,2-bis(2-aminophenoxy) ethane-N,N,N′,N′-tetra acetic acid/acetoxy methyl (BAPTA/AM) were from Molecular Probes® (Eugene, Oregon, USA). Bifenthrin (Figure 1(a)) and other reagents were from Sigma-Aldrich® (St Louis, Missouri, USA) unless otherwise indicated. The purity (>98%) of bifenthrin was determined by high performance liquid chromatography densitometry.
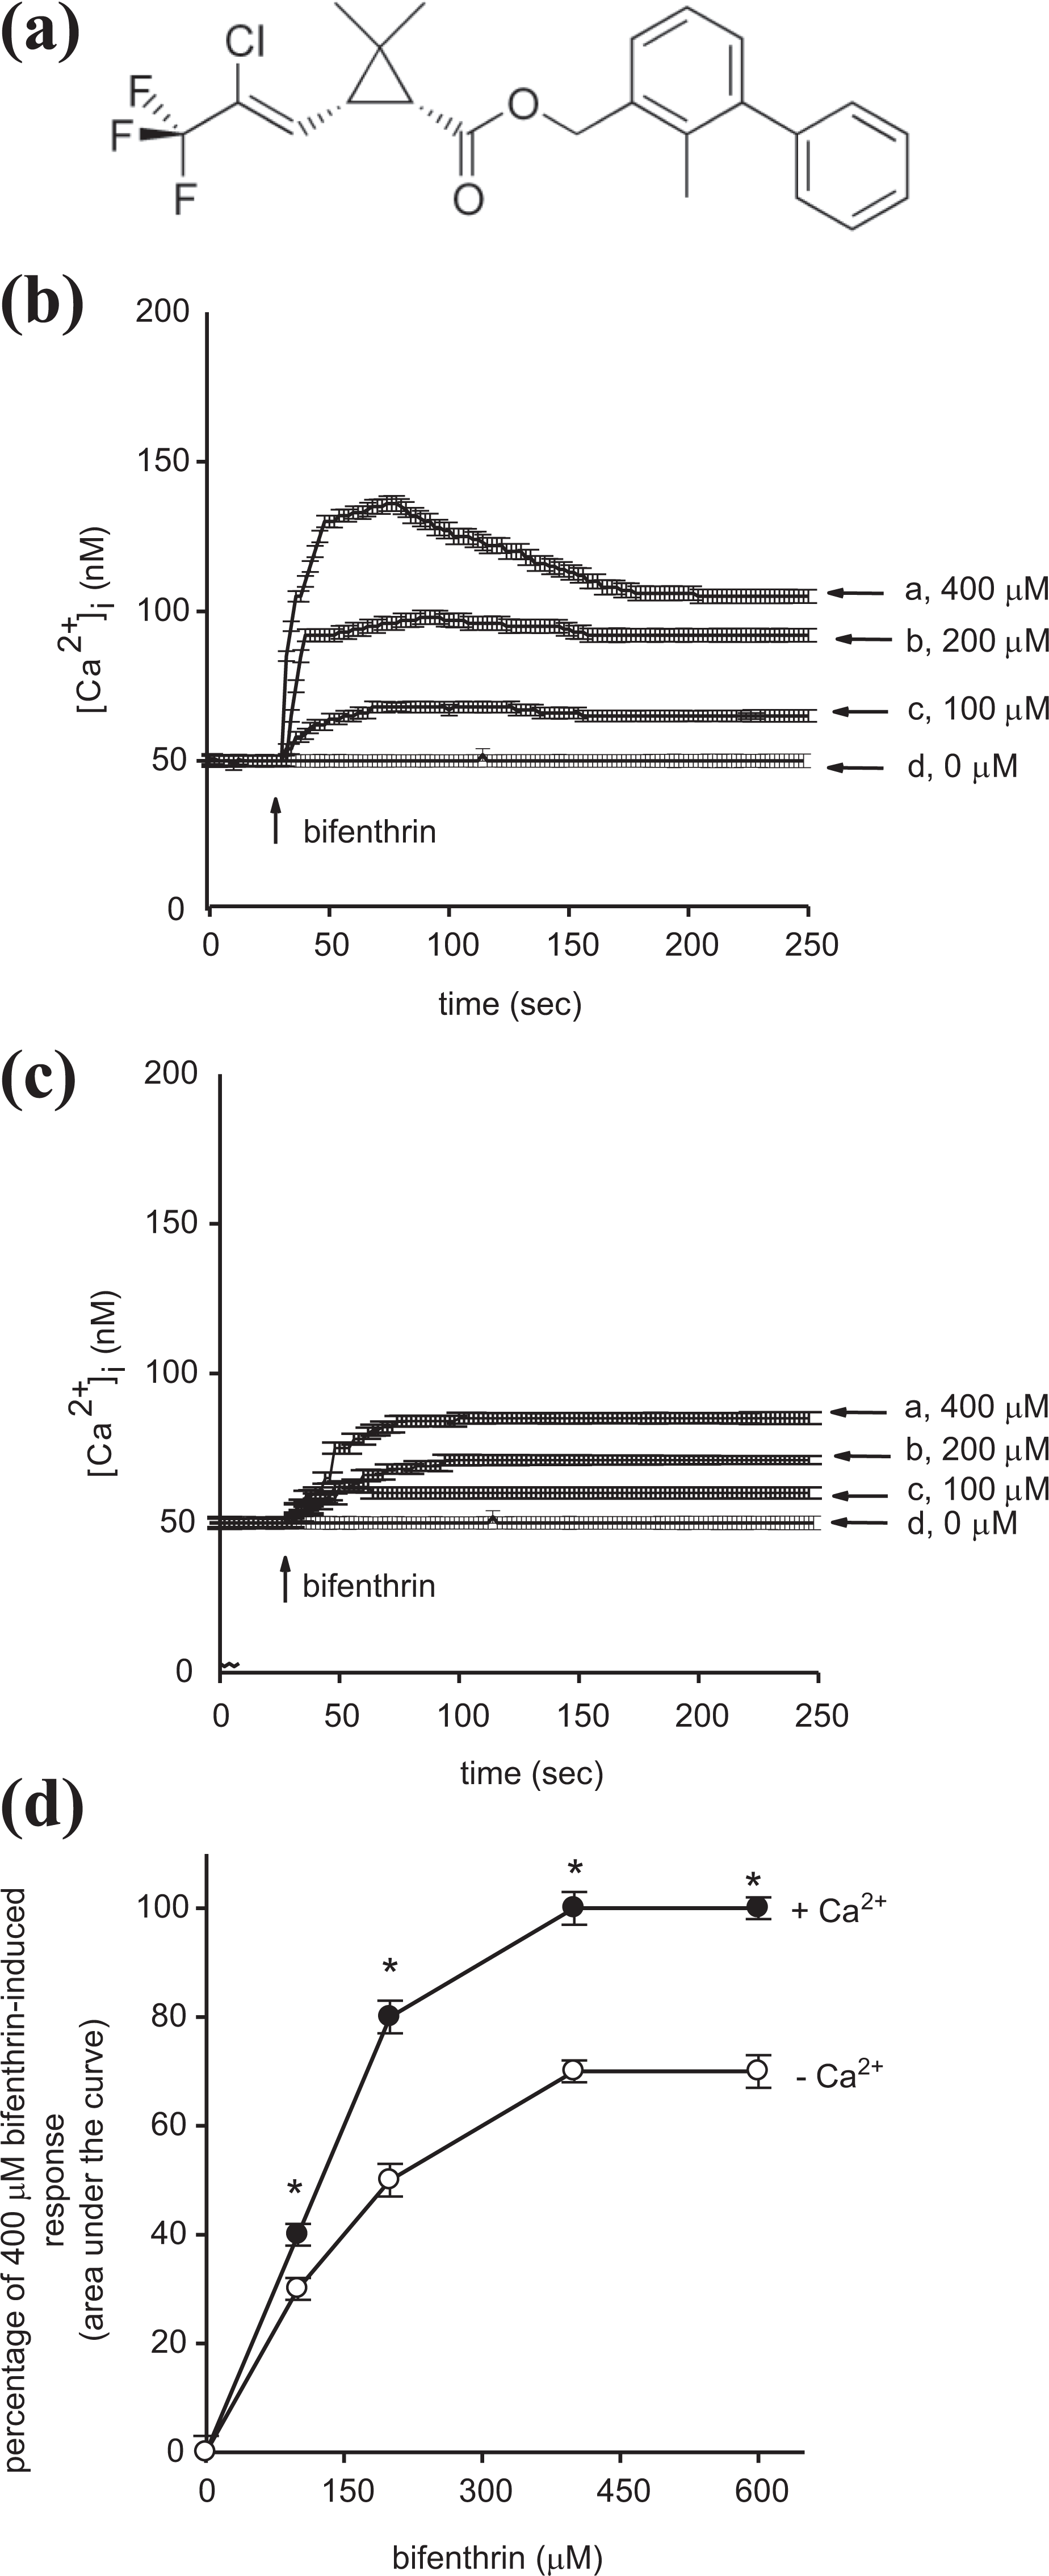
Effect of bifenthrin (a) on [Ca2+] i in fura-2-loaded PC3 cells. (b) Bifenthrin was added at 25 s. The concentration of bifenthrin was indicated. The experiments were performed in Ca2+-containing medium. Y-axis is the [Ca2+] i induced by bifenthrin in Ca2+-containing medium. (c) Effect of bifenthrin on [Ca2+] i in the absence of extracellular Ca2+. Bifenthrin was added at 25 s in Ca2+-free medium. Y-axis is the [Ca2+] i rise induced by bifenthrin in Ca2+-free medium. (d) Concentration–response plots of bifenthrin-induced [Ca2+] i rises in the presence or absence of extracellular Ca2+. Y-axis is the percentage of the net (baseline subtracted) area under the curve (25–250 s) of the [Ca2+] i rises induced by 400 μM bifenthrin in Ca2+-containing medium. Data are mean ± SD of three independent experiments. *p < 0.05 compared to open circles. Ca2+: calcium ion; SD: standard deviation.
Cell culture
PC3 cells obtained from Bioresource Collection and Research Center (Taiwan) were cultured in Roswell Park Memorial Institute (RPMI)-1640 medium supplemented with 10% heat-inactivated fetal bovine serum, 100 U ml−1 penicillin, and 100 μg ml−1 streptomycin.
Solutions used in [Ca2+] i measurements
Ca2+-containing medium (pH 7.4) had 140 mM NaCl, 5 mM KCl, 1 mM MgCl2, 2 mM CaCl2, 10 mM 4-(2-hydroxyethyl)-1-piperazineethanesulfonic acid, and 5 mM glucose. Ca2+-free medium contained similar chemicals as Ca2+-containing medium except that CaCl2 was replaced with 0.3 mM ethylene glycol tetra acetic acid (EGTA) and 2 mM MgCl2. Bifenthrin was dissolved in dimethyl sulfoxide (DMSO) as a 0.1 M stock solution. The other chemicals were dissolved in water, ethanol, or DMSO. The concentration of organic solvents in the experimental solutions did not exceed 0.1% and did not affect viability or basal [Ca2+] i .
[Ca2+] i measurements
[Ca2+] i was measured as previously described. 18 –20 Confluent cells grown on 6 cm dishes were trypsinized and made into a suspension in culture medium at a concentration of 106 cells per milliliter. Cell viability was determined by trypan blue exclusion. The viability was greater than 95% after the treatment. Cells were subsequently loaded with 2 μM fura-2/AM for 30 min at 25°C in the same medium. After loading, cells were washed with Ca2+-containing medium twice and were made into a suspension in Ca2+-containing medium at a concentration of 10 7 cells per milliliter. Fura-2 fluorescence measurements were performed in a water-jacketed cuvette (25°C) with continuous stirring; the cuvette contained 1 ml of medium and 0.5 million cells. Fluorescence was monitored with a Shimadzu RF-5301PC spectrofluorophotometer immediately after 0.1 ml cell suspension was added to 0.9 ml Ca2+-containing or Ca2+-free medium, by recording excitation signals at 340 and 380 nm and emission signal at 510 nm at 1-s intervals. During the recording, reagents were added to the cuvette by pausing the recording for 2 s to open and close the cuvette-containing chamber. For calibration of [Ca2+] i , after completion of the experiments, the detergent Triton X-100 (0.1%) and CaCl2 (5 mM) were added to the cuvette to obtain the maximal fura-2 fluorescence. Then, the Ca2+ chelator EGTA (10 mM) was added to chelate Ca2+ in the cuvette to obtain the minimal fura-2 fluorescence. Control experiments showed that cells bathed in a cuvette had a viability of 95% after 20 min of fluorescence measurements. [Ca2+] i was calculated as previously described. 21 Manganese ion (Mn2+) quenching of fura-2 fluorescence was performed in Ca2+-containing medium containing 50 μM MnCl2. MnCl2 was added to cell suspension in the cuvette 30 s before the fluorescence recoding started. Data were recorded at excitation signal at 360 nm (Ca2+-insensitive) and emission signal at 510 nm at 1-s intervals as described previously. 22
Cell viability analyses
Viability was assessed as previously described. 18 –20 The measurement of viability was based on the ability of cells to cleave tetrazolium salts by dehydrogenases. An increase in the amount of developed color correlated with the number of live cells. Assays were performed according to manufacturer’s instructions (Roche Molecular Biochemical, Indianapolis, Indiana, USA). Cells were seeded in 96-well plates at a concentration of 104 cells per well in culture medium for 24 h in the presence of bifenthrin. The fluorescent cell viability detecting reagent 4-[3-[4-lodophenyl]-2-4(4-nitrophenyl)-2H-5-tetrazolio-1,3-benzene disulfonate] (WST-1; 10 μl pure solution) was added to samples after bifenthrin treatment, and cells were incubated for 30 min in a humidified atmosphere. The cells were incubated with/without bifenthrin for 24 h. The absorbance of samples (A450) was determined using an enzyme-linked immunosorbent assay (ELISA) reader. In experiments using BAPTA/AM to chelate cytosolic Ca2+, cells were treated with 5 μM BAPTA/AM for 1 h prior to incubation with bifenthrin. The cells were washed once with Ca2+-containing medium and incubated with/without bifenthrin for 24 h. The absorbance of samples (A450) was determined using an ELISA reader. Absolute optical density was normalized to the absorbance of unstimulated cells in each plate and expressed as a percentage of the control value.
Statistics
Data are reported as mean ± standard deviation (SD) of three independent experiments. Data were analyzed by one-way analysis of variances (ANOVA) using the Statistical Analysis System (SAS®, SAS Institute Inc., Cary, North Carolina, USA). Multiple comparisons between group means were conducted by post hoc analysis using the Tukey’s HSD (honestly significantly difference) protocol. A p value less than 0.05 represents significance.
Results
Effect of bifenthrin on [Ca2+] i in PC3 cells
Figure 1(b) shows that the basal [Ca2+] i level was 52 ± 2 nM (n = 3). At 100–400 μM, bifenthrin induced concentration-dependent rises in [Ca2+] i . At a concentration of 400 μM, bifenthrin induced [Ca2+] i rises of 90 ± 2 nM (n = 3). This signal was followed by a slow decay within 200 s. The Ca2+ response saturated at 400 μM bifenthrin because 600 μM bifenthrin did not evoke greater responses (not shown). In Ca2+-free medium, bifenthrin also induced concentration-dependent rises in [Ca2+] i at 100–400 μM. At 400 μM, bifenthrin induced rises in [Ca2+] i of 41 ± 2 nM (n = 3; Figure 1(c)). Figure 1(d) shows the concentration–response relationship. Ca2+ removal reduced the Ca2+ signal by approximately 30%. The EC50 value was 140 ± 3 μM in Ca2+-containing or 100 ± 3 μM in Ca2+-free medium, respectively, by fitting to a Hill equation (p < 0.05). Hill equation is Y = min + (max − min)/1 + (X/EC50)−Hillslope. The X value for the curve point is midway between the max and min parameters. Hillslope characterizes the slope of the curve at its midpoint. Large values result in a steep curve whereas small values a shallow curve. By definition, EC50 value is the effective concentration that induces 50% of maximum response. In our study, EC50 of 140 μM means that at 140 μM, bifenthrin induced 50% of maximum response in Ca2+-containing medium. Thus, this value can give us an idea of the effective concentration range of an agent. The p < 0.05 is relative to the basal [Ca2+] i level (without bifenthrin).
The source of bifenthrin-induced Ca2+ release in PC3 cells
Because bifenthrin-induced Ca2+ response saturated at 400 μM, in the following experiments, the response induced by 400 μM bifenthrin was used as control. Experiments were conducted in Ca2+-free medium to exclude the involvement of Ca2+ influx. Figure 2(a) shows that the addition of 50 μM BHQ, a selective inhibitor of Ca2+ ATPases pump, 23 induced [Ca2+] i rises of 51 ± 2 nM (n = 3). Bifenthrin (400 μM) added afterward at 500 s failed to induce [Ca2+] i rises. Figure 2(b) shows that after 400 μM bifenthrin-induced [Ca2+] i rises, the addition of 50 μM BHQ at 500 s failed to induce [Ca2+] i rises (n = 3). The data suggest that the endoplasmic reticulum played a dominant role in bifenthrin-induced Ca2+ release from intracellular stores.
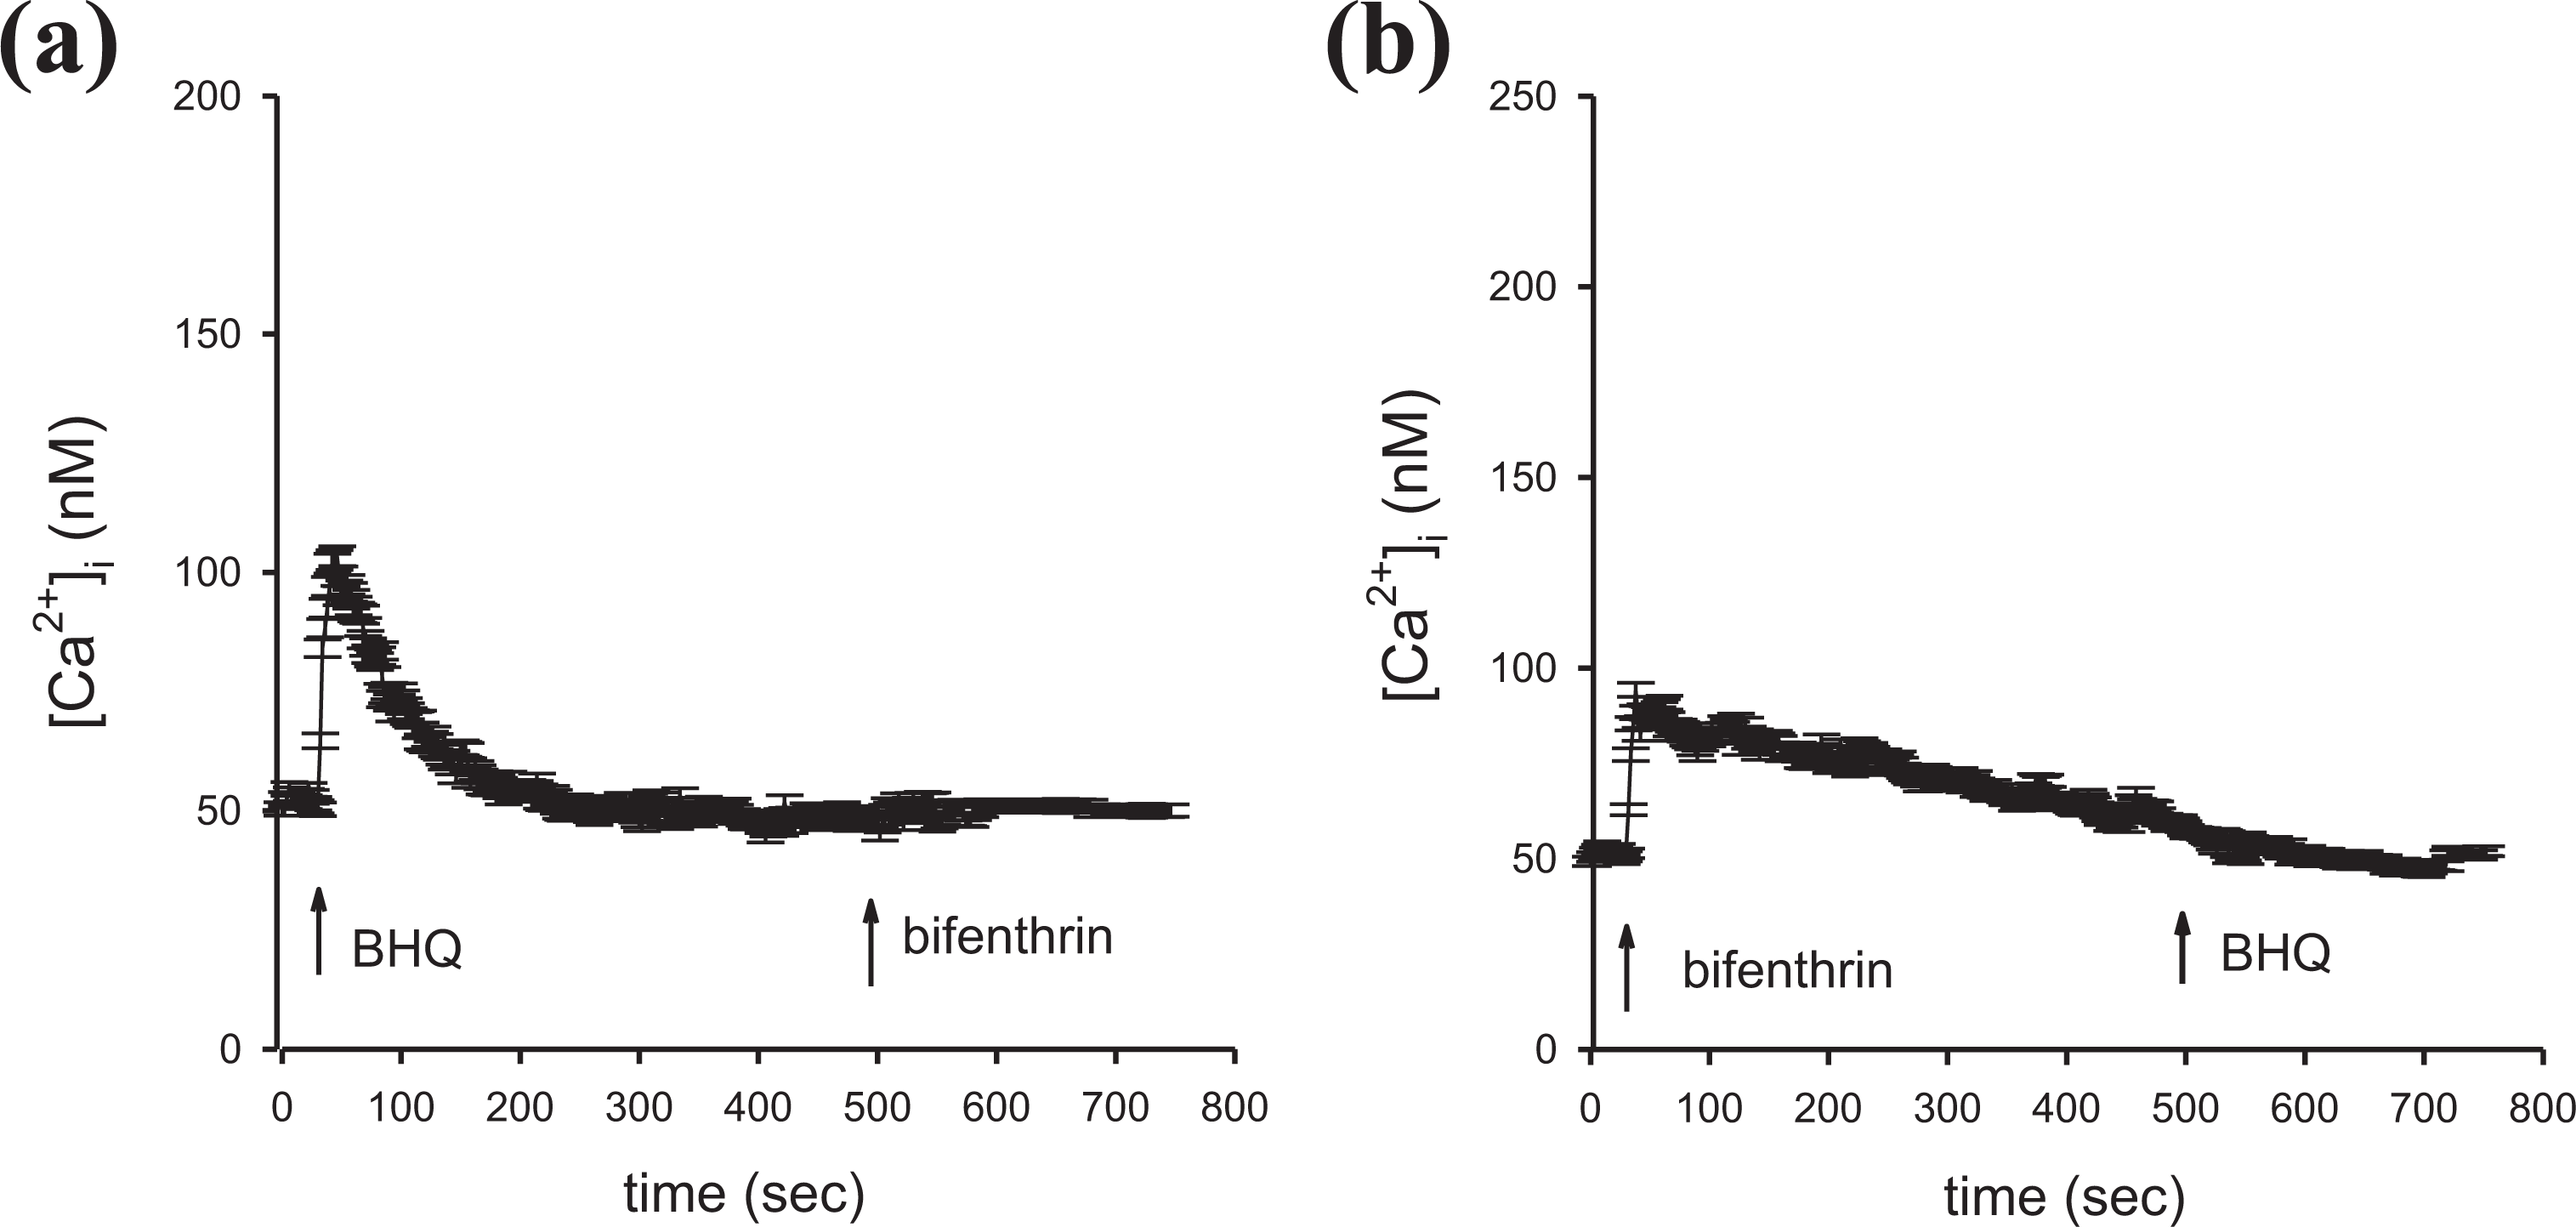
Effect of BHQ on bifenthrin-induced Ca2+ release in PC3 cells. (a) and (b) BHQ (50 μM) and bifenthrin (400 μM) were added at time points indicated. Experiments were performed in Ca2+-free medium. Data are mean ± SD of three independent experiments. Ca2+: calcium ion; BHQ: 2,5-di(tert-butyl)-1,4-benzohydroquinone; SD: standard deviation.
A role of PLC in bifenthrin-induced [Ca2+] i rises in PC3 cells
U73122, 24 a PLC inhibitor, was applied to explore if the activation of PLC was required for bifenthrin-induced Ca2+ release. Figure 3(a) shows that adenosine triphosphate (ATP; 10 μM) induced [Ca2+] i rises of 51 ± 2 nM (n = 3). ATP is a PLC-dependent agonist of [Ca2+] i rises in most cell types. 25 Figure 3(b) shows that incubation with 2 μM U73122 did not change basal [Ca2+] i but abolished ATP-induced [Ca2+] i rises. This suggests that U73122 effectively suppressed PLC activity. The data also show that incubation with 2 μM U73122 nearly abolished 400 μM bifenthrin-induced [Ca2+] i rises (n = 3). As a negative control of U73122 effect, the PLC-insensitive structural analog of U73122, U73343, was used to test its effect on ATP-induced Ca2+ signal. Our results suggest that U73343 (2 μM) failed to affect ATP-caused [Ca2+] i rises (not shown). These data implicate that bifenthrin-evoked Ca2+ release from the endoplasmic reticulum depended on PLC activity.

Effect of U73122 on bifenthrin-induced Ca2+ release in PC3 cells. Experiments were performed in Ca2+-free medium. (a) ATP (10 μM) was added at 25 s. (b) First column is 400 μM bifenthrin-induced [Ca2+] i rises. Second column shows that 2 μM U73122 did not alter basal [Ca2+] i . Third column shows ATP-induced [Ca2+] i rises. Fourth column shows that U73122 pretreatment for 200 s abolished ATP-induced [Ca2+] i rises (*p < 0.05 compared to first column). Fifth column shows that U73122 (incubation for 200 s) and ATP (incubation for 50 s) pretreatment inhibited 400 μM bifenthrin-induced [Ca2+] i rises. Data are mean ± SD of three independent experiments. Ca2+: calcium ion; ATP: adenosine triphosphate; SD: standard deviation.
Bifenthrin-induced Mn2+ influx in PC3 cells
Experiments were performed to confirm that bifenthrin-evoked [Ca2+] i rises involved Ca2+ influx. Figure 4 shows that 400 μM bifenthrin evoked an instant decrease in the 360 nm excitation signal that reached a value of 130 ± 4 arbitrary units at 250 s (n = 3). The data implicate that bifenthrin-caused [Ca2+] i rises involved Ca2+ influx.
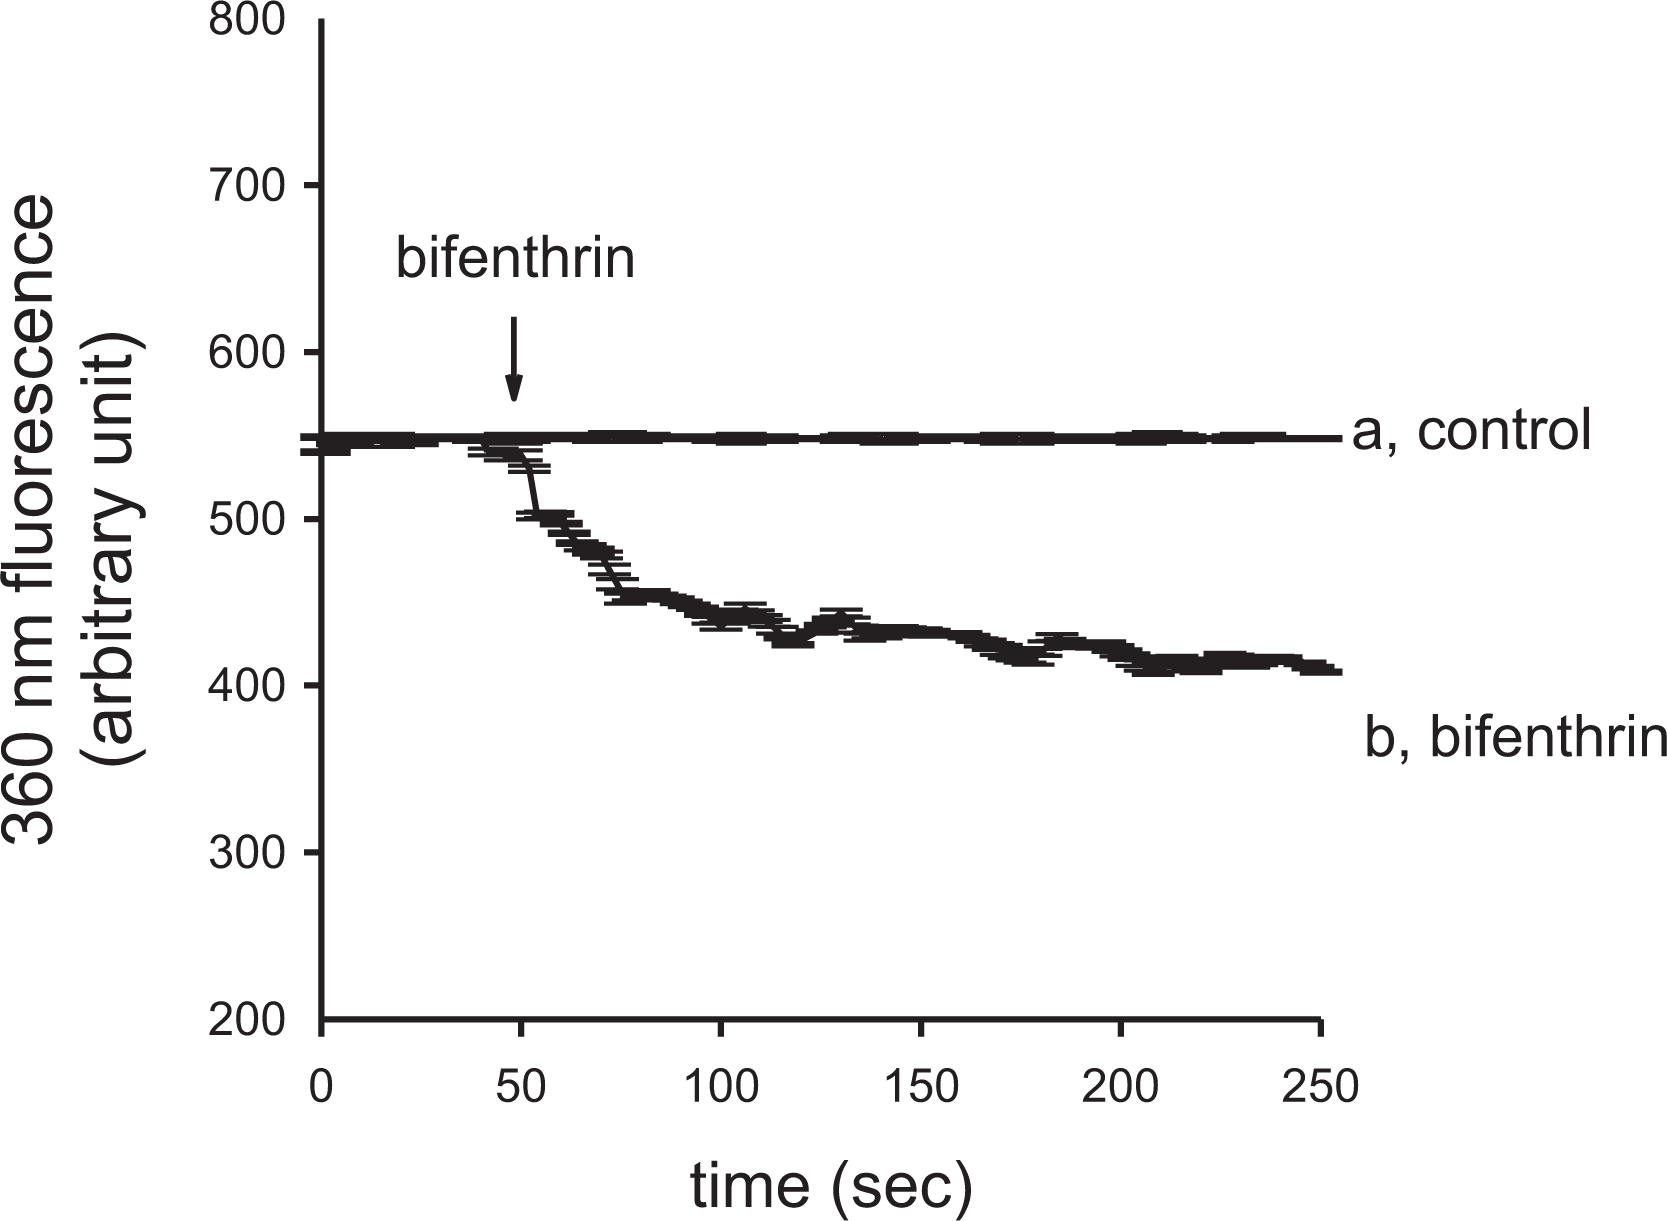
Effect of bifenthrin on Ca2+ influx by measuring Mn2+ quenching of fura-2 fluorescence in PC3 cells. Experiments were performed in Ca2+-containing medium. MnCl2 (50 μM) was added to cells 1 min before fluorescence measurements. The Y-axis is fluorescence intensity (in arbitrary units) measured at the Ca2+-insensitive excitation wavelength of 360 nm and the emission wavelength of 510 nm. Trace a: control, without bifenthrin. Trace b: bifenthrin (400 μM) was added as indicated. Data are mean ± SD of three independent experiments. Ca2+: calcium ion; Mn2+: manganese ion; MnCl2: manganese chloride; SD: standard deviation.
Regulation of bifenthrin-induced [Ca2+] i rises in PC3 cells
Phorbol 12-myristate 13 acetate (PMA; 1 nM; PKC activator), GF109203X (2 μM; a PKC inhibitor), econzaole (0.5 μM), nifedipine (1 μM), or SKF96365 (5 μM) was applied 1 min before bifenthrin (400 μM), in Ca2+-containing medium, then [Ca2+] i changes were measured. All these five chemicals inhibited bifenthrin-induced [Ca2+] i rises by approximately 30% (p < 0.05; n = 3; Table 1). Furthermore, we have performed Ca2+ adding back experiments. Cells were first incubated in Ca2+-free medium, then bifenthrin was added at 25 s to induce a [Ca2+] i rise. At the time point of 500 s, 3 mM Ca2+ was added back to the suspension. This immediately induced a [Ca2+] i rise which was taken as control. In this experiment, each of the inhibitors was added 30 s before 3 mM Ca2+. Nifedipine, econazole, SKF96365, PMA, and GF109203X all significantly inhibited Ca2+-induced [Ca2+] i rises by 30% (n = 3; not shown). Therefore, bifenthrin-induced Ca2+ influx appears to be partly mediated by PKC-regulated store-operated Ca2+ entry.
Effect of Ca2+ channel modulators on bifenthrin-induced [Ca2+] i rises in PC3 cells.

Ca2+: calcium ion; PMA: phorbol 12-myristate 13 acetate; SD: standard deviation.
aIn modulator-treated group, the regulator was added 1 min before terfenadine (1000 μM). The concentration was 2 μM for GF109203X, 10 nM for PMA, 0.5 μM for econazole, 1 μM for nifedipine, and 5 μM for SKF96365. Data are presented as the percentage of control that is the area under the curve (25–200 s) of 400 μM bifenthrin-evoked [Ca2+] i rises in Ca2+-containing medium and are mean ± SD of three independent experiments.
bp < 0.05 compared to control.
Effect of bifenthrin on viability of PC3 cells
Tetrazolium assay was performed after cells were treated with 0–275 μM bifenthrin for 24 h. In the presence of 175–275 μM bifenthrin, cell viability decreased in a concentration-dependent manner (n = 3; Figure 5). The EC50 value was 212 ± 3 μM by fitting to a Hill equation (p < 0.05). The intracellular Ca2+ chelator BAPTA/AM 26 was applied to prevent [Ca2+] i rises during bifenthrin pretreatment, to explore the role of Ca2+ in bifenthrin-induced cell death. Figure 5 also shows that 5 μM BAPTA/AM loading did not change the control value of cell viability. Bifenthrin (400 μM) did not evoke [Ca2+] i rises in BAPTA/AM-treated cells in both Ca2+-containing and Ca2+-free solutions (not shown). This suggests that BAPTA loading for 25 h still effectively chelated cytosolic Ca2+. In the presence of 175–275 μM bifenthrin, BAPTA loading failed to reverse bifenthrin-induced cell death. Collectively, the results imply that bifenthrin-evoked death of PC3 cells was dissociated from preceding rises in [Ca2+] i .
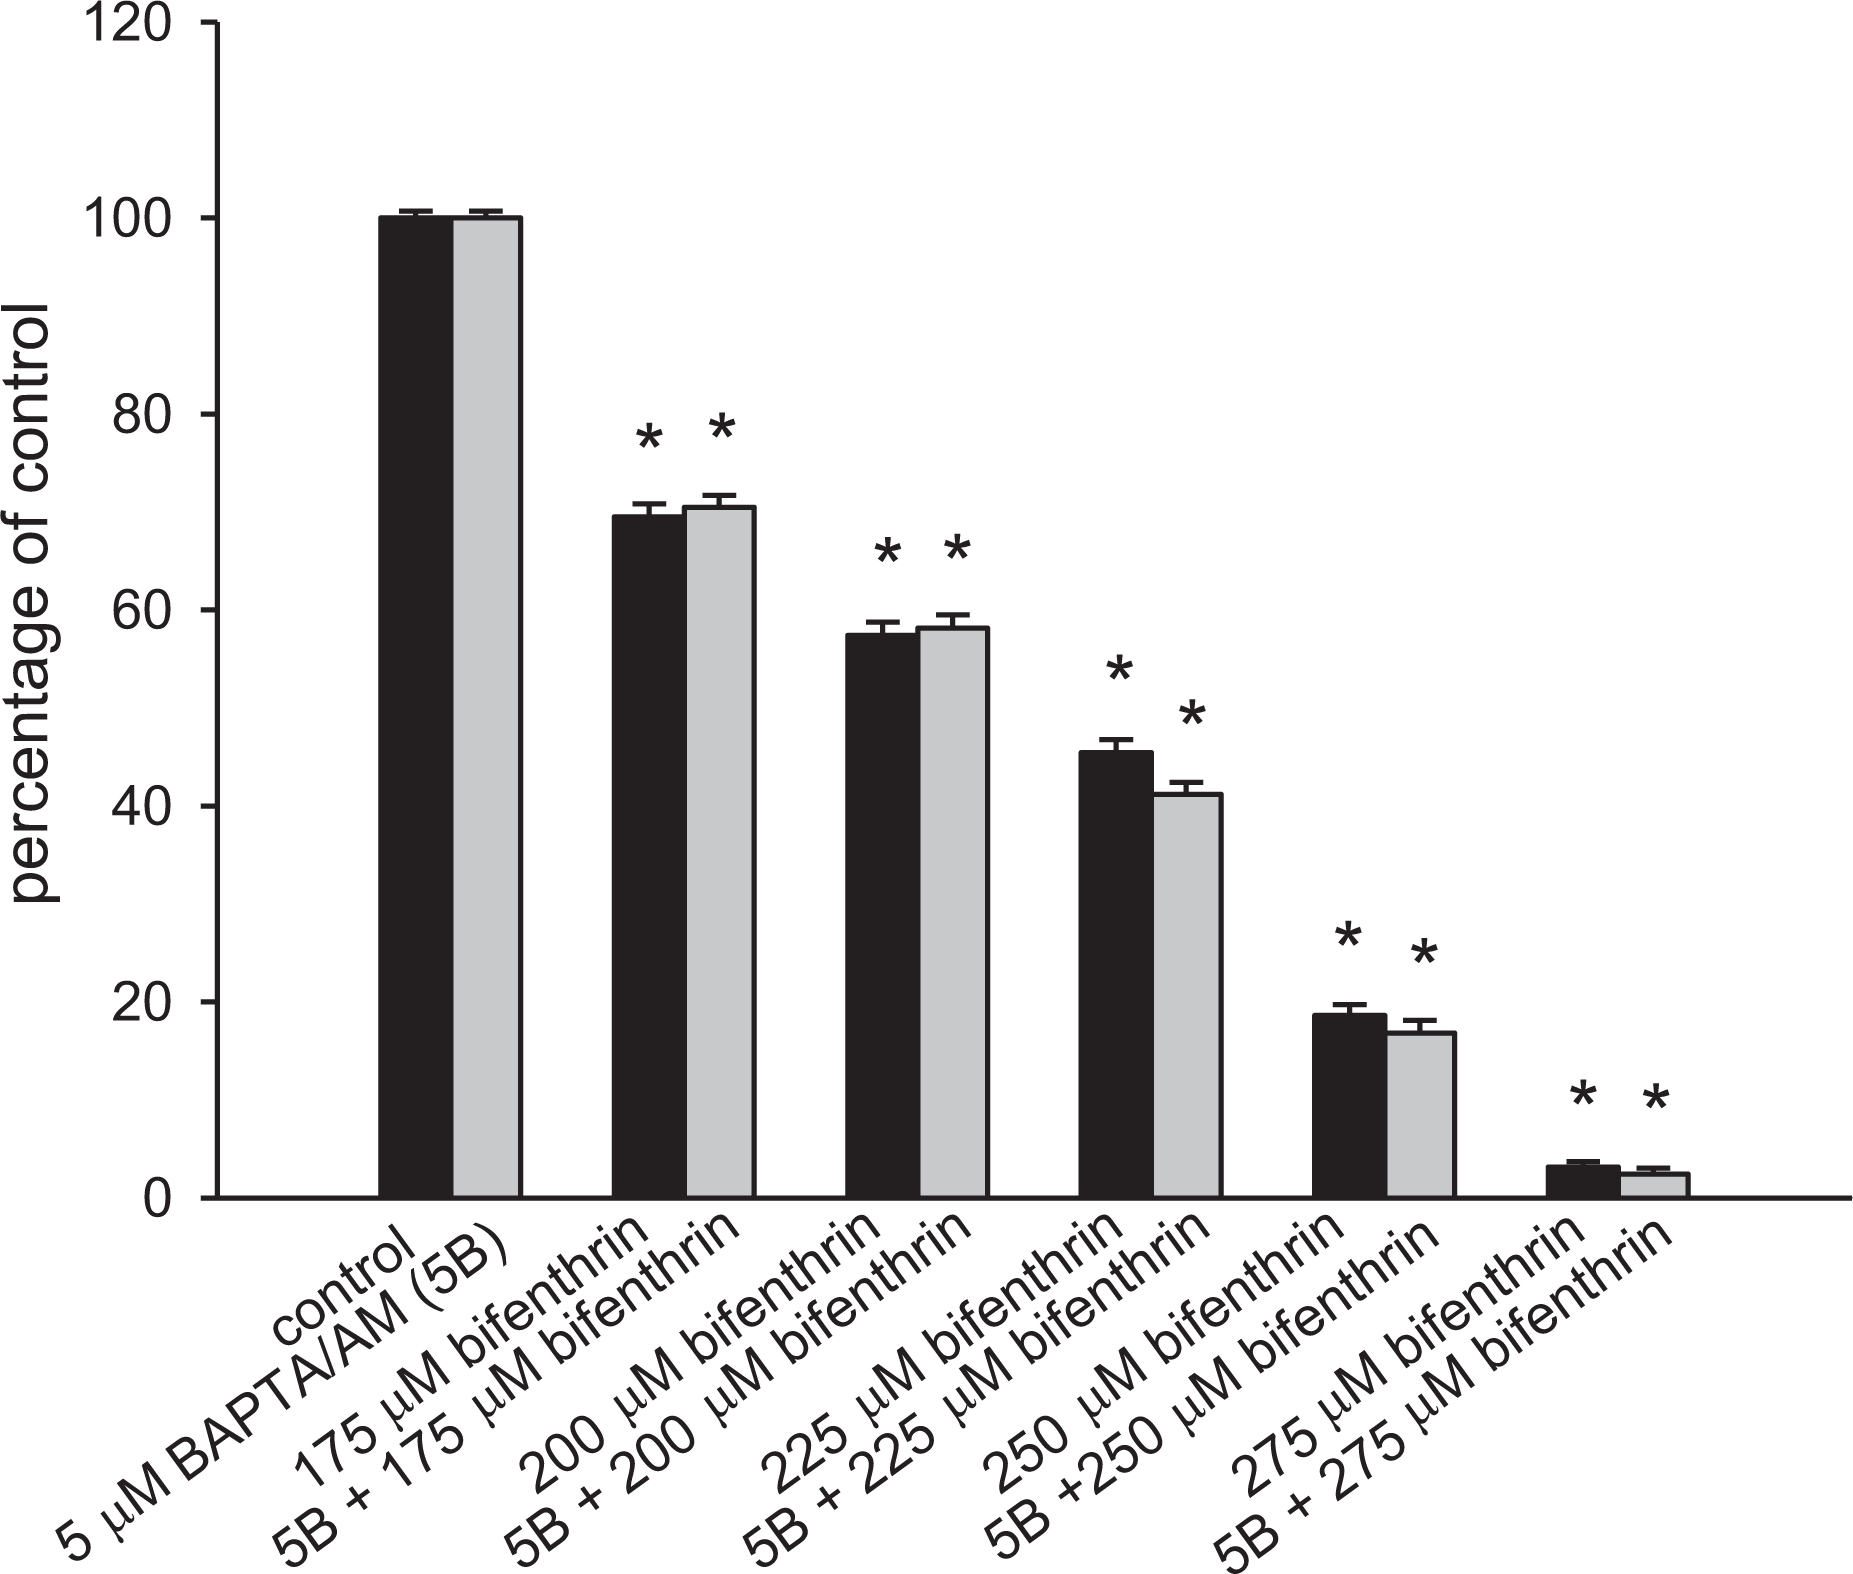
Effect of bifenthrin on cell viability in PC3 cells. Cells were treated with 0–275 μM bifenthrin for 24 h, and the cell viability assay was performed. Data are mean ± SD of three independent experiments. Each treatment had six replicates (wells). Data are expressed as percentage of control response that is the increase in cell numbers in bifenthrin-free groups. Control had 11,158 ± 222 cells/well before experiments and had 13,965 ± 211 cells/well after incubation for 24 h. *p < 0.05 compared to control. In each group, the Ca2+ chelator BAPTA/AM (5 μM) was added to fura-2-loaded cells followed by treatment with bifenthrin in Ca2+-containing medium. Ca2+: calcium ion; BAPTA/AM: 1,2-bis(2-aminophenoxy)ethane-N,N,N′,N′-tetra acetic acid/acetoxy methyl; SD: standard deviation.
Discussion
Bifenthrin is one of the most potent pyrethroids with LD50 values of 53–70 mg kg−1 in rats after oral gavage. 27 Bifenthrin, as low as 10 mg kg−1, produces type I pyrethroid-like episodes of whole-body shakes, strong tremorigenic responses, hyperthermia, vocalizations, and prostration. 27 This dose range corresponds to a brain concentration of bifenthrin of 600 ng g−1 of brain tissue. 28 In vivo, a multilevel evaluation of potential liver injury of bifenthrin has been performed. 29 In addition to toxicological effects of bifentrhin on brain or liver, the increased risk of the antiandrogenic activity and the reduction of prostate weight were shown in bifenthrin-treated rats. 17 Therefore, our study explored the toxic effect of bifentrhin on human prostate cancer cells.
Previous studies showed that bifentrhin affected Ca2+ signaling in cortical neuron development. 9 However, whether bifentrhin affects Ca2+ homeostasis and physiology in PC3 cells is unclear. This study explored the effect of bifenthrin on Ca2+ signaling and viability in PC3 cells. Our study shows that bifenthrin concentration-dependently increased [Ca2+] i in PC3 cells. The Ca2+ signal was composed of Ca2+ entry and Ca2+ release because the signal was reduced by 30% by removing extracellular Ca2+.
Among all the organelles, the endoplasmic reticulum has been shown to be the main Ca2+ store in most cell types. 30 Thus, the role of the endoplasmic reticulum in bifenthrin-evoked Ca2+ release in PC3 cells was explored. The BHQ-sensitive endoplasmic reticulum store appears to be the pivotal Ca2+ store. Regarding the mechanism, one possibility was that bifenthrin acts similarly to BHQ by inhibiting the endoplasmic reticulum Ca2+-ATP pump. 31 Many pathways regulate the release of Ca2+ from intracellular stores. Among them, PLC is one of the pivotal proteins. 32 Accordingly, the role of PLC activation in bifenthrin-evoked Ca2+ release was examined. The results demonstrate that the Ca2+ release mainly depended on PLC activation, because the release was significantly inhibited when PLC activity was suppressed.
The mechanism of bifenthrin-induced Ca2+ influx was explored. Because Mn2+ enters cells through similar mechanisms as Ca2+ but quenches fura-2 fluorescence at all excitation wavelengths, 33 quenching of fura-2 fluorescence excited at the Ca2+-insensitive excitation wavelength of 360 nm by Mn2+ implicates Ca2+ influx. In PC3 cells, the main pathway of Ca2+ influx is the store-operated Ca2+ entry. 18 The main internal Ca2+ store is the endoplasmic reticulum Ca2+ store. 34 Since Ca2+ signaling is so important, cells have complex mechanisms to regulate Ca2+ influx and release. Previous studies have shown that different compounds such as timolol or carvacrol induced Ca2+ entry through store-operated Ca2+ channels in PC3 cells. 18,19 Our findings show that bifenthrin-evoked [Ca2+] i rises were inhibited by 30% by econazole, nifedipine, and SKF96365. These three compounds have been used to inhibit store-operated Ca2+ entry. 35 –37 Therefore, bifenthrin appears to cause Ca2+ entry via store-operated Ca2+ entry which is induced by depletion of intracellular Ca2+ stores. 38
The activity of many protein kinases is known to associate with Ca2+ homeostasis. 39,40 Our data show that bifenthrin-evoked [Ca2+] i rises were inhibited by enhancing or inhibiting PKC activity. This may suggest that a normally maintained PKC activity was necessary for a full response of 400 μM bifenthrin-induced [Ca2+] i rises. Literature also shows that PKC plays a key role in the activation of store-operated Ca2+ entry in models such as myotubes. 41 Because 30% of bifenthrin-induced [Ca2+] i rises were via Ca2+ influx, this influx appears to be totally contributed by PKC-sensitive store-operated Ca2+ entry.
Evidence accumulates that abnormal rises in [Ca2+] i may lead to changes in cell viability. 42 Thus, the effect of bifenthrin on viability of PC3 cells was explored. Ca2+ and cell viability may have an interactive relationship. 43,14 Our data show that bifenthrin-induced Ca2+-independent cell death in a concentration-dependent fashion. Although bifenthrin-evoked [Ca2+] i rises were not cytotoxic, they may affect other Ca2+-related cellular responses in PC3 cells. 43,14
The literature shows that the plasma level of bifenthrin in human patients may reach 20 μM. 44,29 In patients with liver or kidney dysfunction or healthy persons exposing to higher doses, this level may go much higher. Our findings show that at a concentration of 175 μM, bifenthrin evoked death of 30% of PC3 cells. Thus, the clinical relevance of our data may not be excluded.
Together, the data implicate that bifenthrin caused Ca2+ entry via PKC-sensitive store-operated Ca2+ entry and also Ca2+ release from the endoplasmic reticulum in a PLC-dependent fashion. Furthermore, bifenthrin caused Ca2+-independent cell death. Since [Ca2+] i rises play a triggering or modulatory role in numerous cellular phenomena, the effect of bifenthrin on [Ca2+] i and cell viability should be taken into account in other in vitro study. There are some limitations in this study. First, the evaluation of the toxicological effect of bifenthrin was restricted to one human prostate cancer cell line, PC3, and thus other human prostate cancer (e.g., LNCaP or/and DU145) cells could also be employed to examine the toxicological effect. Second, the toxicity of bifenthrin to prostate function was not evaluated in an animal model. Because an in vitro study cannot perfectly mimic an in vivo exposure, in the future, our research will expand to the in vivo toxicity of bifenthrin.
Footnotes
Author contribution
J-MC, W-ZL, and W-CL are contributed equally to this work.
Declaration of conflicting interests
The author(s) declared no potential conflicts of interest with respect to the research, authorship, and/or publication of this article.
Funding
The author(s) disclosed receipt of the following no financial support for the research, authorship, and/or publication of this article: This work was supported by PS105013, 106-001, and 107-001 to J-MC and VGHKS 107-169 to C-RJ.