
Abstract
Objective
We aimed to explore the mechanisms underlying paraquat (PQ)-induced damage using cell lines (NCTC1469, TC-1, TCMK-1) and bioinformatic analysis of the GSE153959 dataset. Assessment of changes in the expression of ferroptosis-related genes in cellular damage due to paraquat poisoning and the important value of these genes in the pathogenesis.
Methods
Data were retrieved from the Gene Expression Omnibus database. The differentially expressed genes (DEGs) related to ferroptosis were identified by Venn plots and analyzed for enrichment. Proteins encoded by these DEGs were studied for interactions. qRT-PCR and western blotting analyses of cultured cells were used to determine the expression of ferroptosis-related DEGs and their corresponding protein levels.
Results
We identified 25 DEGs primarily involved in epidermal growth factor receptor signaling, apoptotic signaling pathways, endoplasmic reticulum (ER) stress, and ferroptosis. From these, we uncovered eight ferroptosis-related DEGs, four of which were involved in ER response and regulators of ferroptosis—Chac1 (ChaC glutathione specific gamma-glutamylcyclotransferase 1), Atf3 (activating transcription factor 3), Tfrc (transferrin receptor), and Slc7a11 (solute carrier family 7 member 11). Significant changes in mRNA and protein levels of CHAC1, ATF3, TFRC, and SLC7A11 were confirmed in PQ-exposed cells.
Conclusion
ER stress and ferroptosis are critical for PQ-induced cell damage. CHAC1, ATF3, TFRC, and SLC7A11 are essential molecules implicated in PQ-induced ferroptosis that may serve as therapeutic targets for the amelioration of PQ poisoning.
Introduction
Paraquat (PQ) is an extremely effective and environmentally friendly herbicide used worldwide; however, its use has been restricted owing to the high mortality rate associated with PQ poisoning, particularly in individuals who attempt suicide. Data indicate that PQ poisoning is responsible for 0.34% of pesticide poisoning cases, with the highest fatality rate (50–90%), accounting for 13% of all deaths. 1 Exposure to high concentrations of PQ can cause multiple organ dysfunction, damaging the lungs, kidneys, heart, and liver. We have previously shown that PQ-induced oxidative stress leads to antioxidant depletion, lipid peroxidation, and membrane rupture. 2 In addition, treatment with PQ increases malondialdehyde levels and decreases the expression of catalase, and glutathione (GSH) peroxidase. 3 PQ is thought to trigger cell death via apoptosis; however, human pulmonary epithelial cells exposed to high concentrations of PQ have displayed mitochondrial damage, autophagy, and, ultimately, cell necrosis, 4 the mechanisms of which remain unclear. Latest studies have uncovered a substantial link between ferroptosis, a recently discovered type of cell death, and exposure to PQ. In dopaminergic SH-SY5Y cells, PQ induced neurodegeneration through ferroptosis, mediated by the nicotinamide adenine dinucleotide phosphate (NADPH) oxidase (NOX). The PQ effect on ferroptosis and neurodegeneration was mitigated by NOX inhibitors. 5 Therefore, we hypothesized that preventing ferroptosis offers therapeutic benefit for PQ-induced cell damage. To test this hypothesis, we employed bioinformatic tools to analyze the differentially expressed genes (DEGs) in PQ-treated and untreated samples. Through comparison between these DEGs and genes associated with ferroptosis, we identified the ferroptosis-related DEGs. Multiple cell lines were used to examine the effects of PQ poisoning on the expression of ferroptosis-related DEGs. This study identified critical molecules involved in PQ-induced ferroptosis, therefore uncovering potential new therapeutic targets for PQ poisoning.
Methods
Gene expression profile and differentially expressed genes identification
The GSE153959 dataset, comprising the information of six samples, was retrieved from the Gene Expression Omnibus (GEO; http://www.ncbi.nlm.nih.gov/geo). The RNA from this database was isolated from TAMHs cultured with PQ, or control culture media after 9 h of incubation. The GEO2R platform, an online tool, was used to identify DEGs with the following criteria: |log2fold change (FC)| > 1 and Padj < 0.05 between both groups. Volcano plots were created using the R software package, ggplot2 (v3.3.3). 6
Functional and pathway enrichment analyses
Gene Ontology (GO) and Kyoto Encyclopedia of Genes and Genomes (KEGG) enrichment analyses were conducted using the clusterProfiler package. 7 Entrez IDs were converted to gene symbols (v3.10.0) using annotations of the org.Hs.eg.db package. GO enrichment data were combined with expression data to calculate z-scores. Chord, bubble, and GOCircle plots were generated using the R package GOplot v.1.0.2. 8
The DEGs were entered into the Metascape platform (http://metascape.prg/gp/index.html) 9 to further assess their interactions. Their main biological processes were analyzed again, and subsequently, functional enrichment analysis was conducted.
Protein–protein interaction network construction and hub gene analysis
The DEGs were uploaded to the STRING database (https://string-db.org/) 10 for PPI analysis, with a STRING interaction score set at 0.4. Cytoscape was used to visualize STRING results and CytoHubba was used to identify the critical genes in the PPI network. The top 10 genes of the Hubba nodes were defined as hub genes. 11
Identification of ferroptosis-related differentially expressed genes
We analyzed the ferroptosis dataset (FerrDb; http://www.zhounan.org/ferrdb/current/), which includes the information of genes encoding 256 drivers, 209 suppressors, and 126 markers of ferroptosis. FerrDb is the first manually curated database for regulators and markers of ferroptosis and ferroptosis-associated diseases.12,13 This dataset was intersected with the GSE153959 dataset to identify DEGs upon PQ treatment that might also be related to ferroptosis. Venn diagrams were created using R software package ggplot2.
PPI network analysis of ferroptosis-related differentially expressed genes
The STRING database was utilized to predict interactions between proteins encoded by the ferroptosis-related DEGs. Cytoscape network visualization was performed for interaction scores above 0.4. Molecular Complex Detection (MCODE) was employed for gene network clustering analysis to identify significant PPI network modules. 14 The purpose of MCODE was to select important subnetworks or modules; different genes within a module show distinct module scores, based on which important genes can be selected. The module was considered significantly important when p < 0.05.
Effects of PQ on mouse cell lines
Mouse liver cells (NCTC1469) (ATCC, USA) were cultured in low-glucose Dulbecco’s modified Eagle’s medium (DMEM) (Gibco, USA). Kidney cells (TCMK-1) (ATCC, USA) and primary lung epithelial cells (TC-1) (ATCC, USA) were cultured in DMEM containing 10% fetal bovine serum, 50 U/mL penicillin, and 50 mg/mL streptomycin. All cell lines were grown in a humidified incubator with 5% CO2 at 37°C. A CCK8 assay (Abcam, USA) was used to determine the half-maximal inhibitory concentration (IC50) of PQ. The PQ concentrations for the ferroptosis induction tests were chosen based on the IC50 value. Cells at 80% confluency were exposed to PQ (Sigma-Aldrich, Germany) at a final concentration of 0.4 and 1.0 mM for 9 and 24 h, for qRT-PCR and western blotting analysis, respectively.
qRT-PCR analysis of ferroptosis-related differentially expressed genes
Primer sequences used for qRT-PCR.

Western blotting analysis of ferroptosis-related protein levels
After 24 h of incubation with PQ, cells were harvested and lysed with radioimmunoprecipitation assay (RIPA) buffer containing protease inhibitors. Total protein levels were quantified using the Bradford reagent (Sigma-Aldrich, Germany), following manufacturer’s instructions. The proteins were separated through electrophoresis in a denaturing 4–20% sodium dodecyl sulfate polyacrylamide gel and wet-electroblotted on polyvinylidene difluoride membranes (Millipore, USA). Membranes were blocked with a 3% skim milk powder solution before incubation with specific primary antibodies (all from Proteintech, USA), such as those against ATF3, TFRC, CHAC1, SLC7A11, and GAPDH. Subsequently, the membranes were incubated with horseradish peroxidase-conjugated secondary antibodies for 2 h at 25°C, and imaged using Chemidoc XRS (Bio-Rad, USA).
Statistical analysis
GraphPad Prism 7.0 software was used to plot graphs and perform statistical analyses. All data are shown as the mean ± standard deviation (SD). One-way analysis of variance (ANOVA) followed by the least significant difference post hoc test was applied for the statistical comparisons between groups: control, PQ 0.4 mM, and 1.0 mM. The Student’s t-test was used to assess changes in DEG expression. Statistical significance was defined as p < 0.05.
Results
Identification of differentially expressed genes
Data from the GSE153959 dataset were filtered using the following cutoff values: |log2FC| > 1 and Padj < 0.05. After removal of the null value, the total number of GSE153959 IDs was 22,841, of which 25 met the filtering threshold, with 5 instances of increased expression (positive log2FC) and 20 instances of decreased expression (negative log2FC). A volcano plot depicts these data in Figure 1(a). Identification and functional clustering analysis of differentially expressed genes (DEGs) upon exposure to PQ. (a) Identification of DEGs using volcano plot analysis. Statistically significant DEGs were identified as those with an Padj < 0.05 and |logFC| > 1. Downregulated and upregulated DEGs are represented by blue and red dots, respectively. (b) GO and KEGG enrichment analyses of DEGs. (c) Bubble plot of significant GO and KEGG terms. Abbreviations: BP: biological process; CC: cellular component; KEGG: Kyoto Encyclopedia of Genes and Genomes; MF: molecular function. (d) GO circle plot of significant GO and KEGG terms. The inner circle is a bar plot where the height of the bar indicates the significance of the term (−log10 Padj), and the color corresponds to the z-score. The outer circle shows scatterplots of expression levels (logFC) for the assigned genes in each term. (e) GO chord plot of significant GO and KEGG terms. DEGs are linked via ribbons to their assigned terms. Blue-to-red coding next to the selected genes indicates logFC. (f) Network of enriched terms colored by cluster identity, where nodes that share the same cluster identity are close to each other.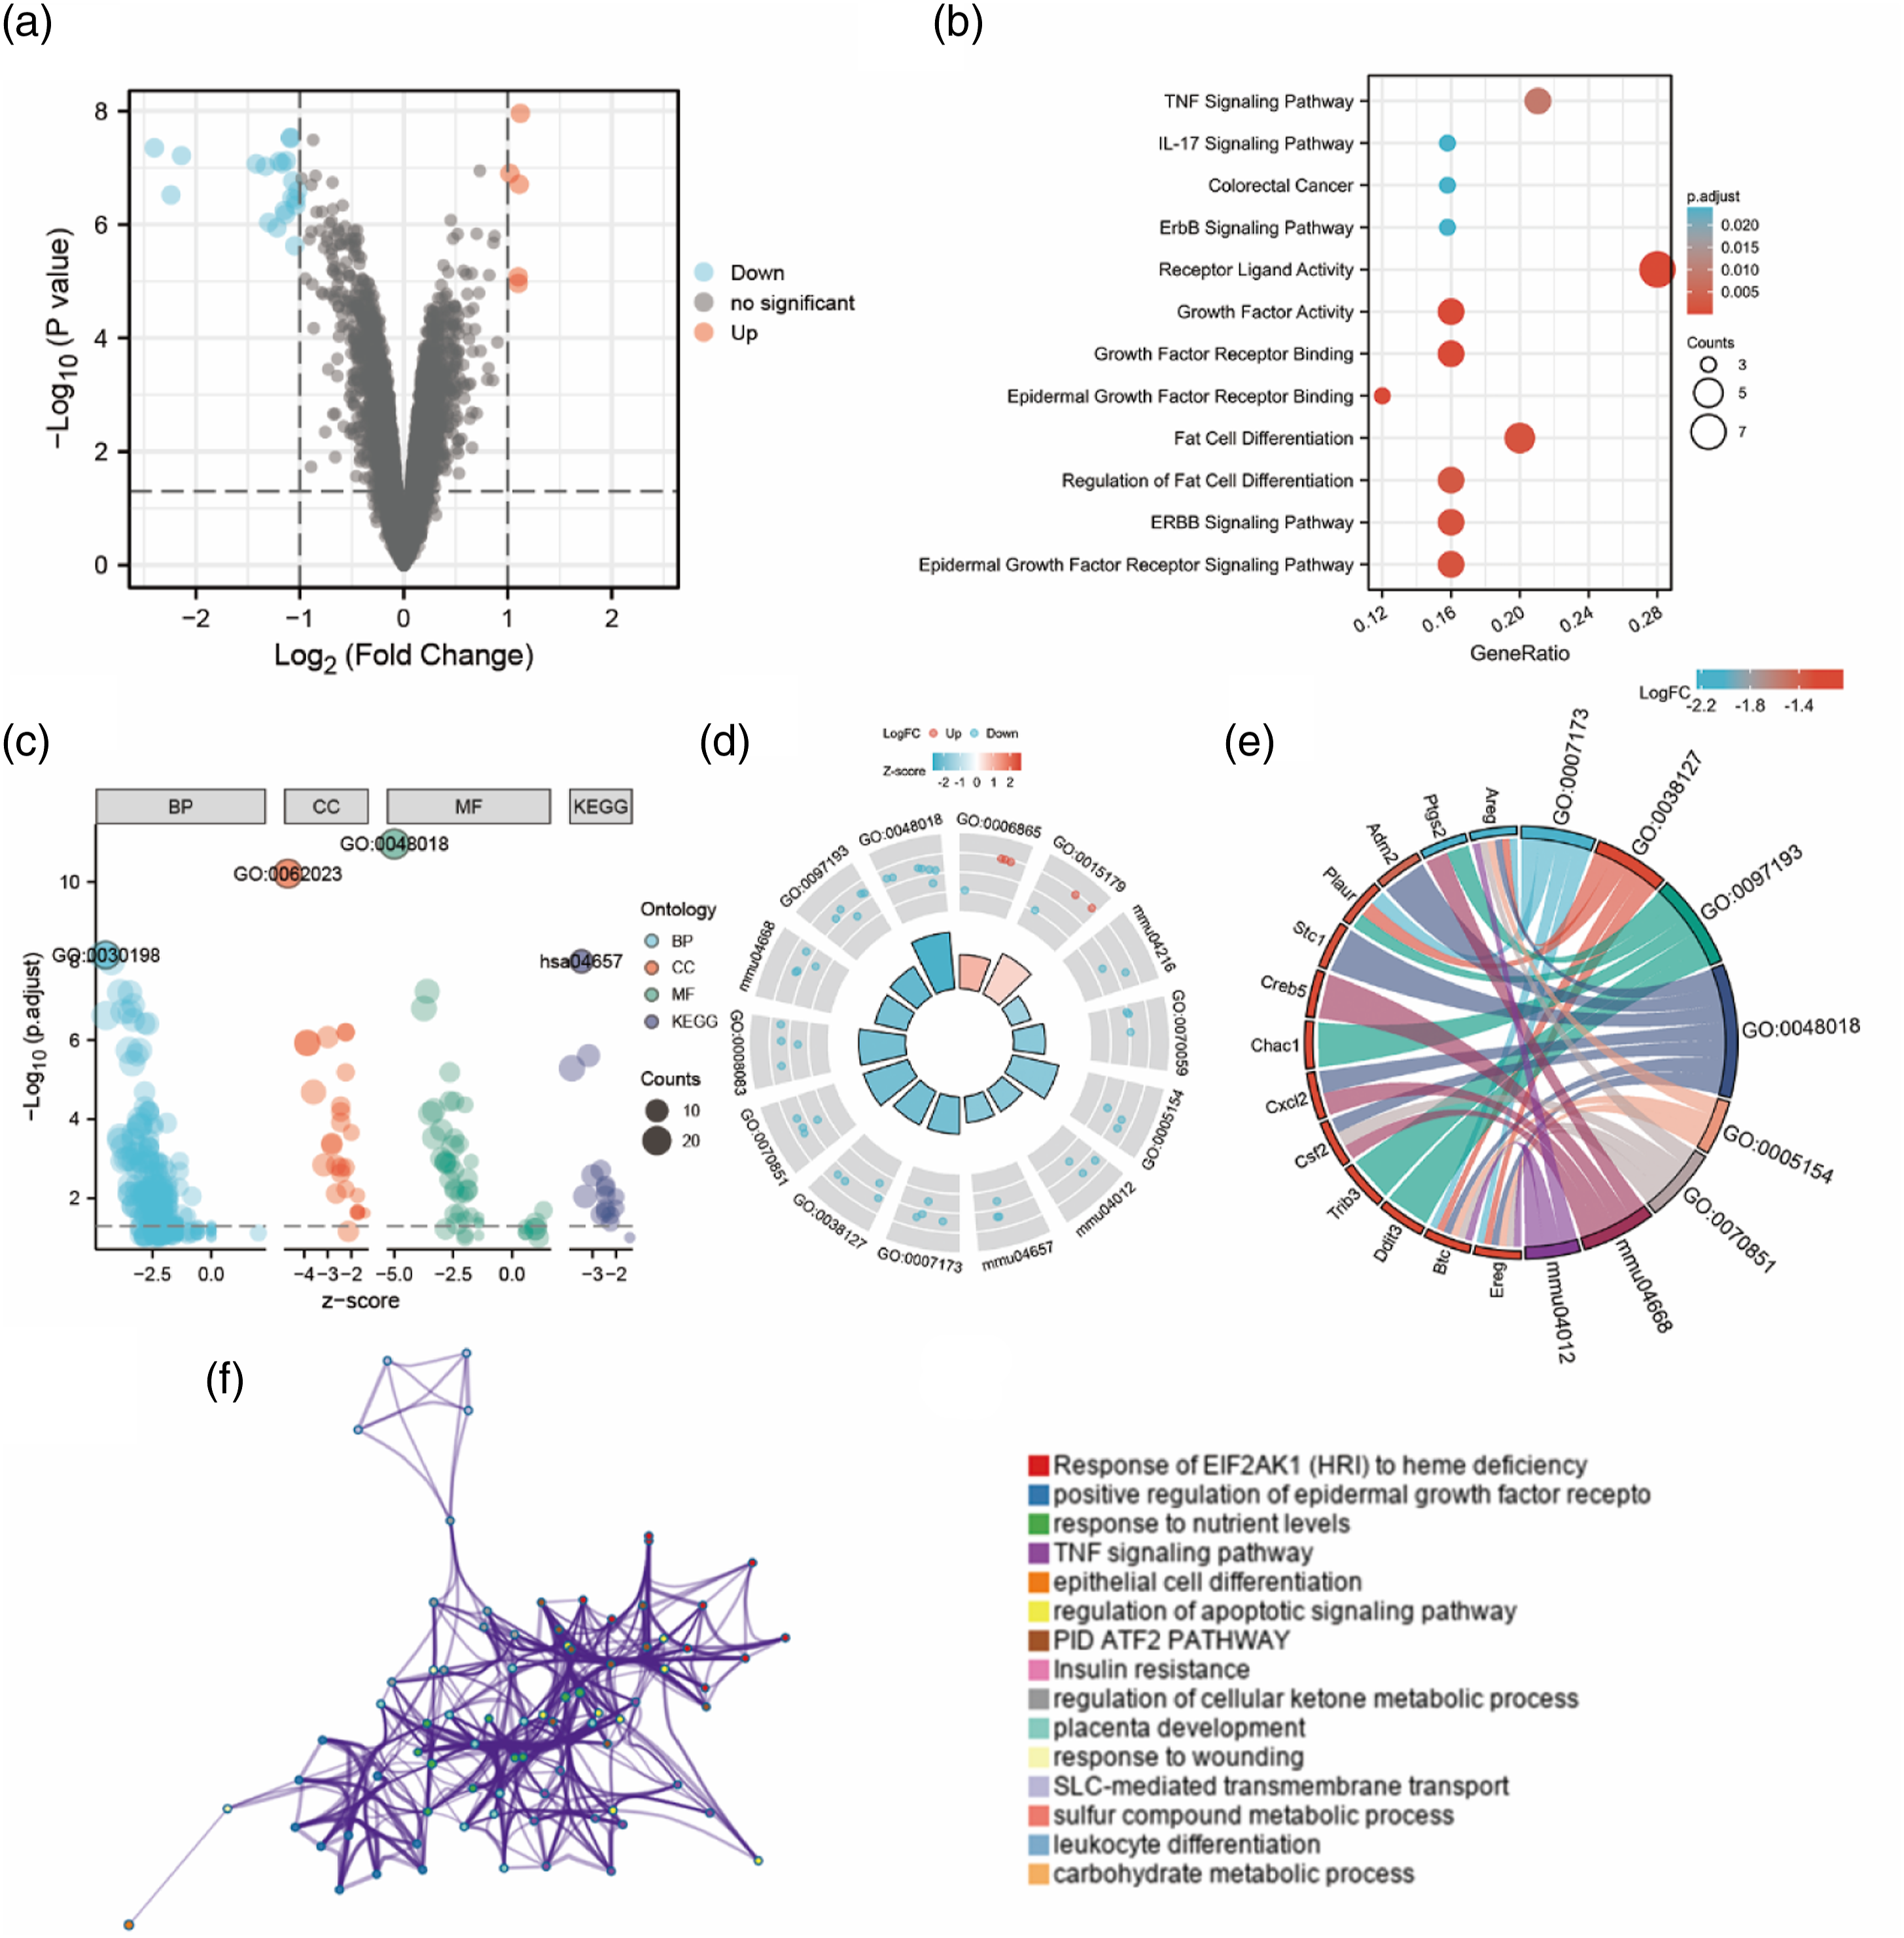
Functional enrichment of differentially expressed genes
Entrez IDs were successfully transformed for 23 of the 25 identified DEGs (conversion rate of 92%) using the org.Mm.eg.db package (version 3.10.0). Functional enrichment analysis of these genes was conducted using R software package clusterProfiler (version 3.14.3). 7 The enriched GO biological process terms included: epidermal growth factor receptor (EGFR) signaling; ERBB signaling system, intrinsic apoptotic signaling pathway, amino acid transport, and intrinsic apoptotic signaling pathway in response to endoplasmic reticulum (ER) stress (p < 0.01). Enriched GO molecular function terms included: receptor–ligand activity, EGFR binding, growth factor receptor binding, growth factor activity, and organic anion transmembrane transporter activity (p < 0.01). According to the KEGG analysis, DEGs upon exposure to PQ were enriched in the tumor necrosis factor (TNF), ERBB, and interleukin (IL)-17 signaling pathways, as well as in ferroptosis-related genes (p < 0.05; Supplementary Table S1 and Figure 1(b)).
Additionally, we combined the GO enrichment data with expression data (log2FC), to calculate the z-score, using the R package GOplot v.1.0.2, 8 while the R package ggplot2 v.3.3.3 was used to obtain bubble, GOCircle, and string plots (Figure 1(c)–(e)). Enrichment analysis by the Metascape platform 9 showed significant enrichment in: response of eukaryotic translation initiation factor 2 alpha kinase 1 (EIF2AK1) to heme deficiency, positive regulation of the EGFR signaling pathway, response to nutrient levels, TNF signaling pathway, and epithelial cell differentiation (Figure 1(f)).
PPI network analysis and hub genes
Using the STRING database (http://string-db.org) we built a PPI network (parameter: medium confidence level, 0.4) to investigate interaction between proteins encoded by DEGs upon PQ exposure. A total of 25 nodes and 29 edges were constructed for the 25 proteins encoded by the DEGs- (Figure 2(a)), which were separated in three clusters employing k-means clustering (Figure 2(b)). Alternatively, using MCL clustering
10
(inflation parameter: 3), the PPI network was separated into four clusters (Figure 2(c)). Gene clusters identified by the MCODE analysis using Cytoscape were mostly related to the EGFR signaling pathway and showed densely connected network components (Figure 2(d)). The top 10 hub genes were identified using the maximal clique centrality algorithm in CytoHubba (Figure 2€) and the biological functions of the hub genes were determined using the GeneCards database (https://www.genecards.org/, Supplementary Table 2). PPI network analysis of proteins encoded by the PQ-induced DEGs and identification of the hub genes. (a) Visualization of the identified DEGs in the Cytoscape network using the STRING online database (medium confidence: 0.4). Nodes represent genes and edges represent links between genes. (b) Gene network divided into three clusters using the k-means clustering method. (c) Gene network divided into four clusters using the MCL clustering approach (inflation parameter: 3). (d) MCODE identifies two key modules for the distinction of the network gene clusters. (e) Filtering of the top 10 hub genes using the CytoHubba plug-in maximal clique centrality algorithm.
Identification of ferroptosis-related differentially expressed genes
To identify ferroptosis-related genes, DEGs were plotted against the genes acquired from the ferroptosis dataset (the drivers, suppressors, and markers) through a Venn diagram using the R software package ggplot2 (Figure 3(a)), which yielded eight shared genes: including one suppressor gene, SLC7A11, and three driver genes, CHAC1, ATF3, and TFRC. Furthermore, four marker genes were also identified, namely, PTGS2 (prostaglandin-endoperoxide synthase 2), CXCL2 (C-X-C motif chemokine ligand 2), TRIB3 (tribbles pseudokinase 3), and DDIT3 (DNA damage inducible transcript 3). We performed enrichment analysis for these eight genes. Expression and enrichment analyses of ferroptosis-related DEGs. (a) Venn diagram to identify ferroptosis-related DEGs between the GSE153959 dataset and the ferroptosis-associated genes database (divided as drivers, suppressors, and markers). (b) Network of the enriched terms, colored by cluster ID, where nodes that share the same cluster ID are typically close to each other. (c) Bubble plot of significant GO and KEGG terms. Abbreviations: BP: biological process; CC: cellular component; KEGG: Kyoto Encyclopedia of Genes and Genomes; MF: molecular function. (d) GO circle plot of the significant GO and KEGG terms; the inner circle is a bar plot, where the height of the bar indicates the significance of the term (−log10 Padj), and the color corresponds to the z-score. The outer circle shows scatterplots of the expression levels (logFC) of the assigned genes in each term. (e) GO Chord plot of the significant GO and KEGG terms; the DEGs are linked via ribbons to their assigned terms. Blue-to-red coding next to the selected genes indicates log2FC.
Functional enrichment analysis of ferroptosis-related differentially expressed genes
Metascape platform analysis revealed that the ferroptosis-related DEGs were significantly enriched in the following processes: response of EIF2AK1 to heme deficiency, response to nutrient levels, regulation of cellular ketone metabolic processes, IL-18 signaling pathway, and regulation of proteolysis (Figure 3(b)). Functional enrichment analysis further showed that the eight ferroptosis-related DEGs were mostly enriched in the pathways related to the response to ER stress, the apoptotic signaling pathway, and KEGG terms associated with ferroptosis and the IL-17 signaling pathway (Figure 3(c)–(e)).
qRT-PCR analysis of the expression of potential biomarkers
Based on cell viability data, we calculated IC50 values of 0.39 mM for NCTC-1469, 0.8 mM for TC-1, and 0.76 mM for TCMK-1 cell lines (Supplementary Figure 1). Exposure to PQ significantly altered the expression of the following four ferroptosis-related genes. Tfrc expression significantly decreased in the NCTC1469 cells treated with PQ. In TC-1 cells, Tfrc expression increased with higher PQ concentrations. Additionally, Atf3 expression significantly increased in both NCTC1469 and TCMK-1 cells, but was not affected in TC-1 cells. Chac1 expression significantly increased in both TCMK-1 and TC-1 cells, proportionally to PQ concentration. Furthermore, Slc7a11 expression significantly decreased in the NCTC1469 and TC-1 cells and significantly increased in the TCMK-1 cells exposed to the higher PQ concentration (Figure 4(a)-(c)). Relative expression levels of four ferroptosis-related DEGs in the NCTC1469 (a), TCMK-1 (b), and TC-1 (c) cell lines, in control conditions and in the presence of 0.4 or 1.0 mM PQ. All data are presented as the mean ± SD of three independent experiments. *p < 0.05; **p < 0.01; ***p < 0.001; ns, not significant, using one-way ANOVA followed by the LSD post hoc test.
Levels of ferroptosis-related proteins following exposure to PQ
Western blot analysis detected changes in the levels of ferroptosis-related proteins after 24 h of exposure to PQ. More specifically, TFRC levels increased in NCTC1469 cells, proportionally to PQ concentration, and also in TC-1 cells (at 1.0 mM PQ). The levels of ATF3, in both NCTC1469 and TC-1 cells, increased at 0.4 mM and then decreased at the higher concentration. CHAC1 levels in TC1-cells followed the same pattern as ATF3, increasing at a lower concentration and then decreasing when exposed to the higher concentration of PQ. In NCTC1469 cells, CHAC1 showed the opposite pattern, with decreased levels in the lower PQ concentration, increasing to levels close to the control following the incubation with 1.0 mM of PQ. The expression of SLC7A11 consistently increased in the NCTC1469 and TC-1 cells proportionally to the PQ concentration, whereas in the TCMK-1 cells, it increased at a lower PQ concentration and then significantly decreased upon exposure to the higher concentration (Figure 5((a), b1-b3)). Western blotting analysis of the levels of ferroptosis-related proteins following exposure to PQ and the scheme of PQ poisoning-induced ferroptosis onset. (a) TFRC, ATF3, CHAC1, and SLC7A11 levels in the NCTC1469, TCMK-1, and TC-1 cell lines in control conditions and in the presence of 0.4 or 1.0 mM PQ. (b) The relative expression values were obtained by normalization with GAPDH, as loading control. Values were compared between the PQ treatment and control groups in the NCTC1469 (b1), TCMK-1 (b2), and TC-1 (b3) cells. Data are presented as the mean ± SD of three independent experiments. *p < 0.05; **p < 0.01; ***p < 0.001; ns, not significant as determined using ANOVA followed by the LSD post hoc test. (c) Possible mechanisms of PQ poisoning-induced ferroptosis based on bioinformatics analysis and published literature: PQ promotes TFRC expression and iron accumulation, enhancing ATF3 expression, thus inhibiting SLC7A11 expression and GSH production. In addition, exposure to PQ augments CHAC1 expression through the induction of the unfolded protein response, followed by the activation of the ER stress-mediated PERK-eIF2α-ATF4-CHOP pathway, leading to GSH depletion, which ultimately causes ferroptosis.
Discussion
PQ disrupts the cellular oxidative–antioxidant balance through the promotion of reactive oxygen species (ROS) generation, lipid peroxidation, NF-κB activation, mitochondrial damage, and organelle disruption, all of which cause cellular damage. Despite the availability of several therapies, such as hemoperfusion, hemodialysis, and anti-inflammatory and antioxidant medications, PQ poisoning continues to exhibit a significant fatality rate. In this study, through bioinformatic analysis, we aimed to identify key molecules with altered expression upon poisoning with PQ, which could, in turn, highlight potential pathological pathways involved in the damage. The identified DEGs in this study were enriched in pathways related to the EGFR, TNF, and IL-17 signaling cascades, as well as apoptosis and ferroptosis. TNF expression in the liver and serum is increased following PQ poisoning. 15 Blocking TNF-α signaling can ameliorate vascular dysfunction and reduce pulmonary and systemic inflammation.16,17 Similarly, the IL-17 signaling pathway is determinant for the pathogenesis of PQ-induced toxicity. 18 Reduced IL-17 signaling protects against PQ-induced lung injury. 19 In the PPI network, 10 hub genes were identified: Atf3, Ddit3, Trib3, Ptgs2, Chac1, Areg, Gadd45a, Csf2, Ereg, and Cxcl2. ATF3 represses the transcription of promoters with ATF sites. DDIT3 (functions as a multifunctional transcription factor in the ER stress response. Under the regulation of TRIB3 transcription,20,21 DDIT3 is implicated in cell cycle arrest and cell death in response to ER stress. 22 TRIB3 regulates the ATF4-DDIT3-TRIB3-AKT-MTOR axis, involved in mitochondrial autophagy, by suppression of ATF4 transcriptional activity.21,23,24 CHAC1 catalyzes the cleavage of GSH into 5-oxo-L-proline and Cys-Gly dipeptides. 25 Through GSH depletion, CHAC1 mediates the pro-apoptotic effects of the ATF4-DDIT3 cascade. 26 PQ poisoning induces ER stress, 27 and all the DEGs highlighted in this study, ATF3, DDIT3, CHAC1, and TRIB3 have been implicated in the response to ER stress. PTGS2, CSF2, ATF3, and DDIT3, regulate the apoptotic signaling pathway. In an animal model of PQ poisoning, PTSG2 expression was considerably elevated in the lung, liver, and kidney. 28 Furthermore, PTSG2 can transform dopamine into dopamine quinone, abrogating the biological function of dopamine, as observed in PQ-induced injury to dopaminergic neurons. 29 CSF2 is a granulocyte–macrophage colony-stimulating factor that promotes hematopoietic bone marrow cell survival, proliferation, and differentiation. CSF2 prevents glioma cells from undergoing apoptosis and contributes to neovascularization. 30 AREG (amphiregulin) and epiregulin (Ereg) are EGFR ligands that participate in angiogenesis, vascular remodeling, inflammatory responses, wound healing, and tissue repair processes.31,32 CXCL2 is a member of the chemokine superfamily that encodes proteins involved in immunoregulatory and inflammatory processes. CXCL2 is essential for neutrophil recruitment and maintenance of neutrophil homeostasis. 33 Following exposure to PQ, CXCL2 expression was shown to increase significantly in the lung tissue and lavage fluid. 34 The levels of ATF3, CXCL2, and CSF2 are affected by several protein kinases in vitro.35,36
In addition to genes relevant for the ER stress, our bioinformatic analysis also uncovered ferroptosis-related DEGs. We examined the GSE153959 and FerrDb datasets and found eight genes (Cxcl2, Atf3, Chac1, Trib3, Ddit3, Ptgs2, Slc7a11, Tfrc) in the intersection of these datasets, including one suppressor (Slc7a11) and three drivers (Chac1, Atf3, Tfrc). According to the functional enrichment analysis, these genes are mostly involved in the ER stress, nutrition, and ketone metabolism. Several studies have shown that cells exposed to PQ ultimately undergo apoptosis; 37 moreover, a recent study revealed that following exposure to a high dose of PQ, cells display mitochondrial damage, autophagy, and finally, necrosis. The reason for this necrotic reaction cannot be explained by the known mechanisms of PQ action.Recent studies have revealed that PQ poisoning effects may also be mediated by ferroptosis, a newly discovered type of cell death. 38 The distinctive features of ferroptosis are iron-dependent lipid hyperplasia and ROS peroxidation, which result in caspase- and necrosome-independent cell death. 39 In contrast to other types of cell death, such as pyroptosis, apoptosis, or necrosis, where lipids play a minor role, ferroptosis is entirely dependent on lipid peroxidation. 40 ER stress-induced ROS generation and GSH degradation also contributes to ferroptosis. 41 Our enrichment analysis suggest that PQ poisoning may result in ferroptosis via ER stress signaling.
Through gene analysis, we isolated four determinant genes that might control the development of ferroptosis in PQ poisoning: Tfrc, Atf3, Chac1, and Slc7a11. These genes have also been associated with ferroptosis in sevoflurane-induced hippocampal neurotoxicity. 42 CHAC1, ATF3, and TFRC promote ferroptosis, whereas SLC7A11 inhibits it. CHAC1, an ER stress response downstream factor, increases cysteine starvation-mediated necrosis and ferroptosis, by stimulating the eIF2-ATF4-DDIT3 pathway for GSH degradation. 43 CHAC1 knockdown reverses the decrease in GSH levels and cell death promoted by cysteine starvation, 44 as well as the vascular damage induced by ferroptosis. 45 ATF3, a downstream mediator of the ER stress PERK/ATF4 pathway, 46 mediates ferroptosis by downregulating SLC7A11 and glutathione peroxidase 4 (GPX4) expression and increasing H2O2 and iron levels. 47 The upregulation of ATF3 promotes collagen formation in mouse lung tissue, 48 observed in PQ-induced pulmonary fibrosis. 49 Tfrc encodes transferrin receptor 1, a major iron transporter protein on cell membranes. Overexpression of TFRC promotes the accumulation of unstable iron pools, resulting in enhanced lipid peroxide production and ferroptosis stimulation. 50 TFRC knockdown prevents ferroptosis-induced hypoxia/reperfusion. 51 Similarly, in our study, we observed that expression of the Tfrc mRNA and TFRC protein levels were significantly increased after exposure to PQ. Therefore, we hypothesize that PQ poisoning causes a severe iron overload. SLC7A11 stimulates GSH production through the transport of extracellular cysteine into the cell. 52 GPX4 uses reduced GSH to decrease lipid levels, thereby preventing ferroptosis. Upon overexpression of SLC7A11, NFE2 like BZIP transcription factor 2 and signal transducer and activator of transcription 3 alleviate the pathogenic manifestations of ferroptosis in acute lung injury. 53 By contrast, inhibition of SLC7A11 reduces GSH levels, which in turn reduces GPX4 activity and increases lipid peroxidation, eventually promoting ferroptosis.54,55 Mortality from PQ poisoning is significantly higher in Slc7a11−/− mice, 56 possibly derived from increased ferroptosis.
Based on our bioinformatic analyses and published literature, we hypothesized that PQ promotes ferroptosis via multiple pathways. First, it promotes iron accumulation by stimulating TFRC expression. Second, it increases ATF3 expression, which inhibits SLC7A11 and reduces GSH production. Third, it triggers ER stress, which causes GSH depletion, higher CHAC1 expression, eventually culminating in ferroptosis.41,57 In the present study, we found significant alterations in the expression of ferroptosis-related genes following exposure to PQ, in different cell types, suggesting that ferroptosis plays an essential role in PQ toxicity. 58
Nonetheless, our study shows some limitations, namely the fact that only in vitro tests were conducted. Plasma or tissue samples from PQ-intoxicated patients are required for further investigation and for validation of the observed results.
In conclusion, our findings demonstrate that ER stress and ferroptosis are important molecular events mediating the cellular damage induced by PQ. Furthermore, CHAC1, ATF3, TFRC, and SLC7A11 may serve as new therapeutic targets for PQ poisoning, as these proteins play an important role in PQ-induced ferroptosis.
Supplemental Material
Supplemental Material - Treatment with paraquat affects the expression of ferroptosis-related genes
Supplemental Material for Treatment with paraquat affects the expression of ferroptosis-related genes by Xiaogang Ge, Qiqi Cai, Sheng Zhang, Xianlong Wu, Pan Ying, Jingjing Ke, and Zhihui Yang in Human & Experimental Toxicology
Footnotes
Acknowledgements
The authors thank Dr Jie Li (Taizhou First People’s Hospital, Taizhou City, Zhejiang Province, China) for the suggestions and assistance in this study.
Declaration of Conflicting Interests
The author(s) declared no potential conflicts of interest with respect to the research, authorship, and/or publication of this article.
Funding
The author(s) disclosed receipt of the following financial support for the research, authorship, and/or publication of this article: This work was supported by the Health Science and Technology Project of Zhejiang Province (grants 2020RC143 and 2023RC110) and the Taizhou Science and Technology Department Project (grant 1801ky66).
Supplemental Material
Supplemental material for this article is available online.
References
Supplementary Material
Please find the following supplemental material available below.
For Open Access articles published under a Creative Commons License, all supplemental material carries the same license as the article it is associated with.
For non-Open Access articles published, all supplemental material carries a non-exclusive license, and permission requests for re-use of supplemental material or any part of supplemental material shall be sent directly to the copyright owner as specified in the copyright notice associated with the article.