
Abstract
The protective effects of folic acid on DNA damage and DNA methylation induced by N-methyl-N′-nitro-N-nitrosoguanidine (MNNG) in Kazakh esophageal epithelial cells were investigated using a 3 × 3 factorial design trial. The cells were cultured in vitro and exposed to media containing different concentrations of folic acid and MNNG, after which growth indices were detected. DNA damage levels were measured using comet assays, and genome-wide DNA methylation levels (MLs) were measured using high-performance liquid chromatography. The DNA methylation of methylenetetrahydrofolate reductase (MTHFR) and folate receptor-α (FRα) genes was detected by bisulfite sequencing polymerase chain reaction (PCR). The results showed significant increases in tail DNA concentration, tail length, and Olive tail moment (p < 0.01); a significant reduction of genome-wide DNA MLs (p < 0.01); and an increase in the methylation frequencies of MTHFR and FRα genes. In particular, significant differences were observed in the promoter regions of both genes (p < 0.01). Our study indicated that a reduction in folic acid concentration promotes DNA damage and DNA methylation in Kazakh esophageal epithelial cells upon MNNG exposure. Thus, sufficient folic acid levels could play a protective role against the damage induced by this compound.
Introduction
Esophageal cancer (EC) is one of the most common malignant conditions of the digestive system, with a higher incidence in developing countries. Approximately 400,000 new cases of EC are diagnosed worldwide each year, with more than half of them occurring in China. 1 In fact, EC is the third most common cancer of the digestive tract in China. There are significant regional differences in prevalence, with Xinjiang Kazakh being one of the six high EC incidence areas. 1 The high incidence of Kazakh EC has been linked to eating smoked meat with nitrosamine compounds, 2 consuming drinks high in nitrogen, and folate deficiency.
Genetics and epigenetics play important roles in the molecular mechanisms of EC, with DNA methylation being one of the main factors affecting epigenetic mechanisms. 2 –5 In a study of DNA methylation, genome-wide hypomethylation was found in tumor tissues compared with healthy tissues. 6 It was determined that these DNA methylation changes in tumors resulted in silencing of tumor suppressor genes and chromosome instability. 7,8 As tumors increase in severity, a progressive number of loci showed increased DNA methylation primarily at CpG islands and decreased DNA methylation at non-CpG islands sites. 9
Folic acid is important for numerous methylation reactions, and folic acid intake prevented loss of heterozygosity at the tumor suppressor gene in a small supplementation trial in humans. 10 In that study, an association was found between cancer and global DNA hypomethylation in circulating blood and/or tumor tissue; however, no consistent association between global DNA methylation and folate status (folate intake or blood folate) has been shown across studies. 11,12
N-methyl-N′-nitro-N-nitrosoguanidine (MNNG) is a synthetic nitrosamine compound normally used as a tool to study tumors. In this study, Kazakh esophageal epithelial cells were exposed to MNNG. Then, the effects of different folic acid concentrations on DNA damage and DNA methylation induced by MNNG were investigated.
Materials and methods
Cell culture and intervention
Normal Kazakh esophageal epithelial cells (prepared in our lab) were cultured at 37°C and 5% CO2 in serum-free Epithelial Cell Medium-2 (ScienCell, Carlsbad, California, USA) supplemented with 0.80 μg/mL of folate. Then, the cells were grown in media containing 0.00, 0.40, or 0.80 μg/mL of folic acid (Sigma, St Louis, Missouri, USA) for 14 days. Next, the cells were treated with 0.00, 0.75, or 1.50 μg/mL of MNNG (Tokyo Chemical Industry, Tokyo, Japan). Growth indices were measured at 48, 72, and 96 h.
Detection of DNA damage by the single-cell gel electrophoresis assay
Cell preparation: The cells were digested with trypsin, after which the concentration was adjusted to 1 × 10⁶ cells/mL. Glue production: For the first layer of glue, 100 μL of 1.0% normal agarose was added on one side of an aerated frosted glass slide that had been soaked in 75% ethanol overnight. The slides were covered with a second layer of glue, and then the slides were uncovered, to which 80 μL of 0.5% low melting point agarose (Invitrogen, Carlsbad, California, USA) containing 20 μL of cell suspension was rapidly added. The slides were covered again and placed in 4°C for 10 min. The third layer of glue was formed by adding 80 μL of 0.7% agarose to the uncovered slides. Then, the slide cover was placed for the last time and set at 4°C for 30 min. Cell lysis: The prepared glass slides were submerged in lysis buffer and lysed on ice in the dark for 30 min. Unwinding: The lysis buffer was replaced with helicase buffer (electrophoretic buffer), after which the cells were incubated on ice in the dark for 30 min. Electrophoresis: Electrophoresis was conducted at 200 mA and 25 V for 30 min. Neutralization: The slides were neutralized with neutralization buffer. Staining: The slides were dried, stained with propidium iodide, and placed in the dark for 5 min. Observations: The samples were observed and photographed. Image processing: The JPEG images were analyzed by Comet Assay Software Project (CASP) software (Free Software Foundation Inc., Boston, Massachusetts, USA).
Detection of genomic DNA methylation by high-performance liquid chromatography
Genomic DNA was extracted and hydrolyzed from each group of cells, and the hydrolysates were analyzed using high-performance liquid chromatography (HPLC). Concentration curves for unmethylated and methylated DNA were constructed from deoxycytidine (dC) and 5-methyl dC (5-mdC) standard solutions (Tokyo Chemical Industry), respectively. Then, the concentrations of both methylated and unmethylated DNA in all of the samples were calculated from their retention times and peak areas. Methylation levels (MLs) of genomic DNA were calculated using the following formula: ML (%) = 100 × [methylated DNA]/([methylated DNA] + [unmethylated DNA]).
Detection of methylenetetrahydrofolate reductase gene and folate receptor-α gene MLs by bisulfite sequencing PCR
Methylation-specific modifications of all DNA extracts were done by bisulfite sequencing PCR (BSP) using the Bisulfite Modification Kit (Invitrogen). The modified DNA samples were amplified by two rounds of PCR. The thermal cycle conditions were as follows: initial denaturation at 95°C for 5 min (25 cycles); denaturation at 95°C for 30 s, annealing at 53°C for 30 s (methylenetetrahydrofolate reductase (MTHFR))/57°C for 30 s (folate receptor-α (FRα)), and extension at 72°C for 30 s; and final extension at 72°C for 5 min. Primers were synthesized by Shanghai Sangon Co. Ltd. (Shanghai, China). The first set of primers was as follows: F-MTHFR (5′-GGGTTATGAGAAAAGATTTTAGAT-3′), R-MTHFR (5′-CCTAATCTCAATCCCAAAACT-3′), F-FRα (5′-GAGTTTCGTTTTGTTATTTAGGTTAGAG-3′), and R-FRα (5′-TAACACCAAATTACTTCATTATAAA-3′). The second set of primers was as follows: F-MTHFR (5′-TTGGGATTGAGATTAGGAGTGGT-3′), R-MTHFR (5′-CCRTCACTCACCCTCCAATC-3′), F-FRα (5′-AATTTTTGGTTATTTTTGTATTTTGTT-3′), and R-FRα (5′-CCRCTAAACCATATCTATCCCTAA-3′). PCR products were recovered and cloned into the pMD18-T vector, and the correct clones were verified using the ABI PRISM 3730xl sequencer (Applied Biosystems, San Francisco, California, USA).
Data analysis
Independent experiments were repeated three times. Statistical analysis was performed using SPSS 17.0 software (IBM Corp., Armonk, New York, USA). Measured data are shown as mean ± standard deviation. Linear regression was applied to construct a standard curve. Variance analysis of 3 × 3 factorial design trial was used for statistical analysis. p Values <0.05 were considered statistically significant.
Results
Effects of folic acid on DNA damage induced by MNNG in Kazakh esophageal epithelial cells
The results of the comet assay are shown in Figure 1. In the absence of folic acid, the degree of DNA damage increased with increasing concentrations of MNNG (shown as charts A11, A21, and A31). When the folic acid concentration increased, the comet tail length gradually increased with the increase in MNNG concentration (charts A12, A22, and A32) and (charts A13, A23, and A33). In the absence of MNNG, the tail length of the cell was shortened with an increase in folic acid concentration (charts A11, A12, and A13). When the MNNG concentration was increased, the degree of DNA damage increased compared with the 0.00 μg/mL MNNG group, but the tail length of the cells decreased with an increase in folic acid concentration (charts A21, A22, and A23) and (charts A31, A32, and A33). To quantify tail DNA content, tail length, and Olive tail moment values, the samples were photographed and the generated images were imported into CASP software (Free Software Foundation Inc.). Statistical analysis showed (Table 1) that all of the values increased with increasing concentrations of MNNG regardless of folic acid concentration and exposure time. These values also increased as the exposure time was increased regardless of folic acid and MNNG concentrations. However, as the folate concentration was reduced, all of the values increased despite different concentrations of MNNG and exposure time. There were different degrees of interactions among the three factors.

Effects of DNA damage on epithelial cells 48 h postexposure to varying concentrations of MNNG, at different concentrations of folic acid. A11: 0.00 µg/ml folic acid, 0.00 µg/ml MNNG; A12: 0.40 µg/ml folic acid, 0.00 µg/ml MNNG; A13: 0.80 µg/ml folic acid, 0.00 µg/ml MNNG; A21: 0.00 µg/ml folic acid, 0.75 µg/ml MNNG; A22: 0.40 µg/ml folic acid, 0.75 µg/ml MNNG; A23: 0.80 µg/ml folic acid, 0.75 µg/ml MNNG; A31: 0.00 µg/ml folic acid, 1.50 µg/ml MNNG; A32: 0.40 µg/ml folic acid, 1.50 µg/ml MNNG; A33: 0.80 µg/ml folic acid, 1.50 µg/ml MNNG. MNNG: N-methyl-N′-nitro-N-nitrosoguanidine.
Comparison of the DNA damage degree in different concentrations of folic acid and MNNG at different times (n = 3, mean ± standard deviation).
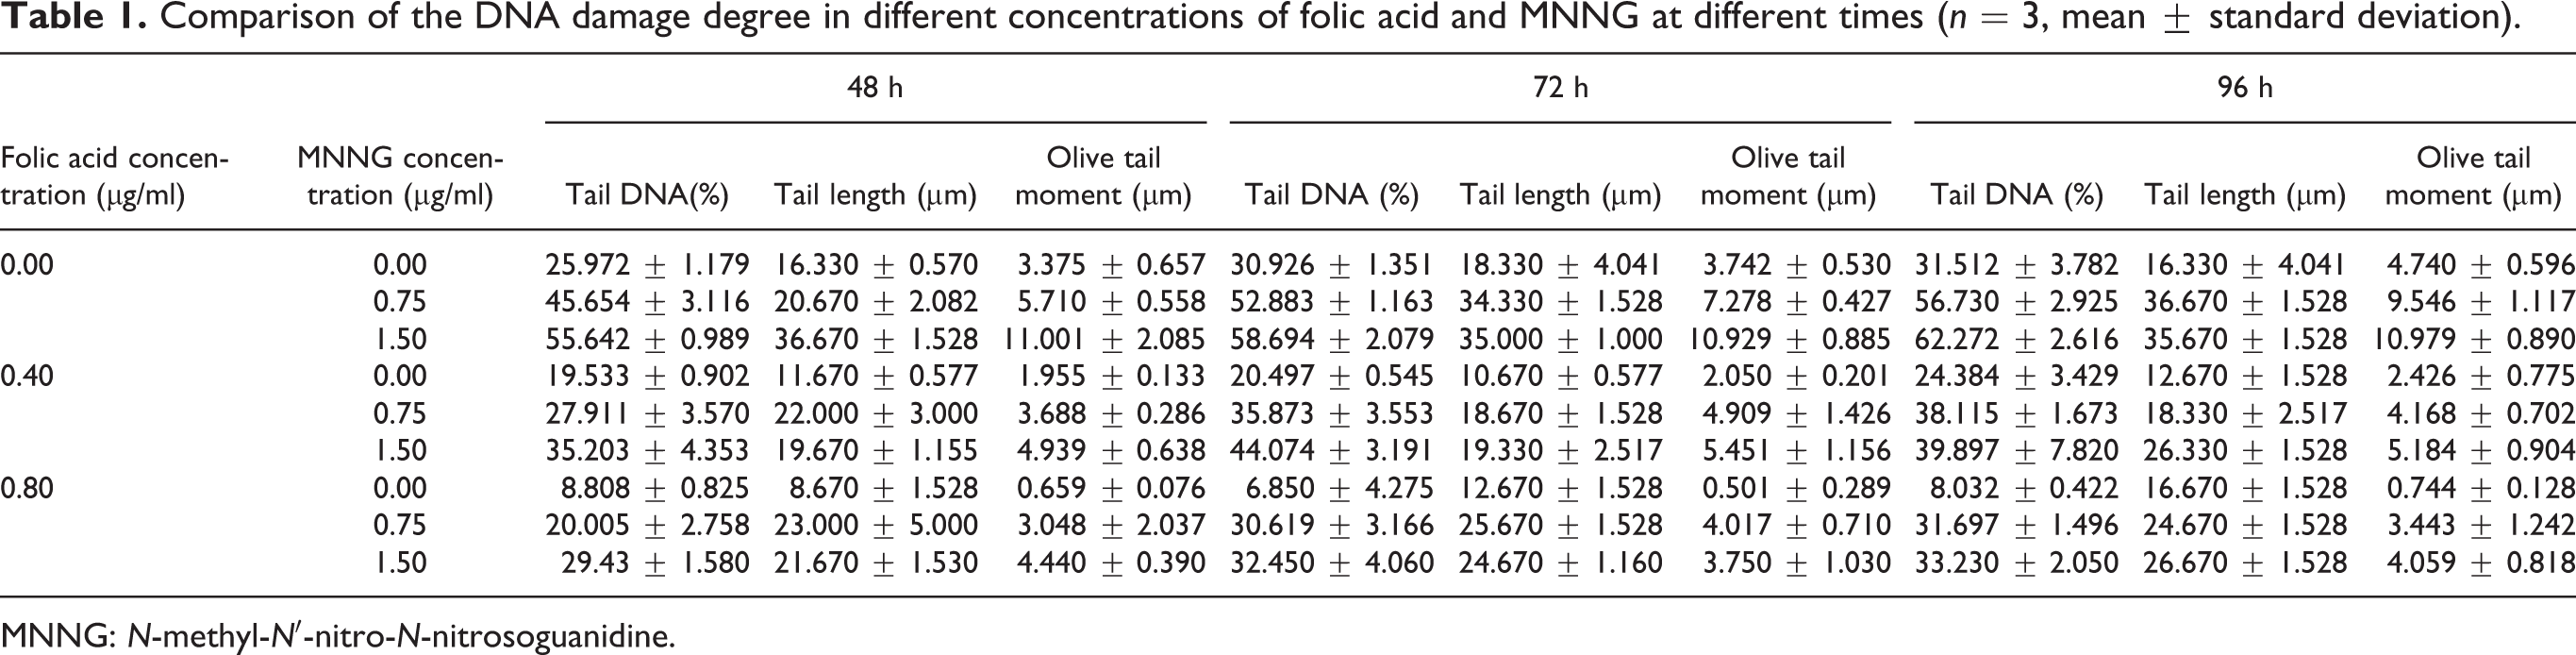
MNNG: N-methyl-N′-nitro-N-nitrosoguanidine.
Effects of folic acid on genomic DNA MLs induced by MNNG
Figure 2 illustrates the relationship among MNNG, folic acid, and incubation time on genome-wide DNA MLs (Table 2). Genomic DNA MLs significantly increased with increasing folic acid concentrations (p < 0.01). As the concentration of MNNG increased, cellular genome MLs significantly decreased (p < 0.01). Genome-wide MLs also decreased with extended incubation time (p < 0.01). Thus, genomic methylation gradually decreased with increasing MNNG concentration and incubation time.

Effect of different concentrations of folic acid and MNNG on the genomic ML of cells at different time points (n = 3, mean ± standard deviation, %). Under certain condition of MNNG concentration and action time—* p < 0.05, ** p < 0.01: compared with the group of 0.00 µg/ml folic acid; # p < 0.05, ## p < 0.01: compared with the group of 0.40 µg/ml folic acid; and Δp < 0.05, Δp < 0.01: compared with the group of 0.80 µg/ml folic acid. MNNG: N-methyl-N′-nitro-N-nitrosoguanidine; ML: methylation level.
Comparison of genome-wide MLs in different concentrations of folic acid and MNNG at different times (n = 3, mean ± standard deviation, %).
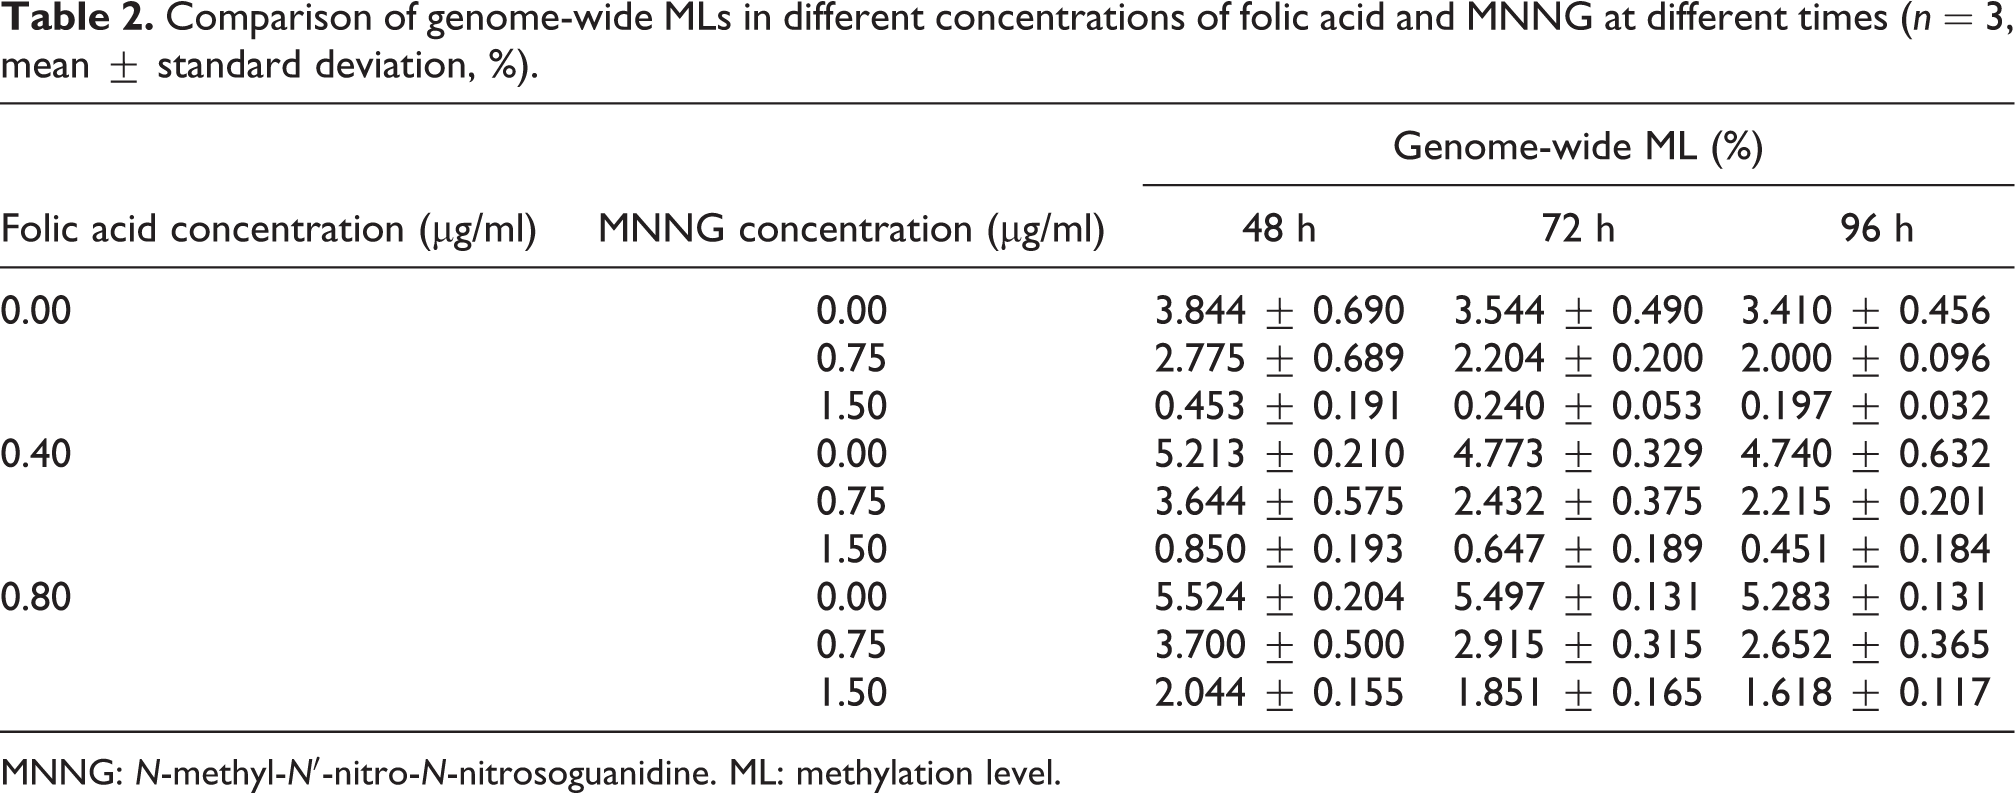
MNNG: N-methyl-N′-nitro-N-nitrosoguanidine. ML: methylation level.
Effects of folic acid on MNNG-induced DNA MLs of MTHFR and FRα genes
Status of MTHFR gene methylation
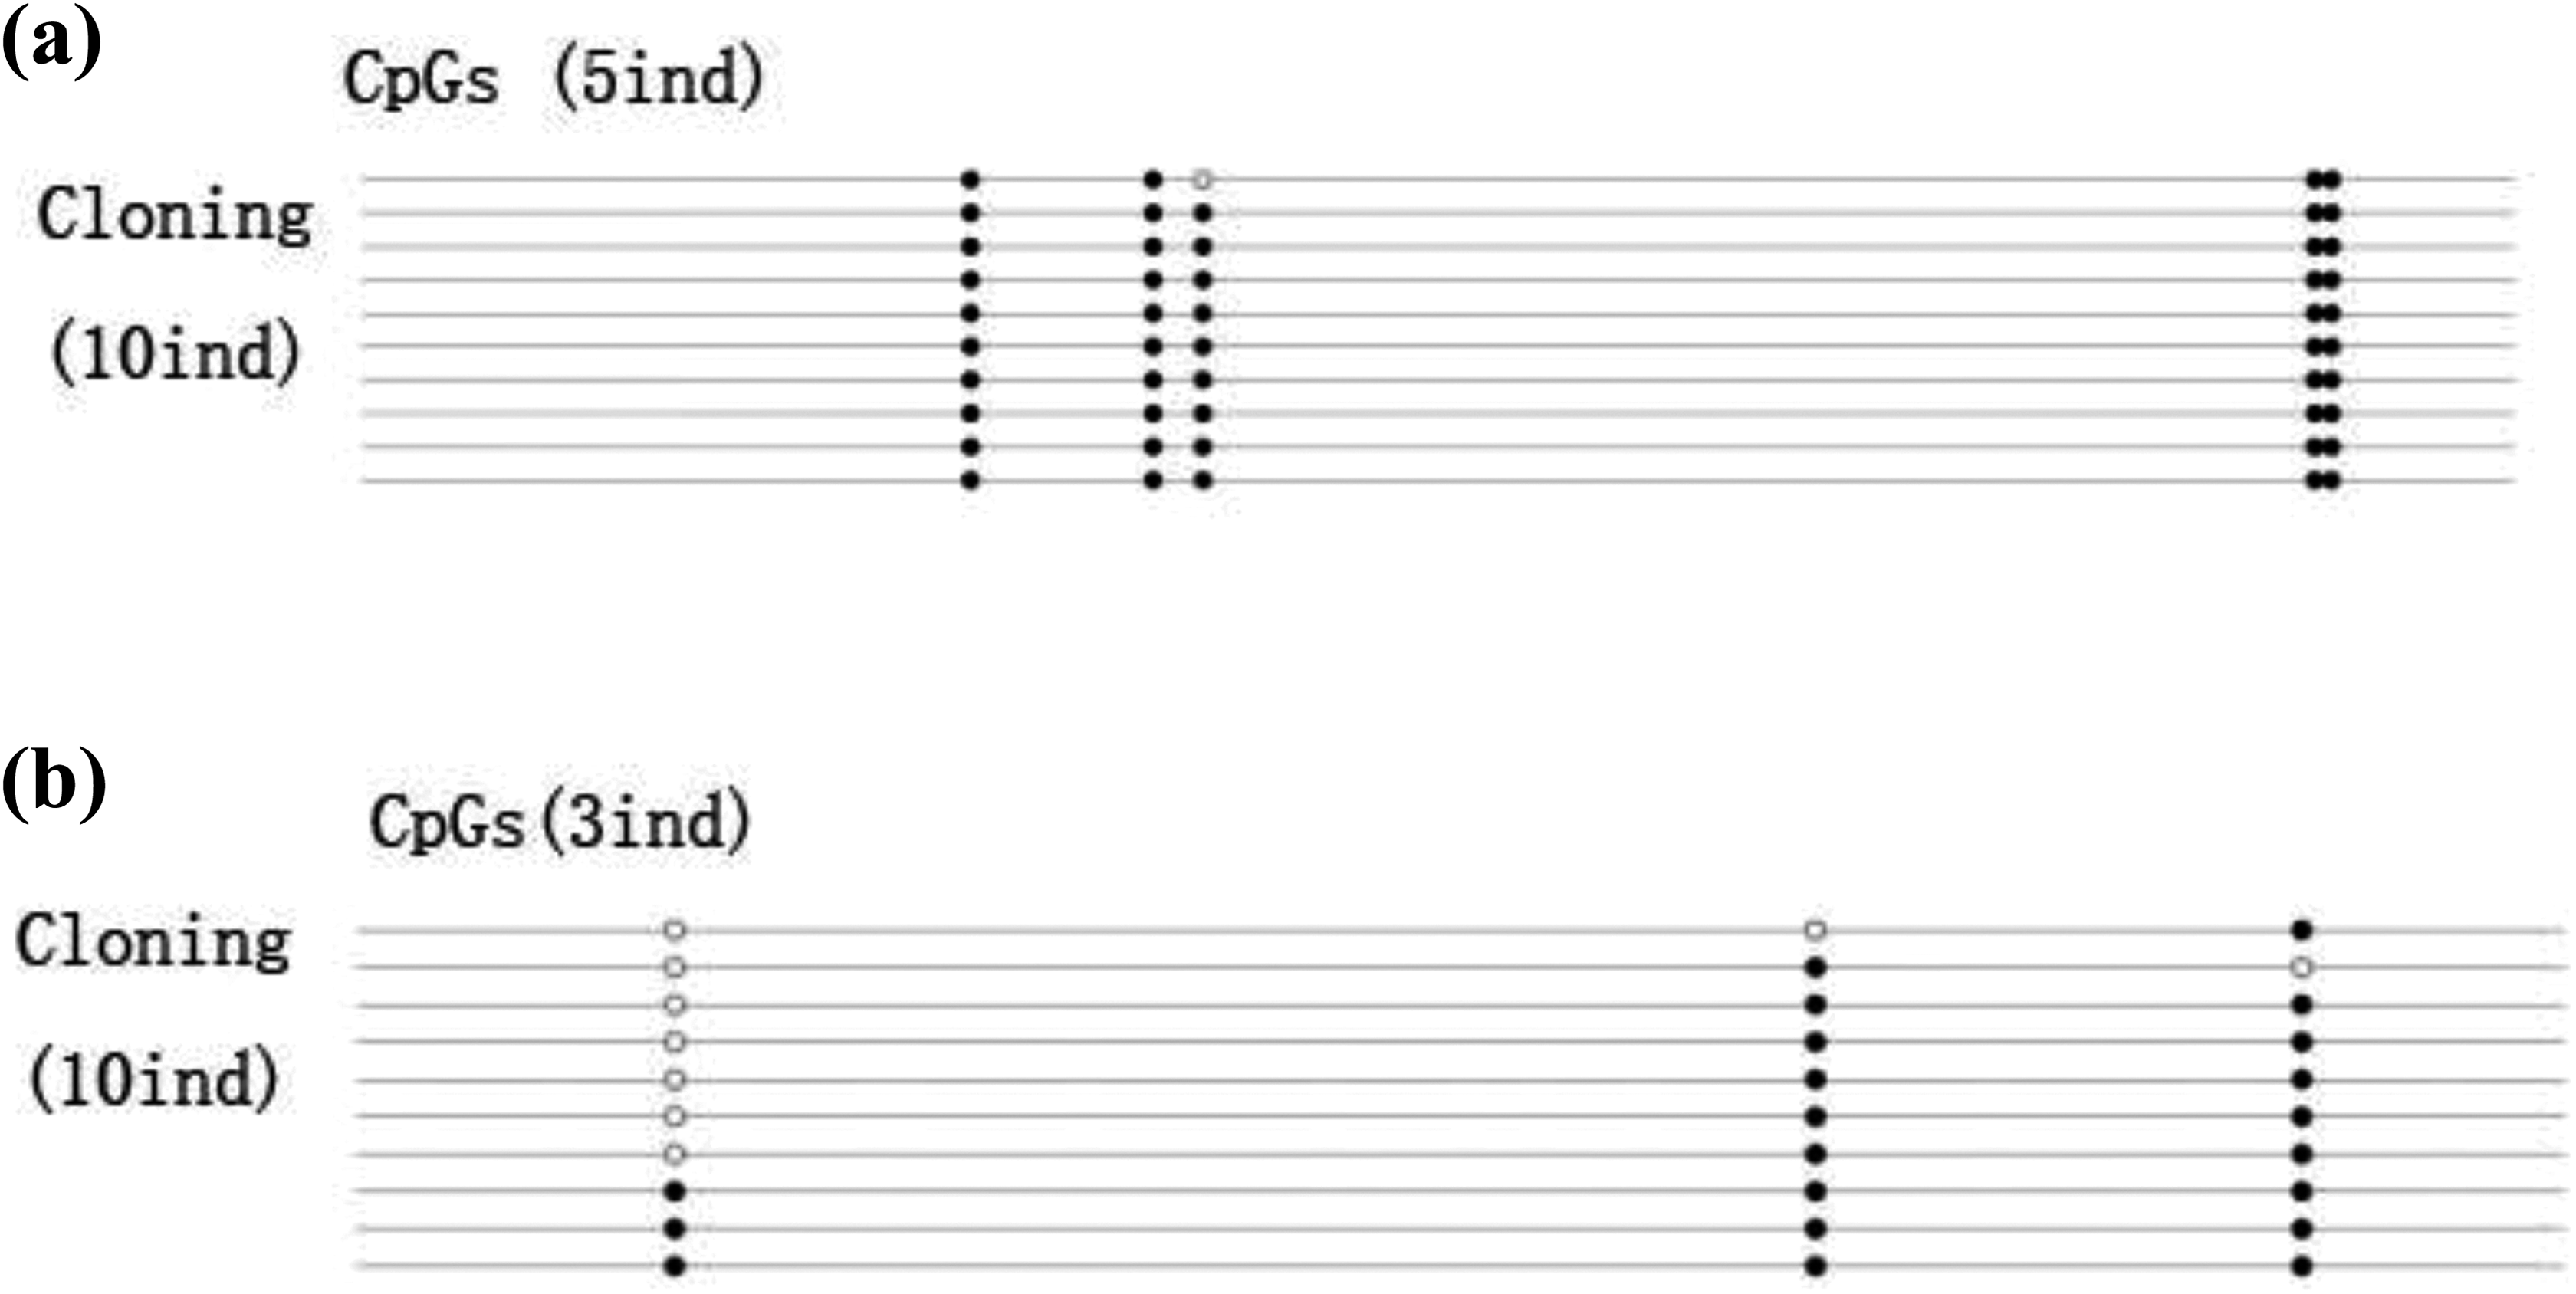
The genomic coordinates of the first sequence of the MTHFR gene promoter region of PCR amplification were −2008 to −1625, with a fragment length of 399 base pairs (bp); the second promoter region was located in −1625 to −1343, with a fragment length of approximately 282 bp. Agarose gel electrophoresis results showed the expected amplified length of the fragments. BSP results showed that there were 20 CpGs in the P1-1 fragment of 399 bp, with very low methylation frequencies in all groups (Figure 3(a)). With increasing folate concentrations, MTHFR gene promoter methylation frequency gradually decreased, and the difference was statistically significant (p < 0.05). With increasing MNNG concentrations, MTHFR gene promoter methylation frequency gradually increased (p < 0.01). MTHFR gene promoter methylation frequency also gradually increased with respect to incubation time (p <0.05; Table 3). There were 27 CpGs in the P1-2 fragment of 280 bp with very low methylation frequencies (Figure 3(b)). As folate concentrations increased, MTHFR gene promoter methylation frequency gradually decreased (p < 0.05). With increasing MNNG concentrations, MTHFR gene promoter methylation frequency gradually increased (p < 0.01). MTHFR gene promoter methylation frequency also gradually increased at increasing incubation times, and the difference was statistically significant (p < 0.05; Table 4).

MTHFR gene promoter region methylation status was detected by BSP in cell line, (a) fragment of P1-1 and (b) fragment of P1-2. ^: unmethylated, U; •: methylated, M; methylation frequency = M/(M + U). MTHFR: methylenetetrahydrofolate reductase; BSP: bisulfite sequencing PCR.
The change of MTHFR gene promoter region fragment of P1-1 methylation frequency by different concentrations of folic acid and MNNG infected of cells after different times (n = 3, mean ± standard deviation, %).
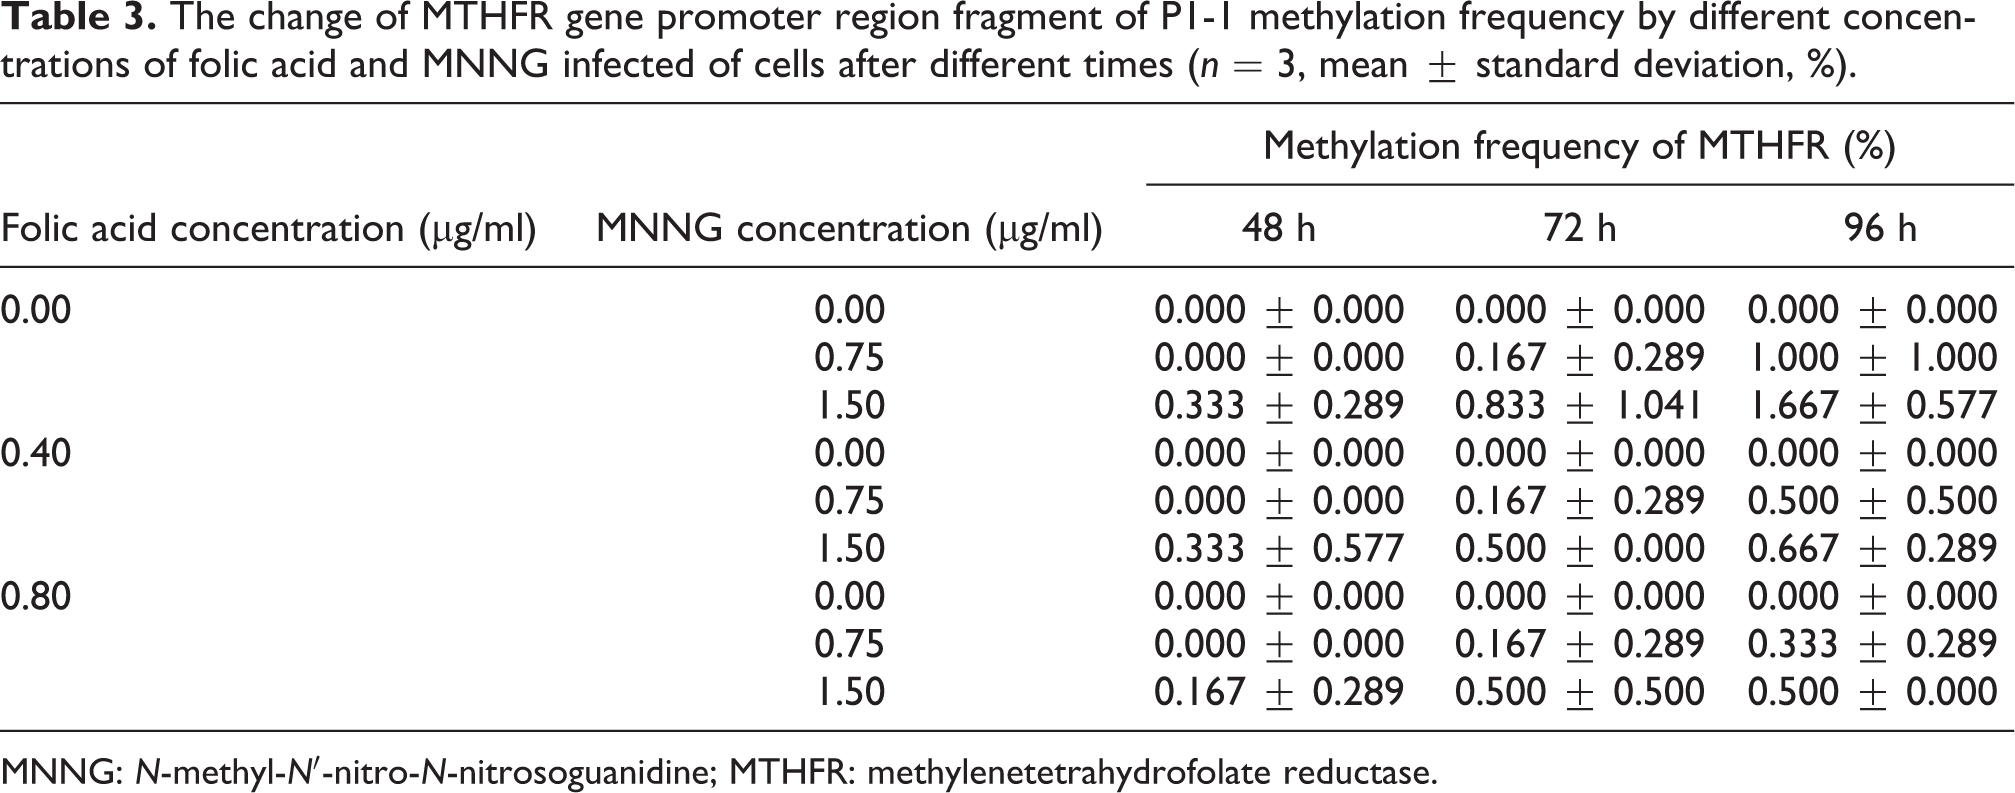
MNNG: N-methyl-N′-nitro-N-nitrosoguanidine; MTHFR: methylenetetrahydrofolate reductase.
The change of MTHFR gene promoter region fragment of P1-2 methylation frequency by different concentrations of folic acid and MNNG infected of cells after different times (n = 3, mean ± standard deviation, %).

MNNG: N-methyl-N′-nitro-N-nitrosoguanidine; MTHFR: methylenetetrahydrofolate reductase.
FRα gene methylation status
The P2-1 and P2-2 fragments of the FRα promoter region were located at −754 to −498 and −254 to −18, respectively. BSP results showed five CpGs in the P2-1 fragment, with very high methylation frequencies in all groups (Figure 4(a)). With increasing folate concentrations, FRα gene promoter methylation frequency gradually decreased (p < 0.05). At increasing MNNG concentrations, FRα gene promoter methylation frequency gradually increased, and the difference was statistically significant (p < 0.01). With prolonged incubation times, FRα gene promoter methylation frequency gradually increased (F = 4.000, p < 0.05). There were no correlations among different concentrations of folic acid, MNNG, and incubation times (Table 5). There were three CpGs in the P2-2 fragment, and the methylation frequencies of each group were high (Figure 4(b)). There was no significant difference in FRα gene methylation frequency at various folate concentrations in Kazakh esophageal epithelial cells, and the distribution was not statistically significant. At increasing MNNG concentrations and increasing incubation times, FRα gene methylation frequency gradually increased (Table 6).
FRα gene promoter region methylation status was detected by BSP in cell line, (a) fragment of P1-1 and (b) fragment of P1-2. ^: unmethylated, U; •: methylated, M; methylation frequency = M/(M + U). FRα: folate receptor-α; BSP: bisulfite sequencing PCR.
The change of FRα gene promoter region fragment of P2-1 methylation frequency by different concentrations of folic acid and MNNG infected of cells after different times (n = 3, mean ± standard deviation, %).

FRα: folate receptor-α; MNNG: N-methyl-N′-nitro-N-nitrosoguanidine.
The change of FRα gene promoter region fragment of P2-2 methylation frequency by different concentrations of folic acid and MNNG infected of cells after different times (n = 3, mean ± standard deviation, %).

FRα: folate receptor-α; MNNG: N-methyl-N′-nitro-N-nitrosoguanidine.
Discussion
Folic acid is a water-soluble B vitamin that is widely distributed in tissues and plays a central role in the metabolism of one carbon unit. It participates in the methyl transport of certain amino acids in methylation cycles in the form of tetrahydrofolate. There is evidence that folic acid deficiency plays a role in the pathogenesis of cancer, 13 via its effects on DNA and methylation. 14,15 For example, a negative correlation between serum levels of folate and the risk of colon cancer has been reported. 16 In another study, high doses of folic acid were shown to play an important role in the chemoprevention of gastric cancer induced by the chemical carcinogen N-ethyl-N′-nitro-N-nitrosoguanidine in a canine model. 17
In the comet assay, the higher the tail DNA content, the longer the tail length, the higher the Olive tail moment, and the more serious the degree of DNA damage. Studies have confirmed that exogenous chemicals can cause cell DNA damage, while decreases in folate levels can lead to DNA instability and DNA double-strand breaks. After the cells were treated with MNNG, the average Olive tail moment of the three groups was increased. There was a dose-dependent relationship among the three MNNG concentration groups and comet tailing to a certain extent. Our study found that when cells had normal folate levels and no MNNG stimulation, the nuclei were round with no smearing. With decreasing folic acid concentrations, increasing MNNG concentrations, and prolonged incubation time, the cell-tailing phenomenon was observed. With the severity of injury, an increasing trend in tail cell DNA content (tail DNA) became progressively evident. Each main effect had statistical significance, between folic acid and MNNG, and MNNG and interaction time, and there was antagonism between folic acid and MNNG, but synergy between MNNG and time.
DNA methylation is a remarkable means of epigenetic modification, and it plays an important role in maintaining the normal function of cells. An animal experiment indicated that rats fed food without folic acid, 18 methionine, choline, and vitamin B12 for 1 week had a significant decline of the S-Adenosyl methionine in hepatic cells, along with an increase in DNA hypomethylation and mRNA expression of the proto-oncogenes c-myc and c-fos. The lymphocyte genome ML is low in healthy individuals with inadequate intake of folic acid, and when folate deficiency is corrected, genomic methylation returned to normal levels. 19 HPLC results showed that the lack of folic acid marginally decreased genome-wide methylation. After exposure to various amounts of MNNG, genome methylation continued to decrease in dose- and time-dependent manners. By contrast, cells exposed to no or very little folic acid had increased genomic methylation.
MTHFR is a key enzyme in the folate metabolic pathway. Defects in its expression can lead to abnormalities in DNA MLs. 20 In squamous cell lung cancer, the MTHFR promoter region exhibits high methylation status. 21 FRα is one of the folate receptors, which is mainly in the membrane and can mediate folic acid into the cell. 22 Our results showed that, with decreasing concentrations of folic acid, methylation frequencies of MTHFR and FRα promoter regions increased, and continued to increase with increasing incubation times. The P1-1 and P1-2 fragments of the MTHFR promoter region and P2-1 fragment of the FRα promoter region were significantly different. After being exposed to increasing concentrations of MNNG at various times, the methylation frequencies of MTHFR and FRα promoter regions gradually increased in all cells treated with folate in dose- and time-dependent manners. Moreover, the methylation frequencies of P1-1 and P1-2 fragments of MTHFR and the P2-1 fragment of FRα promoter region were lower in folate-deficient and folate-free groups than in folate-adequate groups. This indicates that the folic acid and MNNG have opposing effects; the longer the duration of action, the more obvious the antagonism. However, we only detected methylation frequencies in some regions of the MTHFR and FRα promoter, rather than in the overall promoter. Thus, further studies are needed on methylation frequency in the overall promoter.
Conclusions
In this study, we showed that decreasing the folic acid concentration and increasing the MNNG concentration and exposure time increased DNA damage levels, reduced genome-wide DNA MLs, and increased the methylation frequency of MTHFR and FRα genes in normal Kazakh esophageal epithelial cells. In addition, the reduction in folic acid concentration promoted DNA damage and DNA methylation induced by MNNG. Thus, sufficient folic acid could play a protective role against the damage induced by MNNG.
Footnotes
Authors’ contributions
YC conceived the study and drafted the manuscript, HF performed the experiments, DC assisted with the design of study and data analysis, KA and XL participated in experiments and sample preparation, and HZ assisted with the analysis of the experimental data.
Declaration of Conflicting Interests
The author(s) declared no potential conflicts of interest with respect to the research, authorship, and/or publication of this article.
Funding
The author(s) disclosed receipt of the following financial support for the research, authorship, and/or publication of this article: This work was supported by the National Natural Science Foundation of China (81460502) and Natural Science Foundation of Autonomous Region’s Science and Technology Department (2015211C032). The study sponsors had no role in the study design or in the decision to submit the manuscript for publication.