
Abstract
The epidermal growth factor receptor (EGFR) associated with signaling pathways, such as Janus kinase (JAK)/signal transducer and activator of transcription (STAT), plays an important role in colorectal cancers (CRCs). Gefitinib (Gef) is an orally active inhibitor targeting the adenosine tri phosphate-binding domain of EGFR, and cucurbitacin B (CuB) is a selective inhibitor of JAK/STAT signaling with potent antitumor activity via suppression of STAT3 phosphorylation, but the underlying mechanism is not clear. We aimed to investigate the apoptotic and antiproliferative effects of CuB as a single agent and in combination with Gef on both HT-29 and HCT-116 cell lines. Cell proliferation, cell cycle distribution, and apoptosis were evaluated using viability assay, fluorescent microscopy, cytotoxicity assay, proliferation, DNA fragmentation, and cleaved caspase 3 levels. Real-time polymerase chain reaction and Western blot analyses were performed to determine the expression of relevant genes and proteins including antiapoptotic, proapoptotic, and cell cycle regulation. EGFR, phosphorylated EGFR (pEGFR), STAT3, and pSTAT3 proteins were evalutaed with Western blot analysis. Our results showed that, compared to CuB alone, CuB plus Gef treatment caused a significant growth and cell cycle inhibition and induced apoptosis in both cell lines. Also CuB plus Gef treatment decreased DNA synthesis rate more effectively than CuB alone. Treatment with CuB alone and in combination with Gef decreased the expression levels of B-Cell CLL/Lymphoma 2 (Bcl-2), BCL2-like 1 (BCL2L1), cyclin D1, pSTAT3, and pEGFR and increased the expression levels of Bcl-2-like protein 4, Bcl-2 homologous antagonist/killer, Bcl-2-associated death promoter, Bcl-2-like protein 11, and p27kip1 levels. Our results suggest that treatment with CuB alone and more likely in combination with Gef may be a considerable alternative therapeutic approach for CRC, at least in vitro.
Introduction
Colorectal cancer (CRC; also known as colon cancer) is the fourth most common malignancy and cause of cancer-related mortality in men and women in the world. 1,2 CRC is characterized with overexpression of epidermal growth factor receptor (EGFR) and its downstream signaling pathways. 2,3 EGFR plays a pivotal role in the control of cell growth, proliferation, differentiation, apoptosis, and survival during development and homeostasis. 3,4 Activation of the EGFR promotes homo- or hetero-dimerization of receptor, which leads to the autophosphorylation of tyrosine residues in the intracellular domain, and subsequent activation of several downstream signal transduction pathways, including the Janus kinase (JAK)/signal transducer and activator of transcription (STAT). 4 –6
The tyrosine kinase inhibitors (TKIs) and monoclonal antibodies are inhibitors of the receptor tyrosine kinases (RTKs), including EGFR. EGFR-TKIs bind to the tyrosine kinase domain in the EGFR and effectively block the activation of EGFR via suppression of EGFR autophosphorylation. Gefitinib (Gef; Iressa; ZD1839) is an orally active, selective inhibitor of EGFR, 5 –7 which efficiently binds to the adenosine tri phosphate binding site of this receptor and inhibits the intracellular autophosphorylation of tyrosine residues in its kinase domain on ligand activation 7,8 and prevents EGFR-mediated downstream signal transduction pathways implicated in proliferation and survival of cancer cells. Gef inhibits the growth of various types of carcinoma, including CRC 9 –11 when used as monotherapy. Moreover, it has synergistic inhibitory effects when combined with various cytotoxic agents in in vitro and in vivo studies. 7,8,12,13 Although Gef combined with various agents has been reported to enhance cytotoxicity in vitro and in vivo, the exact enhancement mechanisms still remain unclear. 9 –12
The JAK/STAT signaling pathway plays a crucial role in cell survival, proliferation, differentiation, apoptosis, and inflammation. 14,15 JAK/STAT signaling is activated by various ligands, including cytokines and growth factors, such as epidermal growth factor (EGF), which leads phosphorylation through the tyrosine residues of RTKs, which serve as docking sites for STATs via the SH2 domain by JAKs. 15,16 Subsequently, STATs are phosphorylated selectively by activated JAKs. Phosphorylated STATs translocate from the cytoplasm to the nucleus where they bind to specific DNA sequences in the promoter regions of their respective target genes associated with cell survival. 15 –17 The EGFR-associated JAK/STAT signaling pathway plays an important role in cancer development, and this pathway has received a great deal of attention as a therapeutic target for the treatment of cancer. Thus the identification of a new target compound that blocks this pathway would contribute significantly to growth inhibition and apoptosis of tumor cells. 16,17
In recent years, natural herbal products have been used as possible sources of new anticancer agents. 18,19 Cucurbitacins are a group of tetracyclic triterpenes isolated from various plant families such as Cucurbitaceae and Cruciferae. They have been used as folk medicines for centuries in Asian countries, especially China and India, because of their wide spectrum of pharmacological effects such as cytotoxicity, chemoprevention, analgesic, anti-inflammatory, antimicrobial, abortifacient, antidiabetic, and anticancer effects. 19 –21 Chemically, cucurbitacins are highly diverse compounds and are arbitrarily divided into twelve categories (cucurbitacins A-T). 19,20
Among these compounds, cucurbitacin B (CuB) is an active triterpenoid compound, which is one of the most abundant form of cucurbitacins. 22,23 Recent studies have shown the growth inhibitory effect of CuB in various types of human cancer cell lines and tumor xenografts. Although the antitumor activity of CuB has been reported, its antitumor effect and underlying mechanism of action is still unclear. 22 –26 The antitumor activity of CuB could be clarified by the induction of apoptosis and cell cycle arrest through the inhibition of JAK/STAT signaling pathway via suppression of STAT3 phosphorylation. 25 –28 STAT3 is a well-known oncogene, which plays a pivotal transcriptional role in cancer cell proliferation, differentiation, cell death, and survival. So, inhibition of STAT3 is expected to be effective for cancer prevention. 18,21,23 –25 CuB suppresses the activation of STAT3; regulates STAT3 downstream genes including cell cycle regulators such as cyclin D1, c-myc, and, apoptosis-related genes such as B-Cell CLL/Lymphoma 2 (Bcl-2), BCL2-like 1 (Bcl-xL or BCL2L1), and Bcl-2-like protein 4 (Bax); and consequently inhibits tumor growth and induces cell apoptosis. 18,27,28
Treatment of CRC has shown significant improvement in recent years with new generation chemotherapeutic and molecular targeted agents. Thus, we aimed to investigate the apoptotic and antiproliferative effects of CuB as a single agent and in combination with Gef on HT-29 and HCT-116 human CRC cell lines and tried to reveal the underlying molecular mechanisms of these effects. In this study, we also aimed at investigating the associated underlying mechanism of CuB and Gef treatment on CRC cancer by examining Bcl-2, Bcl-xL, Bax, Bcl-2 homologous antagonist/killer (Bak), Bcl-2-associated death promoter (Bad), Bcl-2-like protein 11 (Bim), cyclin D1 messenger RNA (mRNA) levels and Bcl-2, Bax, Bak, cyclin D1, cyclin-dependent kinase inhibitor 1B (p27kip1), STAT3, phosphorylated STAT3 (Tyr705) (pSTAT3), EGFR and phosphorylated EGFR (pEGFR) protein levels in HT-29 and HCT-116 cell lines.
Materials and methods
Chemicals and antibodies
CuB was purchased from Sigma-Aldrich (St Louis, Missouri, USA), and Gef (ZD1839; Iressa) was provided by AstraZeneca Pharmaceuticals (Macclesfield, UK). The stock solutions were freshly diluted to the required concentration just before use. Specific antibodies against β-actin (ACTB), Bcl-2, Bax, Bak, p27kip1, cyclin D1, STAT3, phospho-STAT3, EGFR, phospho-EGFR, and horseradish peroxidase (HRP)-conjugated secondary antibody were purchased from Cell Signaling Technology Inc. (Danvers, Massachusetts, USA). Cytotoxicity Detection Kit Plus (lactate dehydrogenase (LDH)), Cell Proliferation enzyme-linked immunosorbent assay (ELISA), 5-bromo-2′-deoxyuridine (BrdU), colorimetric kit, and Cell Death Detection ELISA Plus kit were purchased from Roche Applied Science (Mannheim, Germany). PathScan Cleaved Caspase-3 (Asp175) Sandwich Elisa Kit was provided by Cell Signaling Technology. Dulbecco’s modified Eagle’s medium (DMEM), penicillin/streptomycin, and fetal bovine serum (FBS) were purchased from Gibco (Grand Island, New York, USA). All other reagents were purchased from Sigma or Roche unless otherwise noted.
Cell culture
The human colorectal carcinoma HCT-116 cell line (CCL-247) was obtained from the American Type Culture Collection (Manassas, Virginia, USA) and human colorectal adenocarcinoma HT-29 cell line (HUKUK #97042201) was obtained from the Animal Cell Culture Collection in the Foot and Mouth Disease Institute (Ankara, Turkey). These cell lines were cultured in DMEM medium supplemented with 10% heat-inactivated FBS, 200 mM
Cell viability assay
Cell viability was assessed using a 3-(4,5-dimethyl-thiazol-2-yl)-2,5-diphenyltetrazolium bromide (MTT; Sigma-Aldrich) colorimetric assay. The HT-29 and HCT-116 cells were seeded into 96-well culture plates (1 × 10⁴ cells/well) and incubated in a humidified atmosphere of 5% CO2 at 37°C for 24 h to attach. Stock solutions of CuB and Gef were prepared in cell culture medium at various concentrations. Both cell lines were incubated with various concentrations of CuB (0.0125–80 µM) and Gef (0.1–80 µM) and in combination with selected doses of both for 24 and 48 h. Treatment with 0.5% DMSO was included as vehicle control, and DMEM was added to the control group. At the end of the treatment, 10 μl MTT solution (5 mg/ml in phosphate-buffered saline (PBS)) was added to each well, and the samples were incubated at 37°C for 4 h. The medium was carefully removed and purple-blue MTT formazan crystals were dissolved in 100 μl DMSO per well. The absorbance of each well was measured at a wavelength of 570 nm using Spectramax M3 microplate reader (Molecular Devices, Silicon Valley, California, USA) with DMSO as a blank control. All MTT assays were performed independently and in quadruplicate for each dose.
Acridine orange/ethidium bromide staining
The acridine orange (AO)/ethidium bromide (EB) staining method was used to evaluate the apoptotic and necrotic morphologic changes. HT-29 and HCT-116 cells were plated in 24-well culture plates (2 × 10⁵ cells/well) overnight at 37°C. After treatment with CuB, Gef, and in combination (CuB + Gef) as indicated for 24 h, the cell pellets were trypsinized and then washed twice with PBS. The cells were stained with 4 μl/ml of dye mixture, containing 100 μg/ml of AO (Sigma-Aldrich) and 100 μg/ml of EB (Sigma-Aldrich) in PBS. Then, the cells were immediately analyzed under a fluorescence microscope (Olympus B202, Japan) at a magnification of 40X with the 490 nm excitation wavelength. To determine the apoptotic index, the number of apoptotic cells was divided by the total number of counted cells and multiplied by 100 to calculate the percentage. The experiment was repeated three times in each group.
Cytotoxicity assay
The LDH leakage assay, which is a marker of cytotoxicity and based on the measurement of LDH activity into culture media, was determined using a Cytotoxicity Detection Kit Plus (Roche Applied Science). Cells were cultured in 96-well plates (1 × 10⁴ cells/well). After overnight incubation, CuB, Gef, and the combination of both were added to each well at the indicated concentrations and incubated for 24 h. After treatment of cells, 100 μl of medium from each well was carefully transferred into 96-well flat-bottomed microtiter plate. Then, 100 μl of LDH assay reaction mixture was prepared according to the manufacturer’s instructions and added to each well. After incubation for 30 min with shaking at room temperature, the absorbance of the samples was measured at a wavelength of 490 nm using Spectramax M3 microplate reader (Molecular Devices). To determine the percentage of cytotoxicity, the absorbance values were expressed as percentage cytotoxicity relative to the untreated control cells. All drug concentrations were tested in triplicate wells, and all experiments were repeated independently three times.
Cell proliferation assay
DNA synthesis in proliferating cells was determined by measuring incorporation of BrdU into DNA using the Cell Proliferation ELISA (BrdU, colorimetric) kit (Roche Applied Science) according to the manufacturer’s instructions. In brief, both cells were seeded in 96-well plates (1 × 10⁴ cells/well) and incubated overnight for 24 h. Cells were then incubated with various selected concentrations of the drugs for 24 h and controls were treated with DMSO alone (1%). BrdU labeling reagent was added to each well in culture medium at the end of the treatment and incubated for an additional 2 h. The remaining steps were carried out according to the instructions supplied by the manufacturer. The cell proliferation rate was quantified by measuring the absorbance at 450 nm using Spectramax M3 microplate reader (Molecular Devices). Each assay was performed in triplicate and the experiments were repeated three times independently.
DNA fragmentation with ELISA
Quantitative measurement of DNA fragmentation was performed using the Cell Death Detection ELISA Plus kit (Roche Applied Science) according to the manufacturer’s instructions. This assay is based on a sandwich enzyme immunoassay principle to detect mono- and oligonucleosomes (histone-associated DNA fragments) released into the cytoplasm of the apoptotic cells after induction of apoptosis. After accomplishing the ELISA procedure, as recommended by manufacturer, release of nucleosomes was determined by measuring the absorption at 405 nm (with reference wavelength at 490 nm) with a Spectramax M3 microplate reader (Molecular Devices). Results were expressed as the enrichment factor (EF), which was calculated by dividing the absorbance of treated (apoptotic) cells by the absorbance of untreated (control) cells. Calculated EFs were used as a parameter of apoptosis. Each assay was performed in triplicate and repeated three times.
DNA fragmentation with agarose gel electrophoresis
For qualitative DNA fragmentation as a marker for apoptosis, HT-29 and HCT-116 cells (1 × 10⁶ cells/mL) were incubated with agents as indicated for 24 h. Both attached and detached cells were trypsinized, washed with PBS, and then lysed with phosphate-citric acid buffer at 37°C for 1 h. The lysates were centrifugated at 1200 r/min for 10 min. Then, NP-40 (Sigma-Aldrich) and RNase A (Sigma-Aldrich) were added to the supernatant and incubated at 37°C for an additional 30 min. After that, proteinase K (Sigma-Aldrich) was added for protein digestion and the mixture was again incubated at 37°C for 1 h. The purified DNA was precipitated in ethanol and pellet was dissolved in TE buffer (10 mM tris(hydroxymethyl)aminomethane–hydrochloric acid (HCl; pH 8.0), 1 mM ethylenediaminetetraacetic acid-di sodium). Equal quantities of the samples were loaded on to 1% agarose gel containing EB for detecting ladder formation. Finally, the apoptotic DNA fragments were photographed using an imaging system (Kodak Gel Logic 100 Imaging System, Carestream, USA).
Determination of cleaved caspase 3 levels by sandwich ELISA
To verify the presence of apoptosis in cells treated with CuB, Gef, and the combination of both, cleaved caspase 3 protein levels were performed using the PathScan® Cleaved Caspase-3 (Asp175) Sandwich Elisa Kit (Cell Signaling Technology Inc.) according to the manufacturer’s protocols. Briefly, after treatment with or without agents at indicated doses for 24 h, cells were harvested and protein content of lysates was determined with bicinchoninic acid (BCA)™ protein assay kit (Pierce, Rockford, Illinois, USA). Then 100 μl of protein-containing samples were transferred onto the microplates coated with total caspase 3 antibody. The biotinylated cleaved caspase 3 antibody was added to the wells followed by HRP-linked streptavidin and HRP substrate. Finally, the absorbance of the cleaved substrate was measured at a wavelength of 450 nm using a Spectramax M3 microplate reader (Molecular Devices). Each experiment was performed in triplicate and repeated twice to assess for consistency of response.
Total RNA isolation, cDNA synthesis, and real time-PCR analyses
After treatments, HT-29 and HCT-116 cells were harvested for RNA isolation. Total RNA was isolated using High Pure RNA Isolation Kit (Roche Diagnostics, Mannheim, Germany) according to the manufacturer’s instructions. The quantity and quality of total RNA were measured at 260 and 280 nm, spectrophotometrically (NanoDrop 2000, Thermo Scientific, Waltham, Massachusetts, USA). Complementary DNA (cDNA) was synthesized from 1 μg total RNA from each sample using the Transcriptor First Strand cDNA Synthesis Kit (Roche Diagnostics) according to the supplier’s protocol and samples were analyzed in triplicates. cDNA products were kept at −20°C until use for the analysis. To examine Bcl-2, Bcl-xL, Bax, Bak, Bad, Bim, and cyclin D1 mRNAs expression quantitatively, a real-time polymerase chain reaction (RT-PCR) was performed using a LightCycler® 480 instrument (Roche Diagnostics) according to the manufacturer’s protocols. Specific probes and intron spanning primers were designed using the online Universal Probe Library (UPL) Assay Design Center (http://www.roche-applied-science.com/sis/rtpcr/upl/index.jsp). The sequences of the gene-specific primers and UPL numbers used in the current study are given in Supplementary Table 1. The thermal cycling conditions were as follows: 94°C for 5 min, followed by 55 cycles at 94°C for 10 s and 60°C for 20 s, and finally the samples were cooled down to 40°C. Each sample was tested in triplicate. Expression levels of the target genes were normalized to mRNA level of glyceraldehyde-3-phosphate dehydrogenase gene. Calculations of relative mRNA expression levels were performed using Relative Expression Software Tool 2008 (REST©). 29
Protein extraction and Western blot analysis
The effects of CuB, Gef, and the combination of both on protein expression in HT-29 and HCT-116 cells were determined using Western blot analysis. The protein content of each sample was determined by BCA™ Protein Assay Kit (Pierce, Rockford, Illinois, USA) according to the manufacturer’s protocol. Equal amounts of protein lysates (30 μg) were loaded onto a 15% sodium dodecyl sulfate–polyacrylamide gel electrophoresis gel and and transferred onto nitrocellulose membranes (Millipore, Bedford, Massachusetts, USA) using Bio-Rad wet-blot transfer apparatus (Bio-Rad Laboratories, Hercules, California, USA). After blocking with 5% nonfat milk in Tris-buffered saline Tween 20 (TBST; 20 mM Tris-HCl, 500 mM sodium chloride, and 0.1% Tween 20) buffer for 1 h at room temperature, the membranes were incubated with specific primary antibodies overnight at 4°C. ACTB was used as an internal control. After being washed with TBST three times, the membranes were probed with an appropriate HRP-conjugated secondary antibody for 2 h at room temperature. Blots were developed using electrochemiluminescence (ECL) reagent (Amersham Pharmacia Biotech, UK) to visualize the specifically bound antibodies and the proteins were detected using an ECL system (Kodak Gel Logic 2200 PRO Imaging System, Carestream). All experiments were performed in triplicate.
Statistical analysis
Calculations of relative mRNA expression levels of Bcl-2, Bcl-xL, Bax, Bak, Bad, Bim, and cyclin D1 were performed using Relative Expression Software Tool 2009 (REST©; 2009 v2.0.13). One-way analysis of variance test was performed for other parameters using SigmaStat v3.5 software. Data were expressed as the mean ± standard deviation (SD) from a representative experiment. The values of p < 0.05 were considered as significant.
Results
Antiproliferative effect of CuB and/or Gef alone, and their combination in CRC cells
We examined whether CuB and Gef have the inhibitory effect on proliferation of CRC cells. The effect of CuB and/or Gef on cell viability was evaluated using an MTT assay in HT-29 and HCT-116 cells. These cells were treated with different concentrations of CuB, Gef, and the combination of CuB and Gef to reveal the dose- and time-dependent response of the cells. Untreated cells were used as control. After the HT-29 and HCT-116 cells were exposed to various concentrations of CuB alone for 24 and 48 h, CuB significantly decreased the viability of cells as compared to the control cells. As shown in Figure 1(a), the half-maximal inhibitory concentration (IC50) values of CuB were found to be approximately 10 µM for 24 h, and 1 µM for 48 h in HT-29 cells. Moreover, the IC50 values of CuB were found to be approximately 60 µM for 24 h, and 40 µM for 48 h in HCT-116 cells as compared to untreated control cells (Figure 1(d)).
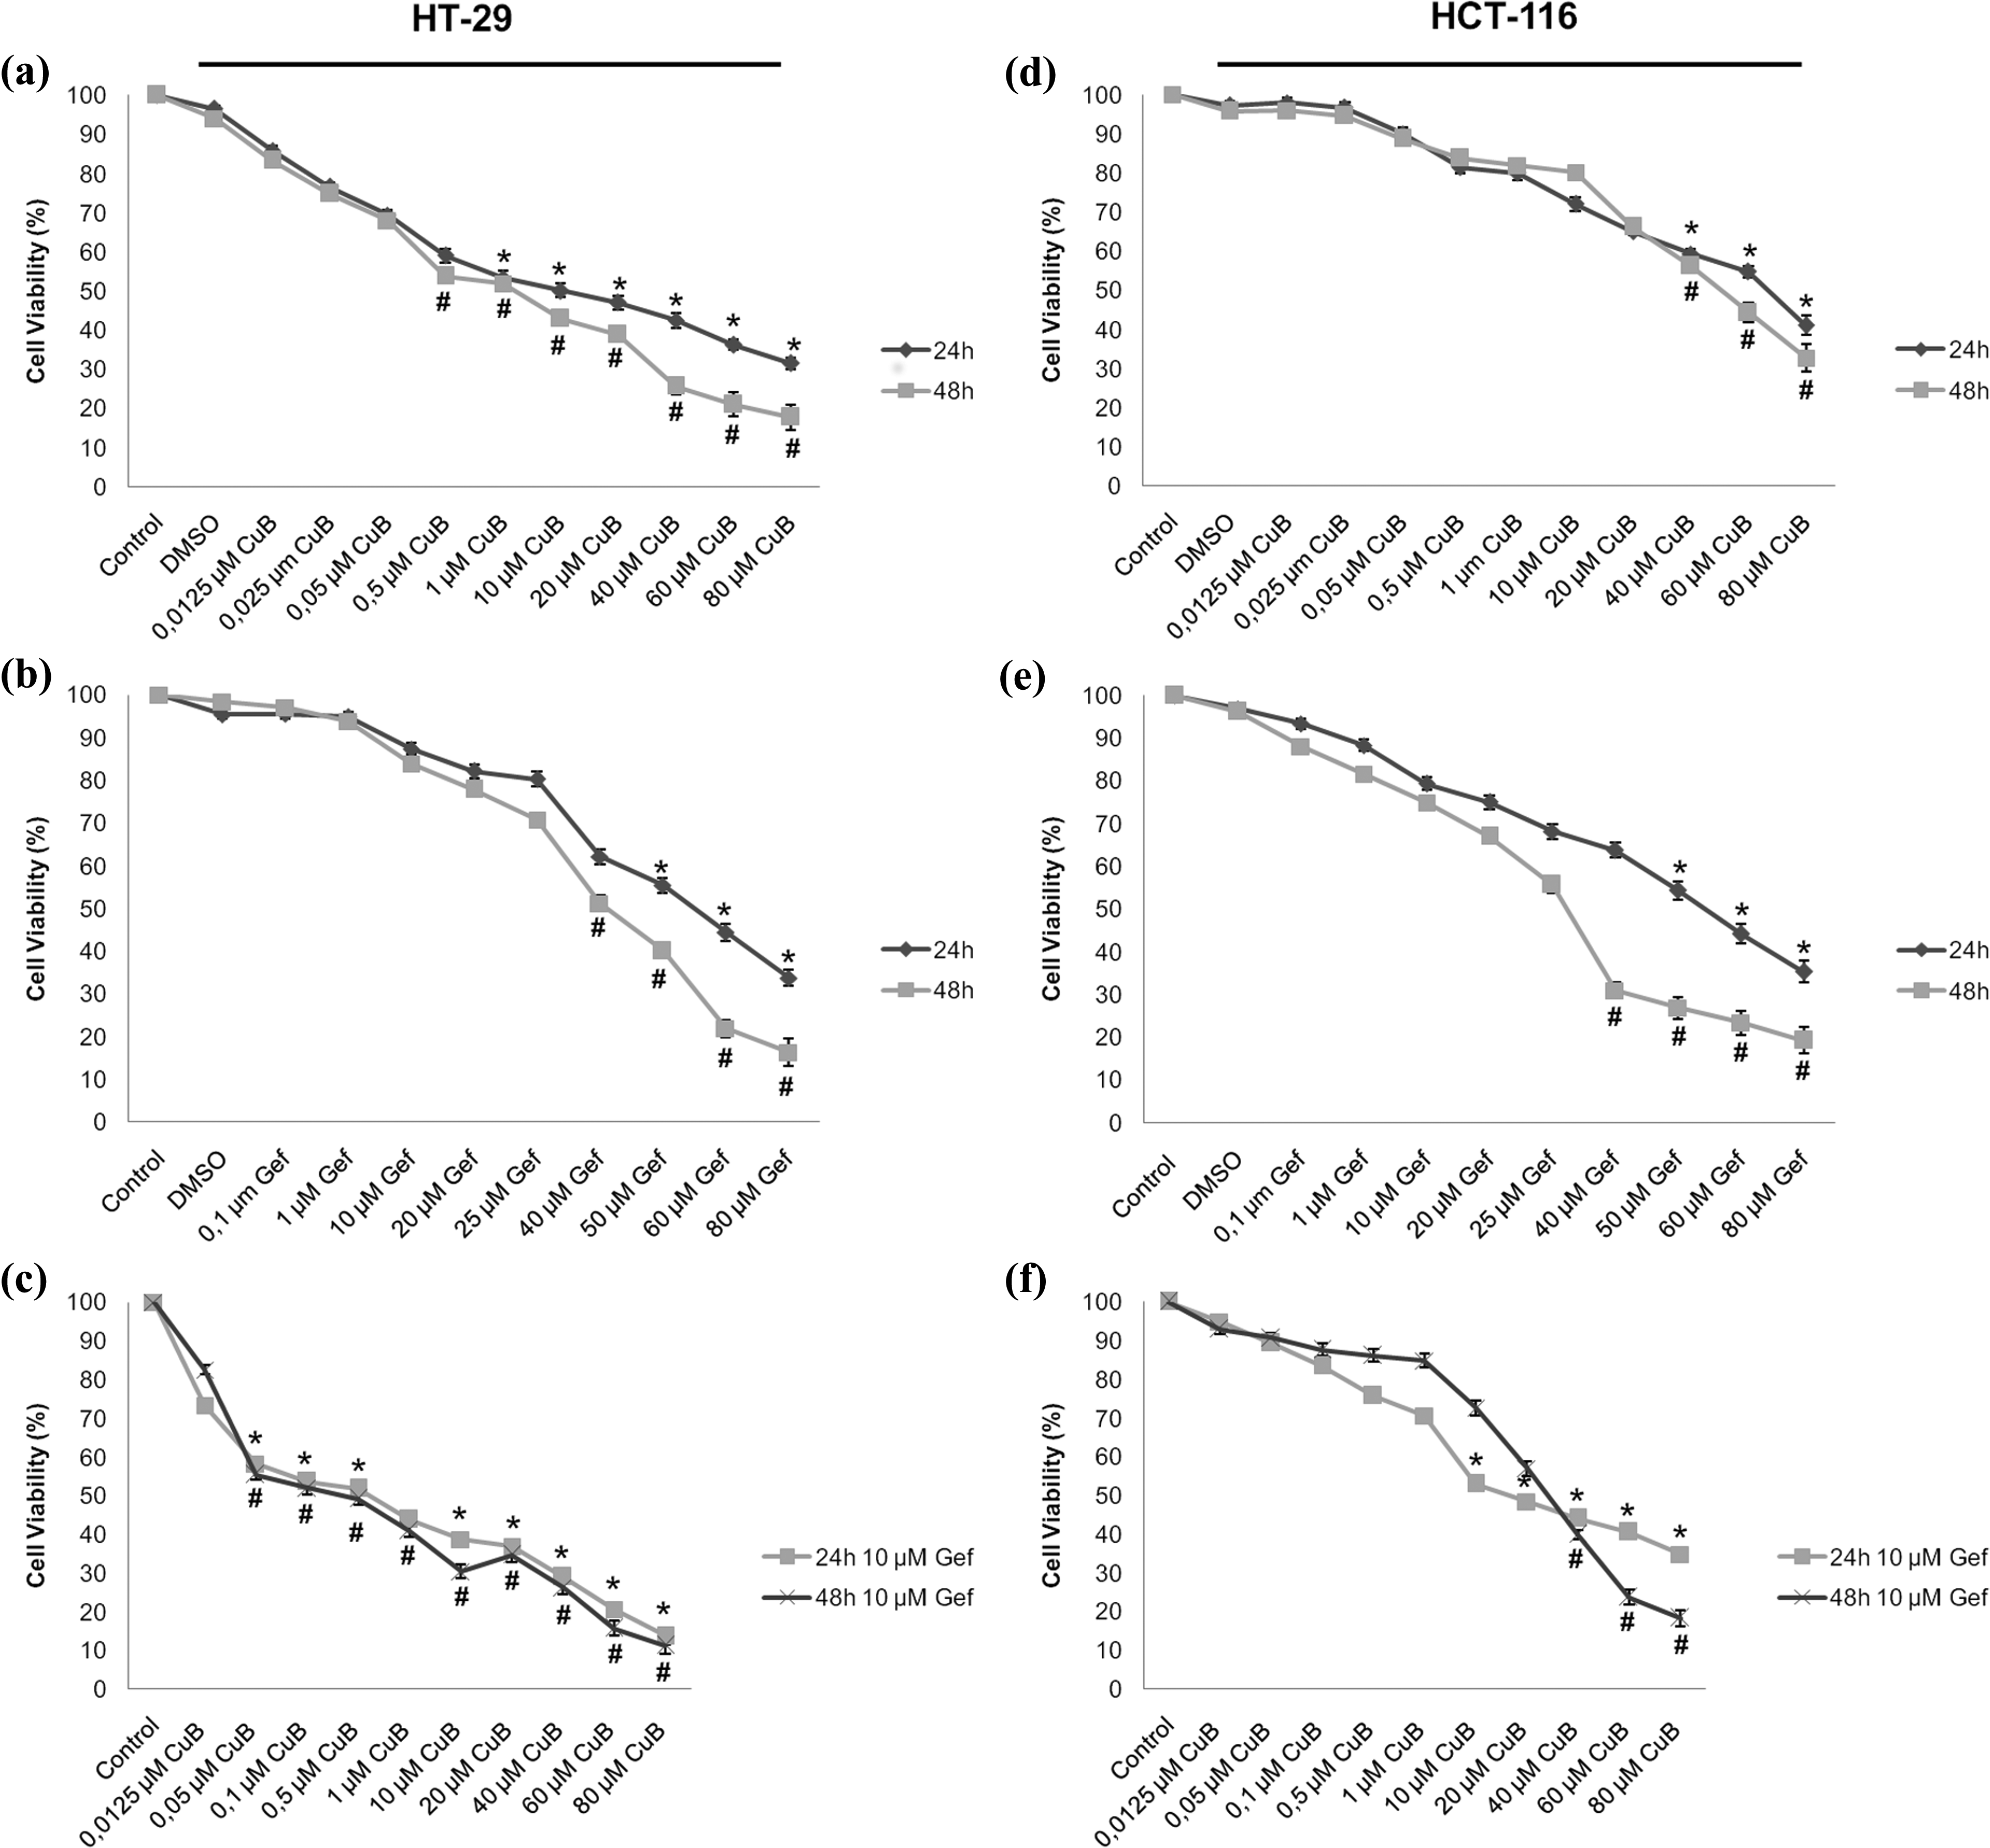
Effect of CuB, Gef alone, and combination with Gef on the viability of CRC cells cells. The HT-29 cells were treated with various concentrations of (a) CuB, (b) Gef and (c) CuB + Gef for 24 and 48 h. The HCT-116 cells were treated with various concentrations of (d) CuB, (e) Gef, and (f) CuB + Gef for 24 and 48 h. Cell viability was determined using an MTT assay. The data were normalized to the viability of the control cells (100%, treated with 0.5% DMSO vehicle). *p < 0.05: versus control cells for 24 h; #p < 0.05: versus control cells for 48 h. Gef: Gefitinib; CuB: cucurbitacin B; DMSO: dimethyl sulfoxide; MTT: 3-(4,5-dimethyl-thiazol-2-yl)-2,5-diphenyltetrazolium bromide; CRC: colorectal cancer.
Meanwhile, Gef was given to the cells with various concentrations, and cell viability was analyzed at different time points. As shown in Figure 1, to assess the effect of Gef on cell viability, different concentrations of Gef (0.1–80 μM) were incubated with HT-29 and HCT-116 cells for 24 and 48 h. Gef inhibited the viability of both HT-29 (IC50 = 50 µM for 24 h, 40 µM for 48 h) and HCT-116 cells (IC50 = 50 µM for 24 h, 25 µM for 48 h, respectively (Figure 1(b) and (e)).
To examine the antiproliferative effect of CuB when combined with Gef, we have chosen one randomized concentration, which was 10 μM, that had been below the IC50 values in both cells and then cells were treated with different concentrations of CuB with Gef (10 μM) for 24 and 48 h. Treatment of CuB with 10 μM Gef, markedly reduced the IC50 concentrations of CuB treatment. IC50 values of CuB + Gef treatment were found to be approximately 0.5 μM CuB + 10 μM Gef for 24 h and 0.1 μM CuB + 10 μM Gef for 48 h in HT-29 cells (Figure 1(c)). On the other hand, IC50 values of CuB + Gef treatment were found to be approximately 40 μM CuB + 10 μM Gef for 24 h and 20 μM CuB + 10 μM Gef for 48 h in HCT-116 cells (Figure 1(f)). Further analysis had been taken at these and approximate concentrations for comparison.
Cellular morphological changes
Apoptosis is a physiological pattern of cell death characterized by morphological features. Induction of apoptosis in cancer cells has already been used as an important indicator to detect the ability of chemotherapeutic agents to inhibit tumor cell growth. 30 –32 Thus, to determine the type of cell condition induced by CuB and/or Gef, CRC cells were stained with AO/EB, which could be identified viable, apoptotic, and necrotic cells based on color and morphological changes (Figure 2(a) and (b)). The AO/EB staining showed that treatment with CuB and/or Gef alone and the combination of both resulted in dose-dependent inhibition of the growth of both cell lines compared with untreated cells (Figure 2(c)). Although, HT-29 and HCT-116 cells treated with CuB alone showed an increased number of apoptotic and necrotic cells in a dose-dependent manner for 24 h, CuB caused significant apoptosis over necrosis in these cells. Moreover, higher concentrations of CuB and Gef produced more apoptotic cell death than necrosis.

Representative images of viable (1), apoptotic (2), and necrotic (3) cells were determined by AO/EB staining using flourescent microscopy at ×400 magnification. (a) HT-29 cells untreated (control) group. (b) HT-29 cells treated with 0.5 µM CuB. (c) Viable, apoptotic, and necrotic ratios of cells treated with agents at 24 h. *p < 0.05: versus control. CuB: cucurbitacin B; AO: acridine orange; EB: ethidium bromide.
Cytotoxic effect of CuB and/or Gef on CRC cells by LDH release assay
Cytotoxic effect of CuB and Gef alone or the combination of both on HT-29 and HCT-116 cells was evaluated by LDH release assay. As shown in Figure 3, the highest cytotoxicity rate was observed at 0.5 μM CuB plus 10 μM Gef concentration in HT-29 cells and 40 μM CuB plus 10 μM Gef concentration in HCT-116 cells for 24 h. The percentages of LDH releasing at these doses were as follows: 23.7% (p < 0.05) and 24.4% (p < 0.05) in HT-29 and HCT-116 cells, respectively.

Cytotoxic effects of treatment with selected doses of CuB and Gef alone or in combination on (a) HT-29 and (b) HCT-116 cells determined by LDH release assay into culture medium at 24 h. *p < 0.05: versus control. The results are expressed as means ± SD from three independent experiments. CuB: cucurbitacin B; LDH: lactate dehydrogenase; Gef: Gefitinib.
Effect of CuB and/or Gef on DNA synthesis
The effect of CuB alone and in combination with Gef on HT-29 and HCT-116 CRC cells was determined by measurements of incorporation of BrdU assay. Treatment with both CuB and Gef alone inhibited DNA synthesis in a dose-dependent manner for 24 h. The 0.5 μM CuB treatment for 24 h incubation period significantly reduced DNA synthesis rate from 100% to 66% in HT-29 cells (p < 0.05). On the other hand, DNA synthesis rate was significantly reduced by 61.2% in HCT-116 cells after incubation with CuB at 40 μM for 24 h (p < 0.05). However, the combination treatment of CuB and Gef reduced DNA synthesis significantly more than CuB-alone treatment. For instance, 0.5 μM CuB + 10 μM Gef treatment significantly reduced DNA synthesis rate to 57% in HT-29 cells (p < 0.05) and 40 μM CuB + 10 μM Gef treatment sigficantly reduced DNA synthesis rate to 53.2% (p < 0.05) in HCT-116 cells, respectively (Figure 4(a) and (b)).

Effect of treatment with indicated doses of CuB and Gef alone or in combination on DNA synthesis rate of (a) HT-29 and (b) HCT-116 cells analyzed by BrdU incorporation-ELISA. *p < 0.05. BrdU: 5ʹ-bromo-2ʹ-deoxy-uridine; ELISA: enzyme-linked immunosorbent assay; CuB: cucurbitacin B; Gef: Gefitinib.
Effect of CuB and/or Gef on apoptosis and DNA fragmentation
According to Cell Death Detection ELISA assay, a dose-dependent increase in apoptotic cells was detected after 24 h treatment with both CuB and Gef alone in both cell lines (Figure 5). Concentrations of 0.5 μM and 40 μM CuB induced apoptosis in HT-29 and HCT-116 cell lines, respectively. However, combination treatment of CuB and Gef increased DNA fragmentation significantly more than CuB and Gef-alone treatment. Although 0.5 μM CuB treatment resulted in about fourfold increase in fragmentation when compared with control cells for 24 h, 0.5 μM CuB plus 10 μM Gef treatment caused sixfold increased fragmentation rate in HT-29 cells (p < 0.05) (Figure 5(a)). Meanwhile, 40 μM CuB plus 10 μM Gef administration caused fivefold increased fragmentation in HCT-116 cells as compared to the control cells for 24 h (p < 0.05; Figure 5(b)). But, 40 μM CuB treatment resulted in about fourfold increase in fragmentation (p < 0.05).

The levels of DNA fragmentation induced by CuB and Gef alone or in combination at indicated doses in (a) HT-29 and (b) HCT-116 cells at 24 h. *p < 0.05: compared with untreated cells. ELISA: enzyme-linked immunosorbent assay; CuB: cucurbitacin B; Gef: Gefitinib.
On the one hand, apoptosis of the cells was also detected by analysis of DNA fragmentation on agarose gel electrophoresis, a classical method of detecting the DNA ladders that accompany late apoptosis. This technique is based on the detection of internucleosomal DNA fragmentation, a characteristic hallmark of apoptosis. Dose-dependent increase in DNA fragmentation with the characteristic ladder pattern was observed for both CuB alone and in combination with Gef treatments in HT-29 (Supplementary Figure 1) and HCT-116 cells (data not shown) when compared with control cells in which DNA was not seen with any fragmentation or smear.
CuB and Gef alone and in combination treatment induced caspase 3 cleavage
Caspase 3 is one of the most commonly activated caspase during apoptosis, which plays a pivotal role in the terminal execution phase of apoptosis. As shown in Figure 6, cleaved caspase 3 protein levels increased after treatment with both CuB and Gef alone for 24 h in a dose-dependent manner in both CRC cells (p < 0.05). Caspase 3 activity was significantly increased at 24 h after treatment with CuB at 0.5 μM and 40 μM in HT-29 and HCT-116 cells, respectively (p < 0.05). Treatment of both CuB and Gef alone caused more cleaved caspase-3 protein expression in HT-29 cells as compared to HCT-116 cells. Moreover, the combination treatment also resulted in significant increase in active caspase 3 protein levels in both cell lines after 24 h (p < 0.05; Figure 6(a) and (b)). Co-treatment with CuB and Gef of both CRC cells markedly induced caspase 3 activity when compared with treatment with CuB alone.
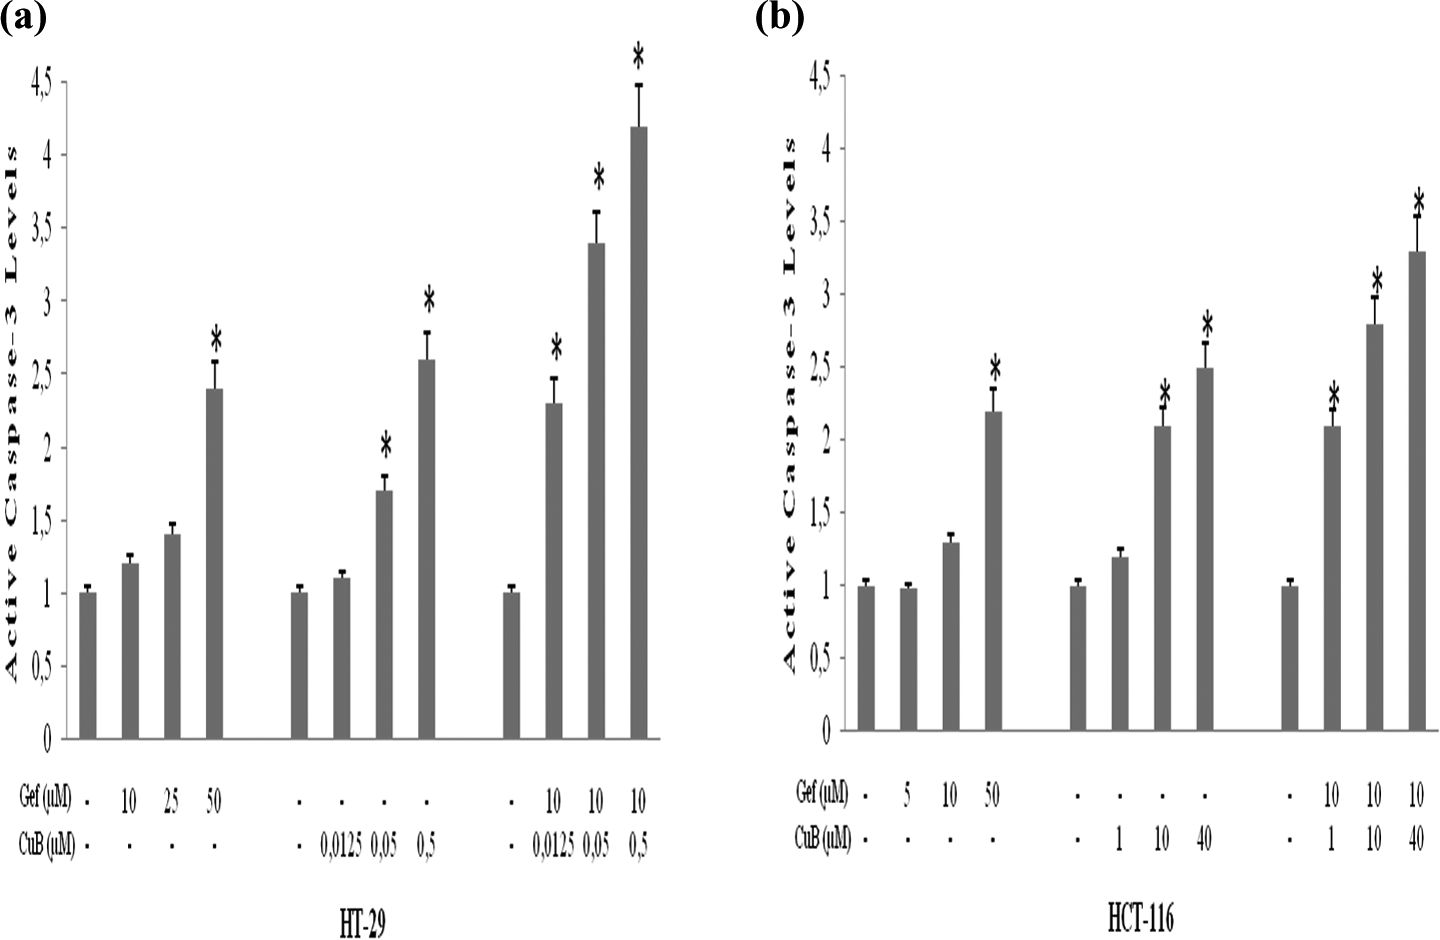
Effects of CuB and Gef alone or in combination on cleaved caspase-3 protein levels in (a) HT-29 and (b) HCT-116 cells were determined by ELISA assay. *p < 0.05: compared with control. ELISA: enzyme-linked immunosorbent assay; CuB: cucurbitacin B; Gef: Gefitinib.
Effect of CuB and Gef alone and the combination treatment on Bcl-2, Bcl-xL, Bax, Bak, Bad, Bim, and Cyclin D1 mRNA expression
We evaluated the effects of CuB alone and combination treatment on the mRNA expression levels of antiapoptotic Bcl-2 and Bcl-xL, proapoptotic Bax, Bak, Bad and Bim, and regulator of cell cycle Cyclin D1 genes using quantitative RT (qRT)-PCR. As shown in Figure 7, Bcl-2 and Bcl-xL mRNA levels were significantly decreased after treatment with 0.5 and 10 µM CuB alone for 24 h in both cell lines, respectively. As compared to CuB-alone treatment, similar decreased expression patterns for Bcl-2 and Bcl-xL mRNAs were obtained after CuB plus Gef treatment for 24 h. mRNA levels of these genes were also significantly decreased for 0.5 µM CuB + 10 µM Gef treatment in HT-29 cells and 10 µM CuB + 10 µM Gef treatment in HCT-116 cells at 24 h.

Effects of treatment with indicated doses of CuB and Gef alone or in combination on mRNA levels of Bcl-2, Bcl-xL, Bax, Bak, Bad, Bim, and Cyclin D1 in (a) HT-29 and (b) HCT-116 cells at 24 h. *p < 0.05: compared with control. mRNA: messenger RNA; PCR: polymerase chain reaction; ELISA: enzyme-linked immunosorbent assay; CuB: cucurbitacin B; Gef: Gefitinib; messenger RNA; Bcl-2: 2B-cell lymphoma 2; Bcl-xL: B-cell lymphoma-extra large; Bax: Bcl-2-like protein 4; Bak: Bcl-2 homologous antagonist/killer; Bad: Bcl-2-associated death promoter; Bim: Bcl-2-like protein 11.
Moreover, Bax, Bad, and Bim mRNA levels were also significantly elevated after treatment with CuB alone and CuB plus Gef for 24 h in HT-29 cells (p < 0.05). In addition, the expression of Bak mRNA levels was also increased after treatment with 0.5 µM CuB alone for 24 h in HT-29 cells when compared with untreated cells, no statistically significant changes were observed (p > 0.05; Figure 7(a)). Furthermore, the mRNA levels of Bax and Bak genes significantly increased after exposure to 10 µM CuB alone in HCT-116 cells (p < 0.05). Although both Bad and Bim mRNA levels were increased by CuB-alone treatment in HCT-116 cells, there were no statistically significant differences (p > 0.05; Figure 7(b)). We showed that statistically significant increase for Bax, Bak Bad, and Bim mRNA levels was found after 0.5 µM CuB + 10 µM Gef and 10 µM CuB + 10 µM Gef treatment for 24 h in HT-29 and HCT-116 cells, respectively (p < 0.05). On the other hand, cyclin D1 mRNA levels were significantly decreased after CuB alone and CuB plus Gef treatment for 24 h in both CRC cell lines (Figure 7; p < 0.05). The results indicated that CuB can regulate the expression of some genes involved in cell cycle progression and apoptosis and inhibit tumorogenic growth at mRNA levels.
Effects of CuB and/or Gef alone and in combination treatment on the protein levels of Bcl-2, Bax, Bak, p27kip1, and cyclin D1
To examine the effect of CuB and/or alone and in combination with CuB and Gef treatment on HT-29 and HCT-116 cells, we measured apoptosis-related (Bcl-2, Bax, and Bak) and cell cycle regulatory (p72kip1 and Cyclin D1) protein levels by Western blot assay. Consistent with qRT-PCR analysis, as shown in Figure 8(a) and (b), CuB-alone treatment induced the upregulation of Bax and Bak and downregulation of Bcl-2 protein levels. Compared to control cells, Bax and Bak protein levels were significantly upregulated and Bcl-2 protein levels were significantly downregulated following the combination treatment of CuB + Gef in both HT-29 and HCT-116 cells.

The protein expression levels of Bcl-2, Bax, Bak, p27kip1 and Cyclin D1 in (a) HT-29 and (b) HCT-116 cell lines at 24 h of exposure to CuB and Gef alone or the combined treatment by Western blot analysis. The housekeeping protein ACTB was used as an internal loading control. Bcl-2: 2B-cell lymphoma 2; Bak: Bcl-2 homologous antagonist/killer; Bax: Bcl-2-like protein 4; CuB: cucurbitacin B; Gef: Gefitinib.
As shown in Figure 8, cyclin-dependent kinase inhibitor p27kip1 protein level was upregulated and cell cycle regulator cyclin D1 was downregulated in CuB-alone treated HT-29 and HCT-116 cells. Moreover, p27kip1 protein levels were also significantly upregulated and cyclin D1 protein levels were significantly downregulated following treatment with combinations of 0.5 µM CuB + 10 µM Gef and 10 µM CuB + 10 µM Gef at 24 h in HT-29 and HCT-116 cells, respectively.
Effects of CuB and/or Gef treatments on pEGFR and pSTAT3 protein levels
When treated with Gef alone and in combination with CuB, pEGFR protein levels were downregulated, while total EGFR levels did not change. As shown in Figure 9, the pEGFR expression was significantly decreased after treatment of 10 µM Gef alone in HT-29 and HCT-116 cells when compared with the control cells. These fold changes were greater in HT-29 cells compared with HCT-116 cells. The combination treatment of CuB and Gef decreased the protein levels of pEGFR in both cells compared to untreated control cells.
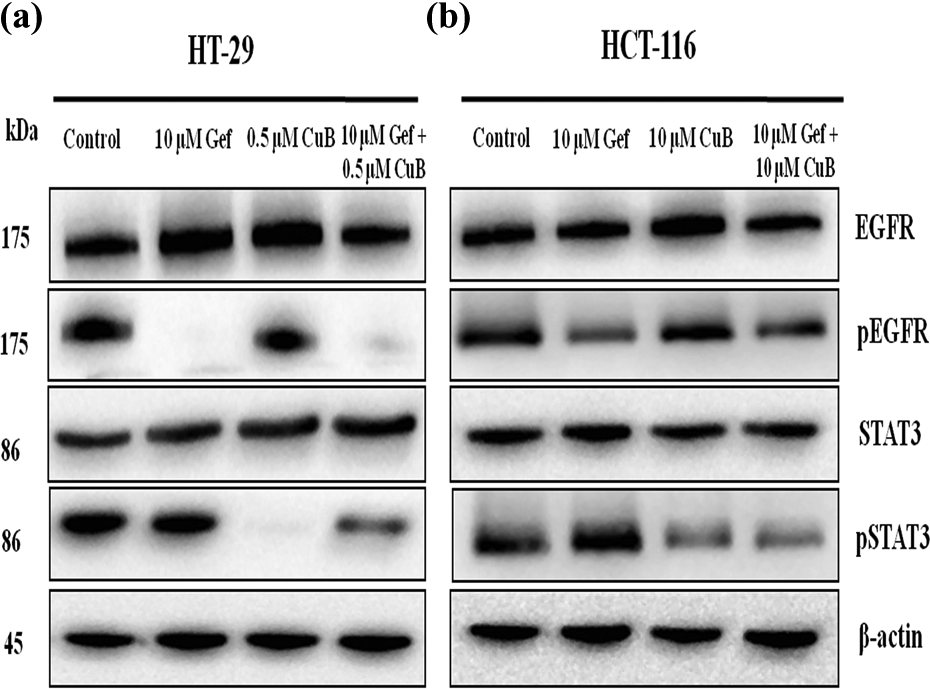
The protein expression levels of EGFR, pEGFR, STAT3 and pSTAT3 in
On the other hand, we tested the effect of CuB alone and in combination with Gef treatment on STAT3 phosphorylation (Tyr705) in CRC cells (Figure 9(a) and (b)). The total STAT3 protein level was not altered by CuB alone and in combination with Gef treatment. But, pSTAT3 protein level was significantly decreased when treated with 0.5 µM and 10 µM CuB alone in HT-29 and HCT-116 cells, respectively. Moreover, pSTAT3 protein levels also decreased with the combined treatment of CuB and Gef in both cell lines. Interestingly, pSTAT3 showed a dramatic reduction in HT-29 cells when compared with HCT-116 cells.
Discussion
The EGFR overexpression, which is found frequently in different types of cancers, seems an important target in colon cancer treatment. 5,7,33,34 Constitutive activation of STAT3 has been implicated in tumorigenesis by promoting cell proliferation and inhibiting apoptosis in various types of cancers. 35,36 So, STAT3 is an attractive molecular target for cancer prevention. 15,17 As already known, the main approaches on cancer researches are to investigate the lower cytotoxic agent that suppresses growth and proliferation of tumor cells and induces apoptosis. 37,38 One of them is using herbal drugs and their derivatives as an alternative and supplementary medicine. Also, combination therapy with multiple agents is widely used to reduce toxicity and enhance the efficacy of the cancer treatment. 32,39 Recently, several studies have shown that CuB has shown a synergistic effect with various known chemotherapeutic agents that are already established in the treatment of human cancers. 24,26,40 –43 In this point of view, we aimed to investigate the apoptotic and antiproliferative effects of natural cucurbitacin family member CuB, as a single agent and combined with a well-known selective TKI, Gef, on CRC cells. So, we preferred to use HT-29 and HCT-116 colorectal adenocarcinoma cell lines that are identical in terms of morphology. Despite the similar morphology of HT-29 and HCT-116 cells, HT-29 cells are genetically different from HCT-116 cells in respect to having inactive and mutated p53 gene. 44,45 Therefore, HT-29 cells are more sensitive to apoptotic stimulation than HCT-116 cells. On the other hand, both cells show same characteristics of colonic epithelial structure. So they were the best suited cells to mimic most of the cases of colon cancers that are in adenocarcinoma type.
Several studies showed that Gef decreases cell viability and induces apoptosis on different cancer cell lines. 46 –48 In one of these studies, Patel et al. showed that Gef had decreased cell viability in HT-29 and HCT-116 cells. 49 Moreover, Solmi et al. also found that treatment with Gef showed a significant reduction in cell viability on Caco-2 and HT-29 colon cancer cells in a dose- and time-dependent manner. 50 According to these findings, our results were also supported by the fact that Gef treatment decreased cell viability in a time- and dose-dependent manner in both HCT-116 and HT-29 cells with IC50 values 50 μM (24 h).
On the other hand, previous studies suggested that CuB has the antiproliferative effects against several human cancer cell lines and tumor xenografts via inhibiting STAT3 phosphorylation. 22 –24,40,41 In addition to that the apoptotic effects of CuB on various types of cancer cells, such as breast, pancreatic, prostate, lung, osteosarcoma, hepatocellular, and laryngeal cancers, 24,40,41,51 –53 our findings also showed that CuB decreased cell viability and proliferation in a dose- and time-dependent manner. The most effective CuB dose and incubation period were 10 µM and 24 h for inducing apoptosis in HT-29 and HCT-116 cells, respectively. As shown in Figure 1, HT-29 and HCT-116 cells showed different responses to CuB and Gef. So we aimed to choose the optimal combination of concentrations to lower the potential unexpected side effects of these agents, seperately in both cell lines. At constant 10 µM Gef concentration, which reduced cell viability by 87.32% in HT-29 and 79.33% in HCT-116, we combined differrent concentrations of CuB until the optimal lowest IC50 values have been found, as shown in the Results section. At these concentrations of CuB plus Gef, cell proliferation was reduced more effectively than CuB-alone treatment in both cell lines.
Treatment with CuB alone and in combination with Gef enhanced the antiproliferative effect of CuB as supported by LDH assay. The reduction in viability of HT-29 and HCT-116 cells in the MTT assay was proportionate to the increase in LDH release. After treatment of HT-29 and HCT-116 cells with higher concentrations of CuB, cytotoxic effects were significantly increased. Additionally, when CuB combined with Gef, the amount of LDH leakage into the medium was higher than CuB-alone treatment. At the same time, we found that CuB alone and CuB plus Gef treatment decreased the DNA synthesis rate in both HT-29 and HCT-116 cells, compared with control cells. ELISA analysis showed that CuB plus Gef treatment significantly reduced in DNA synthesis in both cells, as compared to CuB-alone treatment.
Induction of apoptosis in cancer cells has already been used as an important indicator to detect the ability of chemotherapeutic drugs to inhibit tumor growth. 30,31,37 Previous studies demonstrated that treatment with CuB induced apoptosis in various cancer cell lines, including lung, 53 laryngeal, 40,41 pancreatic, 25,54 hepatocellular 22,55 and colon 28 carcinoma in a dose-dependent manner. Our results were also in conformity with these reports. Fluorescent microscopy analysis with AO/EB staining indicated that treatment of HT-29 and HCT-116 cells with CuB alone or CuB plus Gef caused typical morphological changes both in apoptotic and necrotic profile apoptosis in a dose-dependent manner. According to these changes, CuB plus Gef treatment made cells more suspectible to apoptosis than CuB-alone treatment. As already known, the commercial ELISA DNA fragmentation methods have been used especially and sensitively to detect apoptosis rather than necrosis. 56 So, to support our AO/EB staining data and confirm the apoptotic effects of CuB, Gef, and CuB plus Gef, we used commercial kit, which was sensitive to detect apoptosis in the cells. As mentioned in Results section, we found that CuB-alone treatment caused an increase in DNA fragmentation ratio and cleaved caspase 3 levels and this increment became more significant with the combination of Gef in HT-29 and HCT-116 cells. Similar results were also found in the different combinations of CuB and/or Gef in several colon cancer cell lines (SW480, HT-29, and HCT-116), hepatocellular carcinoma cells, leukemia cells, and laryngeal cancer cells. 22,24,40,41,57
Moreover, a significant increase in proapoptotic Bax, Bad, and Bim mRNA levels were determined after treatment with CuB alone, but not for Bak mRNA levels in HT-29 cells. On the other hand, in HCT-116 cells Bax and Bak mRNA levels were increased in a statistically significant manner after treatment with CuB alone, but Bad and Bim mRNA levels did not. In combination treatment Bax, Bak, Bad, and Bim mRNA levels were significantly increased in both cell lines whereas the antiapoptotic Bcl-2 and Bcl-xL mRNA levels were decreased, compared with control cells. Our findings were correlated with those of other studies, which showed effects of CuB administration of apoptotic process on various cancer cell lines such as Panc-1, SH-SY5Y, HepG2, and Hep-2 cells. 24,40,41,43,58,59 On the contrary, there were no statistically significant changes observed at IC50 values of CuB treatment for 24 and 48 h on SW480 colon cancer cells. 28 Cyclin D1 is an important cell cycle regulator that facilitates the transition from G1 to S phase and overexpressed in most cancer cells, such as CRC. Cyclin-dependent kinase inhibitor p27kip1 acts as a negative cell cycle regulator by inhibiting the cyclin/cdks. In our study, cyclin D1 mRNA levels were markedly decreased after CuB alone and CuB plus Gef treatment in both CRC cell lines. Similarly, in compatible with the mRNA levels, cyclin D1 protein levels were significantly downregulated and p27kip1 protein levels were upregulated CuB alone and CuB plus Gef treated in HT-29 and HCT-116 cells, when compared with control cells. Although we did not identify any studies on the effects of CuB on the mRNA and protein levels of cyclin D1 and p27kip1 just in HT-29 and HCT-116 cells, similar results were found in different studies investigating the apoptotic responses of CuB-treated cell lines. 22,24,40,41,43,51,60 Moreover, Yasuda et al. showed CuB-induced G2 arrest in SW 480 colon cells 28 and many other studies also confirmed this using different cell lines. 54,58,61 In the present study, our BrdU incorporation results and changes in Cyclin D1 and p27kip1 levels gave rise to the thought that CuB alone and in combination with Gef have regulated the cell cycle progression from G1 phase and continued into the S phase. So further cell cycle analysis have to be made to confirm whether CuB alone and CuB plus Gef induce cell cycle arrest in G2/M in HT-29 and HCT-116 cells.
The EGFR is commonly expressed and activated in a wide range of human epithelial malignancies, including CRC. In our study, we observed that phosphorylated EGFR was downregulated, whereas the level of total EGFR was not altered in Gef alone and combined with CuB-treated HT-29 and HCT-116 cells, as expected. Similar results were also found in several colorectal carcinoma cells and also shown were the results of treatment with Gef decreasing the level of phosphorylated EGFR. 62 –64
Because of its oncogenic potential, STAT3 is closely linked with many types of human cancers. Hence, STAT3 has been implicated as a target for cancer therapy and inhibitors of STAT3’s activation are expected to be useful for cancer chemoprevention. 17 It is generally believed that CuB might block tumor cell growth through STAT3 suppression. Several studies have suggested that CuB exerts inhibitory effects against several human cancer cell lines via suppression of STAT3 phosphorylation. 22,23,55 For instance, Thoennissen et al. showed the protein level of pSTAT3 was decreased, but the level of total STAT3 was not altered in CuB-treated pancreatic cancer cells in vitro. 54 Also, another study revealed that treatment with CuB reduced the level of pSTAT3 and its downstream targets, cyclin B1 and Bcl-2, in human Hep-2 laryngeal cell line. 24,40,41 Our results were also compatible with these findings. In our study, treatment with CuB alone reduced the level of pSTAT3, whereas no change was identified in the levels of total STAT3 in HT-29 and HCT-116 cell lines. Although our finding is in agreement with these studies that CuB suppresses the level of pSTAT3 in various cancer cell types, 22 –24,40,41,54,65 on the contrary, however at 0.5 µM CuB + 10 µM Gef combination, pEGFR levels were decreased, and pSTAT3 levels were slightly increased compared to the 0.5 µM CuB-alone treatment. This might be explained because of the alternative phosphorylation or resistance mechanisms. 66 –68 Yasuda’s and Chans’s findings showed that CuB can induce cell growth arrest and apoptosis without affecting STAT3 phosphorylation in SW480 colon carcinoma and BEL-7402 hepatocellular carcinoma cells, respectively. 28,55 Yasuda et al. had found that there were no significant changes in the phosphorylation of STAT3 in SW480 cells 28 just as we found at 10 µM CuB alone and 10 µM CuB + 10 µM Gef combination in HCT-116 cells. Additionally, they revealed that the apoptotic mechanism of CuB was caspase-dependent and mediated by the accumulation of reactive oxygen species. Besides, Chan et al. also observed that treatment with CuB induced cell cycle S phase arrest and apoptosis without affecting STAT3 phosphorylation in BEL-7402 cells. 55 Not only our results demonstrated that CuB treatment induces apoptosis in caspase-dependent manner but also reduction in the antiapoptotic protein levels (such as Bcl-2 and Bcl-xL) and concominantly increment in the proapoptotic protein levels (especially Bax). So, our study show that CuB synergistically potantiates the apoptotic effects of Gef in both cell lines.
Conclusions
The EGFR and its downstream JAK/STAT3 pathways are likely to be important mediators in the pathogenesis of CRC, which have recently emerged as attractive target for both prevention and treatment of CRC. In summary, our current study showed that CuB induced cell cycle inhibition and apoptosis in HT-29 and HCT-116 CRC cells by inhibiting the STAT3 and EGFR signaling. The combinational treatment of CuB with Gef is more effective than CuB-alone treatment in terms of leading the both CRC cells to apoptosis. Taken together, these findings suggested that CuB may have wide therapeutic and/or adjuvant approach in the treatment of human CRC and also the combination treatment of CuB with Gef may be a potential strategy for CRC treatment, at least in vitro. However, further studies using both in vitro and in vivo models on a CRC are needed, particularly on the bioavailability and efficacy.
Footnotes
Declaration of Conflicting Interests
The author(s) declared no potential conflicts of interest with respect to the research, authorship, and/or publication of this article.
Funding
The author(s) disclosed receipt of the following financial support for the research, authorship, and/or publication of this article: This study was supported by Gazi University Research Foundation, with the project code number 01/2011-56.