
Abstract
Valproic acid (VPA) has been reported as inhibitor of histone deacetylases (HDACs). Several reports indicated that HDACs play a crucial role in the pathogenesis of fibrosis and hepatic stellate cell (HSC) activation. The present study was aimed to evaluate the anti-fibrotic effect of VPA against thioacetamide (TAA)-induced hepatic fibrosis and activation of the HSC in rat. VPA and TAA were administrated intraperitoneally at the dose of 400 and 200 mg/kg each at 2 days interval, respectively for a period of 6 weeks. Administration of TAA significantly increased the absolute and relative liver weight, aspartate aminotransferase and alanine aminotransferase levels, which were significantly decreased by VPA treatment as compared to TAA control. VPA treatment prevents the TAA-induced activation of HSC and decreases collagen deposition and infiltration of inflammatory cells as revealed by Sirius red and H&E staining. Interestingly, VPA co-treatment led to significantly increase the DNA damage and apoptosis in the activated HSC as compared to TAA control. Further, TAA decreased the expression of matrix metalloproteinase-2 (MMP-2), while VPA co-treatment significantly increased the expression of MMP-2 as compared to respective control. The present study clearly demonstrated that VPA treatment significantly alleviates TAA-induced activation of HSC and subsequent hepatic fibrosis.
Introduction
Hepatic fibrosis is a reversible scarring response characterized by the accumulation of extracellular matrix (ECM), as a consequence of the liver injury. 1,2 However, an acute or self-limited liver injury may restore almost all the architectural alterations to normal, whilst chronic liver insult results in the sustained activation of the hepatic stellate cells (HSCs), which leads to excessive production of ECM and subsequently the development of hepatic fibrosis. Ultimately, progression of the hepatic fibrosis culminates into end-stage, that is, hepatic cirrhosis. 3 Although extensive studies have been conducted on hepatic fibrosis, very little success has been achieved in the clinical treatment. 4 In the normal resting cells, nucleosome is made up of 146 bp of two superhelical turns of DNA wrapped around core of eight histone proteins, which are responsible for maintaining the chromatin structure. 5 The acetylation of the histone protein is associated with the activation of transcription by transfer of acetyl group on N-terminal tail of histone protein with the help of enzyme histone acetyltransferase. On the other hand, enzyme histone deacetylases (HDACs) remove acetyl group, which result in the formation of heterochromatin and gene inactivation. 6 Several studies have identified the potential role of HDACs and their inhibitors in the pathogenesis of hepatic fibrosis. 7,8 Most of the HDAC inhibitors’ intervention studies focus on the development or reversal of fibrosis, whilst the exact molecular mechanisms and the role of individual HDACs in the hepatic fibrosis still remains unclear. 9 –12 It has been reported that HDAC inhibitors modulate the stellate cell activation and suppress collagen deposition and α-smooth muscle actin (α-SMA) expression. 13 –15 Recently, HDACs have been emerged as potential targets for the anti-fibrotic drug and their exploration for the possible therapeutic intervention. 16 Further, trichostatin A has shown to have promising role in the suppression of myofibroblastic differentiation in the primary culture of HSC. 15
Valproic acid (VPA) was introduced in the market in late 1960s as an antiepileptic drug with broad spectrum of activity for the treatment of partial and generalized seizures as well as other psychiatric disorders including migraine. 17 But over the period of time, VPA has shown some dose-dependent and reversible side effects such as tremors, gastrointestinal (GI) disturbance and weight gain. 18,19 However, in recent years, accumulated evidences indicated that VPA has the potential to inhibit the HDACs 20 –22 and under clinical development for cervical and ovarian cancer. 23,24 VPA mainly inhibits the catalytic activity of class I HDACs through binding to its catalytic site. 25 Moreover, it has been reported that VPA ameliorates the carbon tetrachloride (CCl4)-induced fibrosis in the primary culture of hepatocytes as well as in mice. 10 Further, VPA protects fibrogenesis in the liver as well as other organs in various pathological insults. 12,14 Based on the above reports, it is pertinent to evaluate the anti-fibrotic mechanism of VPA in the hepatic fibrosis as well as HSC cell activation. Therefore, in the present study, we investigated the anti-fibrotic activity of VPA in the thioacetamide (TAA)-induced hepatic fibrosis model in Wistar rats. The present study demonstrated that VPA treatment significantly ameliorates the TAA-induced hepatic fibrosis and the inactivation of HSC in the rodent model.
Materials and methods
Animals
All the animals and experiment protocol were approved by the Institutional Animal Ethics Committee and the experiments on animals were carried out in accordance with the Committee for the Purpose of Control and Supervision of Experimentation on Animals guidelines. Experiment was performed on male Wistar rats (weighing 250–300 g) procured from the Central Animal Facility of the institute. All the animals were kept under controlled environmental conditions at room temperature 22 ± 2°C with 50 ± 10% humidity and an automatically controlled 12-h light and dark cycle. Standard laboratory animal feed and water were provided ad libitum. Animals were acclimatized to the experimental conditions for 1 week prior to the commencement of the experiment.
Chemicals
VPA (CAS no. 1069-66-5), TAA (CAS no. 62-55-5), bovine serum albumin (CAS no. 9048-46-8), haematoxylin and eosin (H&E), Trizma (CAS no. 77-86-1) and other common reagents were purchased from Sigma-Aldrich Chemicals (St Louis, Missouri, USA). Dimethylsulphoxide (DMSO), normal melting point agarose, low-melting point agarose, Triton X-100, ethylenediaminetetraacetic acid (EDTA) and Hank’s balanced salt solution were obtained from HiMedia Laboratories Ltd (Mumbai, Maharashtra, India).
Experimental design
Animals were randomly divided into four groups with six animals in each group. TAA and VPA were freshly prepared in the normal saline (0.9% sodium chloride (NaCl)) at the time of dosing and administered through intraperitoneal route. Group 1 received normal saline and served as a vehicle control. Groups 2 and 3 received VPA and TAA at the dose of 400 and 200 mg/kg each at 2 days interval, respectively, whilst group 4 received co-treatment of both TAA and VPA for a period of 6 weeks. The dose of VPA was selected on the basis of previous studies. 26,27 Animals were killed by decapitation 24 h after receiving the last dose, and liver was collected.
Measurement of plasma ALT and AST levels
The blood sample was centrifuged at 5000 r/min for 10 min, and the plasma was collected and stored at −20°C. Alanine aminotransferase (ALT) and aspartate aminotransferase (AST) levels were estimated using commercially available kits (Merck, Mumbai, Maharashtra, India) according to manufacturer’s instructions using a semi-automated clinical chemistry analyzer (Merck Microlab 300, Vital Scientific, Netherlands).
Measurement of lipid peroxidation
The lipid peroxidation level in the liver homogenate was measured according to the previously described method with some modifications. 27 Tissue samples were collected and homogenized in ice-cold phosphate buffer (pH 7.4) containing EDTA. After homogenization and centrifugation, supernatant was collected and malondialdehyde (MDA) level was estimated spectrophotometrically as an end product of lipid peroxidation using thiobarbituric acid reactive substance (TBARS) method. Lipid peroxidation was calculated from the standard curve generated using 1,1,3,3-tetramethoxy propane (97%) and expressed as nanomole of MDA per milligram of protein.
Measurement of GSH content
For determination of glutathione (GSH) content, an equal volume of 5% sulphosalicylic acid was added to tissue homogenate and vortexed then kept in ice for 30 min. Then, after centrifugation, the supernatant was collected. GSH content was estimated by Ellmann’s reagent according to previously described method. 28 GSH level was calculated using a standard reference curve using reduced GSH as a standard, and the results were expressed as micromole of GSH per milligram of protein.
Determination of protein content
Protein concentration in the tissue homogenate was determined as described by Lowry et al. 29 with bovine serum albumin as the standard.
Histological evaluation
Histological slides were prepared as previously standardized in our laboratory. 26 Tissue sections (5 μm) were mounted on glass slides coated with Mayer’s albumin and dried overnight. The rehydrated sections were stained using H&E and fibrosis-specific stain, then mounted with digital picture exchange (DPX) mounting media and observed under the microscope at both high (1000×) and low (400×) magnifications (model BX51 microscope, Olympus, Tokyo, Japan). For the quantitative evaluation of the fibrosis, 20 focuses were randomly selected and quantified using Image J software (NIH, Bethesda, Maryland, USA) for each animal.
Detection of apoptosis by TUNEL assay
For terminal deoxynucleotidyl transferase deoxyuridine triphosphate nick-end labelling (TUNEL) assay, liver sections were taken on the glass slides coated with poly-
Comet assay
The comet assay was performed in liver single-cell suspension as described by Singh et al. 30 with some modifications. The entire procedure was conducted in the dark to avoid possible photoinduced DNA damage. From the final cell–agarose suspension, 100 µL were spread over a microscope slide (75 × 25 mm2 glass slides with 19 mm frosted ends, Axiva Sichem Pvt. Ltd, Delhi, India), which were pre-coated with 1% of normal melting agarose. The cells were then lysed in a buffer containing 2.5 M NaCl, 100 mM EDTA, 10 mM Tris (pH 10.0) with freshly prepared 1% Triton X-100 and 10% DMSO for 24 h at 4°C. After lysis, slides were rinsed three times in deionized water to remove the salt and detergent. Then, the slides were placed in a specifically designed horizontal electrophoresis tank (Model CSLCOM20, Cleaver Scientific Ltd, Warwickshire, UK), and the DNA was allowed to unwind for 20 min in an alkaline solution containing 300 mM sodium hydroxide and 1 mM EDTA (pH 13) and then electrophoresis was performed at 300 mA and 38 V (0.90 V/cm) for 30 min. The slides were then neutralized with 0.4 M Tris (pH 7.5) for 15 min and stained with SYBR Green I (1:10,000) for 1 h and covered with cover slips. The DNA damage was visualized under objective (10×) using an AXIO imager M1 fluorescence microscope (Carl Zeiss), and the images were captured with image analysis software (Comet Imager V.2.0.0, MetaSystems, Altlussheim, Germany). The parameters for DNA damage analysis include percentage of DNA in comet tail (% DNA) and olive tail moment (OTM). Fifty comets per slide from each animal were counted to quantify the DNA damage.
Transmission electron microscopy
For electron microscopy, the liver specimens were cut into 1 × 1 × 1 mm3 blocks and fixed with 2.5% gluteraldehyde in the phosphate buffer. After washing in phosphate buffer, the specimens were fixed with 1.0% osmium tetroxide, dehydrated with acetone and substituted with Spur’s embedding media. Ultrathin sections were taken using ultramicrotome, placed over copper grid further stained with uranyl acetate and observed for HSC on transmission electron microscope (model TF-20; FEI, Hillsboro, Oregon, USA).
Immunohistochemistry
Liver sections were deparafinized with xylene, followed by antigen retrieval by heating in citrate buffer at 95°C for 30 min. The mouse polyclonal primary antibodies were of anti-α-SMA (1:50), and polyvalent biotinylated goat anti-mouse secondary antibody and streptavidin–horseradish peroxidase (HRP) system was used to amplify the signals, followed by detection with diaminobenzidine as a chromogen. Slides were counterstained with haematoxylin, dehydrated with alcohols and xylene and mounted using DPX.
Measurement of protein expression by Western blot
Then, 100 mg of the liver sample was homogenized in 1 mL radioimmunoprecipitation assay buffer. After homogenization, the sample is kept for 30 min in the ice then sonicated for three times. After sonication, the samples were centrifuged and the supernatant was collected. Proteins were separated by sodium dodecyl sulphate–polyacrylamide gel electrophoresis and transferred onto nitrocellulose membrane, and immunoblot analysis was performed using the anti-matrix metalloproteinase-2 (MMP-2) rabbit polyclonal (1:1000), anti-actin rabbit polyclonal (1:1000) and HRP-conjugated secondary antibodies anti-rabbit (Santa Cruz, California, USA). Protein signal was detected using enhanced chemiluminescence and quantified with the help of Imagequant TL software (Imagequant 350, GE Healthcare, Hong Kong, China).
Statistical analysis
Results were shown as mean ± SEM for each group. Statistical analysis was performed using Jandel Sigma Stat (Version 3.5, Systat Software, San Jose, CA) statistical software.For multiple comparisons, one-way analysis of variance (ANOVA) was used. In case, ANOVA showed significant differences, post hoc analysis was performed with Tukey’s test. The value of p < 0.05 was considered to be statistically significant.
Results
Effect of VPA and TAA alone as well as co-treatment on the morphological changes, body weight and liver weight
TAA treatment for 6 weeks caused fibrotic marks with loss of native glossy appearance of the liver, whilst VPA treatment significantly subdued these morphological changes as compared to respective control. However, VPA alone did not show any morphological changes and appeared normal as compared to the control (Figure 1(a)). Exposure of TAA alone as well as co-treatment with VPA for 6 weeks showed significant reduction in change in body weight as compared to control group. However, there was no significant decrease in change in body weight in rats treated with VPA alone (Figure 1(b)). TAA treatment significantly increased the absolute and relative liver weight (liver index) as compared to control, whereas co-treatment of VPA and TAA significantly preclude the increase in the absolute and relative liver weight (Figure 1(c) and (d)).
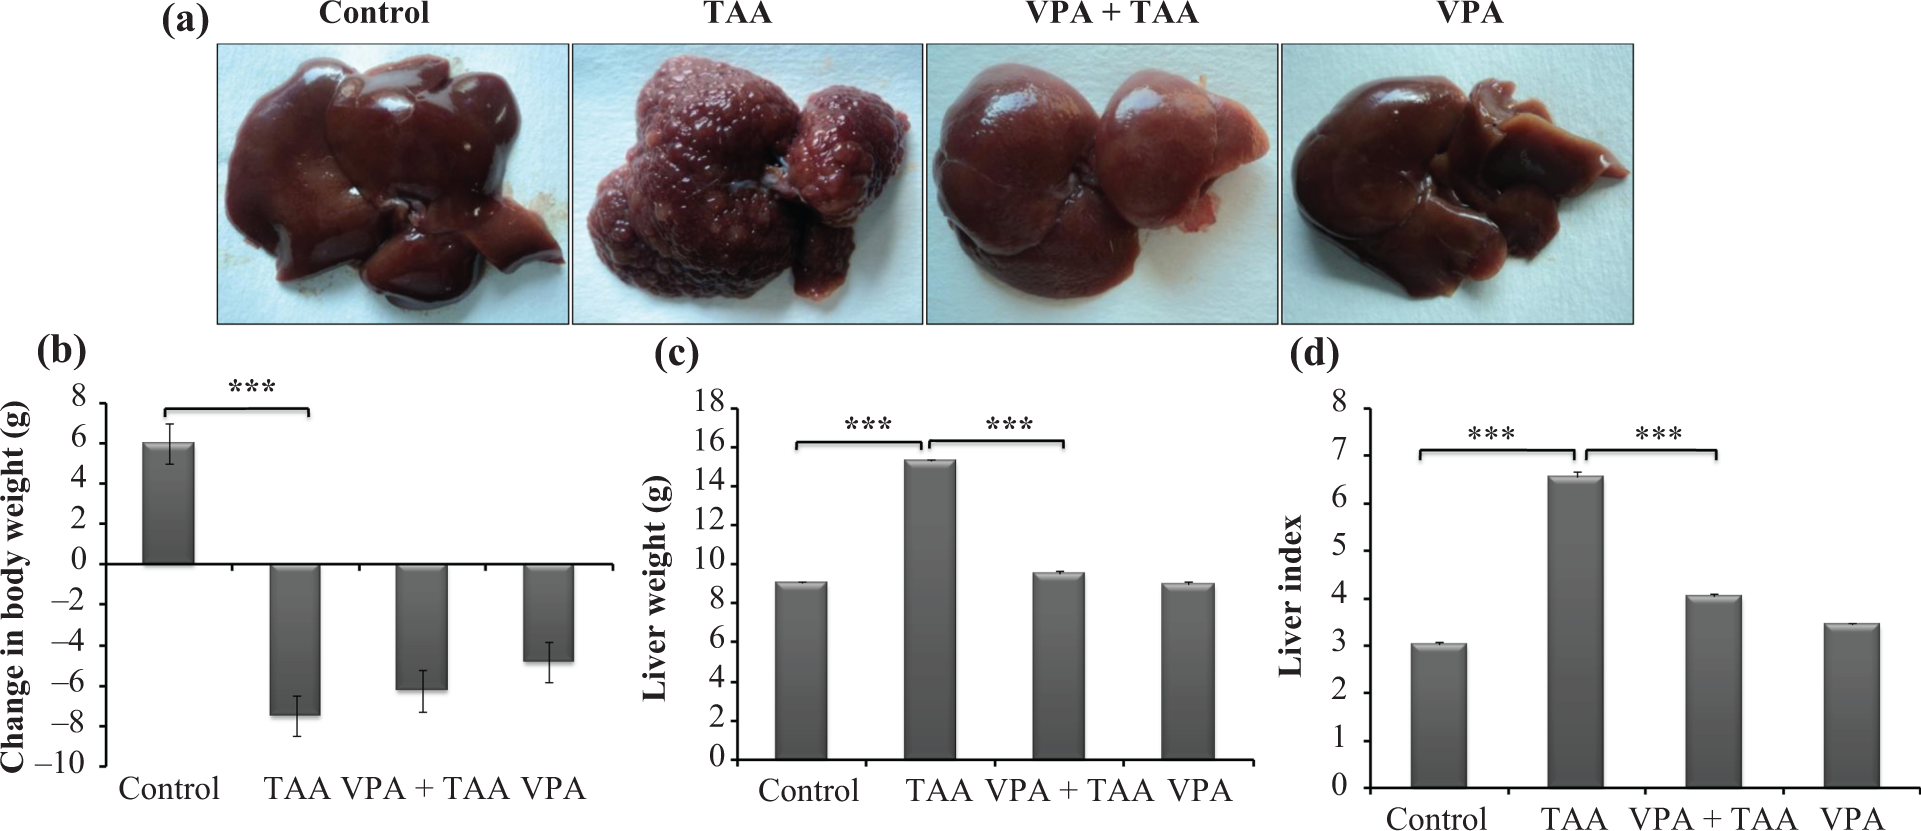
(a) Representative photographs show the liver morphology of vehicle control, TAA control, VPA + TAA and VPA control, respectively. (b) Effect of VPA co-treatment (VPA + TAA) on the change in body weight after 6 weeks of drug administration. (c, d) Effect of VPA and TAA co-treatment on the absolute and relative liver weights (liver index), respectively. All the values are expressed as mean ± SEM, n = 5, ***p < 0.001 versus respective control. TAA: thioacetamide; VPA: valproic acid.
Effect on TBARS (MDA) and GSH levels in the liver
TAA treatment led to the significant increase in the TBARS level as compared to control, which was decreased (not significant) by VPA co-treatment (VPA + TAA) in the liver as compared to respective control (Figure 2(a)). Moreover, TAA treatment significantly depleted the GSH level, whilst VPA co-treatment (VPA + TAA) did not restore the GSH level as compared to respective control (Figure 2(b)).

(a, b) Effect of VPA and TAA alone as well as co-treatment on the MDA and GSH levels in the liver after 6 weeks treatment, respectively. (c, d) Effect of VPA and TAA alone as well as co-treatment on plasma ALT and AST levels after 6 weeks of drug administration. All the values are expressed as mean ± SEM, n = 5, ***p < 0.001, **p < 0.01 and *p < 0.05 versus respective control. VPA: valproic acid; TAA: thioacetamide; MDA: malondialdehyde; GSH: glutathione; ALT: aspartate aminotransferase; AST: alanine aminotransferase.
Effect on the ALT and AST levels
Administration of TAA for 6 weeks led to significant increase in both ALT and AST levels as compared to control, whilst co-treatment of VPA results in significant reduction in both ALT and AST levels as compared to TAA control (Figure 2(c) and (d)). There is no significant change in ALT and AST levels for VPA alone treatment as compared to the control (Figure 2(c) and (d)).
Co-treatment of VPA prevents the HSC activation
HSC plays a fundamental role in the development of the hepatic fibrosis. HSCs were visualized using transmission electron microscopy (TEM). TAA treatment activates the HSC with myofibroblasts-like morphology as compared to control. Interestingly, co-treatment with VPA (VPA + TAA) significantly restored these changes (Figure 3(a)). Further, HSC activation is associated with enhanced expression of α-SMA; to ascertain this, immunohistochemistry (IHC) was performed to evaluate the α-SMA expression. IHC results indicated significant increase in the α-SMA expression by TAA treatment as compared to control, whereas co-treatment of VPA (VPA + TAA) reduced the expression of α-SMA as compared to TAA control (Figure 3(b)). No significant effect of VPA alone was observed on α-SMA expression as compared to control (Figure 3(b)).

Effect of VPA and TAA alone as well as co-treatment on the HSC activation. (a) Representative photomicrographs of HSC observed by TEM: (a′) normal control, (b′) TAA control, (c′) co-treatment of VPA (VPA + TAA) and (d) VPA control, respectively. Arrow indicated the fat droplets, which are rarely seen with change in the morphology of HSC. (b) Representative photomicrographs of immunohistochemistry of α-SMA in the liver of rat: (a′) normal control, (b′) TAA control, (c′) co-treatment of VPA (VPA + TAA) and (d) VPA control, respectively, in the magnification of ×400. The arrow indicating dark brown nuclei showed positive signals for α-SMA expression. (c) The quantitative evaluation of α-SMA expression is expressed as percentage of α-SMA positive cells. All the values are expressed as mean ± SEM, n = 5, ***p < 0.001 versus respective control. VPA: valproic acid; TAA: thioacetamide; HSC: hepatic stellate cell; TEM: transmission electron microscopy; α-SMA: α-smooth muscle actin.
Effect of VPA co-treatment on the histological alterations
The liver tissue was subjected for H&E staining to ensure the cellular modification by administration of TAA and VPA. Infiltration of inflammatory cells and collagen deposition as well as necrotic cells were observed in TAA control, whereas VPA treatment reduced collagen deposition and periportal inflammation as well as decreased the hepatic necrosis (Figure 4(a)). Further, the collagen deposition and fibrosis were evaluated using Sirius red staining and quantified using Image J software. Quantitative analysis of Sirius red staining revealed that TAA alone significantly increased the total fibrotic area as compared to control, whilst co-treatment with VPA decreased the fibrotic area as compared to respective control (Figure 4(b) and (c)).

(a) Representative photomicrographs of histological alterations in the liver treated with VPA and TTA alone as well as the combination for 6 weeks, stained with H&E (magnification 400×): (a′) vehicle control, (b′) TAA control, (c′) co-treatment of VPA (VPA + TAA) and (d′) VPA control. (b) Representative photomicrographs of the liver sections of rat showing the collagen deposition, stained with Sirius red (magnification ×400): (a′) vehicle control, (b′) TAA control, (c′) co-treatment of VPA (VPA + TAA) and (d′) VPA control. (c) The quantitative estimation of stained Sirius red (red colour/fibrotic area) showed significant increase in the total fibrotic area by the administration of TAA as compared to control. (d) Representative immunoblot shows the expression of MMP-2 in the liver, and β-actin is used as a loading control. Bar graph showed the quantitative analysis of MMP-2 expression. All the values are expressed as mean ± SEM, n = 5, ***p < 0.001 versus a′′vehicle control and b′′TAA control.
Effect of VPA co-treatment on MMP-2 expression
To substantiate the role of matrix protease in TAA-induced fibrosis, expression of MMP-2 was carried out by Western blot. TAA treatment significantly decreased the MMP-2 expression as compared to control, whereas VPA co-treatment (VPA + TAA) restored the MMP-2 expression almost to control animal (Figure 4(d)).
Effect of VPA co-treatment on the apoptosis and DNA damage
TAA administration triggers various apoptotic pathways leads to apoptosis of hepatocytes. To ascertain TAA-induced apoptosis in the liver, TUNEL assay was performed and results indicated that percentage of TUNEL positive cells was significantly increased in the liver of TAA-treated animals as compared to control. Interestingly, VPA co-treatment led to significant increase in the percentage of TUNEL positive cells as compared to TAA-treated animals (Figure 5). However, VPA alone did not induce apoptosis in the liver as compared to vehicle control. In the TUNEL assay, we found increased apoptotic cells in VPA co-treatment group, so to ascertain that this result comet assay was performed in single-cell suspension of the liver. Results of comet assay indicated that TAA has significant increase in the comet parameters, that is, DNA in tail and OTM as compared to control, whilst co-treatment with VPA further increased the DNA damage as compared to TAA control (Figure 6).

Representative photomicrograph shows apoptotic cells in different groups (green signal represents TUNEL positive cells). Bar graph shows the percentage of TUNEL positive cells in the liver sections of rat. All the values are expressed as mean ± SEM, n = 5, ***p < 0.001 versus respective control.
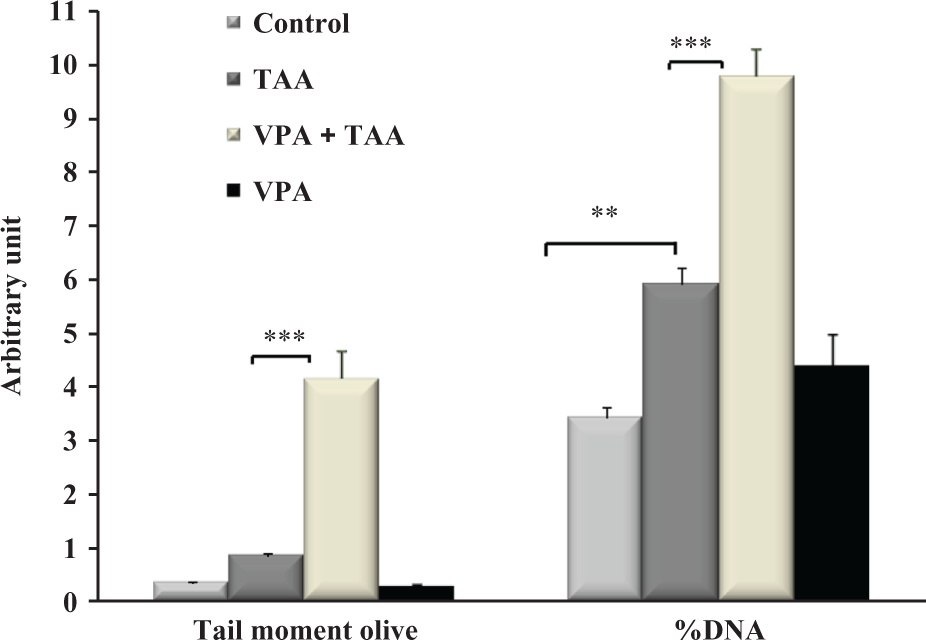
Effect of VPA and TAA alone as well as co-treatment on the DNA damage in the liver cells of rat after 6 weeks treatment evaluated by comet assay. All the values are expressed as mean ± SEM, n = 5, ***p < 0.001 and **p < 0.01 versus respective control.
Discussion
Present results demonstrated the anti-fibrotic effect of VPA in TAA-induced hepatic fibrosis by inactivation of HSC. TAA treatment significantly decreased the body weight, whilst VPA per se decreased the body weight, but not significantly, as compared to respective control. Reduction in the body weight by VPA treatment might be due to the GI disturbances as well as the development of local abdominal cramps. VPA induced the dose-dependent GI, discomforts and leads to abdominal cramps at the beginning of the treatment and then gradually disappeared with the progression of treatment. 17,19 TAA treatment led to significant increase in the liver weight, whereas VPA co-treatment significantly decreased the same. An increase in the liver weight might be due to the accumulation of collagen and other fibrotic components. Further, TAA treatment led to prominent changes in the appearance of the liver morphology such as pale red colouration with nodular surface, whilst VPA co-treatment restored the same and morphologically resembled very close to the vehicle and VPA-treated animals. TAA treatment led to significant elevation in the ALT and AST levels, whereas co-treatment with VPA significantly decreased the ALT and AST levels, which indicated the protective role of VPA in the TAA-induced liver damage. Moreover, TAA significantly increased the oxidative stress, whilst VPA co-treatment failed to reduce the increased oxidative stress, which indicated that VPA co-treatment ameliorates the hepatic fibrosis through some other mechanism. Further, effect of VPA on oxidative stress is still equivocal both in the clinical and experimental studies. 31 Histopathological evaluations showed degeneration, necrosis and infiltration of inflammatory cells and collagen deposition in the TAA-exposed animals, which are the characteristic features of hepatic fibrosis. VPA co-treatment significantly decreased the infiltration of inflammatory cells, collagen deposition as well as histological alterations. Further, Sirius red staining revealed that VPA co-treatment significantly decreased the collagen deposition in portal areas as compared to TAA control, which is further substantiated by the quantitative evaluation of total fibrotic area. It has already been reported that HDAC inhibitors decreased the collagen deposition and fibrosis in the chemical-induced as well as pathological conditions. 10,15,16 Recently, VPA has been reported to decrease the inflammation in the chemical-induced model as well as ameliorates the burns in experimental models. 32,33 It can be emphasized that the above mechanisms might be responsible for the anti-fibrotic effect of VPA in the present investigation.
The liver injury activates the HSC, which plays one of the crucial roles in the development of hepatic fibrosis and subsequent loss of vitamin A and lipid droplets and finally morphologically resembled to star-shaped structure. 34 The HSC activation was observed by TEM and results indicated that TAA treatment significantly altered the morphology of the HSC as well as the loss of lipid droplets around the cell. Co-treatment with VPA (VPA + TAA) restored the TAA-induced morphological changes in the HSC as well as number of lipid droplets. It has been reported that HDAC inhibitor maintains a quiescent HSC phenotype in vitro 8,15 and class I HDAC inhibitors including VPA inhibit the HSC activation in CCl4-induced hepatic fibrosis in mice. 10,25,35 Further, HSC activation leads to increase in the expression of α-SMA in rodents and humans, which leads to fibrosis. 36 In the present study, VPA co-treatment significantly decreased the TAA-induced overexpression of α-SMA as revealed by 3,3'-diaminobenzidine positive cells around the central vein and the sinusoidal space as compared to respective control. Both TEM and α-SMA results confirmed that VPA treatment prevents the HSC activation, which may be one of the plausible mechanisms responsible for the anti-fibrotic effect of VPA. Additionally, expression of MMP-2 was evaluated by Western blot, and it was observed that TAA significantly decreased the expression of MMP-2 as compared to control, whereas VPA co-treatment restored the normal level of MMP-2 expression. Further, MMP-2 digests type I, II, and III collagen, thereby reduces the ECM. 37 Thus, increased expression of MMP-2 in the co-treatment regimens may be another mechanism associated with the anti-fibrotic effect of VPA in the present experiment. Recent anti-fibrotic drug research focuses on either the prevention/inhibition of the HSC activation and/or the stimulation of apoptosis of the activated HSC. To investigate the influence of VPA and TAA on apoptosis in the liver, TUNEL assay was performed. Interestingly, we found that VPA co-treatment significantly increased the DNA damage and TUNEL positive cells as compared to TAA control. It has already been reported that TAA induced apoptosis in the liver. 38,39 Moreover, increased apoptosis by VPA co-treatment in the present experiment as revealed by TUNEL positive cells might be due to selective apoptosis of the activated HSC, which ultimately decreased the ECM deposition and thereby hepatic fibrosis. Further, HDAC inhibitors induced apoptosis in various tissues, but the response varies in normal and diseased cells. 40 Moreover, activated HSC has expressed the tumour necrosis factor-related apoptosis-inducing ligand (TRAIL) and undergoes TRAIL-mediated apoptosis. 41 Further, several studies indicated that HDAC inhibitors induce chromatin modification thereby potentiating the TRAIL-mediated apoptosis (Figure 7). 42 –46 Therefore, the increased TUNEL positive cells by VPA co-treatment might be due to the TRAIL-mediated selective apoptosis of the activated HSCs. Additionally, comet assay results showed that VPA co-treatment induced DNA damage, which might be due to TRAIL-mediated apoptosis in the activated HSCs.
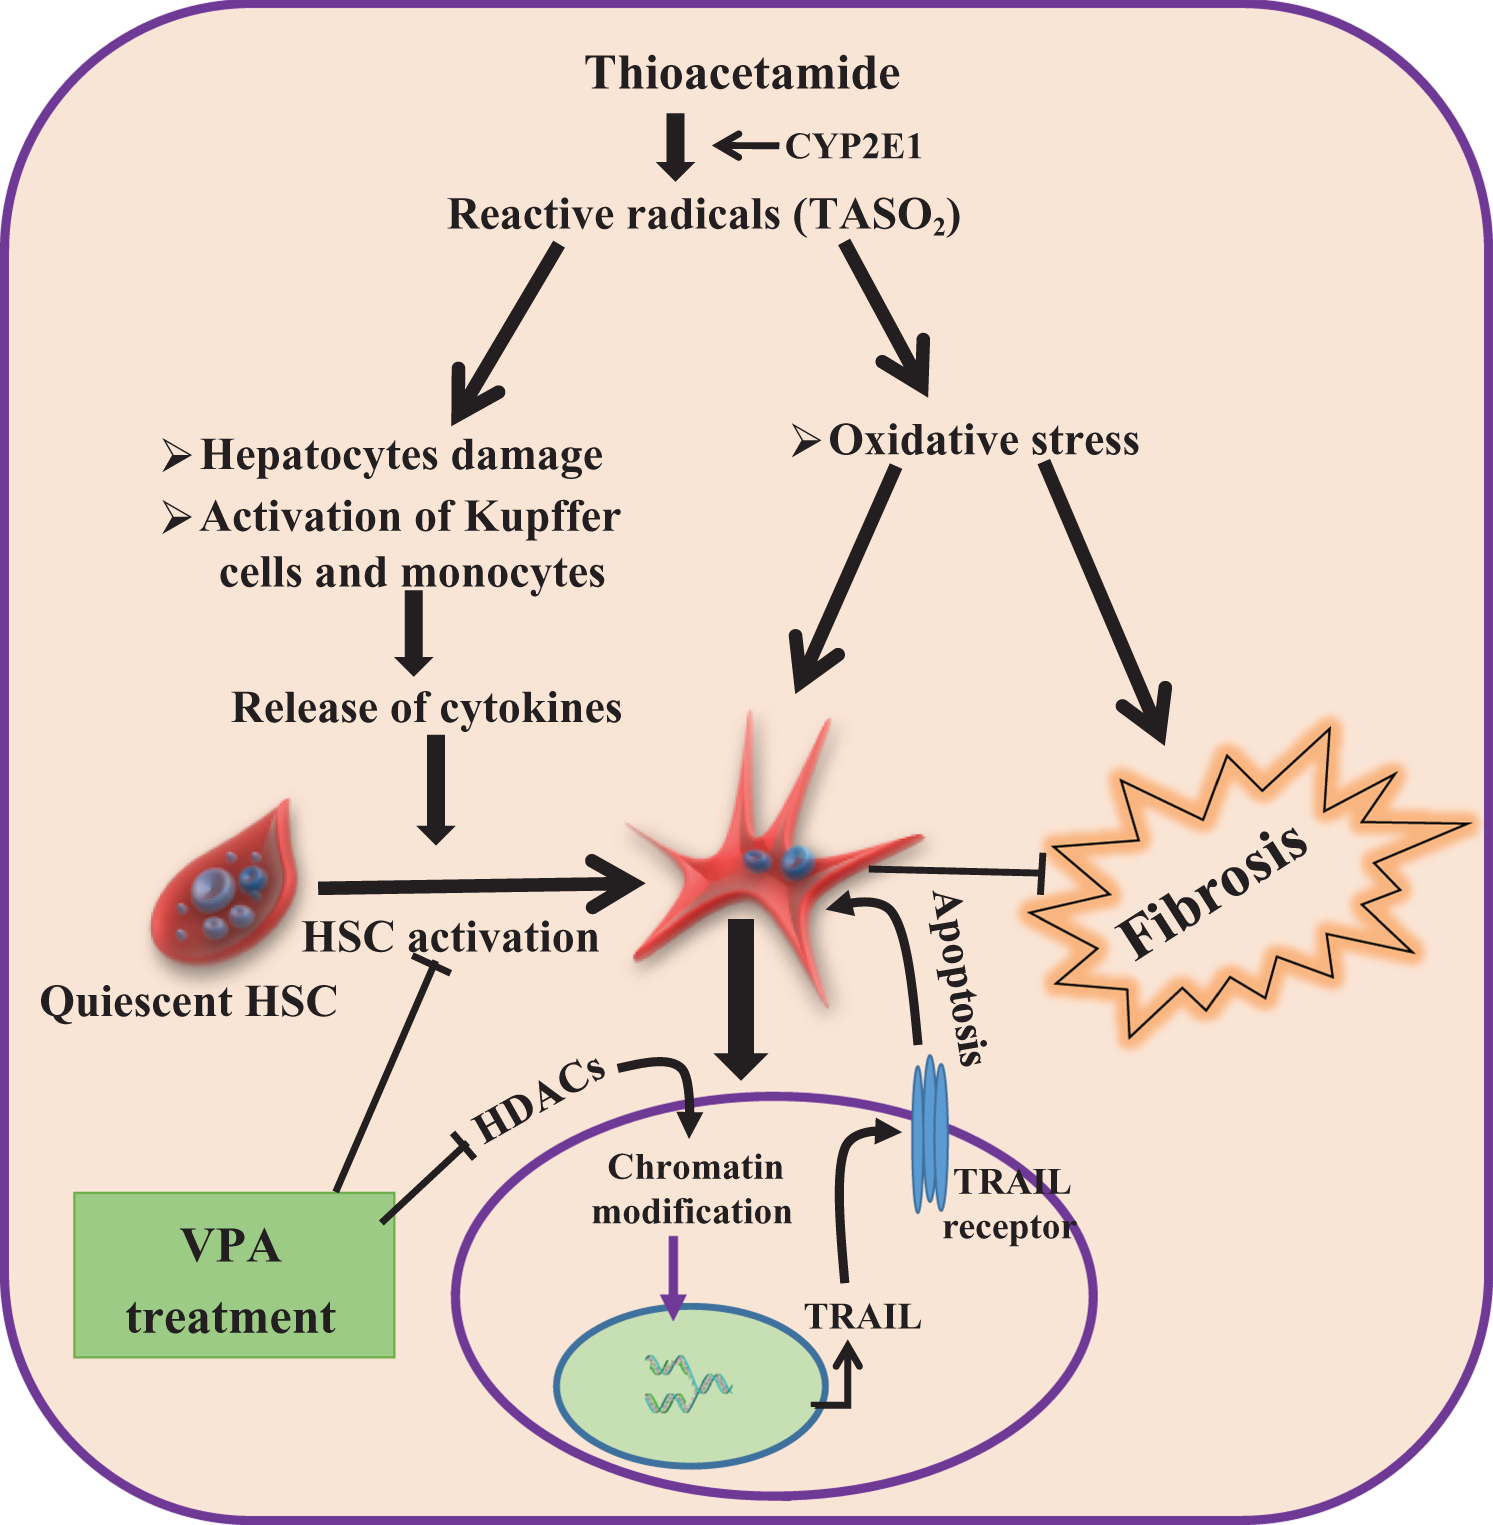
Schematic illustration of the involvement and activation of HSC in TAA-induced hepatic fibrosis. Reactive oxygen species induced by TAA led hepatic damage, which leads to release of various mediators and finally activates the HSCs and fibrogenesis. VPA treatment inhibited the activation of HSC cells and modulates the chromatin structure, which leads to increase in the expression of TRAIL receptors on the activated HSC thereby induced the selective apoptosis in the activated HSC and ultimately ameliorates the collagen deposition and fibrosis.
In conclusion, VPA treatment significantly decreased the TAA-induced liver damage and fibrosis in rats. Mechanistically, the present results clearly demonstrated that VPA treatment inhibited the activation of HSC and/or enhanced the apoptosis of the activated HSC in TAA-induced hepatic fibrosis. More studies are needed to delineate the exact molecular mechanisms of VPA for its anti-fibrotic effect and the selective induction of apoptosis in the activated HSC, before any further clinical investigation.
Footnotes
Authors’ note
Authors JSA and SK contributed equally in this manuscript.
Conflict of interest
The authors declared no conflicts of interest.
Funding
We wish to acknowledge the financial assistance received from National Institute of Pharmaceutical Education and Research (NIPER), Mohali, Punjab, India, to undertake the present study.