
Abstract
Sinapic acid (SA) is a naturally occurring phenolic acid found in various herbal plants which is attributed with numerous pharmacological properties. This study was aimed to investigate the chemopreventive effect of SA on 1,2-dimethylhydrazine (DMH)-induced rat colon carcinogenesis. Rats were treated with DMH injections (20 mg kg−1 bodyweight (b.w.) subcutaneously once a week for the first 4 consecutive weeks and SA (20, 40 and 80 mg kg−1 b.w.) post orally for 16 weeks. At the end of the 16-week experimental period, all the rats were killed, and the tissues were evaluated biochemically. Our results reveal that DMH alone treatment decreased the levels/activities of lipid peroxidation by-products such as thiobarbituric acid reactive substances, conjugated dienes and antioxidants such as superoxide dismutase, catalase, glutathione reductase, glutathione peroxidase and reduced glutathione in the intestine and colonic tissues which were reversed on supplementation with SA. Moreover, the activities of drug-metabolizing enzymes of phase I (cytochrome P450 and P4502E1) were enhanced and those of phase II (glutathione-S-transferase, DT-diaphorase and uridine diphosphate glucuronosyl transferase) were diminished in the liver and colonic mucosa of DMH alone-treated rats and were reversed on supplementation with SA. All the above changes were supported by the histopathological observations of the rat liver and colon. These findings suggest that SA at the dose of 40 mg kg−1 b.w. was the most effective dose against DMH-induced colon carcinogenesis, and thus, SA could be used as a potential chemopreventive agent.
Introduction
Colon cancer is one amongst the leading causes of cancer-related morbidity and mortality worldwide. It is a multistep process involving genetic and epigenetic changes that provide tumour cells with a selective advantage to expand the clones. 1 Genetic and environmental interactions as well as the consumption of high-fat diet plays a crucial role in the etiology of colon cancer. 2 Lifestyle habits like physical inactivity, stress, alcohol consumption and intake of high animal fat/red meat significantly increases the risk of colon cancer. A recent report showed that out of 141,210 cases nearly 49,380 cases had died, which makes colon cancer the third most common cause of cancer deaths in the United States. 3 The colon cancer incidence has been higher in Western countries and has rapidly increased in the developing countries. Moreover, in Asia, the colon cancer incidence varies uniformly, ranging low in South Asian countries and high in all developed Asian countries. 4 In India, statistically significant increase was noticed in Chennai, Bangalore and Delhi registries for cancer of the colon. 5
The pathogenesis and prevention of colon cancer is most frequently investigated in a chemically induced rat colon carcinogenesis model. We have used 1,2 dimethylhydrazine (DMH) to induce rat colon carcinogenesis, as this model mimics human colonic epithelial neoplasms in histology, morphology and anatomy. 6 The procarcinogen, DMH is an alkylating and mutagenic agent, which is metabolically activated to a carcinogen in the liver. 7 DMH is not only metabolized in the liver but also to a certain extent in the colon by colonocytes or colonic epithelial cells. 8 It is oxidized to azomethane, and inturn to azoxymethane, which is hydroxylated to methylazoxymethanol (MAM) catalysed by the enzyme cytochrome P4502E1 (CYP2E1). Finally, MAM is transformed to methyldiazonium ion that is responsible for the alkylation of DNA by binding to methyl or alkyl groups of guanine residues causing G to A transition mutation in the colonic epithelium. The formation of methyl free radicals generate hydroxyl radical or hydrogen peroxide (H2O2; reactive oxygen species (ROS)) in the presence of metal ions. 9 The overproduction of ROS induces significant oxidative damage in the cell structure and macromolecules such as the DNA, RNA, protein and lipids. 10
Colon cancer in humans is associated with pathological consequences of persistent oxidative stress and lipid peroxidation (LPO). Unsaturated lipids are prone to oxidation and the metabolites of LPO generate the promutagenic exocyclic DNA adducts. 11 Antioxidant and xenobiotic metabolizing enzymes represent two major defence mechanisms against LPO and xenobiotic toxicity. The xenobiotic metabolizing enzymes consists of phase I carcinogen-activating enzymes and phase II detoxifying enzymes, which play a key role in regulating oxidative damage, toxic, mutagenic and neoplastic effects of chemical carcinogens. 12
Several preclinical and human intervention studies exhibit the success of chemoprevention in reducing the burden of cancer. Antioxidants, vitamins and numerous non-nutritive substances present in plant-based diet are attributed as promising chemopreventive agents. In general, phenolic compounds show excellent antioxidant and chemopreventive properties in several experimental studies. Sinapic acid (SA) is a naturally occurring phenolic acid found in various herbal and edible plants such as cereals, nuts, oilseeds and berries. 13 It is a member of the phenylpropanoid family (4-hydroxy-3,5-dimethoxy cinnamic acid) and is known to possess several pharmacological properties such as anti-inflammatory, 14 antioxidant, 15 peroxynitrate scavenging 16 and neuroprotective effects (Figure 1). 17 Our present study was proposed to determine the dose-dependant chemopreventive effects of SA on DMH-induced rat colon carcinogenesis.
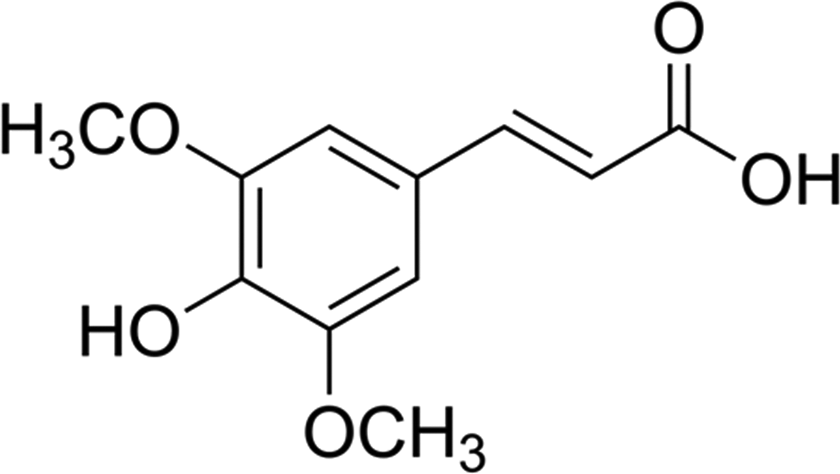
Structure of SA. SA: sinapic acid.
Materials and methods
Chemicals
SA and DMH were purchased from Sigma Chemicals (St Louis, Missouri, USA). All other chemicals and reagents used were of analytical grade, purchased from HiMedia Private Limited (Mumbai, Maharashtra, India).
Animals and diet
A total of 36 male albino Wistar rats weighing 120–150 g (5 weeks old) were obtained from the Central Animal House, Rajah Muthiah Medical College, Annamalai University, Annamalainagar, Tamil Nadu, India. Animals were taken care of according to the established guidelines approved by the ethics committee of Annamalai University in accordance with the Indian National Law on Animal Care and Use (Reg. No.160/1999/CPCSEA/927). The rats were housed four per cage in polypropylene cages with a hygienic bed of husk in a specific pathogen free animal room under controlled conditions of 12-h dark/12-h light cycle, temperature of 25 ± 2°C and relative humidity of 50 ± 10%. Commercial pellet diet containing 42 g fat kg−1 (Hindustan Lever Ltd, Mumbai, Maharashtra, India) was powdered and mixed with 158 g of peanut oil per kilogram of feed, making a total of 20% fat in the modified pellet diet. This modified pellet diet and water were fed ad libitum throughout the experimental period of 16 weeks.
Experimental design
The rats were assorted into six groups of six animals each and different treatment groups were maintained on modified pellet diet for 16 weeks as follows
Group 1: normal control rats;
Group 2: rats received SA (80 mg kg−1 bodyweight (b.w.)) postorally every day throughout the 16-week experimental period and served as SA control;
Group 3: rats received subcutaneous injections of DMH (20 mg kg−1 b.w.) in the right thigh, at the dose of once a week for the first 4 weeks of the experiment (4 injections) and served as DMH control;
Group 4: rats received subcutaneous injections of DMH as in group 3 and treated with SA (20 mg kg−1 b.w.) postorally every day from the day of the carcinogen treatment till the end of the 16th week;
Group 5: rats received subcutaneous injections of DMH as in group 3 and treated with SA (40 mg kg−1 b.w.) postorally every day from the day of the carcinogen treatment till the end of the 16th week;
Group 6: rats received subcutaneous injections of DMH as in group 3 and treated with SA (80 mg kg−1 b.w.) postorally every day from the day of the carcinogen treatment till the end of the 16th week
SA preparation
SA was suspended in 0.3% carboxymethyl cellulose, and each rat received any one of the following as the daily dose (20, 40 or 80 mg kg−1 b.w.). SA was administered orally by intragastric intubation every day.
Carcinogen administration
All the animals in groups 3–6 received DMH (20 mg kg−1 b.w.) injections once a week subcutaneously for the first 4 weeks. DMH was dissolved in distilled water containing 1 mM ethylenediaminetetraacetic acid (EDTA), and the pH was adjusted to 6.5 with 1 mM sodium hydroxide (NaOH).
Body weight changes
The body weights of the rats from different treatment groups were measured once every week, throughout the experimental period and finally before killing.
Macroscopic measurement of polyps incidence
The rat colons were removed at the end of the 16-week experiment period. Colons were flushed with potassium phosphate-buffered saline (0.1 M, pH 7.2), and polyps were counted through visual macroscopic examination and later verified by histopathological evaluation.
Tissue homogenate preparation
Animals in different treatment groups were killed, and liver, intestine, caecum and proximal and distal colonic tissues were dissected out and washed with saline. The tissues were minced and homogenized with three volumes (w/v) of the appropriate buffer using a Potter–Elvehjam homogenizer with a Teflon pestle and centrifuged at 12,000g for 20 min at 4°C. The supernatant was used for biochemical estimations. Cytosolic and microsomal fractionation was carried out by the method of Schladt et al. 18 Briefly, the liver and colon mucosal scrapings were homogenised in 10 mM tris(hydroxymethyl)aminomethane (Tris)–hydrochloric acid (HCl) buffer (pH 7.4) containing 0.25 M sucrose, centrifuged at 9000g for 20 min and the supernatant was collected. The collected supernatant was ultracentrifuged at 100,000g for 20 min, and the clear cytosolic fractions obtained were promptly assayed for the activities of phase II enzymes. The pellet after centrifugation at 100,000g was resuspended in ice-cold 0.15 M Tris–potassium chloride (KCl) buffer (pH 7.4) and recentrifuged for 60 min at 100,000g. The microsomal pellet was resuspended in homogenisation buffer equivalent to half of the original buffer and was used for the assay of phase I enzymes.
Biochemical estimations
Estimation of LPO markers
LPO as evidenced by the formation of thiobarbituric acid reactive substances (TBARS) was estimated by the method described by Ohkawa et al. 19 To 0.2 mL of tissue homogenate, 0.2 mL of 8.1% sodium dodecylsulphate, 1.5 mL of 20% acetic acid and 1.5 mL of 0.8% TBA were added. The mixture was made up to 4 mL with distilled water and then heated in a boiling water bath at 95°C for 60 min. After cooling, 1 mL water and 5 mL n-butanol/pyridine mixture were added and shaken vigorously. After centrifugation at 600g for 10 min, the pink-coloured chromogen formed by the reaction of 2-TBA with the breakdown products of LPO was read at 535 nm. Values are expressed in millimoles per milligram tissue.
Conjugated dienes (CDs) in the tissue homogenate was estimated by the method described by Rao and Recknagel. 20 To 1 mL of tissue homogenate, 5 mL of chloroform–methanol reagent was added, mixed thoroughly and centrifuged at 160g for 5 min. To this, 1.5 mL of cyclohexane was added and the absorbance was read at 232 nm. Values are expressed in millimoles per milligram tissue.
Determination of SOD and CAT activities
Superoxide dismutase (SOD, EC 1.15.1.1) was assayed by the method followed by Kakkar et al. 21 The assay mixture in a total volume of 3 mL contained 1.2 mL of sodium pyrophosphate buffer, 0.1 mL of phenazine methosulphate, 0.3 mL of nitroblue tetrazolium (NBT) and 0.5 mL of enzyme preparation. The reaction was started by the addition of 0.2 mL of nicotinamide adenine dinucleotide (NADH). After incubation at 30°C for 90 s, the reaction was stopped by the addition of 1 mL glacial acetic acid. The reaction mixture was stirred vigorously and shaken with 4 mL of n-butanol. The coloured chromogen formed by 50% inhibition of the formation of NADH–phenazine methosulphate nitroblue tetrazolium formazan was read at 530 nm. One unit of SOD activity is defined as the amount of enzyme required for 50% inhibition of NBT reduction per minute per milligram protein.
Catalase (CAT, EC 1.11.16) activity was assayed by the method described by Sinha. 22 The reaction was started by the addition of 0.4 mL of H2O2 to the reaction mixture containing 1 mL of phosphate buffer and 0.1 mL of enzyme solution. The reaction was stopped at 30 s by the addition of 2 mL dichromate acetic acid reagent. The tubes were kept in a boiling water bath for 10 min and cooled. The utilisation of H2O2 by the enzyme was read at 620 nm. Values are expressed in micromoles of H2O2 utilized per minute per milligram protein.
Determination of the levels/activities of GSH and GSH-dependent enzymes
Reduced glutathione (GSH) content was measured by the method described by Ellman. 23 To 0.5 ml of sample, 2 ml of 5% trichloroacetic acid (TCA) was added to precipitate the proteins. After centrifugation, to 1 mL of supernatant, 3 mL of 0.2 M phosphate buffer and 0.5 ml of Ellman’s reagent were added. The yellow colour developed was read in a spectrophotometer at 412 nm. A series of standards (20–100 µg) were treated in a similar manner along with a blank containing 1 ml buffer. Values are expressed in millimoles per milligram tissue.
Glutathione peroxidase (GPx, E.C. 1.11.1.9) activity was assayed by the method followed by Rotruck et al. 24 To 0.2 ml of Tris–HCl buffer, 0.2 ml EDTA, 0.1 mL sodium azide and 0.5 ml tissue homogenate were mixed together. To this mixture, 0.2 ml GSH followed by 0.1 ml H2O2 were added. The contents were mixed well and incubated at 37°C for 10 min along with a control containing all the reagents except the sample. After 10 min, the reaction was arrested by the addition of 0.5 mL of 10% TCA. The contents were centrifuged at low speed, and the supernatant was assayed for GSH by the method followed by Ellman. Values are expressed in micromoles of GSH utilized per minute per milligram protein.
Glutathione reductase (GR, E.C. 1.6.4.2) activity was assayed by the method described by Carlberg and Mannervik. 25 To 2 ml phosphate buffer, 0.1 ml tissue homogenate, 0.1 ml flavin adenine dinucleotide (FAD+), and 0.5 ml EDTA solution were taken in a test tube. A blank was set-up using all the reagents except FAD+. The tubes were incubated at 37°C for 15 min followed by the addition of 0.1 m of nicotinamide adenine dinucleotide phosphate (NADPH) solution to each tube. The reaction rate was then continuously monitored in a spectrophotometer at 340 nm for 5 min, and the linear absorbance change was measured. Values are expressed in micromoles of NADPH oxidised per minute per milligram protein.
Assay of microsomal CYP450 activity
The activity of cytochrome P450 (CYP450, E.C. 1.14.14.1) was measured by the method followed by Omura and Sato. 26 To 0.1 ml of microsomal sample (liver or colonic mucosa), 50 mM Tris–HCl containing 150 mM KCl and 10 mM magnesium chloride (MgCl2), pH 7.4, were added and gently bubbled for 1 min. The sample was then divided equally between two cuvettes and allowed to stand for 3–5 min. The baseline absorbance was recorded between 400 and 500 nm. Few milligrams of sodium dithionate were added to the contents in the sample cuvette, and the resulting spectrum was recorded between 400 and 500 nm. The CYP450 content was determined from the spectrum using the molar extinction coefficient of 104 mM−1 cm−1 . Values are expressed in micromoles per milligram protein.
Assay of microsomal CYP2E1 activity
The activity of CYP2E1 (E.C. 1.14.13.n7) was assayed by the method described by Watt et al. 27 The assay mixture contained 0.2 mL of microsomal sample (liver or colonic mucosa), 40 mM p-nitrophenol and 0.1 M phosphate buffer. The reaction was initiated by the addition of 10 mM of NADPH and incubated at 37°C for 60 min. The reaction was stopped with 20% TCA and centrifuged at 160g for 5 min, then 10 mM NaOH was added to the supernatant and the absorbance was measured at 450 nm. Values are expressed in millimoles of p-nitrocatechol liberated per minute per milligram protein
Assay of cytosolic GST
The activity of glutathione-S-transferase (GST, E.C. 2.5.1.18) was assayed by the method followed by Habig et al. 28 To 1 mL phosphate buffer, 0.1 mL 1-chloro-2,4-dinitrobenzene (CDNB) and 0.1 mL of cytosolic sample (liver or colonic mucosa) were taken in a test tube. The volumes were adjusted to 2.9 mL with water and 30 mM of CDNB was added. The reaction mixture was pre-incubated at 37°C for 5 min, and the reaction was started by the addition of 0.1 mL of 30 mM GSH. The absorbance was followed for 5 min at 340 nm. A system devoid of enzyme served as the blank. The enzyme activity was calculated using the extinction coefficient of 9.6 mM−1 cm−1. Values are expressed in micromoles of CDNB–GSH conjugate formed per minute per milligram protein.
Assay of cytosolic DTD
The activity of DT-diaphorase (DTD, E.C. 1.6.99.2) was assayed by the method described by Ernster et al. 29 The reaction mixture contained the following in a final volume of 3 mL: 25 mM Tris–HCl; pH 7.4, 0.02 mL of 0.07% bovine serum albumin, 0.2 mM of NADPH, 0.01 mL of cytochrome C and an appropriate amount of the cytosolic sample (liver or colonic mucosa). The electron acceptor, 2,6-dichlorophenolindophenol (DCPIP) was added to initiate the reaction. The reduction of DCPIP was measured spectrophotometrically, and the absorbance was followed for 5 min at 600 nm. A system devoid of enzyme served as the blank, and the reagents along with dicumarol served as the control. The enzyme activity was calculated using the extinction coefficient of 21 mM−1 cm−1. Values are expressed in micromoles of DCPIP reduced per minute per milligram protein.
Assay of cytosolic UDP-glucuronyl transferase
The activity of uridine diphosphate-glucuronyl transferase (UDPGT, EC 2.4.1.17) was assayed by the method described by Isselbacher et al. 30 The incubation mixture containing 0.5 mL buffer, 0.2 mL Triton X-100, 50 μL MgCl2, 50 μL p-nitrophenol, 0.18 mL water and 0.1 mL enzyme were incubated at 37°C for 2 min. Then, 0.1 mL of UDP-glucuronic acid was added. The reaction was arrested at 0, 10 and 15 min with TCA and centrifuged. To 1 mL of the supernatant, 0.25 mL of NaOH was added and read at 450 nm using a spectrophotometer. Values are expressed in nanomoles per minute per milligram protein.
Estimation of total protein
The total protein content was measured by the method described by Lowry et al. 31 The proteins in the tissues were precipitated using 10% TCA and dissolved in 0.1 N NaOH. To various aliquots of the above solution, 4.5 mL of alkaline copper reagent was added, allowed to stand for 10 min and then 0.5 mL dilute Folin’s phenol reagent was added. The colour intensity was measured in a spectrophotometer at 660 nm. Values are expressed in milligram per gram tissue.
Histopathological study
For histopathological analysis, portion of the colon and liver tissues from different groups were fixed in 10% neutral-buffered formalin solution for at least 48 h, and the specimens were dehydrated in ascending grades of ethanol, cleared in xylene, embedded in paraffin wax, sectioned and processed by routine histological methods with haematoxylin and eosin (H&E) staining.
Statistical analysis
Values are expressed as mean ± SD. Data were analysed by one-way analysis of variance, and any significant difference amongst treatment groups was evaluated by Duncan’s multiple range test. The statistical significance was set at p < 0.05 for the entire test. All statistical evaluations were made using Statistical Package for Social Sciences (SPSS) version 11.0 software package (SPSS, Tokyo, Japan).
Results
Effect of SA and DMH on body weight and growth rate
The initial body weight of the rats in all the groups was comparable with each other. During the 16th week of the experimental period, various changes were observed in the body weight and growth rate of the rats (Table 1). The average body weight and growth rate of DMH alone-treated rats (group 3) maintained on high-fat diet was significantly (p < 0.05) low throughout the experimental period as compared to the control rats (groups 1 and 2). On supplementation with three different doses of SA (groups 4, 5, and 6) to DMH-treated rats, the body weight and growth rate were significantly elevated as compared to the DMH alone-treated rats (group 3). Moreover, DMH + SA supplementation at the dose of 40 mg kg−1 b.w. (group 5) showed a significantly (p < 0.05) enhanced body weight gain as compared to the other treatment groups (groups 4 and 6).
Effect of SA and DMH on the body weight changes and growth rate of the control and experimental rats.a

SA: sinapic acid; DMH: 1,2-dimethylhydrazine; b.w.: body weight; DMRT: Duncan’s multiple range test.
aValues are given as means ± SD of six group. The different superscript letters (b–e) are used to refer and distinguish the values of the different groups. Values not sharing a common superscript differ significantly at p < 0.05 using DMRT.
Effect of SA and DMH on polyps incidence
Table 2 shows the incidence of polyps which were 100% in DMH alone-treated rats. On supplementation with three different doses of SA (groups 4, 5 and 6), the incidence of polyps was significantly reduced as compared to the DMH alone-treated rats (group 3). The incidence of polyps in rats treated with DMH + SA at the dose of 40 mg kg−1 b.w. (group 5) was distinctly lower as compared to the other SA-supplemented groups (groups 4 and 6).
Effect of SA and DMH on the incidence of colonic polyps in the colon of the control and experimental rats.
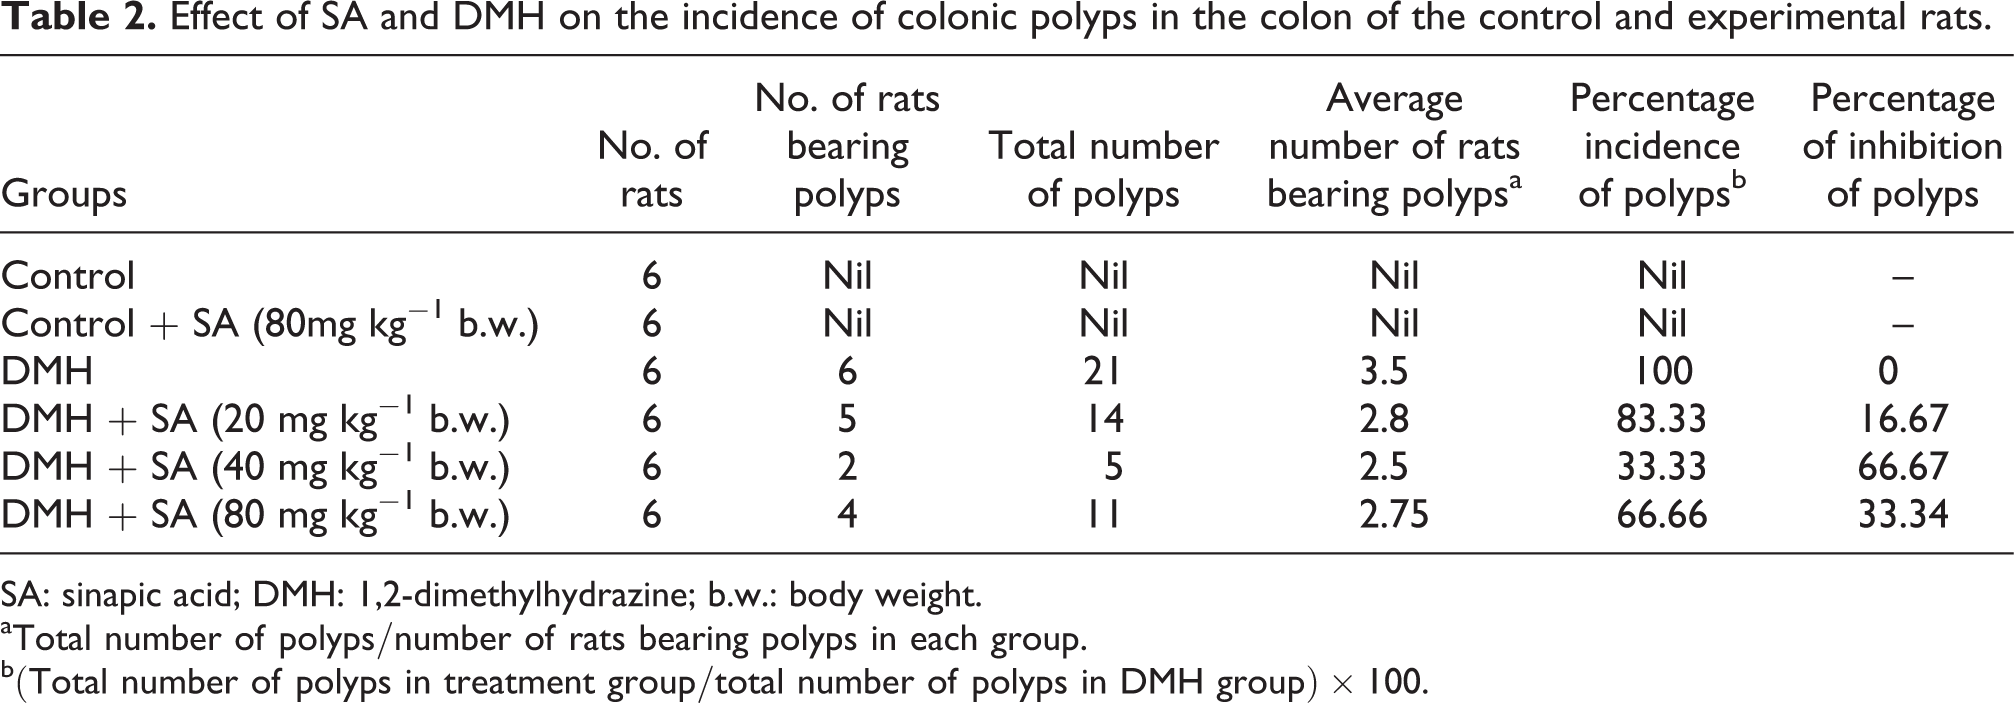
SA: sinapic acid; DMH: 1,2-dimethylhydrazine; b.w.: body weight.
a Total number of polyps/number of rats bearing polyps in each group.
b(Total number of polyps in treatment group/total number of polyps in DMH group) × 100.
Effect of SA and DMH on LPO by-products
Figures 2 and 3 show the effects of SA and DMH on the levels of LPO by-products in the tissues of control and experimental rats. The LPO by-products such as TBARS and CD levels were significantly (p < 0.05) increased in the liver and decreased in the intestine, caecum and colonic tissues of DMH alone-treated rats (group 3) as compared to the control rats (groups 1and 2). The levels of TBARS and CD were restored on supplementation with SA at the doses of 20, 40 and 80 mg kg−1 b.w. Maximum beneficial effect was observed when SA was supplemented at the dose of 40 mg kg−1 b.w. (group 5).

Effect of SA and DMH on tissue TBARS of the control and experimental rats. Data are presented as the means ± SD of six rats in each group. Values not sharing a common superscript letter (a–d) differ significantly at p < 0.05 using DMRT. SA: sinapic acid; DMH: 1,2-dimethylhydrazine; TBARS: thiobarbituric acid reactive substance; DMRT: Duncan’s multiple range test.

Effect of SA and DMH on tissue CD of the control and experimental rats. Data are presented as the means ± S.D. of six rats in each group. Values not sharing a common superscript letter (a–d) differ significantly at p < 0.05 using DMRT. SA: sinapic acid; DMH: 1,2-dimethylhydrazine; CD: conjugated dienes; DMRT: Duncan’s multiple range test.
Effect of SA and DMH on the activities of SOD and CAT
Figures 4 and 5 show the activity of SA on tissue enzymic antioxidants (SOD and CAT) of control and experimental rats. The activities of SOD and CAT were significantly (p < 0.05) decreased in the liver, intestine, caecum and colonic tissues of DMH alone (group 3)-treated rats as compared to the control (group 1 and 2). The activities of SOD and CAT were elevated on supplementation with SA at the doses of 20, 40 and 80 mg kg−1 b.w. Maximum beneficial effect was observed when SA was supplemented at the dose of 40 mg kg−1 b.w. (group 5).
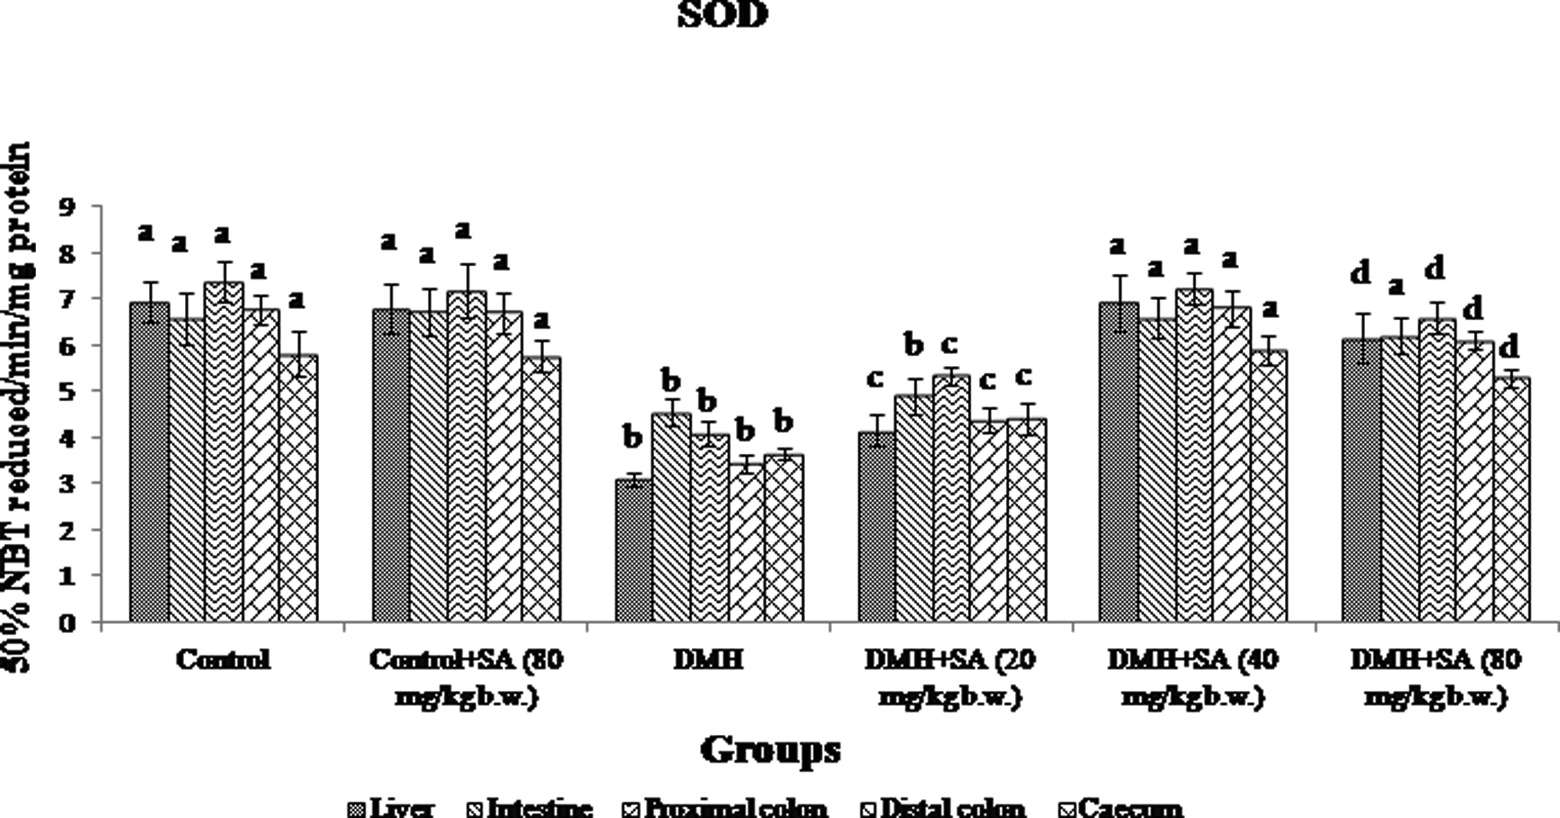
Effect of SA and DMH on tissue SOD of the control and experimental rats. Data are presented as the means ± SD of six rats in each group. Values not sharing a common superscript letter (a–d) differ significantly at p < 0.05 using DMRT. SA: sinapic acid; DMH: 1,2-dimethylhydrazine; SOD: superoxide dismutase; DMRT: Duncan’s multiple range test.

Effect of SA and DMH on tissue CAT of the control and experimental rats. Data are presented as the means ± SD of six rats in each group. Values not sharing a common superscript letter (a–d) differ significantly at p < 0.05 using DMRT. SA: sinapic acid; DMH: 1,2-dimethylhydrazine; CAT: catalase; DMRT: Duncan’s multiple range test.
Effect of SA and DMH on GSH and GSH-dependent enzymes
The activities of tissue GSH-dependent enzymes and the levels of GSH in the control and experimental rats are shown in Tables 3 and 4. The levels of GSH and the activities of GSH-dependent enzymes such as GPx and GR were significantly (p < 0.05) decreased in the liver, intestine, caecum and colonic tissues of DMH alone-treated rats (group 3) as compared to the control rats (group 1and 2). Supplementation with SA at different doses to DMH-exposed rats (groups 4, 5 and 6) significantly (p < 0.05) elevated the activities of GSH-dependent enzymes as compared to the DMH alone-treated rats (group 3), and a more pronounced effect was observed in rats supplemented with SA at the dose of 40 mg kg−1 b.w. (group 5).
Effect of SA and DMH on the tissues GPx and GR of the control and experimental rats.a
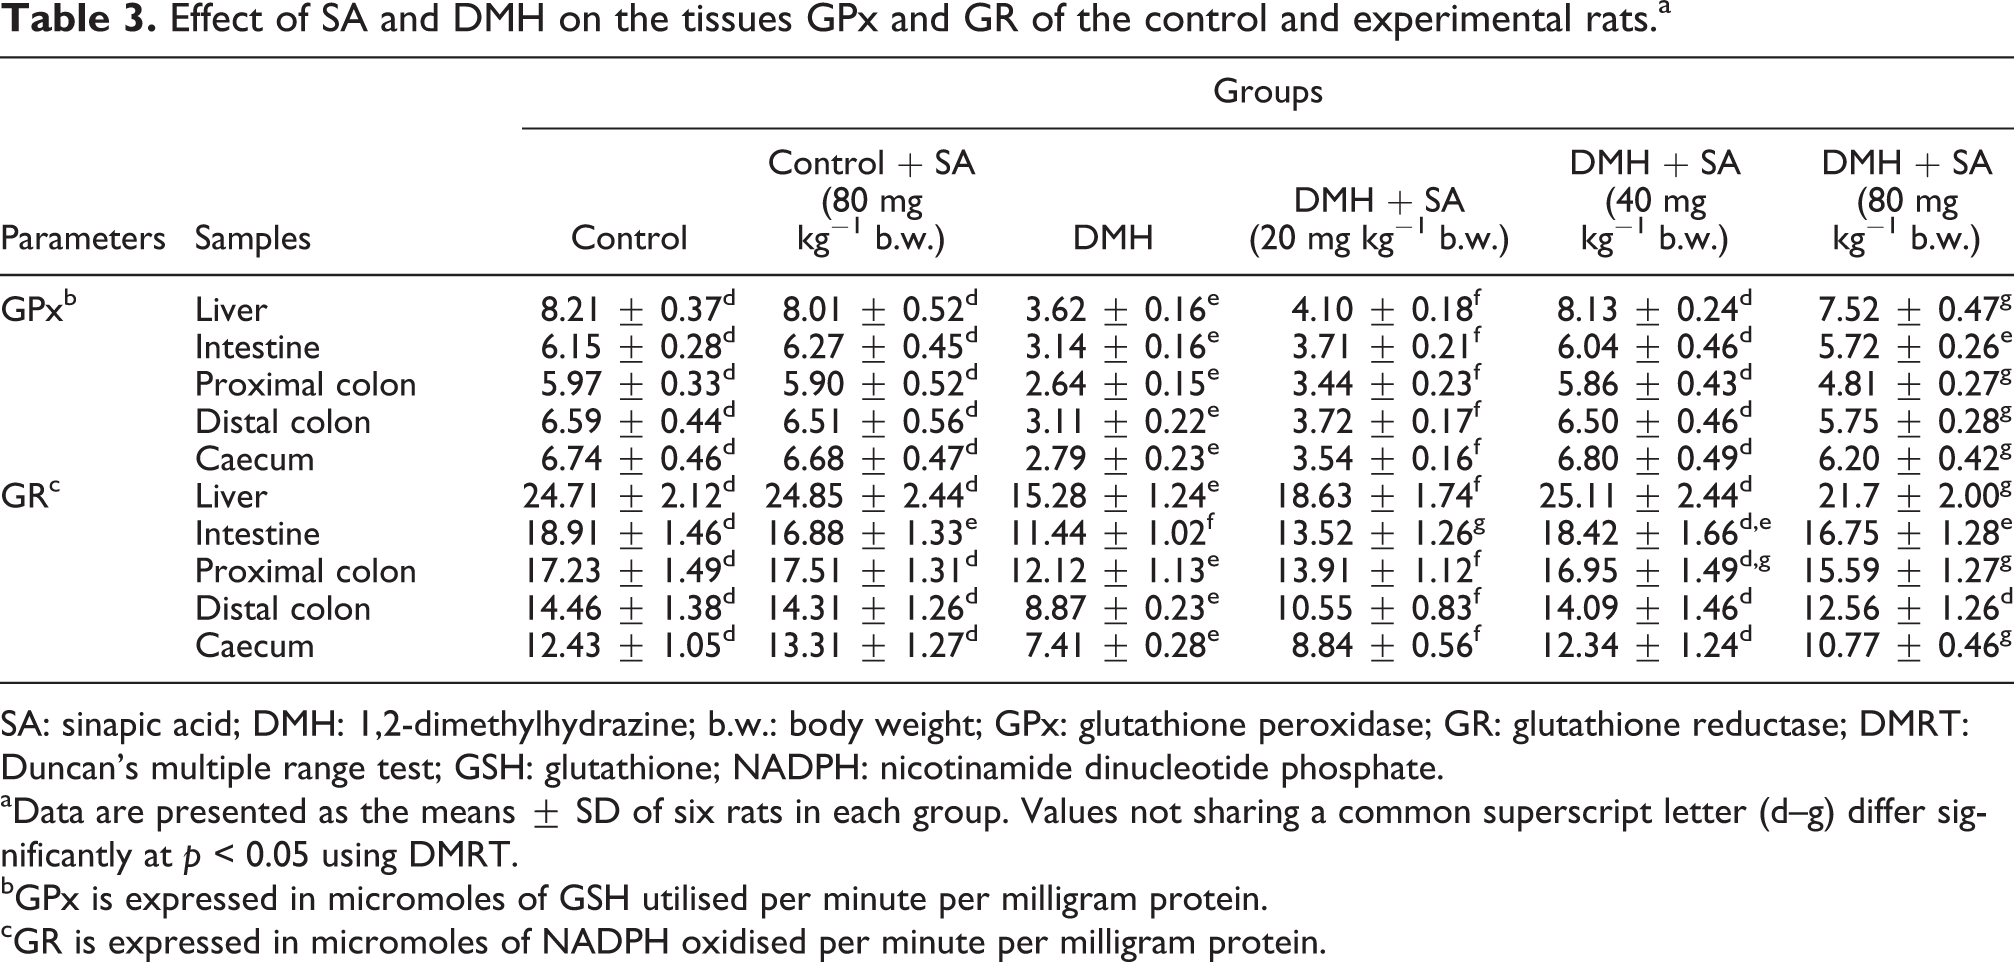
SA: sinapic acid; DMH: 1,2-dimethylhydrazine; b.w.: body weight; GPx: glutathione peroxidase; GR: glutathione reductase; DMRT: Duncan’s multiple range test; GSH: glutathione; NADPH: nicotinamide dinucleotide phosphate.
aData are presented as the means ± SD of six rats in each group. Values not sharing a common superscript letter (d–g) differ significantly at p < 0.05 using DMRT.
bGPx is expressed in micromoles of GSH utilised per minute per milligram protein.
cGR is expressed in micromoles of NADPH oxidised per minute per milligram protein.
Effect of SA and DMH on tissue GSH of control and experimental rats.a

SA: sinapic acid; DMH: 1,2-dimethylhydrazine; b.w.: body weight; GSH: glutathione; DMRT: Duncan’s multiple range test.
aData are presented as the means ± SD of six rats in each group. Values not sharing a common superscript letter (c–g) differ significantly at p < 0.05 using DMRT.
bGSH is expressed in millimoles per milligram tissue.
Effect of SA and DMH on phase I and phase II enzymes
The activities of DMH-metabolizing enzymes (CYP450 and CYP2E1) in the liver and colonic mucosa of control and experimental rats are shown in Table 5. CYP450 and CYP2E1 activities were significantly elevated in DMH alone-treated rats (group 3) as compared to the control (group 1 and 2). Supplementation with SA at the doses of 20, 40 and 80 mg kg−1 b.w. significantly (p < 0.05) decreased the activities of the DMH-metabolizing phase I enzymes. Maximum beneficial effect was observed when SA was supplemented at the dose of 40 mg kg−1 b.w. (group 5).
Effect of SA and DMH on tissue phase I and phase II enzymes of the control and experimental rats.a

SA: sinapic acid; DMH: 1,2-dimethylhydrazine; b.w.: body weight; GSH: glutathione; DMRT: Duncan’s multiple range test; CYP450: cytochrome P450; CYP4502E1: cytochrome P450 2E1; GST: glutathione-S-transferase; DTD: DT-diaphorase; UDPGT: uridine diphosphate glucuronyl transferase; CDNB: 1-chloro-2,4-dinitrobenzene.
aData are presented as the means ± SD of six rats in each group. Values not sharing a common superscript letter (g–k) differ significantly at p < 0.05 using DMRT.
bCYP450 is expressed in micromoles per milligram protein.
cCYP4502E1–is expressed in millimoles of p-nitrocatechol liberated per minute per milligram protein.
dGST is expressed in micromoles of CDNB–GSH conjugate formed per minute per milligram protein.
eDTD is expressed in micromoles of 2,6-dichlorophenolindophenol reduced per minute per milligram protein.
fUDPGT is expressed in nanomoles per minute per milligram protein.
The activities of phase II enzymes such as GST, DTD and UDPGT in the liver and colonic mucosa of the control and experimental rats are represented in Table 5. DMH alone-treated rats showed significant reduction in the GST, DTD and UDPGT activities as compared to the control rats (groups 1 and 2). On the other hand, supplementation with SA significantly (p < 0.05) increased the activities of GST, DTD and UDPGT as compared to the DMH alone-treated rats (group 3). Supplementation with SA at the medium dose of 40 mg kg−1 b.w. (group 5) showed a more pronounced effect as compared to the other two doses (groups 4 and 6).
Effect of SA on DMH induced alterations in the colon and liver histology
Figures 6 and 7(a) to (f) represent the histopathological findings of the rat colon and liver stained with H&E. Figure 6(a) and (b), that is, control and control + SA (80 mg kg−1 b.w.) rats, respectively, reveal normal colonic architecture with regular lining. DMH alone-treated rats (Figure 6(c)) show loss of normal architecture with prominent lymphoid aggregates, dysplasia enlarged nuclei and densely packed inflammatory cell infiltrates in the colon. Colon of SA (20 mg kg−1 b.w.)-supplemented DMH-treated rat (Figure 6(d)) shows mild inflammatory infiltrates and occasional lymphoid aggregates. Colon of rats supplemented with SA at the dose of 40 mg kg−1 b.w. to DMH-treated rat (Figure 6(e)) shows near normal-appearing colonic architecture and glands. Colon of SA (80 mg kg−1 b.w.)-supplemented DMH-treated rat (Figure 6(f)) shows mild enlargement of nuclei.

Cross section of rat colon stained with H&E. Left panel shows view at ×10 magnification. The right panel shows the view of insets from the left panel, at ×40 magnification. (a,b) Control and control + SA (80 mg kg−1 b.w.)-supplemented rat shows normal colonic architecture with regular lining. (c) DMH alone-treated rat reveals loss of normal architecture with prominent lymphoid aggregates, enlarged nuclei and densely packed inflammatory cell infiltrates in the colon. (d) Colon of SA (20 mg kg−1 b.w.)-supplemented DMH-treated rat shows mild inflammatory infiltrates and occasional lymphoid aggregates. (e) Colon of SA (40 mg kg−1 b.w.)-supplemented DMH-treated rat shows near normal-appearing architecture and glands. (f) Colon of SA (80 mg kg−1 b.w.)-supplemented DMH-treated rat shows mild enlargement of nuclei. H&E: haematoxylin and eosin; SA: sinapic acid; DMH: 1,2-dimethylhydrazine; b.w.: body weight.
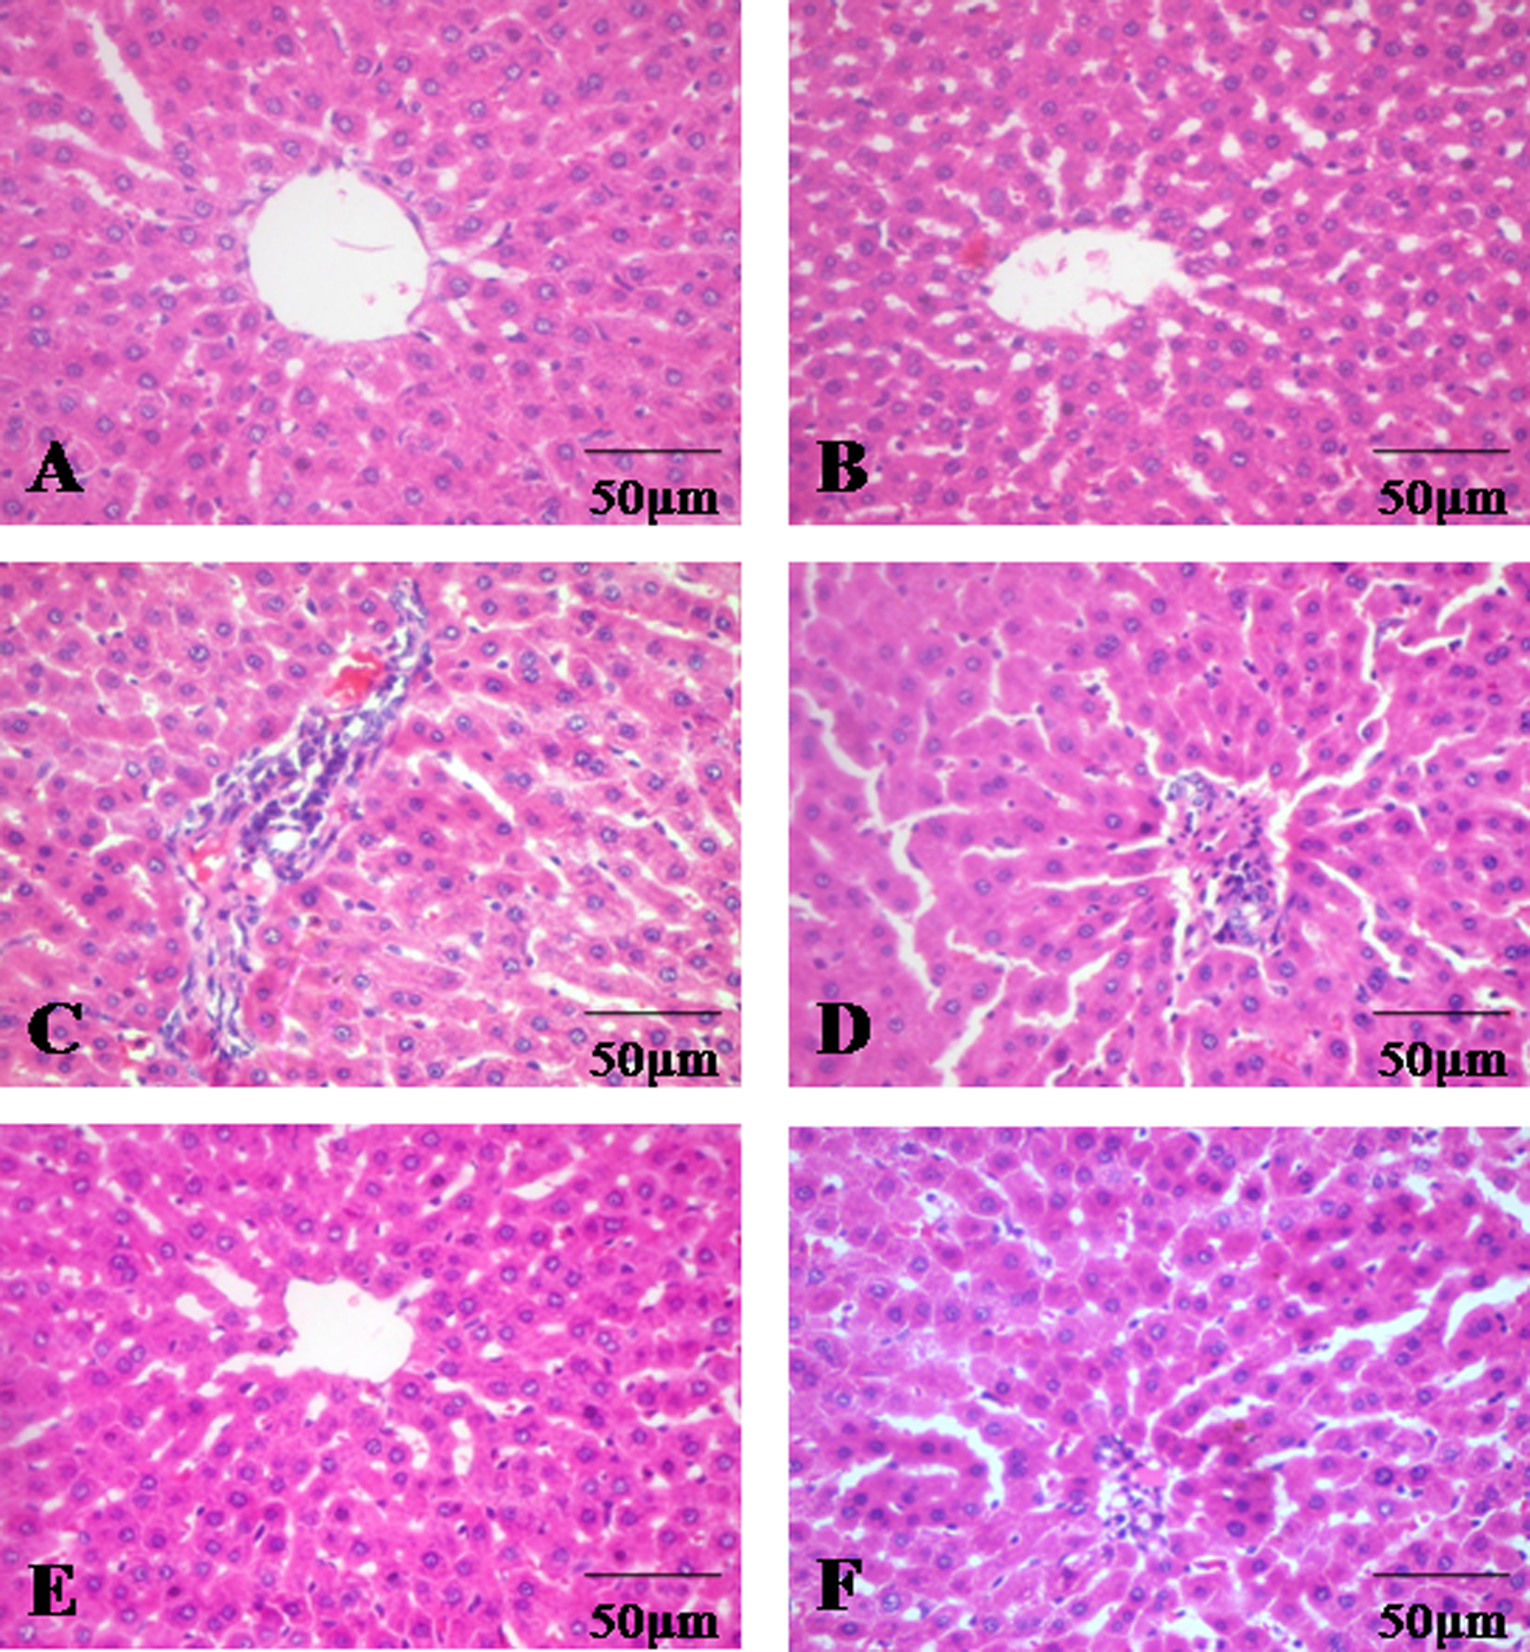
Cross section of rat liver stained with H&E showing the histological changes, at ×40 magnification. (a,b) Liver of control and SA (80 mg kg−1 b.w.)-treated rats shows normal architecture. (c) DMH alone-treated rat liver exhibits loss of normal architecture with pathological alterations like central vein degeneration, sinusoidal dilatation and congestion, hepatocytes drop out and neoplastic cells. (d) Liver of SA (20 mg kg−1 b.w.)-supplemented DMH-treated rat shows inflammatory cell infiltrates. (e) Liver of SA (40 mg kg−1 b.w.)-supplemented DMH-treated rat shows near normal architecture. (f) Liver of SA (80 mg kg−1 b.w.)-supplemented DMH-treated rat shows mild inflammatory cell infiltrates and hepatocytes are slightly damaged. H&E: haematoxylin and eosin; SA: sinapic acid; DMH: 1,2-dimethylhydrazine; b.w.: body weight.
Control and control + SA (80 mg kg−1 b.w.)-supplemented rats (Figure 7(a) and (b)) show normal liver architecture bearing portal triad and hepatocytes. DMH alone-treated rat (Figure 7(c)) liver exhibits loss of normal architecture and shows pathological alterations like central vein degeneration, necrosis, sinusoidal dilatation, congestion, hepatocytes drop out and neoplastic cells. Liver of SA (20 mg kg−1 b.w.)-supplemented rat (Figure 7(d)) shows inflammatory cell infiltrates. Rat supplemented with SA at the dose of 40 mg kg−1 b.w to DMH-treated rat (Figure 7(e)) shows near normal architecture of the liver. Liver of SA (80 mg kg−1 b.w.)-supplemented rat (Figure 7(f)) shows mild inflammatory cell infiltrates and hepatocytes are slightly damaged.
Discussion
Numerous studies have indicated that phenolic acids, a class of phytochemicals, act as potential chemopreventive agents against different types of cancers. Extensive numbers of compounds are present in plants, some of which are strong modifiers of chemical-induced carcinogenesis. Hence, in the present study, we investigated the chemopreventive effect of SA, a naturally occurring phenolic acid, on DMH-induced colon carcinogenesis in Wistar rats.
DMH is a potent colon carcinogen, and it has served as an effective tool to induce colon cancer in rodents. Generally, loss of weight and appetite are common problems in cancer because of altered energy metabolism during tumour formation. 32 Additionally cancer cachexia and anorexia play important roles in the complex tumour–host interactions. 33 In the present study, body weight gain/growth rate of the DMH-treated rats were decreased as compared to the control rats, which could be due to the reduced energy metabolism in cancer conditions. In this context, Puppa et al. 34 reported reduced body weight gain due to the presence of polyps in the intestine of the ApcMin+/− mouse. Concordant with these studies, we have also noticed 100% incidence of hyperplastic polyps in DMH alone-treated rats as compared to the other groups. Supplementation with SA to the rats at the dose of 40 mg kg−1 b.w. significantly increased the body weight gain/growth rate and also decreased the polyps incidence by 33.33%. The ability of SA to act as a chemopreventive agent could be the reason for the improved body weight of the rats in the presence of the carcinogen, DMH.
ROS are implicated in the pathogenesis and molecular mechanisms of colon cancer initiation, promotion and progression. LPO represents one of the most frequent reactions resulting in cellular damage caused by ROS attack on biological structures that include colon cancer. DMH is metabolised to the active form in the liver via an intermediate metabolite MAM, further to methyldiazonium ion, which is a carcinogenic electrophile generating free radicals and are subsequently transported to the colon via bile or blood. 35 Hence, the enhanced LPO levels in the liver of DMH-treated rats could be due to the production of reactive oxygen metabolites during the metabolism of DMH. Numerous human intervention and clinical studies showed that the levels of LPO by-products such as TBARS and CD are lower in the colon of cancer patients than in the control. 36 In this context, LPO is believed to be involved in the control of cell division, 37 and low levels of oxygen free radicals have been reported to stimulate cell proliferation. 38 Thus, it can indicate an inverse relationship between LPO and the rate of cell proliferation/or differentiation. Biasi et al. 39 also reported decreased levels of LPO, which in turn promotes tumour growth due to decreased expression of cytokines by the tumour tissue.
Moreover, previous studies have suggested that the normal cells when transformed into cancer cells become more resistant to LPO than their normal counterparts and their susceptibility to LPO decreases with the increase in the degree of dedifferentiation. 40 In addition, colon cancer cells have the ability to proliferate faster when the LPO level is low. 41 Malignant tissues are less susceptible and more resistant to free radical attack and hence LPO is less intense. 42 In the present study, we observed DMH alone-treated rats showed decreased levels of the LPO by-products such as TBARS and CD in the intestine and colon, which may be due to increased cell proliferation and resistance/decreased susceptibility of the target organs to free radical attack. Moreover, on supplementation with SA, the animals exhibited remarkable recovery underlining the fact that SA effectively inhibits LPO.
Endogenous antioxidant defence enzymes, such as SOD and CAT, play a significant role in scavenging ROS. SOD helps in neutralising superoxide anion, which is the initial free radical amongst the oxygen radicals, and CAT prevents the oxidative hazard by catalyzing the formation of H2O and O2 from H2O2. 43 Several investigations have revealed that low levels of antioxidants are associated with an increased risk of colon cancer. In our study, the decreased activities of SOD and CAT in the carcinogen-exposed rats could be due to the aberrant increase in the levels of ROS and thus the oxidative stress, together with proliferation of malignant colonocytes. Moreover, supplementation with SA to DMH-treated rats significantly increased the activities of the endogenous antioxidant enzymes in the liver, intestine, colonic tissues and caecum, which could be attributed to the protective peroxynitrate scavenging activity of SA, which in turn could spare the antioxidant enzymes.
GPx, the selenium-containing tetrameric glycoprotein, is an active component of the cellular defence that protects the cellular membranes from oxidative damage by eliminating H2O2. It catalyzes the reduction of lipid hydroperoxides to hydroxides during the oxidation of GSH. GR, a flavoprotein, regenerates GSH from oxidised glutathione (glutathione disulfide (GSSG)) by the activation of GPx and provides reducing power for various coupled thiol transferases and peroxidases. The decrease in the GPx and GR activities in the tissues of colon cancer-bearing rats may reflect the decline in the production and availability of GSH to neutralise H2O2. 44
GSH is a low–molecular-weight tripeptide, a cellular antioxidant. It protects the cell from oxidative stress and plays an essential role in the detoxification reactions by acting both as a nucleophilic scavenger of various undesired compounds and their toxic metabolites and as a specific substrate for the enzymes GPx and GST. 45 In the present study, the concentration of GSH was also significantly decreased in the DMH-induced rats, which could be most likely due to its excessive utilisation by tumour cells for cell proliferation. Simultaneously, the level of oxidised GSSG increases resulting in the lowering of the GSH/GSSG ratio. 46 Supplementation with SA to DMH-treated rats elevated the activities/levels of GPx, GR and GSH that ultimately signifies the role of SA in scavenging the free radicals, which in turn may readily account for the sparing/increase in the levels of the other antioxidants.
Phase I and II biotransformation reactions catalyzed by the xenobiotic metabolizing enzyme system takes place in the hepatic and extrahepatic tissues including the colon. 47 CYP450, a family of phase I monomeric haemoprotein counters the chemical challenge from the environment and catalyses the metabolic activation of various procarcinogens to ultimate carcinogens. CYP2E1 is an isoenzyme of the CYP450 family that helps in the bioactivation of chemicals to toxic metabolites and its inhibition would block the formation of these metabolites. 48 Moreover, the sequential biotransformation of the procarcinogen DMH to azomethane, azoxymethane and MAM are catalysed by CYP2E1 enzyme system. In the present study, the DMH alone-treated rats showed increased activities of the phase I enzymes CYP450 and CYP2E1 due to the metabolism of DMH in the liver microsomes and colonic epithelial cells to yield reactive genotoxic intermediates. These intermediates covalently bind to DNA to form DNA adducts and initiate the carcinogenic process. 49 Supplementation with SA to DMH-treated rats suppressed the activities of the phase I enzymes in the liver and colonic mucosa. In this context, phenolic acids are known to play a crucial role in modulating the carcinogen-metabolizing system such as inhibiting the CYP2E1activity. 50
Phase II reactions are conjugation reactions that involve the addition of polar groups to the foreign xenobiotic molecules. UDPGT, DTD and GST are important phase II enzymes that help in solubilising the xenobiotics. UDPGT belongs to the UGT family of enzymes present in the lipid bilayer of the endoplasmic reticulum. Its ability to conjugate the lipophilic compounds with glucuronic acid plays a major role in (i) reducing the toxicity and biological activities of carcinogens and (ii) facilitating their removal as water-soluble glucuronides. 51 In the present study, DMH-treated rats showed significant decrease in the activities of UDPGT in the liver and colonic mucosa, which may result in the peroxidative damage to the microsomal lipids.
DTD can be induced by mono- and bifunctional inducers together with other phase II enzymes like GST. 52 Moreover, it is a cytosolic flavoenzyme that catalyses the two-electron reduction of quinones into hydroquinones. 53 GST is a major detoxifying enzyme that can catalyse and conjugate hydroquinones 54 and xenobiotics with reduced GSH, thereby facilitating the neutralisation of their electrophilic centre by –SH group. In the present study, DMH alone-treated rats showed decreased DTD and GST activities in the liver and colonic mucosa, which may be due to the depletion of the GSH pool. Supplementation with SA resulted in the induction of the phase II detoxification enzymes in DMH-induced colon cancer rats. Since phytochemicals are believed to modulate the xenobiotic-metabolizing enzymes by their promising chemopreventive strategy, 55 our results reinforce that SA can act as a bifunctional inducer, modulating both the phase I and phase II xenobiotic-metabolizing enzymes thereby enhancing detoxification, reducing the formation of reactive intermediates and lowering the production of mutagens and carcinogens.
Histopathological examination of DMH-treated rat colon revealed that supplementation with SA under treatment conditions inhibited the process of colon carcinogenesis to a great extent by altering the efficacy of DMH. Histopathological examination of DMH-treated rat colon revealed that supplementation with SA under treatment conditions inhibited the process of colon carcinogenesis to a great extent by altering the efficacy of DMH. Previous studies reported that DMH-induced colon carcinogenesis in a rat model indicates crypt proliferation and dysplasia in the colonic mucosal epithelium which later develops into adenocarcinoma. 56 Moreover, it is known that in inflammatory conditions, enlargement of mucosal–submucosal lymphoid aggregates occur resulting in the formation of abnormal crypts due to the pathological destruction of colonic epithelium. 57 In the present study, morphological surface alterations in the colon, such as largely distributed crypts, crypt abscess, crypt ablation and prominent lymphoid aggregates observed on DMH treatment, are predictive of neoplastic transformation. Moreover, pathological changes such as proliferating mucosal glands with well-differentiated signs of dysplasia, enlarged nuclei and inflammatory cell infiltrates that alter the structure and cytological function of the epithelium were observed, which finally may lead to carcinogenesis. 58,59 Liver sections of DMH alone-treated rat showed distortion in the arrangement of cells with pathological alterations like necrosis, neoplastic cells, sinusoidal dilatation and congestion in the portal triad. Earlier results demonstrated that supplementation with SA protects the liver from sodium arsenite intoxication and kidneys from streptozotocin intoxication (diabetes rats). 60,61 Similarly, in the present study, we observed the potent beneficial effects of SA, when supplemented to DMH-treated rats at the dose of 40 mg kg−1 b.w. revealed near normal morphology of the colon and liver tissues. In contrast, SA at the dose of 80 mg kg−1 b.w. did not show maximum inhibitory effect which could be due to the high concentrations of SA and its by-products could have interfered with its preventive role, thus decreasing its effectiveness.
In conclusion, this study has underlined the chemopreventive effects of SA against DMH-induced colon carcinogenesis. Moreover, SA at the dose of 40 mg kg−1 b.w. showed a more pronounced effect as evident by the decreased tumour incidence, enhanced antioxidant defence and modulation of the LPO markers, phase I and phase II detoxifying enzymes. Further long-term studies are needed to investigate and confirm the exact mechanism of action of SA.
Footnotes
Conflict of interest
The authors declared no conflicts of interest.
Funding
The present work is financially supported by the University Grants Commission (UGC), New Delhi, India, in the form of Research Fellowship in Science for Meritorious Students (RFSMS) scheme to C Balaji.