
Abstract
The urban centre of Karonga in Malawi experiences many large and small disasters, including earthquakes, strong winds and floods. Inhabitants also face such everyday risks as unsafe water, poor-quality sanitation and widespread use of dirty fuels within households. However, the nature and scale of the risks are poorly understood. Based on data from 380 systematically selected households in Karonga, this paper explores the frequency and impacts of small and large disasters and everyday risks, finding informal settlements in flood zones to be most affected. Impacts vary according to differences in levels of income, planning and housing status, access to water, sanitation and the type of energy used by households. Attempts to reduce and respond to disaster risk are affected by weak governance structures. The knowledge can create the basis for capacity building at both the community and local government levels.
I. Introduction
Sustainable Development Goal (SDG) 11 calls for making cities and human settlements inclusive, safe, resilient and sustainable. In particular, Target 11.5 calls for reducing the impacts of disasters, especially among the poor and vulnerable.(1) Achieving the SDGs for the benefit of urban poor communities requires, among other things, the generation of knowledge to inform urban planning, policy and capacity building.(2) This paper, which is part of the Urban Africa: Risk Knowledge (Urban ARK) research project,(3) is based on a study conducted in Karonga in Malawi. The study was designed to:
Investigate the nature, scale and frequency of risks as well as their driving factors;
Determine the social characteristics of communities exposed to risks;
Find out the relationships among household income level, ways of accessing water, sanitation, energy, housing status, and risks and impacts;
Evaluate community understandings and perceptions of risks and related impacts; and
Assess conflict management in governance arrangements in disaster risk management.
The next section points to the neglect of small cities in the discourse on risk; it is followed by a description of the research methods, the results of the study, a discussion and conclusions.
II. The Neglect of Small Cities and Risk Impacts
The level of understanding of risk and vulnerability in cities varies considerably. Within this spectrum, two broad observations can be made: there is limited understanding of disaster impacts, especially for low-income groups, and there is an apparent neglect of small cities, regardless of their location and prosperity. These observations hold true in Africa, where urban vulnerability and loss assessments have rarely been systemically conducted.(4) The few urban cases where such assessments have been done have tended to be large cities.(5) A recent attempt to reveal the data gaps on urban disasters in sub-Saharan Africa also focused on capital cities.(6) Only a handful of studies are dedicated to risk in small urban centres, mainly owing to their lack of political and economic influence.(7) Over half of the urban population in sub-Saharan Africa is estimated to live in small urban centres, defined here to be those with under half a million inhabitants (one among the range of definitions).(8) And these urban centres tend to have higher proportions of inhabitants exposed to hazards.(9) Risks are often still potentially manageable in these smaller urban centres, but their generally weak governance and financial resource base, arising from the failure of decentralization, undermine their potential to protect themselves from disaster.(10)
Most countries, in a bid to protect the strategic economic sector and wealth areas, tend to neglect small disasters in urban areas, largely as a result of a limited understanding of the scale of their impacts.(11) Bull-Kamanga et al.(12) classify urban risk according to scale and intensity, defining three categories (Table 1): (large) disaster, small disaster and everyday risks. Small disasters are considered to be those that kill 3–9 people, while everyday risks are those that result in fewer than 3 deaths or 10 injuries. Small disasters and every day risks can still result in premature deaths, injury, impoverishment and building collapse.
Disasters, small disasters and everyday risks
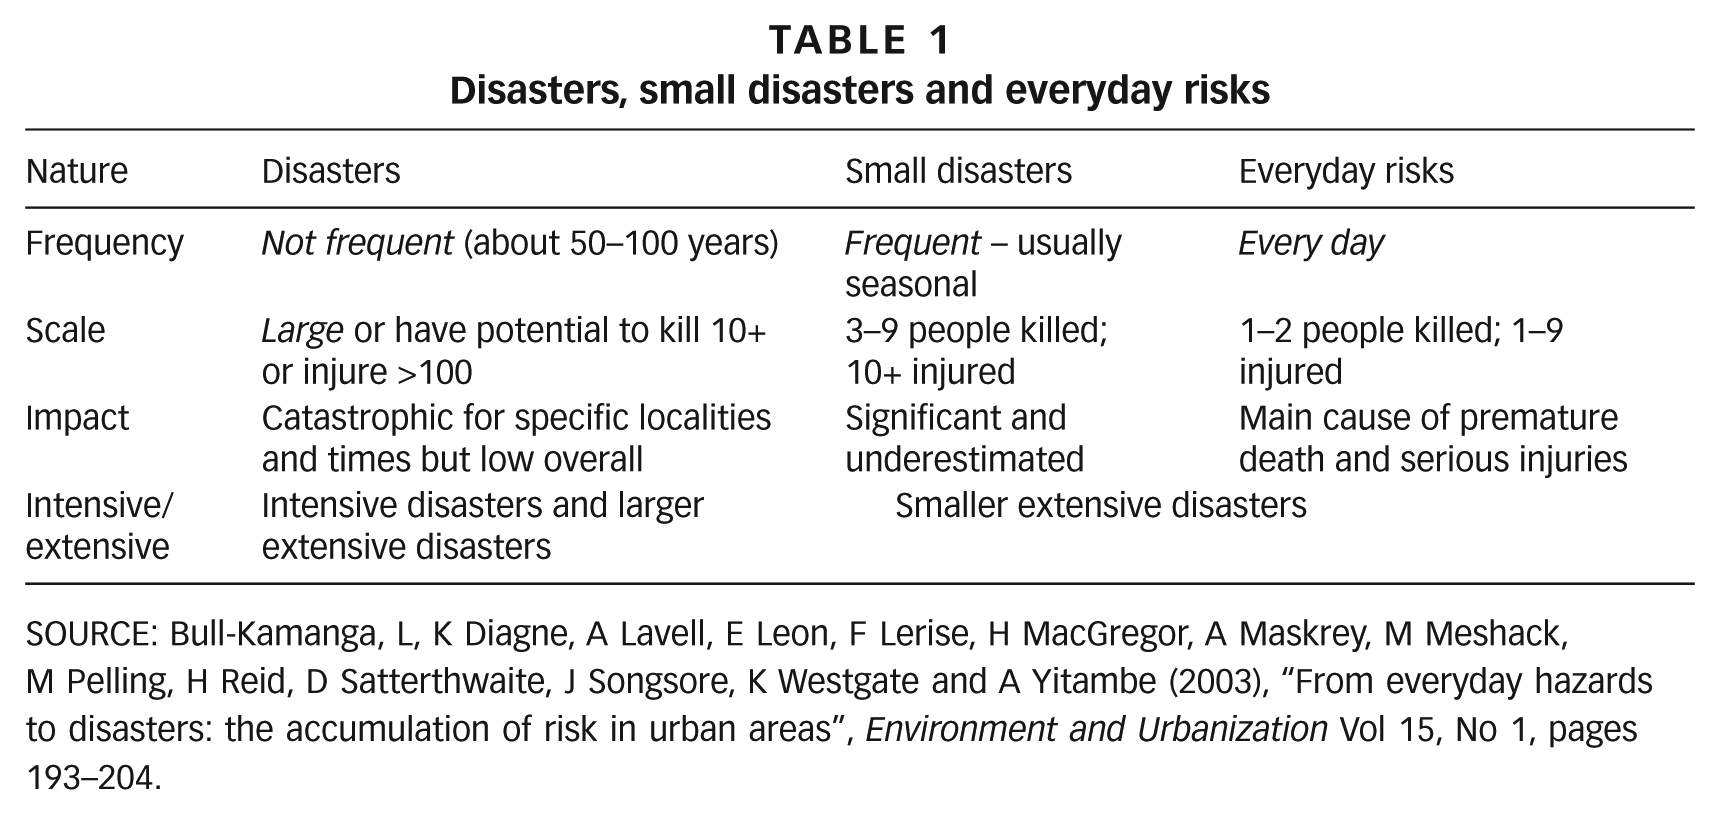
SOURCE: Bull-Kamanga, L, K Diagne, A Lavell, E Leon, F Lerise, H MacGregor, A Maskrey, M Meshack, M Pelling, H Reid, D Satterthwaite, J Songsore, K Westgate and A Yitambe (2003), “From everyday hazards to disasters: the accumulation of risk in urban areas”, Environment and Urbanization Vol 15, No 1, pages 193–204.
The United Nations Office for Disaster Risk Reduction (UNISDR) employs two categories: extensive risk, with fewer than 30 deaths and/or under 600 houses destroyed; and intensive risk, with deaths or housing destroyed above these thresholds. In this categorization, intensive risks are the outcome of large disasters, which occur infrequently and can have catastrophic impacts in specific locations. In low-income nations, extensive risks are increasing.(13) A lack of understanding of the nature and scale of these risks in urban settlements is associated with the neglect of small urban centres and, along with it, the neglect of communities, especially the low-income groups in informal settlements likely to be most at risk from more frequent lower-impact events.(14)
In Malawi, where urban population growth has been over 4 per cent per year in the past three censuses,(15) some of the highest growth rates are recorded in small towns and small cities such as Karonga (4.3 per cent per year).(16) The Government of Malawi considers these urban growth rates, which are higher than the national growth rate of 2.8 per cent per year, to be too rapid and unsustainable,(17) and there have been concerted efforts to contain urban development since independence in 1964.(18) Several rural development projects have been implemented with the aim of stopping or reducing the growth of the urban population,(19) along with a development programme for secondary urban centres also aiming to limit rural–urban migration.(20)
In Malawi all urban areas, large or small, are neglected. With its general anti-urban policy, little attention has been paid to the governance and development of urban areas, evident in the fact that nearly 60 per cent of the urban population live in informal areas.(21) A lack of appropriate governance structures has created challenges for addressing everyday risks and disaster risk reduction in these urban settlements.(22) For example, the recently approved Malawi Disaster Risk Management Policy implementation structure and the national disaster recovery framework, which are the basis for resource allocation, only provide for rural and village-level structures.(23) The National Disaster Recovery Framework is particularly prescriptive: “The key coordinating structure will be the DCPC [District Civil Protection Committee] at the district level, the Area Civil Protection Committee at Traditional Authority levels and the VCPC [Village Civil Protection Committee] at the village and group village levels. It is critical that no new structures are established parallel to existing coordinating structures solely for the implementation of recovery interventions.”(24)
Consequently, as urban challenges are assumed not to exist or to be minimal, the impacts on urban livelihoods and already poor health indicators are worsening. Infant and under-5 mortality rates illustrate this; while rates are declining in both rural and urban areas, the urban advantage on these fronts is disappearing (Table S1 in the online supplementary information). Though current data are unavailable, previous Demographic and Health Surveys (DHSs) show that Malawi has the highest under-five mortality in East and Southern Africa.(25) Child nutrition status is also poor, with 22.9 per cent underweight, 44.8 per cent stunted and 27 per cent wasted.(26) Using the classification of Dodman et al., Malawi is therefore among those countries at the highest risk to hazards.(27) As will be shown later, the provision for water and sanitation is equally poor. The impact of multiple hazards, including earthquakes, flooding and droughts, may worsen health indicators and contribute to premature death.
III. Methodology
a. Description of the study area
Karonga, covering 4,386 hectares, is located about 225 kilometres north of Mzuzu City in Northern Malawi on the low-lying North Rukuru River floodplain, and by the shores of Lake Malawi. Owing to its location on a major regional trade route to the port of Dar es Salaam (Tanzania), it is one of the mostly rapidly urbanizing towns in a country that is still only 20 per cent urban. With a total population of about 41,000 in 2008, growing at 4.3 per cent per year, Karonga is Malawi’s fifth- largest urban centre and is projected to reach nearly 63,000 by 2018.(28) In part, its population growth is due to the 2013 extension of the city boundary. Karonga experiences a sub-tropical climate with two distinct seasons (i.e. the dry season and wet season, from June to October and November to May, respectively).
b. Study design
The study employed both quantitative and qualitative methods. Water samples were collected and analysed and a semi-structured questionnaire survey was administered. This included some open-ended questions, and so yielded both quantitative and qualitative information. The survey was developed in English and then translated and conducted in the common languages of the area, Chi-Nkhonde and Chi-Tumbuka. Translation relied on a team of research assistants from the community, recruited under Urban ARK (Malawi), and given a two-day training session on administering the questionnaire. This training was followed by pre-testing and revision of the questionnaire to improve both face and content validity.(29) The qualitative analysis also drew on non-participant observation.
c. Household survey sample size determination and data collection
This study focused on the area within the original boundary in Karonga, the basis of the 2008 national census, and used the sample frame provided by the National Statistical Office, from which 380 households were selected for interviews. A systematic random sampling was used, and every 26th household was interviewed.
d. Water sample collection and analysis
Data on water quality are based on samples from 27 randomly selected unprotected water sources, collected in triplicate using standard sampling procedures, and taking account of any particular sanitary risks.(30) A Geographical Positioning System (GPS) hand receiver (GARMIN GPSMAP 60Cx) was used to locate and obtain geo-referencing data. The water samples were analysed for pH, total dissolved solids (TDS), faecal coliform and total coliform. Levels of pH were determined using a pH meter (Hanna Instruments, Model HI 9812). Levels of TDS were determined using an Eco Testr TDS low meter. Levels of faecal coliform and total coliform were determined using a Petrifilm method. The pH meter was calibrated using standard buffer solutions of pH 4.00 and 7.00 before measuring pH.
e. Data management and analysis
Quantitative data entry and analysis were done using SPSS version 23. Completed questionnaires were checked for errors or inconsistencies, with callbacks if questionnaires were not thoroughly completed by the research assistants, and all data were cleaned. Analysis involved simple descriptive statistics such as frequency distributions, percentages, computation of chi-square tests and cross-tabulations. Results are presented in tables and charts.
Qualitative data were manually transcribed, ordered, coded and analysed systematically based on content, although some accounts from household interviews could represent standalone illustrations of important themes and emerging issues of the study. Analysis of open-ended survey questions, interview transcripts, and observation field notes involved categorizing issues into recurrent themes and topics relevant to particular research questions. In order to generate explanatory insights, the analysed data were summarized using tables and graphs.
IV. Study Results
a. Socioeconomic attributes of respondents
The majority of respondents were female (61.3 per cent vs. 38.7 per cent, reflecting the greater number of women working at home) and middle-aged (84 per cent over 26 years of age). Over 80 percent of households were headed by males (Table S2 in the online supplement). Reported household sizes were generally large, with 46.7 per cent having 1–5 members, 44.6 per cent having 6–10 members and 8.7 per cent more than 10 members.
With respect to education, 43.7 per cent of respondents had primary education, 43.2 per cent had secondary education, 5.8 per cent had attended either technical or teacher training colleges, and 2.9 per cent had university education. Only 4.5 per cent lacked any education. By comparison, at the national level, 7.3 per cent of urban dwellers lack any education.(31)
Average monthly incomes were generally low, with over a third earning on average <MWK 10,000 (US$ 13.86) and few earning above MWK 50,000 (US$ 69.43) per month (Table S3 in the online supplement). Businesses of various categories and types (42.9 per cent), salaried employment (23.2 per cent) and farming (17.9 per cent) were the main sources of household income (Figure 1).
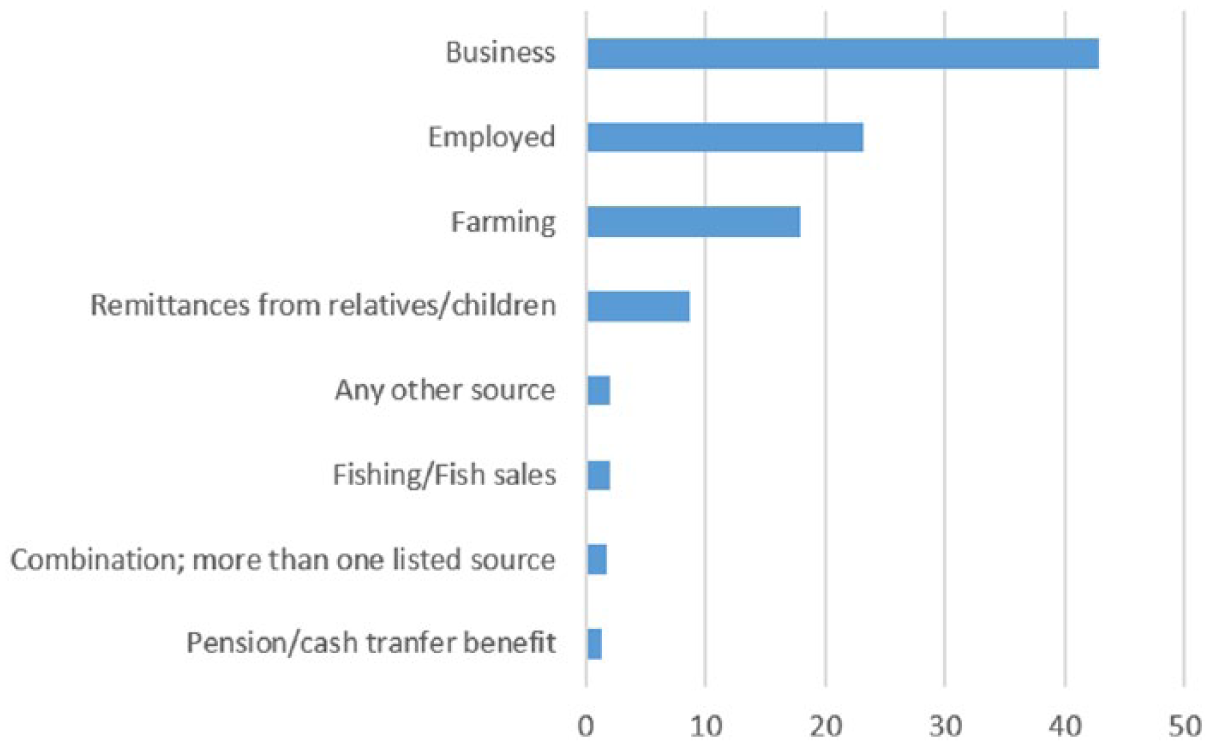
Main sources of income for the households (per cent)
About half of the respondents resided in semi-permanent houses, 41.1 per cent in permanent houses and the remainder in traditional-type houses (Table S4 in the online supplement). Permanent houses are defined as those constructed with fired bricks, iron roofs and concrete floors. Traditional houses have sun-dried brick walls, mud floors and grass thatch. Semi-permanent houses are built of any combination of permanent and traditional materials.(32) Most houses were owner-occupied, and tenants occupied about one-third. Most of the residential areas are informally settled. Housing quality was not significantly related to either planning status or tenure status.
Land tenure security is a significant parameter that not only encourages household-level investment in the land but can also be a basis for accessing funding for income-generating activities to reduce poverty.(33) In Malawi most of the land is under customary tenure, but this land category is declining in size, with conversion to private ownership through offers of titles to individuals and organizations.
The majority of respondents (69.8 per cent) lacked title deeds and very few had ever applied for them. Land is perceived to come under customary authority; people are not aware of the registration process or not interested at all. Without reading too much into the data, it appears that the strength of these traditional arrangements in small cities has major implications for the urbanization process and risk management.
V. Nature and Scale of the Risks
The data from both household interviews and hospital records point to a range of causes of premature death, injury and asset loss for the inhabitants of Karonga (Table 2). But the data relating these factors to everyday risks (and perhaps for small disasters) are incomplete. Available data do, however, highlight the fact that everyday risks may be causing more premature deaths than disasters do. Records from Karonga District Hospital show 67 tuberculosis (TB)-related deaths and 32 respiratory disease-related deaths (probably mostly infants and young children) in 2014. Of course, these are very different in character to deaths from disaster, as they do not relate to a specific physical hazard and event and, unlike most disasters, they do not include damage to property. But it could be argued that risks of premature death from TB and from acute respiratory infections were much higher than risks associated with flooding. Flooding would represent a greater risk of damage to property and assets and perhaps secondary health impacts (such as a cholera outbreak). Table 2 also points to other causes of premature death (including traffic accidents, drought, drowning, crocodile attacks, cholera) and injury (politically linked violence, gender-based violence), with some of these occurring each year.
Nature, scale and frequency of risks in Karonga
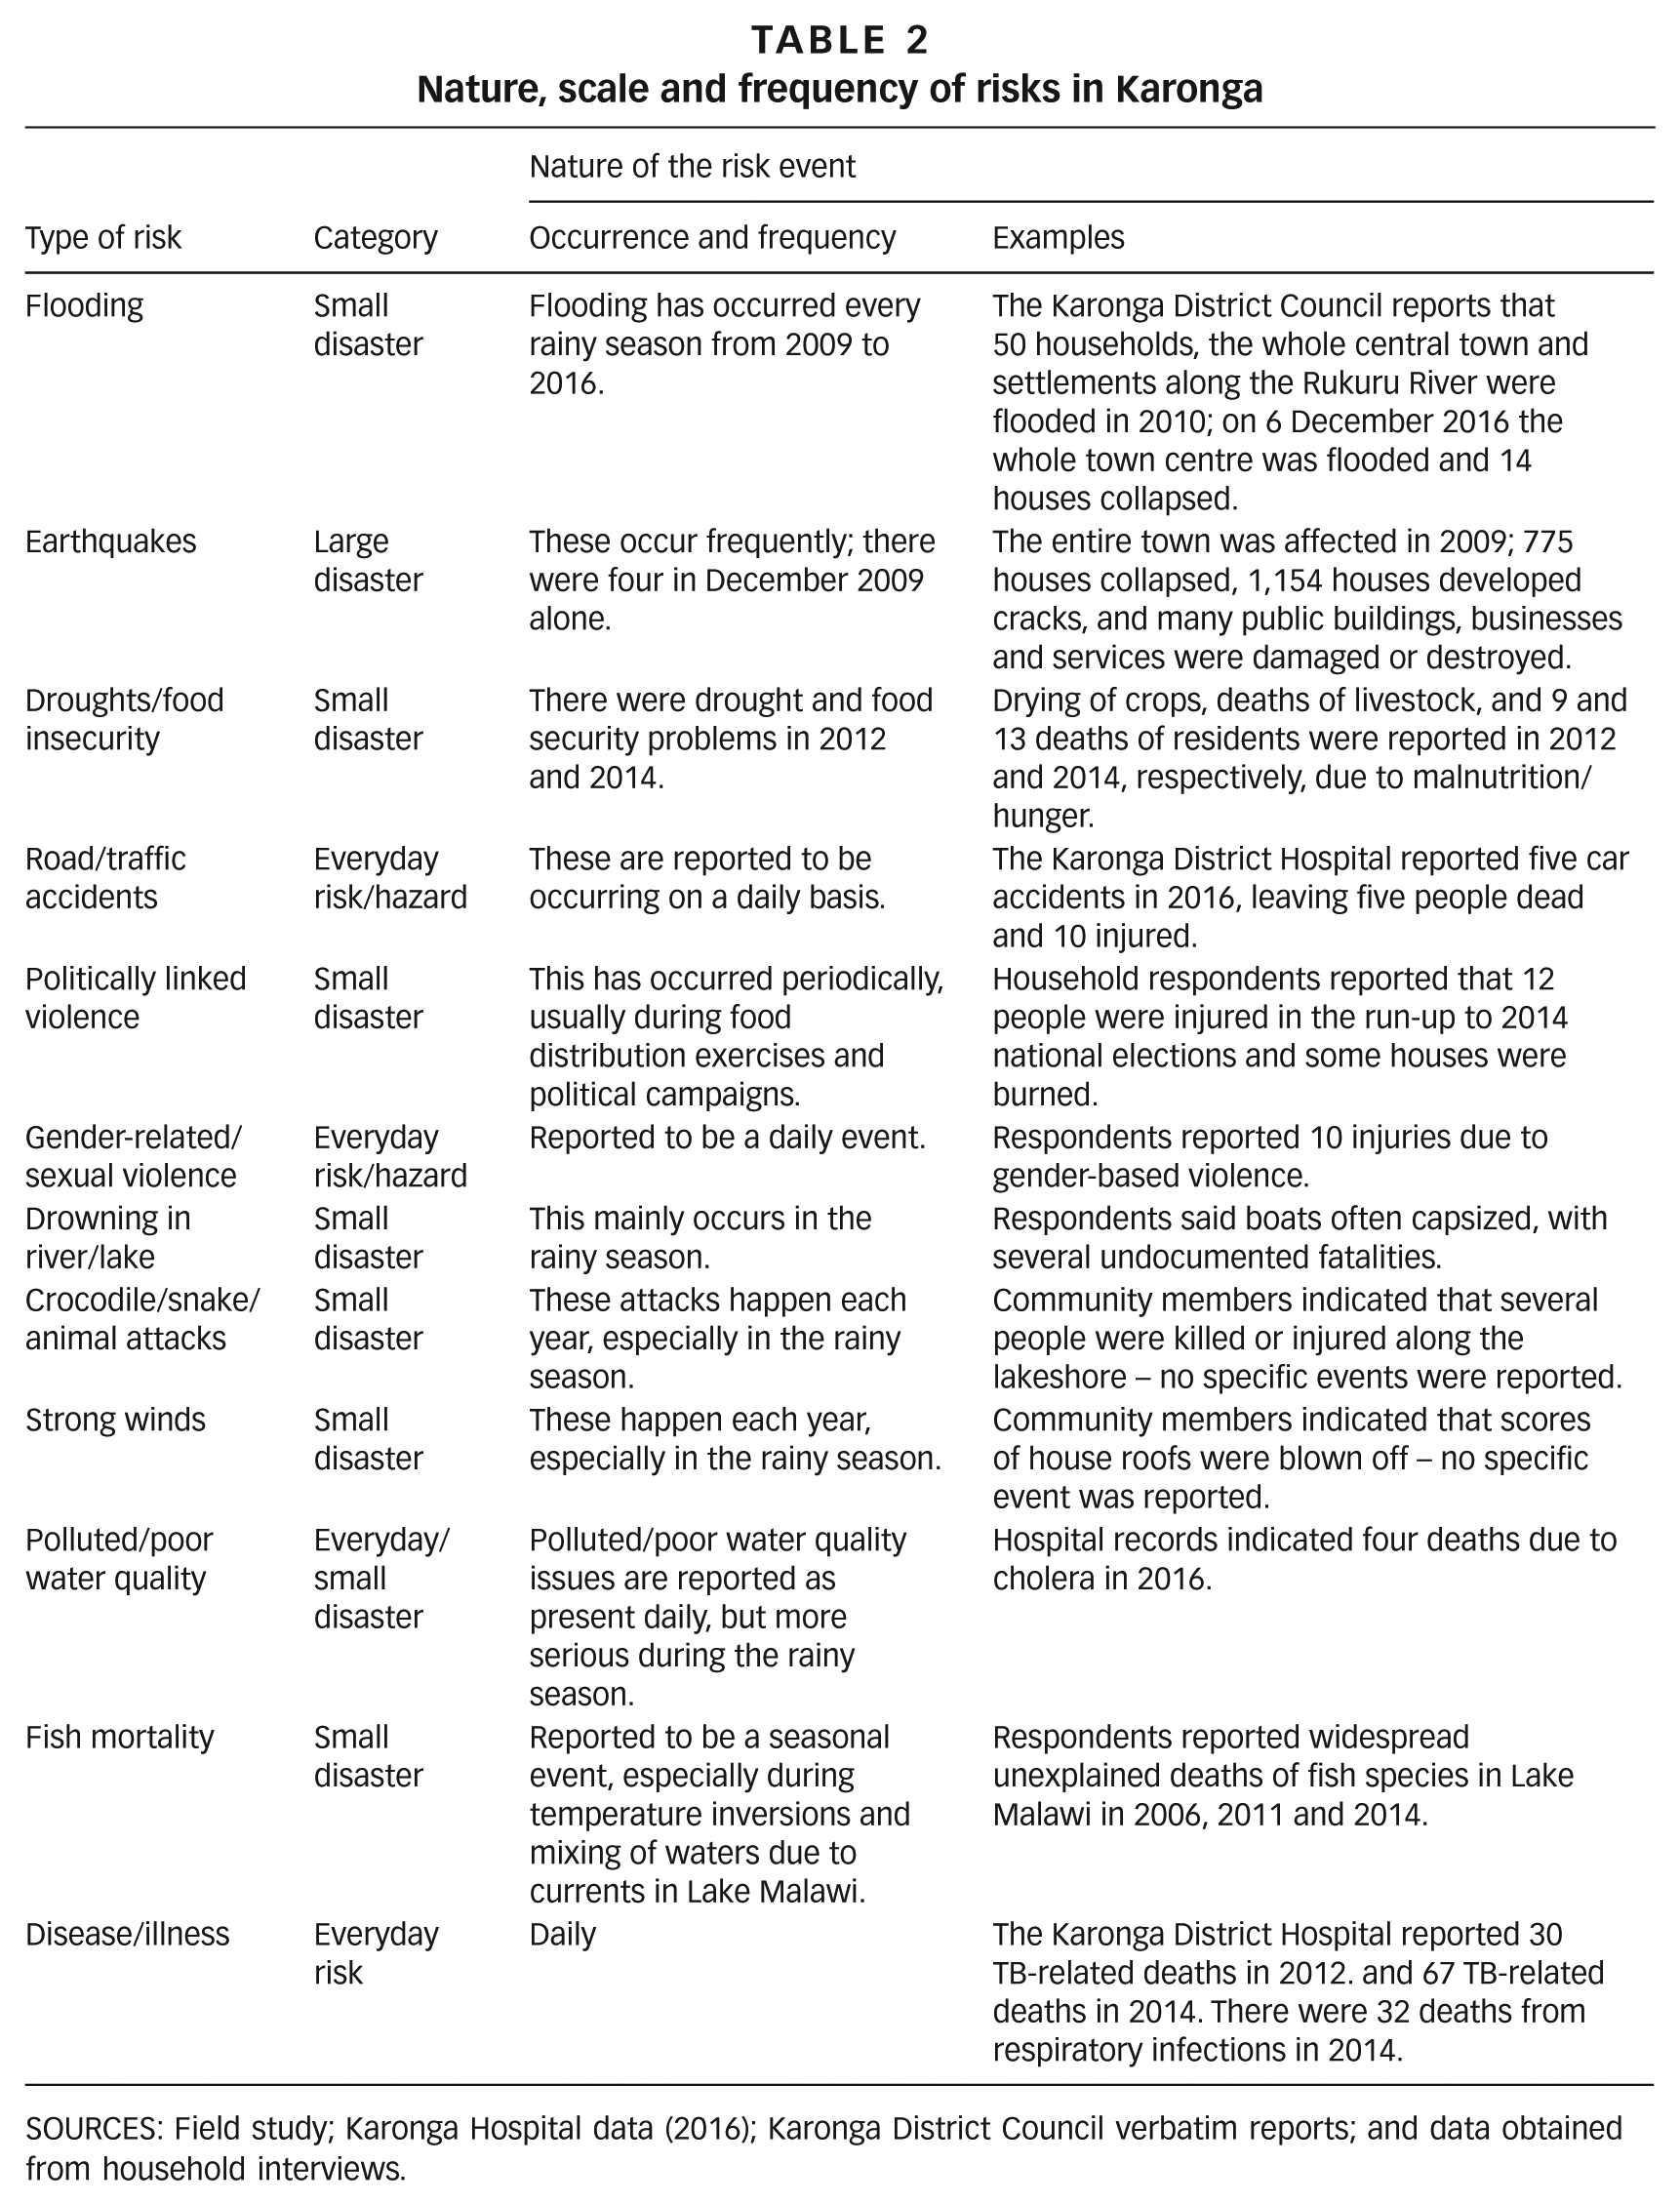
SOURCES: Field study; Karonga Hospital data (2016); Karonga District Council verbatim reports; and data obtained from household interviews.
Natural risks highlighted by the study included earthquakes and annual floods, while everyday risks included those related to inadequate provision for water and sanitation, accidents, and fuels used for cooking and lighting. Table 2 summarizes the risks in terms of their nature, scale and frequency of occurrence. Although respondents from low-income settlements registered a higher likelihood of being affected by floods and earthquakes in Karonga, the results show no statistically significant relationships among the distribution of serious hazard/risk in residential areas and the nature of housing, the planning status of residential areas or the monthly income levels. In statistical terms, then, all respondents were equally affected and suffered similar losses from flooding and earthquakes.
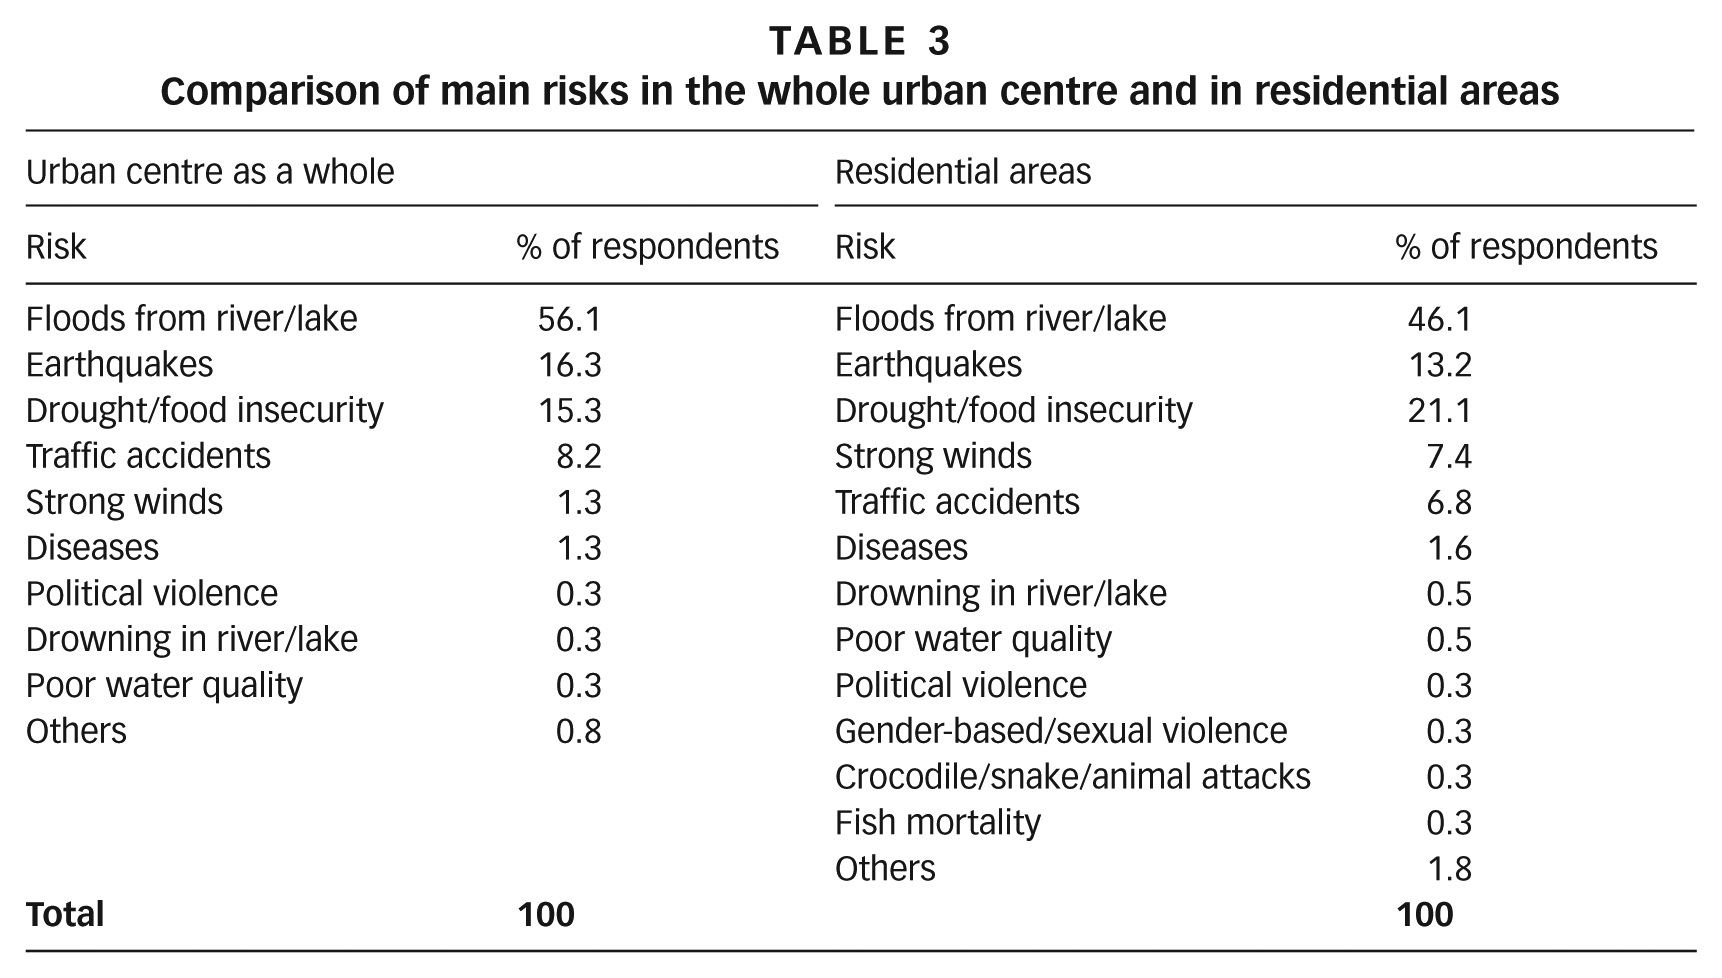
When asked to state the most serious risk in the urban centre generally and in the residential areas specifically, flooding ranked highest; 56.1 per cent of the respondents reported that floods were the most serious hazard in Karonga generally, while 46.1 per cent felt that floods were the most serious risk in residential areas (Table 3). The areas of the urban centre as a whole most affected by flooding were settlements, as well as farmland, along the river and the town centre. The majority of the people lived in flood-prone areas along the river where flooding was annual. As noted by UNISDR,(34) this implies that there are economic advantages to living in such areas that outweigh the perceived risks of flooding. Although the physical risk is high, the fact that most housing vulnerable to flooding is owner-occupied suggests that ease of access to land takes precedence over the risk of damage.
Comparison of main risks in the whole urban centre and in residential areas
a. Water, sanitation and hygiene (WASH)-related risks
The results of the study show that 90.2 per cent of the respondents claimed to have access to potable water as follows: water inside their homes (17.4 per cent), on the plot (41.8 per cent), on a neighbour’s plot (11.3 per cent) and from a communal water pipe (19.7 per cent) (Figure 2 and Table S5). However, 7.4 per cent and 2.4 per cent of the respondents access drinking water from a borehole and a river/lake/well, respectively. From the results of the cross-tabulation and chi-square test, the majority of respondents from semi-permanent housing (89.1 per cent), permanent housing (92.3 per cent), high-income households (100 per cent) and upper-middle income households (93.4 per cent) were more likely to get water from piped water inside the house, on the plot, on a neighbour’s plot and from communal water points (CWPs) (Table S5 in the online supplement). Respondents from traditional housing areas (28.1 per cent) and from low-income (17.7 per cent) and low-middle income (8.8 per cent) households were more likely to get water from unsafe water sources such as boreholes, shallow wells and rivers/streams/lakes (Table S5). There were statistically significant relationships between drinking water sources and the monthly income and nature of housing of the respondents. Respondents from semi-permanent and permanent housing areas and those with monthly incomes greater than MWK 29,999 were more likely to get water from safe water sources than those from traditional housing areas and those with income levels of MWK 29,999 or lower.
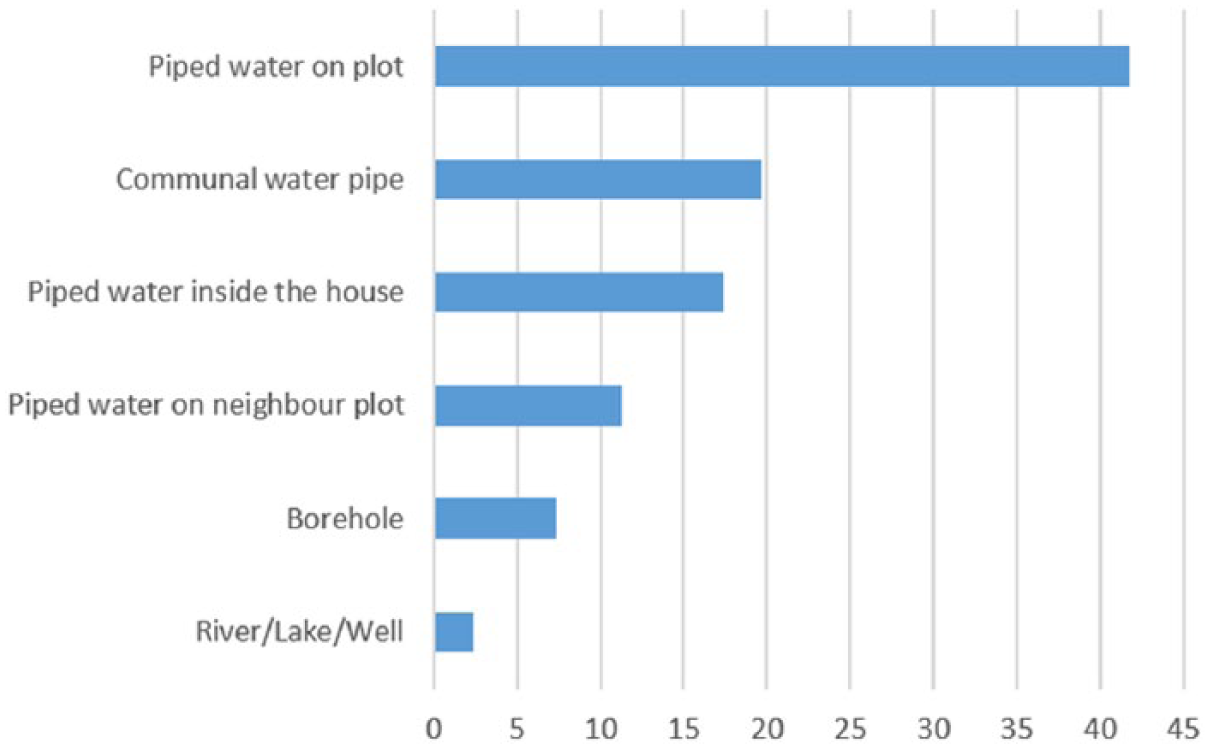
Respondents’ access to drinking water (per cent)
Table S5 highlights that most households in permanent housing and in the high-income category have piped water either inside the house or on the plot; only a minority of those in traditional housing and in the low-income category have these preferred options.
With respect to sanitary facilities, over half the households (51.1 per cent) used traditional pit latrines, and nearly a third (27.9 per cent) used ventilated improved pit (VIP) latrines, while 13.2 per cent used flush toilets connected to septic tanks, 4.2 per cent used neighbours’ pit latrines and 3.7 per cent did not have toilets (Tables S5 and S6). Table S6 shows that high-income households and households in permanent housing areas have the highest proportion of households with flush toilets connected to septic tanks. It also indicates that generally, the quality of provision for sanitation is worst for those households in traditional and semi-permanent housing areas, many of whom are low-income earners.
Other sanitary factors impacting groundwater, surface water sources and the health of households were noted. These included pit latrines located fewer than 100 metres away from shallow wells/boreholes/rivers (27.4 per cent), indiscriminate disposal of wastes (6.6 per cent), graveyards located closer than 100 metres to shallow wells/boreholes/rivers (1.1 per cent), lack of handwashing facilities (8.2 per cent), open defecation due to lack of toilets (2.4 per cent), stagnant water close to boreholes and shallow wells (2.4 per cent), and lack of proper drainage systems (5.0 per cent).
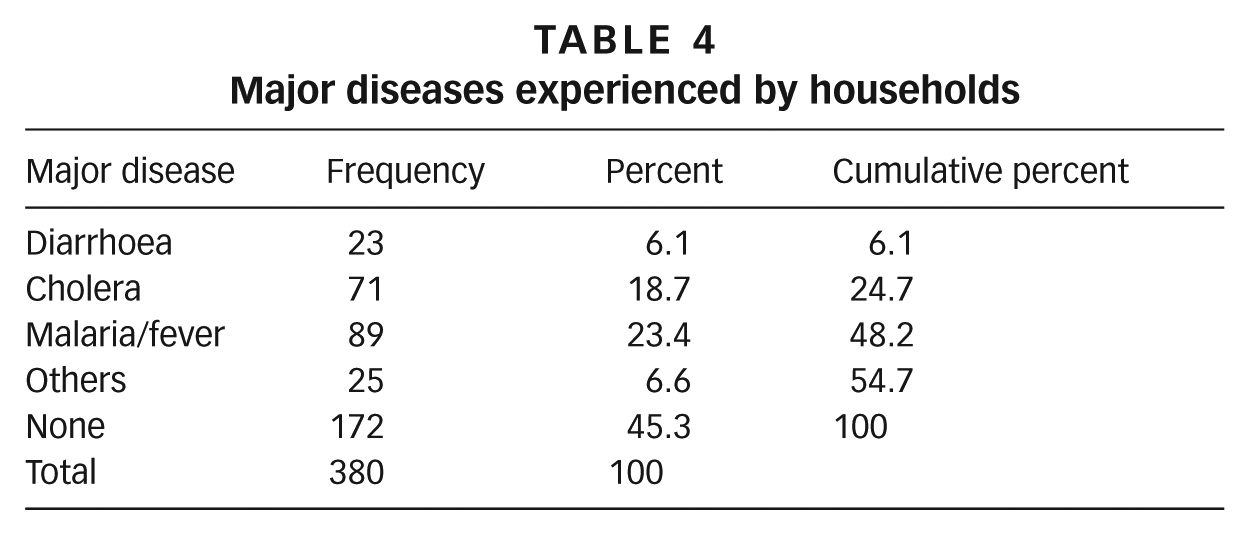
The results of water quality analysis show that the pH levels ranged from 5.2 to 8.3 (slightly acidic to slightly alkaline). The levels of TDS ranged from 50 to 580 ppm (low mineralization). Faecal coliform levels (E. coli) ranged from 0 to 7,200 colonies/100 millilitres, with the majority of samples (56 per cent) exceeding the World Health Organization’s drinking water quality specification of 0 colonies/100 millilitres, and not fit for domestic purposes prior to treatment. Total coliform levels ranged from 100 to 8,700 colonies/100 millilitres, with an average of 3,073 colonies/100 millilitres. It is not surprising that WASH-related diseases such as diarrhoeal disease (6.1 per cent), and cholera (18.7 per cent) (Table 4) are reported as prevalent by households. Statistically significant relationships were found between the type of toilet and the monthly average income, the nature of housing and the planning status of the residential area. There was no statistically significant relationship, however, between sanitary risks impacting a particular water source and the planning status of the residential area.
Major diseases experienced by households
Respondents with a greater likelihood of not having toilets included those with monthly income levels of MWK 29,999 or lower, residence in traditional housing and semi-permanent housing areas, and residence in upgraded and informal settlements. These respondents either practised open defecation or relied on neighbours’ toilets.
Respondents also responded to questions on sanitary risks that can impact the quality of water sources. Over a quarter (27 per cent) reported pit latrines within 100 metres of wells or boreholes. Eight per cent reported a lack of handwashing facilities and 3 per cent reported stagnant water close to wells, boreholes or the river.
b. Energy-related risks
The study found that the majority (95.2 per cent) of respondents relied on unclean sources of energy including firewood (48.4 per cent), charcoal (46.4 per cent) and paraffin (0.5 per cent) for cooking. Battery-powered, solar, and mobile phone torches were used by 44.3 per cent of the households, and over a third (38 per cent) used electricity for lighting. Straw, paraffin and firewood for lighting were each used by around 1 per cent. Only a few respondents used electricity, a cleaner source of energy for cooking. Although the majority of respondents of all income levels relied on unclean sources of energy, there were statistically significant relationships between the monthly income of respondents and the type of energy used.
c. Community understanding and perceptions of major risks
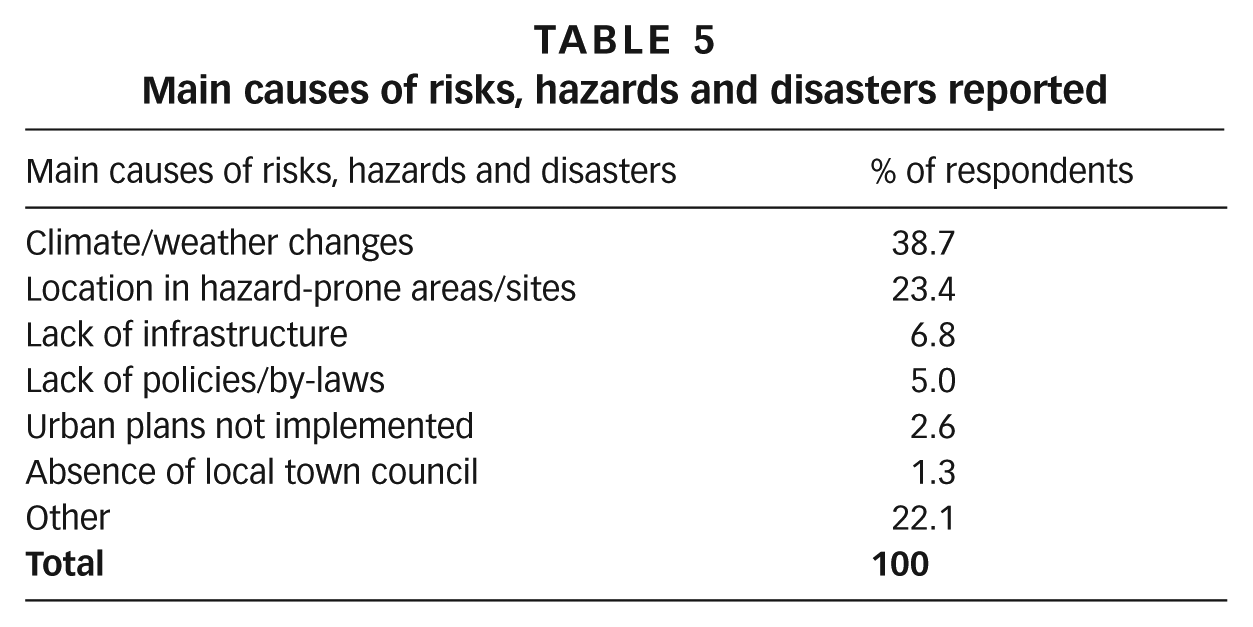
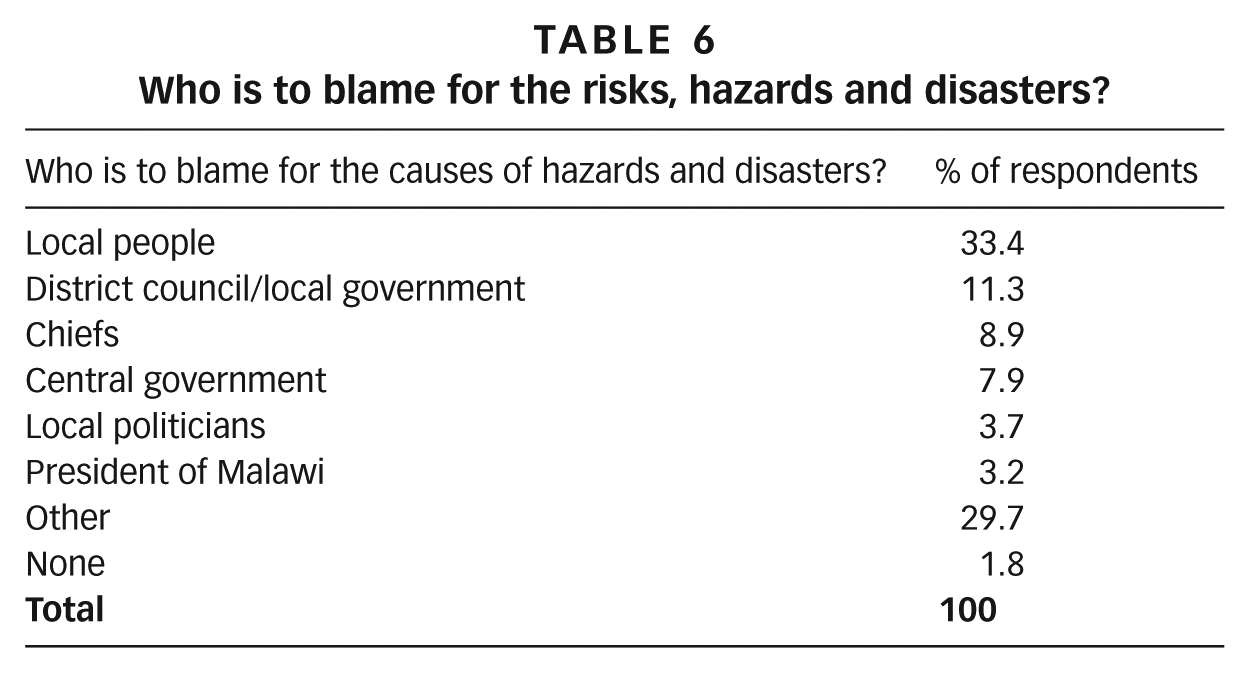
When asked to state the major causes of the risks and who was to blame, respondents answered as indicated in Tables 5 and 6.
Main causes of risks, hazards and disasters reported
Who is to blame for the risks, hazards and disasters?
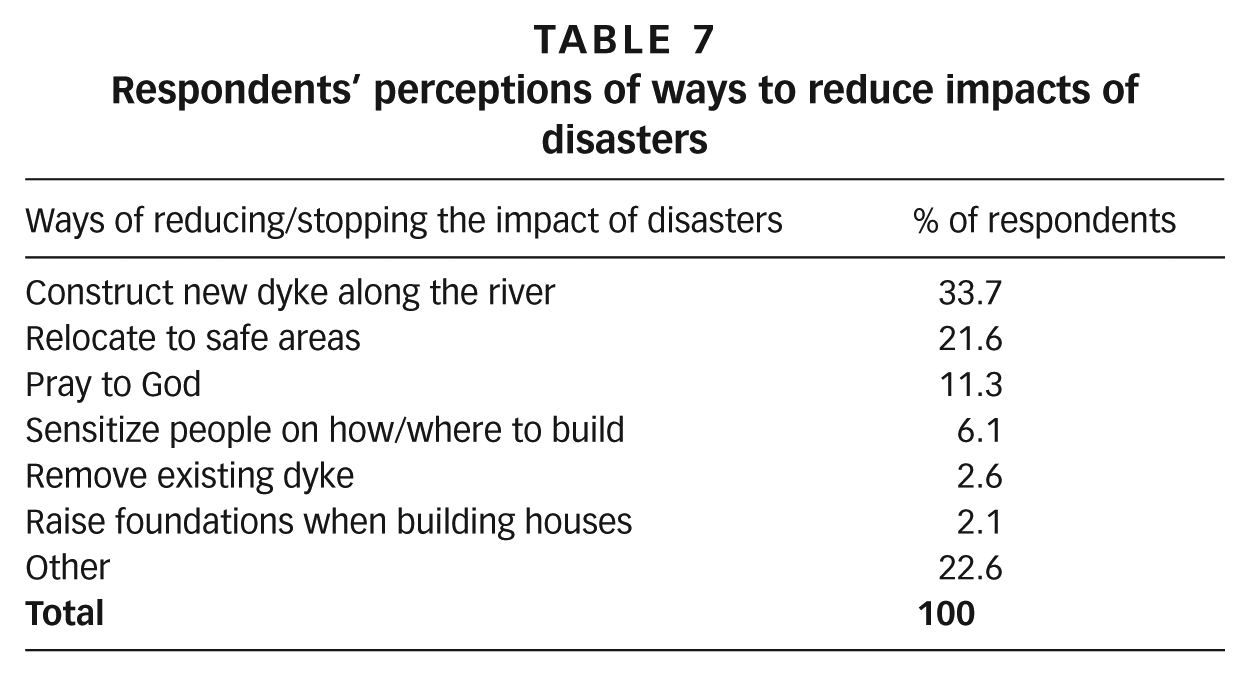
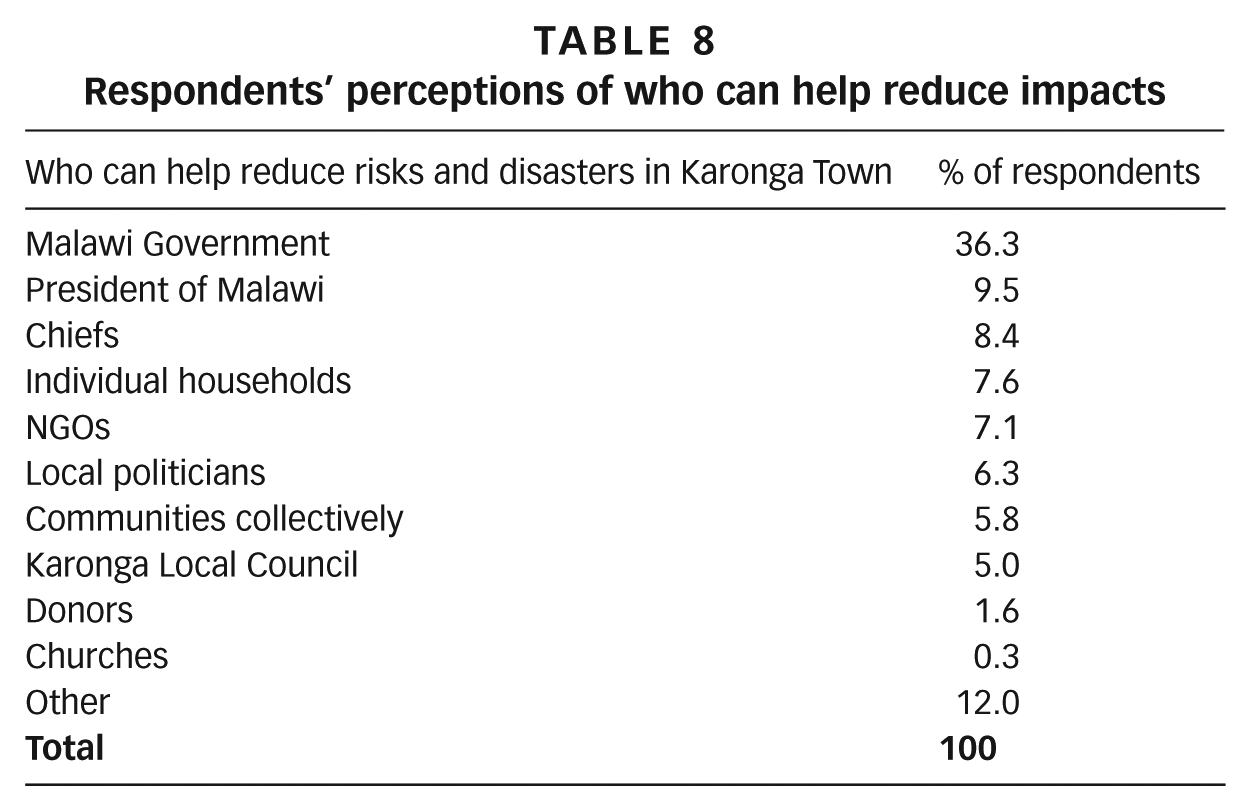
Questions about ways to reduce these impacts, and who might help, yielded the information presented in Tables 7 and 8.
Respondents’ perceptions of ways to reduce impacts of disasters
Respondents’ perceptions of who can help reduce impacts
Up to 54.2 per cent of the respondents were willing to relocate from disaster-prone areas, provided they were given alternative land (47.1 per cent) or compensation packages (15.2 per cent) and a guarantee that no one would take their land (4.9 per cent). The most common reason given by the 45.8 per cent who were not willing to relocate was being used to the area (67.2 per cent). They also mentioned having no other land to move to (6.8 per cent), fear of thieves stealing crops (8.5 per cent), ancestors being buried in the area (6.2 per cent), not wanting to be strangers in new places (2.3 per cent) and relying on the land for their livelihoods (2.8 per cent).
More than half the respondents (51.6 per cent) felt that Karonga Local Council was not effective in responding to risks. This was seen as the result of a number of problems including inadequate funding, lack of legislation on disaster risk management, lack of monitoring and evaluation systems, customary land tenure practices in which chiefs wield more authority than the local council, and lack of data for making informed decisions.
Several stakeholders were reported to support the communities during disasters through distribution of relief items, either sourcing and distributing items directly or working through the local council. The institutions listed included NGOs/civil society organizations (18.2 per cent), council staff (17.9 per cent), central government staff (9.2 per cent), local politicians (2.3 per cent), international organizations (4.9 per cent) and chiefs/community leaders (30.9 per cent). Chiefs are delegated to distribute the relief items by some organizations, owing to the authority they wield in the community that can ensure chaos-free distribution. While 18.5 per cent of the respondents reported not having received relief, for those who accessed it, the relief items were primarily food (47.4 per cent), but also included temporary shelter/tents (13.3 per cent), clothing (1.6 per cent), medicine (3.9 per cent), cash transfers (3.4 per cent) and other types of relief (12 per cent). Many grievances were reported, however, as indicated in Figure 3. Reactions of aggrieved individuals included complaints to officials (46.3 per cent), staged vigils (11.1 per cent), violent protests at relief centres or along streets (5.0 per cent), fighting with other people during relief distribution (4.5 per cent) and boycotting of relief items (3.4 per cent).
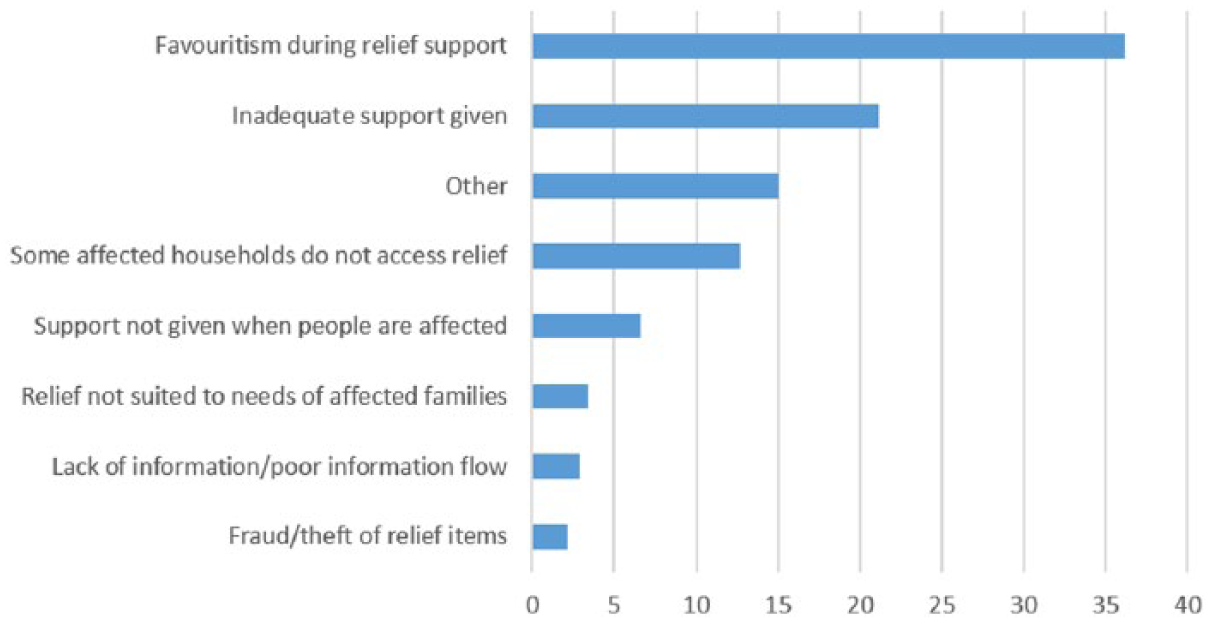
Grievances registered during distribution of relief items
VI. Discussion
Based on the results, key issues can be singled out related to the nature and scale of risks, their spatial distribution, governance and conflict management in Karonga. First, with respect to the nature and scale of risks, one observes a multiplicity of large disasters, small disasters and everyday risks (Table 2). In particular, within a span of seven years, between 2009 and 2016, Karonga experienced floods annually and sometimes more than once a year. In December 2009 four earthquakes of magnitudes 5.4 to 6.0 on the Richter scale were experienced within a span of two weeks. The earthquakes killed four people, and caused damage to many houses, several public buildings and infrastructure (Table 2).
The situation is worsened by everyday risks that arise due to poor access to services. The results of the study indicate serious risks posed by poor-quality water and sanitation. The results show that the use of pit latrines in Karonga remains very high. The 2008 Malawi census showed that 72 per cent of the households in Karonga used traditional pit latrines and 6 per cent used VIP latrines;(35) this study showed a gradual shift towards VIPs, with 51.1 per cent still using traditional pit latrines and 27.9 per cent using VIPs. What is worrisome is that about 8 per cent of the households still have no toilets of their own (i.e. they practise open defecation or use neighbours’ toilets).
As shown in Figure 2, 9.8 per cent of the population rely on unsafe water from boreholes, rivers and Lake Malawi, indicating a small decline from the 13 per cent reported in the 2008 census. The safety of communal water point (CWP) use has been questioned because of poor handling and storage.(36) Therefore, it is not surprising that WASH-related diseases such as diarrhoeal disease (6.1 per cent) and cholera (18.7 per cent) were prevalent (Table 9). Six cholera-related deaths were recorded in 2016, the main cause being drinking unsafe water from the lake.(37) Yet fewer than 0.5 per cent of respondents perceived unsafe water to be a concern.
WASH and energy access in Karonga Town
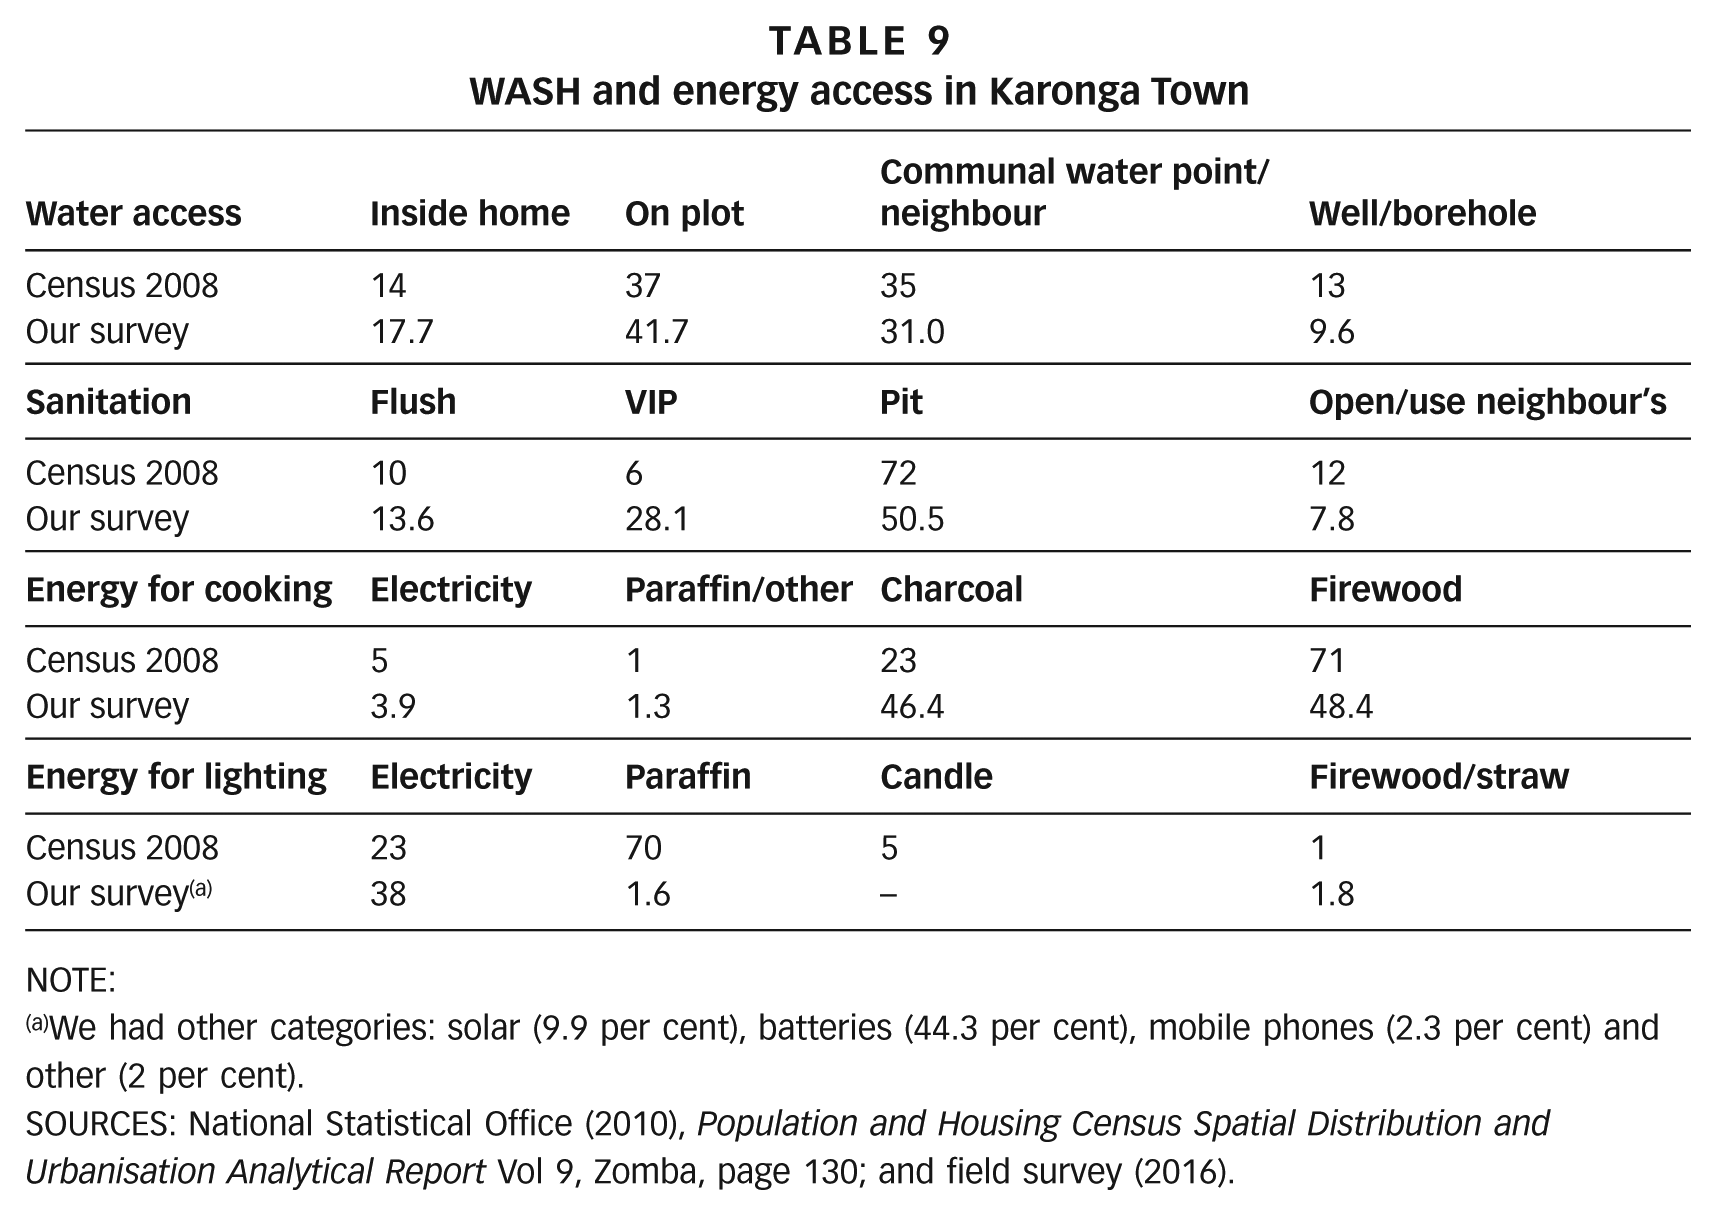
NOTE:
We had other categories: solar (9.9 per cent), batteries (44.3 per cent), mobile phones (2.3 per cent) and other (2 per cent).
SOURCES: National Statistical Office (2010), Population and Housing Census Spatial Distribution and Urbanisation Analytical Report Vol 9, Zomba, page 130; and field survey (2016).
Additional everyday risks arise from wide usage of dirty fuel sources that are known to cause indoor air pollution, long recognized as contributing to eye and respiratory infections.(38) Specifically, the finding that 95.2 per cent used dirty fuels hardly differs from the 2008 national census result of 94 per cent (Table 9). These figures are a matter not only of access, but also of cost and the frequent blackouts caused by generation inefficiencies.(39) Despite 21 per cent of homes countrywide being within 100 metres of electricity lines, only 7 per cent had electricity in their homes.(40)
The impacts on health and the natural environment can be expected. Indoor air pollution has been described as a silent and neglected killer of children, poor women and girls.(41) In Karonga, hospital data indicate that acute respiratory infections are among the major causes of death (13 in 2012 and 32 in 2014). However, a general trend is towards cleaner technologies. The use of paraffin for lighting by 70 per cent of households in Karonga in 2008, according to the census, contrasts strongly with the 1.6 per cent using it for lighting in our study, and suggests a rapid decline. This might be explained by the adoption of alternative sources such as using solar panels (9.9 per cent), battery-powered bulbs (44.3 per cent) and mobile phones (2.3 per cent). An additional factor is the scarcity and rising costs of petroleum products (and therefore paraffin) experienced in the country in the recent past. However, the use of electricity for lighting also appears to be rising, even if less dramatically – from 23 per cent in the 2008 census to 38 per cent among our study sample.
The second major issue, after the scale of the risks, is their spatial distribution. Although the entire urban area is exposed to the multiple risks (Figure 4), these risks are most prevalent in three specific areas: the informal settlements, the areas along the river and the town centre. The vulnerability of informal settlements and areas along the river can be explained in two ways. In the first place, the informal settlements are mainly on customary land and the houses there are largely of poor quality. The informal settlements have the largest proportion of the population and the greatest concentration of houses in the town, a common feature of the urbanization process in Malawi.(42) Most of the informal settlements grew on the floodplain along the river, along the lakeshore and in flood control drainage channels (Figure 4). These inhabitants face the highest risks because of a combination of factors, including less legal protection arising from inadequate tenure security,(43) the greater exposure to hazards, lack of or blocked drainage, and denial of state service provisioning because they are informal inhabitants. Many of these challenges, as elsewhere in the world, are associated with poorly planned urban development that condemns the poor to occupy areas prone to hazards such as floods.(44) The town centre is vulnerable to annual flooding mainly because it is dammed by the two main roads (one to Chitipa and the other to Mzuzu). Furthermore, flood control channels constructed to channel floodwater out of the town became ineffective because of the lack of maintenance. While earlier work by Manda suggests that the situation was partly a result of absent or weak local government,(45) there is also evidence, from interactions with local leaders and community members, of a lack of knowledge of the scale of risks to which inhabitants expose themselves when settling in areas that are attractive because of the ease of accessing land and fertile soils.
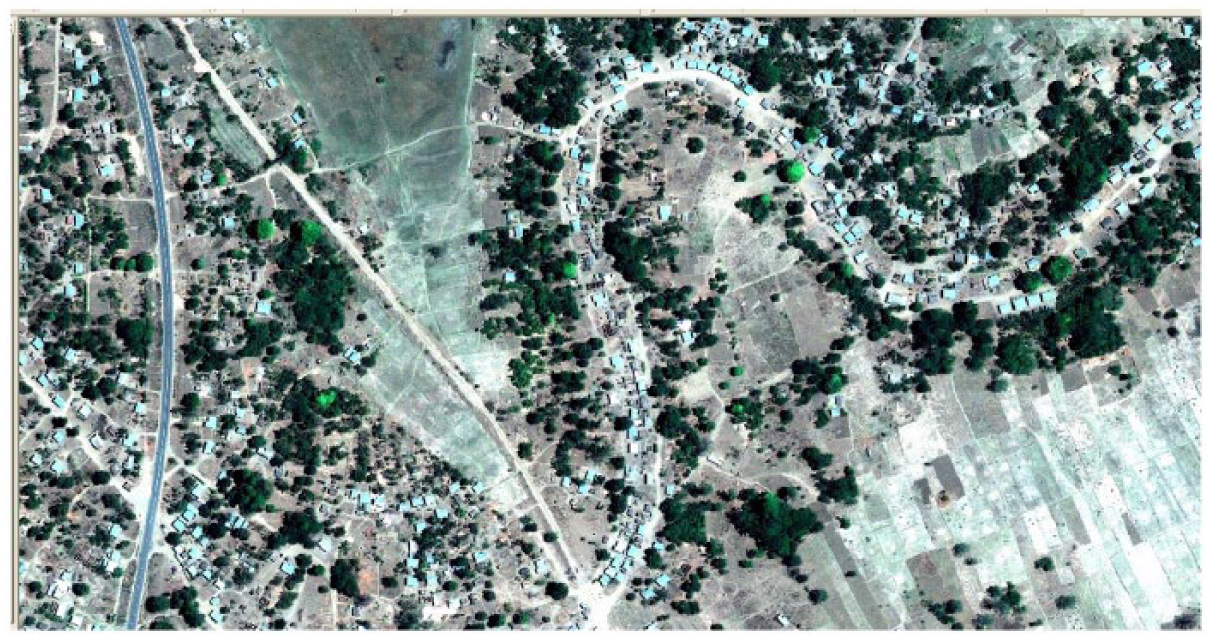
Karonga informal settlements in flood control channels
The third issue is linked to governance in small cities – in particular, how they are impacted by “political games played elsewhere”.(46) In the case of Karonga, the local governance structure, the town council, was dissolved in 2009, leaving the rapidly growing urban settlement under a weak, ill-suited rural council lacking in transparency and unable to cope with the complex nature of Karonga urban life.(47) Absent or weak local governance limits the capacity to respond to risks or to coordinate efforts of stakeholders. Not surprisingly, there is mistrust from communities not only during relief distribution, but also with regard to the effective use of financial resources, leading to frequent protests.(48)
Finally, there are issues relating to conflict management. In the aftermath of disaster, conflicts arise over how assistance is allocated and distributed.(49) The major grievances revealed by this study include support not being given at the right time, favouritism, fraud and theft of relief items, and affected households not accessing relief items (Figure 3). Grievances can increase with the unequal distribution of humanitarian aid.(50) Households react violently – fighting, boycotting relief items, demonstrating and staging vigils. The situation gets worse when politicians seek favours by selecting recipients.
VII. Conclusion
This study has highlighted a number of issues for improving understanding of the nature and scale of risks threatening lives, health and livelihoods in Karonga. These include everyday risks and disaster risks at a range of scales (both intensive and extensive risks). Risks range from floods and earthquakes, to unsafe sanitation and poor drinking water quality. These risks vary between formal and informal settlements and are based on the quality of housing. These risks are higher among low-income households and are worsened by the limited capacity of the local government and its failure to address the underlying causes of its incapacity, linked to failed devolution, weak urban planning and customary land tenure. Knowledge of the risks, their nature and their scale could create the basis for capacity building at both the community and local government levels. Getting a more complete picture for any urban centre of the full spectrum of risks and who is most at risk is key to more effective action. It also highlights where risk reduction is needed and possible – for large disasters, for small disasters and for everyday hazards.
Footnotes
Acknowledgements
This work is part of the Urban ARK Research Project funded by the UK Department for International Development (DFID)/Economic and Social Research Council (ESRC). We thank the following for their contribution in various forms: (a) Wisdom Bwanali, Masozi Gondwe, Jean Kaunda, Chrispin Mphande, Dominic Kamlomo, Orton Msiska and James Kushe of Mzuzu University; (b) community research counterparts from Karonga Town; and (c) Faith Manda and Khumbo Kumwenda for data entry.
1.
UN (2015), Sustainable Development Goals, United Nations Development Programme, page 18, available at ![]() .
.
2.
Adelekan, I, M Manda, B Mberu, M Pelling and J Vivekananda (2015), “Disaster risk and its reduction: An agenda for urban Africa”, International Development Planning Review Vol 37, No 2, pages 33–43.
3.
Urban ARK is an international research initiative that is aimed at reducing disaster risks in urban areas in sub-Saharan Africa through breaking risk accumulation cycles. The initiative is sponsored by the Economic and Social Research Council (ESRC) together with the Humanitarian Innovation and Evidence Programme of the United Kingdom’s Department for International Development (DFID). The initiative involves four linked work programmes (WPs), each of which is designed to widen our present-day theoretical and experiential knowledge and understanding of risks, as well as means of reducing them from multiple perspectives, while filling the main knowledge, evidence and data gaps related to these. Each WP also incorporates an understanding of the role of organizations, infrastructure and the environment in shaping risks and affecting pathways for resilience. See ![]() .
.
4.
Lwasa, S (2010), “Adapting urban areas in Africa to climate change: the case of Kampala”, Current Opinion in Environmental Sustainability Vol 2 No 3, pages 166–171.
5.
Simon, D (2014), “New evidence and thinking on urban environmental change challenges”, International Development Planning Review Vol 36, No 2, pages v–xi; also Wisner, B, M Pelling, A Mascarenhas, A Holloway, B Ndong, P Faye, J Ribot and D Simon (2015), “Small Cities and Towns in Africa: Insights into Adaptation Challenges and Potentials”, in S Pauleit, G Jorgensen, S Kabisch, P Gasparini, S Fohlmeister, I Simonis, K Yeshitela, A Coly, S Lindley and W J Kombe (editors), Urban Vulnerability and Climate Change in Africa, Springer, New York; and Roberts, D and S O’Donoghue (2013), “Urban environmental challenges and climate change action in Durban, South Africa”, Environment and Urbanization Vol 25, No 2, pages 299–319.
6.
Osuteye, E, C Johnson and D Brown (2016), “The data gap: An analysis of data availability on disaster losses in sub-Saharan African Cities”, Urban ARK Working Paper 11, available at ![]() .
.
7.
Cross, J A (2001), “Megacities and small towns: different perspectives on hazard vulnerability”, Environmental Hazards Vol 3, No 2, pages 63–80.
8.
UN (2011), Population Distribution, Urbanization, Internal Migration and Development: An International Perspective, Department of Economic and Social Affairs, New York; also Satterthwaite, D (2016), “Background Paper: Small and Intermediate Urban Centres in Sub Saharan Africa”, Urban ARK Working Paper 6.
9.
See reference 7.
11.
Mitlin, D and D Satterthwaite (2013), Urban Poverty in the Global South: Scale and Nature, Routledge, London, page 143.
12.
Bull-Kamanga, L, K Diagne, A Lavell, E Leon, F Lerise, H MacGregor, A Maskrey, M Meshack, M Pelling, H Reid, D Satterthwaite, J Songsore, K Westgate and A Yitambe (2003), “From everyday hazards to disasters: the accumulation of risk in urban areas”, Environment and Urbanization Vol 15, No 1, pages 193–204.
13.
14.
Dodman, D, K Soltesova, D Satterthwaite, C Tacoli and C Jack (2015), Understanding the Assessment and Reduction of Vulnerability to Climate Change in African Cities: A Focus on Low-Income and Informal Settlements, Agence Française de Développement.
15.
18.
For a discussion on this see Kalipeni, E (1997), “Contained urban growth in post independence Malawi”, East African Geographical Review Vol 19 No 2, pages 49–66.
19.
20.
Manda, M (2016), Rural Growth Centres as a tool for rural development: Case of Jenda, Local Development Fund (LDF), Lilongwe.
21.
Chasukwa, M, A L Chiweza and M Chikapa-Jamali (2013), “Public Participation in Local Councils in Malawi in the Absence of Local Elected Representatives- Political Elitism or Pluralism?”, Journal of Asian and African Studies, 16 pages, available at https://www.academia.edu/12283679/Public_Participation_in_Local_Councils_in_Malawi_in_the_Absence_of_Local_Elected_Representatives_Political_Eliticism_or_Pluralism; also ![]() , Malawi Urban Profile, Nairobi.
, Malawi Urban Profile, Nairobi.
22.
Manda, M (2014), “Where there is no local government: addressing disaster risk reduction in a small town in Malawi”, Environment and Urbanization Vol 26, No 2, pages 586–599.
24.
27.
Dodman, D, D Brown, K Francis, J Hardoy, C Johnson and D Satterthwaite (2013), “Understanding the nature and scale of urban risk in low and middle income countries and its implications for humanitarian preparedness, planning and response”, Human Settlements discussion paper, International Institute for Environment and Development, 89 pages.
29.
Face validity is apparent validity, as perceived by observers. Content validity is a more rigorous form of validity, which establishes whether a measure fully represents a particular condition.
30.
APHA, AWWA and WEF (2011), Standard Methods for the Examination of Water and Wastewater, 22nd edition, American Public Health Association, American Water Works Association and Water Environment Federation, New York; also ![]() , Guidelines for Borehole and Shallow Well Water Quality Specifications, MS 733:2005, Malawi Bureau of Standards, Blantyre.
, Guidelines for Borehole and Shallow Well Water Quality Specifications, MS 733:2005, Malawi Bureau of Standards, Blantyre.
31.
See reference 26, page 23.
33.
De Soto, H (2000), The Mystery of Capital: Why Capitalism Triumphs in the West & Fails Everywhere Else, Basic Books, New York.
34.
36.
Manda, M (2009), “Water and sanitation in urban Malawi: Can the Millennium Development Goals be met? A study of informal settlements in three cities”, Human Settlements working paper, International Institute for Environment and Development, London, 87 pages.
38.
Berglund, B, B Brunekreef, H Knoppel, T Undvau, M Maron, L Mblhave and P Skov (1991), Effects of Indoor Air Pollution on Human Health, Report 10, Commission of European Communities, Luxembourg.
39.
See reference 15, National Statistical Office (2010), pages 54–58; also Taulo, J L, K J Gondwe and A B Sebitosi (2015), “Energy supply in Malawi: options and issues”, Journal of Energy in Southern Africa Vol 26, No 2, pages 19–32; and Kambewa, P and L Chiwaula (2010), “Biomass energy use in Malawi”, Background paper, International Institute for Environment and Development, London.
40.
See reference 26, page 123.
41.
UN-Habitat (2008), cited by Chant, S (2013), “Cities through a gender lens: a golden urban age for women in the global South?”, Environment and Urbanization Vol 25, No 1, pages 9–29.
43.
Dodman, D, J Hardoy and D Satterthwaite (2009), Urban development and intensive and extensive risk, Contribution to the Global Assessment Report on Disaster Risk Reduction, International Institute for Environment and Development, London.
44.
See reference 13, page 90.
45.
See reference 22.
47.
See reference 22.
48.
Kumwenda, T (2016), “Police arrest 7 Karonga council officials over K57mil scam”, Nyasa Times, 14 September, available at ![]() .
.
50.
As noted by Harris, K, D Keen and T Mitchell (2013), When disasters and conflicts collide: Improving links between disaster resilience and conflict prevention, Overseas Development Institute, London.
References
Supplementary Material
Please find the following supplemental material available below.
For Open Access articles published under a Creative Commons License, all supplemental material carries the same license as the article it is associated with.
For non-Open Access articles published, all supplemental material carries a non-exclusive license, and permission requests for re-use of supplemental material or any part of supplemental material shall be sent directly to the copyright owner as specified in the copyright notice associated with the article.