
Abstract
This field note examines the disaster risk construction process in Lima, Peru. More commonly experienced hazard contexts are considered in the light of the COVID-19 pandemic. We provide an empirical analysis based on Lima-wide data and using findings from a single case study settlement to illustrate more general conclusions. We attempt to reveal how exposure and vulnerability factors signify that very different hazards, including COVID-19, predominantly affect the same population groups. Underlying causes and drivers, all related to different expressions of urban inequality, include problems of access to suitable urban land, land trafficking and invasion, State exclusion from social housing and basic services, unsafe building practice and corruption. The research confirms the usefulness of a social construction approach to disaster risk, based on the notion of underlying causes and drivers, and the need to reconfigure urban planning processes, breaking sector silos and encouraging integrated intersectoral and interspatial approaches.
I. Introduction
Exposure to physical hazards and the associated disaster risk and disaster(1) are initially spatially circumscribed. The occupancy of hazard-prone land by different population strata, types of economic activity and infrastructure, along with the density of such occupancy, is often the starting point for conventional population- and asset-based disaster risk equations. Vulnerability of population, economy and infrastructure complete the disaster formula, establishing levels of risk. Conventional asset-based risk is accompanied by systemic risk, whereby the risk and associated damage to population and assets have repercussions in other areas, populations and livelihoods, from local to international levels.(2)
Exposure refers to the location of communities, housing, businesses and infrastructure in areas prone to the impacts of natural, biological, technological and anthropic hazards. These may, through unsustainable use of the environment (deforestation, mangrove cutting, mining of slopes for access to building materials, etc.), induce new socio-natural hazards, generated at the intersection of human practices and environment, and leading to degradation. Better-known physical hazards such as flooding, landslides, earthquakes and land subsidence are spatially bounded by the scale and intensity of the event. Exposure to biological hazards, determined by human and animal behaviour and movement, have no such spatial limits, and could in theory be general and worldwide if adequate and rapid actions are not taken to stop the spread, as was the case with COVID-19.
Exposure is the most obvious and necessary first step in the construction of disaster risk. For disaster risk to be possible, population, assets or infrastructure must be exposed to some level of hazard. Damage and loss will in some way be related to such levels, but existing vulnerability, capacities and resilience will finally determine the levels. Consequently, in any study and explanation of disaster risk and disaster, understanding the reasons for exposure is a first critical step, along with understanding the attendant levels of vulnerability, capacities and resilience. Intervention in the driving forces and different expressions of socio-natural, technological and anthropic hazards, exposure, vulnerability and resilience is the essence of prospective and corrective disaster risk reduction (DRR) management.(3)
As city populations swell because of in-migration and natural growth, the occupation of marginal, hazard-prone lands tends to increase. Because of the overall lack of safe land and inaccessible land prices, this occupation may include not only the poorest but also lower-middle class groups.
Living in environmentally insecure places and suffering poverty, exclusion and marginalization often signify a lack of formal recognition by government and of access to government resources and service provision. This exclusion is accentuated when local or national governments prohibit new service provision and public investment in areas already occupied (many times government-condoned) but deemed to be “risk unmitigable”. On the other hand, many local governments supply urban services to communities in unsafe, hazard-prone areas for political and electoral gain, thus institutionalizing risk.
The disaster risk “initiated” by exposure to hazard is directly related to the social and economic conditions of the population, their everyday risk conditions,(4) the lack of access to safe government-owned land (through municipal land banks, for example) and to democratic city planning, service provision and decision-making processes, and the existence of corruption and illegal land marketing. These conditions are the drivers of vulnerability and the lack of resilience. Once located in hazard-prone areas, residents are unable to reduce or control the intrinsically unsafe physical conditions by building in a secure manner or taking advantage of measures that increase post-disaster impact resilience. Encroachment on hazard-prone lands is often accompanied by degradation of the environment in the course of the search for materials for house building or cooking (for example, through extraction from urban slopes and their deforestation or the destruction of coastal mangroves).
Because it results from prior conditions of everyday risk, we conclude that disaster risk is the most vivid expression and indicator of urban inequality, poverty and exclusion. Disaster risk is an endogenously constructed context and process. It is the result of ongoing urban processes relating to urban land use, concentration and densification and to socio-spatial segregation, environmental exploitation, unequal service provision and non-inclusive governance arrangements. Once risk is materialized as disaster, these prior conditions of inequality and exclusion are frequently further exacerbated. Often, a catch-22 situation exists while, at the same time, negative disaster-related effects snowball among affected marginalized communities. Poverty and inequality lead to disaster, and disaster then leads to increased poverty and marginalization.
The present field note examines the disaster risk construction process in Lima Metropolitan Area, the capital and largest city of Peru.(5) More commonly experienced hazard and disaster contexts are considered in the light of experience with the COVID-19 pandemic, a biological hazard-triggered disaster.(6) Research results confirm the usefulness of a social construction approach, based on the notion of underlying causes and drivers, to understand disaster risk. Along with this, results point to the need to reconfigure urban planning processes, breaking sector silos and encouraging integrated intersectoral and interspatial approaches, thus introducing the concern for disaster risk into the DNA of development practice.
From our perspective, concepts and theory on risk and disaster, following a social construction paradigm, are well enough developed to offer a firm basis for research and analysis, and for the postulation and development of more appropriate disaster risk management (DRM) governance arrangements.(7)
What the present field note attempts is much simpler than the construction of concepts and theory but has not been extensively applied to date. Basically, it seeks to provide concrete empirical evidence showing that, no matter what the hazard is, physical or biological, technological or social, the same populations suffer the major consequences as a result of the impact of social exclusion, poverty and marginalization on patterns of exposure and vulnerability. This evidence then confirms that DRM and DRR must be development-based and must take as a central goal the reduction of exposure and vulnerability, breaking down the walls between different development sectors or territorial development agencies and fostering closer collaboration among them.
The research behind the present field note used both quantitative and qualitative techniques. The dominant quantitative investigation, referring to the entire Lima Metropolitan Area, drew on statistics from the National Institute of Statistics and Informatics (INEI) and data-based maps, including those designed for the Lima Metropolitan Plan (MET Plan), those prepared by the National Centre for the Estimation, Prevention and Reduction of Disaster Risk (CENEPRED), and others resulting from independent studies.(8)
The qualitative information, used to illustrate more general conclusions for Lima, was drawn from field visits to the Nicolás de Piérola settlement (see Figure 1). The settlement is located in the Lurigancho-Chosica district, one of 43 districts of Metropolitan Lima, and is crossed by the Quirio ravine (quebrada Quirio), on the right bank of the Rímac River. The location is subject to serious mud and rock flows (huaycos), earthquakes and flooding.
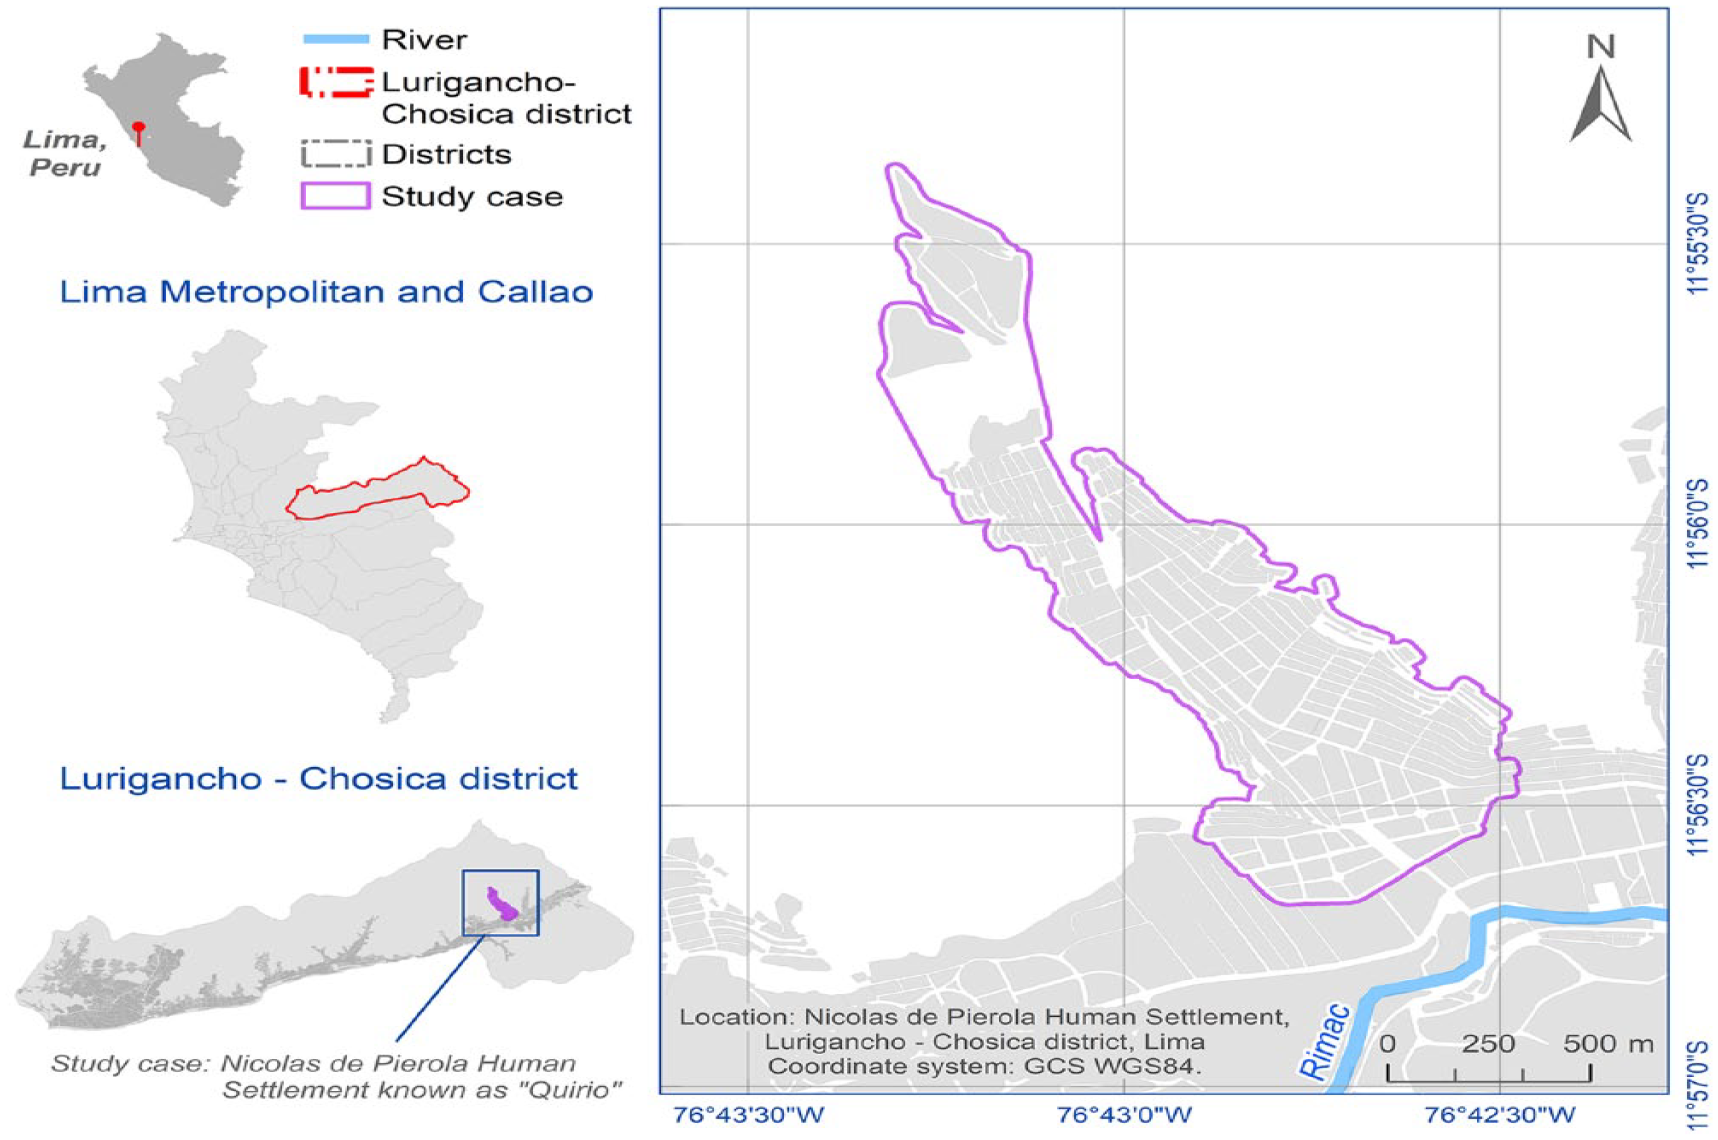
Location of the Nicolás de Piérola settlement
The settlement was established on 8 September 1946, and by 2022 had according to the census a total population of 12,336 inhabitants (the neighbours, however, put the total at 28,000). It is divided into four sectors. Located 850 metres above sea level, most of the year it has a warm, semi-dry climate, which, in the context of COVID-19, limited transmission, reducing the incidence of acute respiratory disease.
Sixteen field trips were carried out between August 2021 and March 2022, and informal conversations were conducted with leaders of the Nicolás de Piérola community, on visits and walks through high-risk areas. The information was systematized, producing community-based risk maps. The analysis of these maps, along with photos and videos, was conducted through open and transparent conversations with the community leaders, with whom conclusions were drawn. The field trips sought to understand a wide-ranging number of facets of the disaster risk problematic and provided only a general, non-quantitative view of problems associated with COVID-19.
The overall research was undertaken within the frame of the Bartlett Development Planning Unit, University College London coordinated global project Knowledge in Action for Urban Equality (KNOW), a project run between 2018 and 2022 and financed by the Global Challenges Research Fund and UK Research and Innovation (UKRI).
II. Land, Housing and Economy
a. Inequality and exclusion
Several decades ago, flat, secure land close to the city centre was available for urban development in Lima (the city centre is delimited in the boxed inset in Figure 2).(9) Today the inexorable, disorderly, chaotic, uncontrolled and socially inequitable growth of the city takes place in more marginal and distant areas, on dangerous slopes crossed by ravines and urban streams, leading to an increase in the construction of high-density, precarious and risky housing and infrastructure. The problem of housing and urban land is a structural problem at the national level.
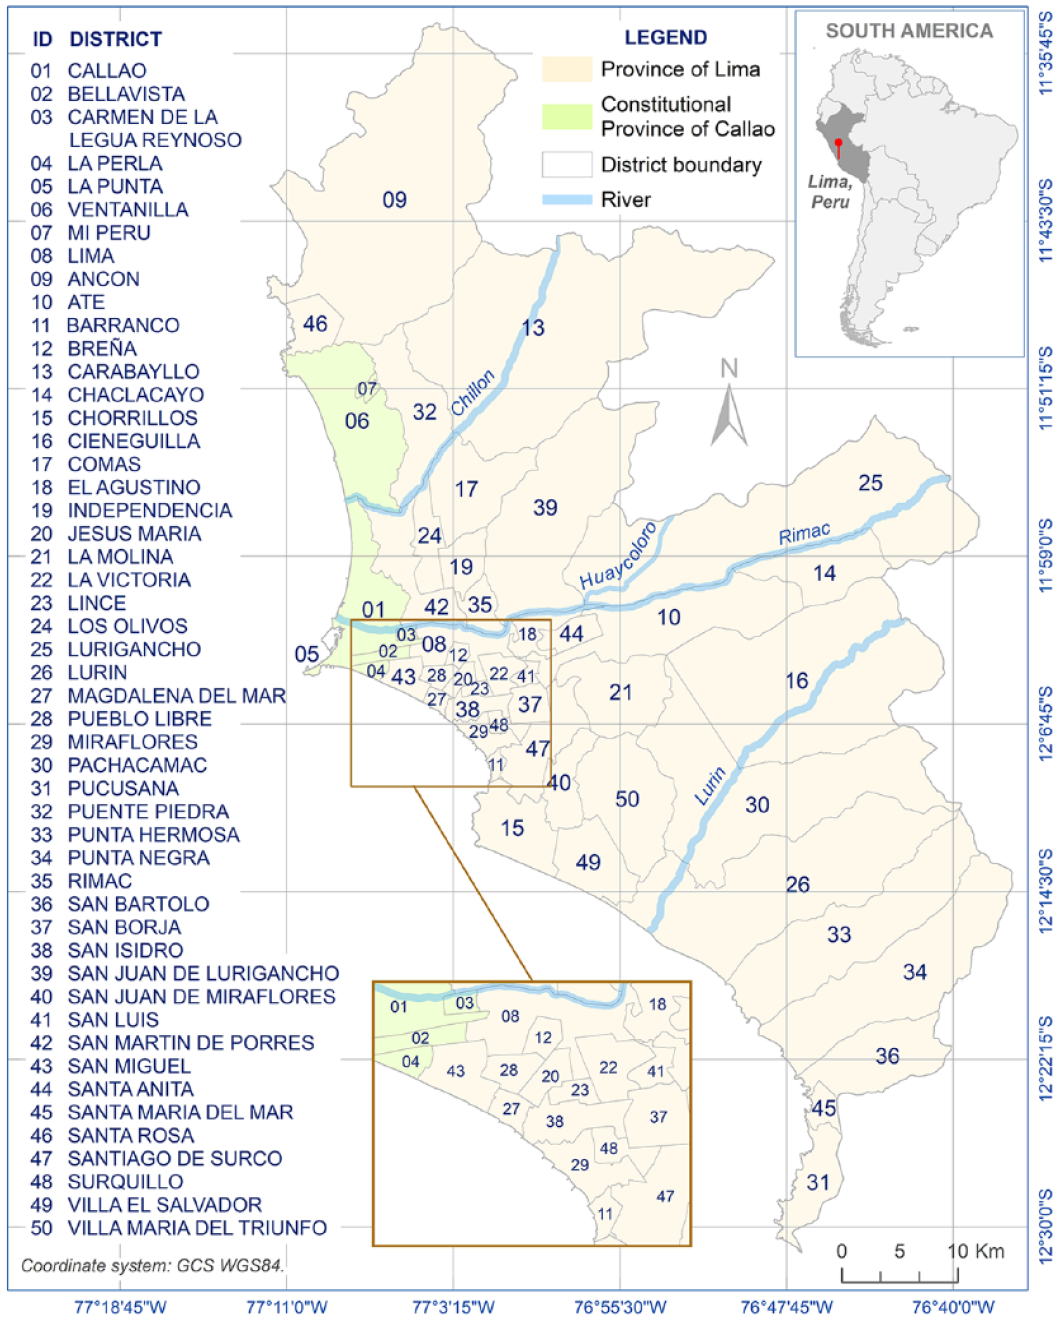
Location map of study area; metropolitan Lima and Callao
State-owned social housing and developable land are scarce, and private sector housing on legally acquired land is increasingly unaffordable, even for the middle class. More and more, land is acquired in the informal and illegal markets, and the demand for housing is satisfied by settling and building on precarious, hazard-prone land. Another prevalent route to land occupancy in precarious areas is through organized or spontaneous land invasions, whereby people illegally occupy abandoned or more marginal areas. The State often represses such illegal occupation and, in many cases, the land invaders are then obliged to occupy even more remote but less controlled areas.
At the national level, over the last two decades, more than 92 per cent of urban expansion has been informal (see Table 1(10)).(11)
Typology of urban expansion in Peru: 2000–2020.
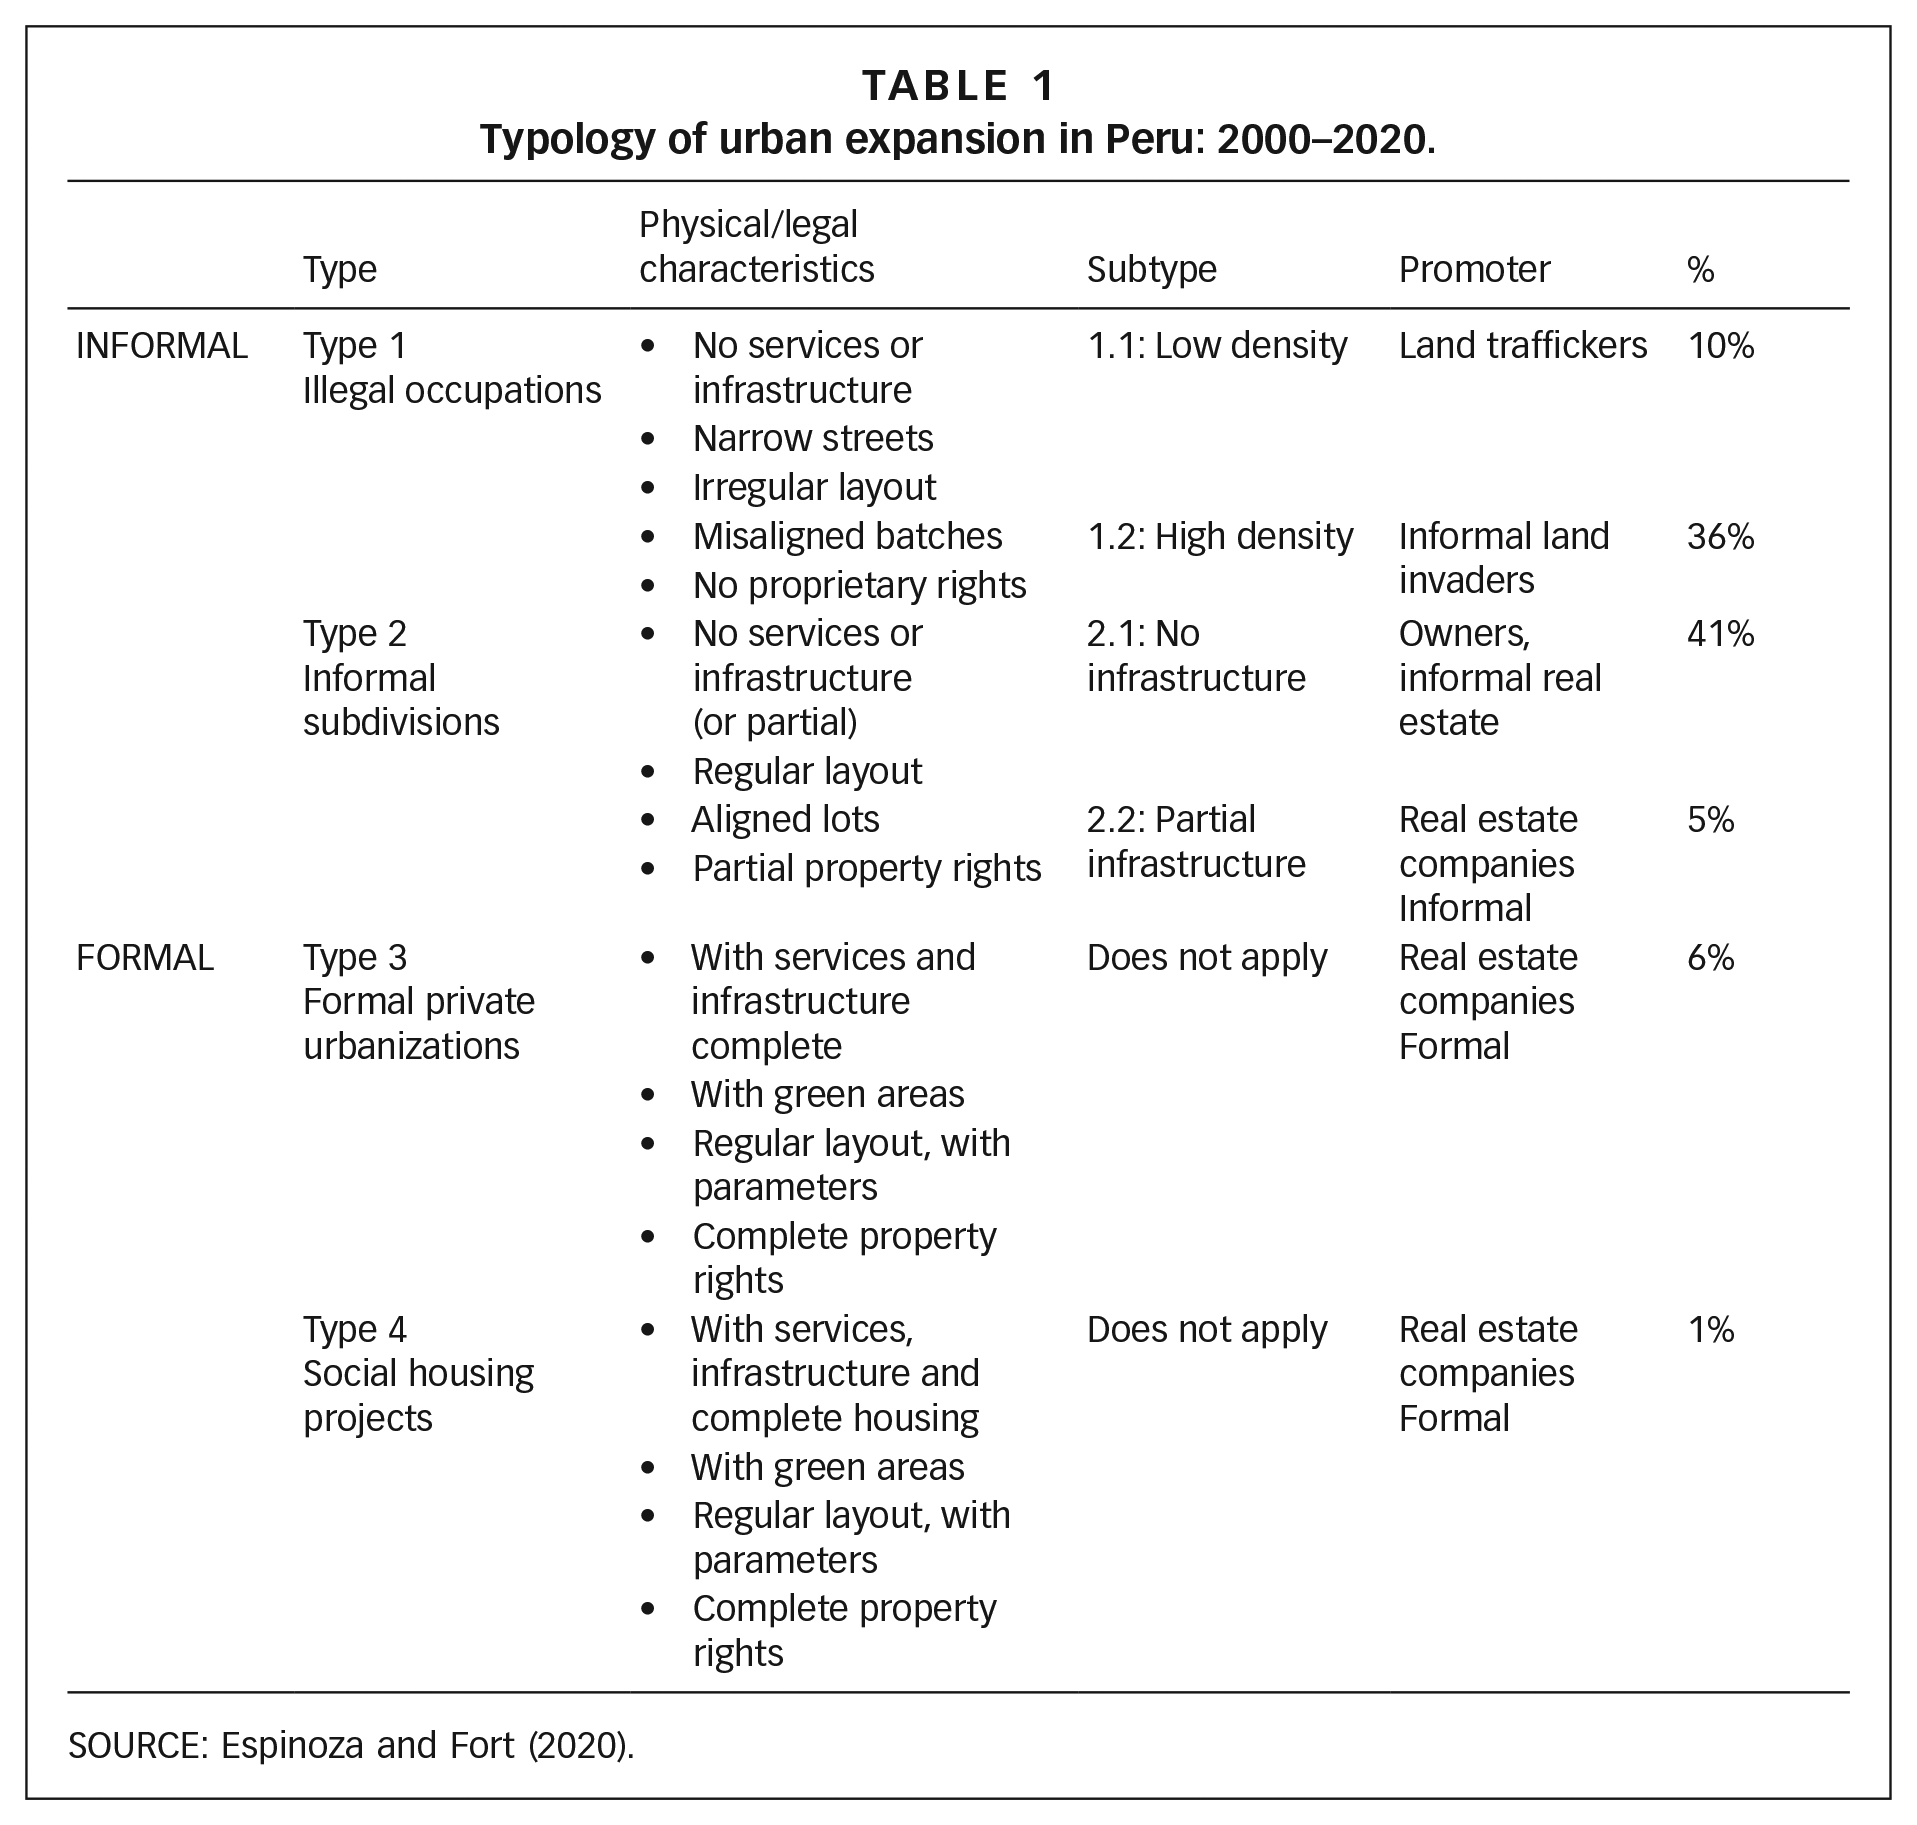
SOURCE: Espinoza and Fort (2020).
The distribution of types of urban settlement has changed dramatically over the last 60 years. Between 1961 and 1979, 47 per cent of growth was through illegal occupation and informal subdivisions – “popular urbanizations”(12) – 48 per cent through private development(13) and five per cent through State-built housing.(14) Between 2000 and 2013, these proportions changed dramatically and 94 per cent comprised “popular urbanizations”, six per cent private and zero per cent State housing.(15) The growth in illegal occupation can be explained by the lack of State-provided alternatives for formal, safe housing.
Figure 3 illustrates how population has settled primarily on the urban periphery. Those areas occupied by low-income families are generally unsuitable for urban occupation and living (“habitability”), as they fail to provide minimum physical and locational conditions for a decent life.(16)
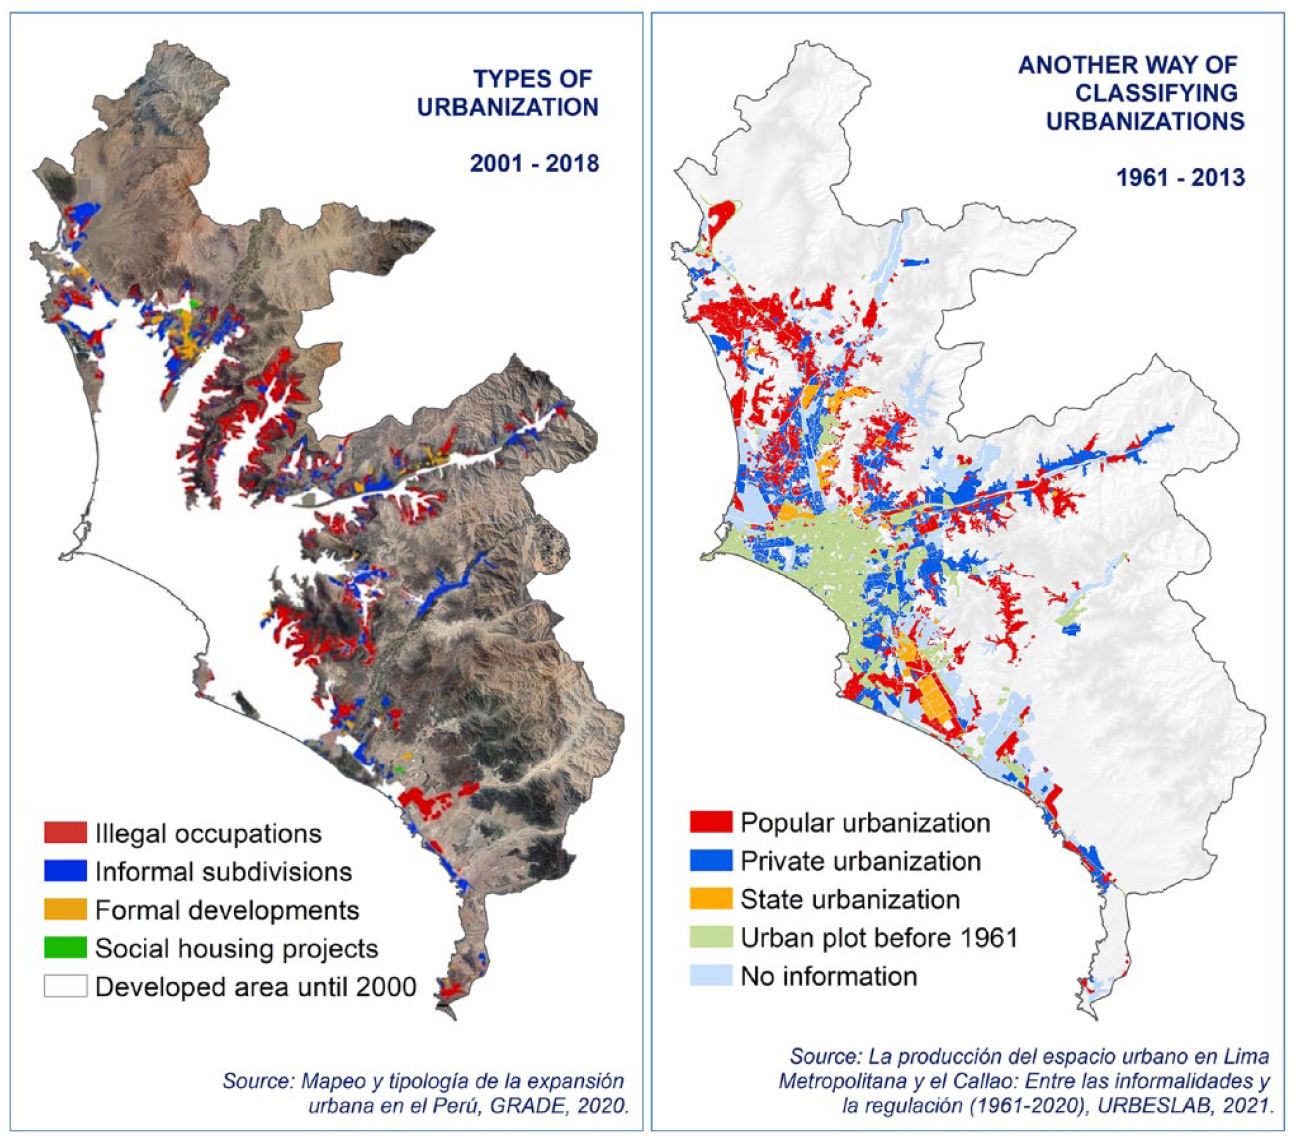
Comparison of urban typologies
In terms of overall national urban growth, the diagnosis supporting the National Housing and Urban Development Policy to 2030 states that “the rates of land occupancy and consumption are high in relation to population growth. The cities with the larger populations have urbanised larger extensions of land in the last decade”.(17) Metropolitan Lima added 907 hectares of urban land per year during the 2009–2018 period, the most experienced by any Peruvian city.(18) This accelerated land occupancy, and the parallel holding of undeveloped land by land mafias has generated speculation and an informal land market to satisfy existing demand.
The MET Plan(19) characterizes land in Lima as urban, developable or non-developable. Urban land is defined in the Plan as currently occupied areas (including the Central Metropolitan Area) and contiguous areas. Developable land is land declared by the MET Plan to be usable for urban purposes in the short, medium and long term. Non-developable land is classified as land not suitable or permissible for urban development and consists of land not included in any of the types mentioned previously. This includes agricultural land, ecological reserves, public recreation land and hazard-prone areas.
According to the Lima–Callao 2035 MET Plan,(20) a large part of the outskirts of Metropolitan Lima and Callao was land considered non-developable. However, as demonstrated in the maps in Figure 3, these lands are precisely those that poorer people have accessed informally over the last decades.
The significant deficit of “habitable” land that leads people to occupy hazard-prone locations is also expressed in the increasing population density, which increases disaster risk enormously. Thus, while the amount of developable land does not increase, the population and its needs for housing and basic services do.
According to Peru’s 2017 Census, the Constitutional Province of Callao (6,815.8 inhabitants/km2) and Metropolitan Lima (3,278.9 inhabitants/km2) experience the highest population densities in the country.(21) Metropolitan Lima and Callao have a long-term average annual overall population growth rate of 1.2 per cent,(22) which fuels a non-fulfilled demand for more social housing.(23) Between 1940 and 1961, a population increase of 3,698,779 was experienced in the country, and Metropolitan Lima and Callao accounted for 1,200,738 of this (32 per cent). In the last intercensal period (2007–2017), the country grew by 1,969,727, and Metropolitan Lima and Callao accounted for 1,086,849 of this growth (55 per cent).(24)
According to the same census, Peru had a housing deficit of 1,856,856 units. Of these, 64.2 per cent comprised existing housing units in need of upgrading and improvement (qualitative deficit); 35.8 per cent, the new housing units required. Lima and Callao had a quantitative housing deficit of approximately 150,000 households and a qualitative deficit of more than 350,000 households. This was an estimated 4.8 per cent and 11.2 per cent, respectively, of the total number of existing private households in Lima and Callao (almost 3 million).
Many areas of the city and their built structures are exposed to similar hazard intensities, but as is the case in our Nicolás de Piérola study area (Photo 1), many buildings are constructed in particularly hazard-prone areas, without technical assistance, and thus tend to be more vulnerable to hazards, transforming hazard exposure into the risk of disaster.
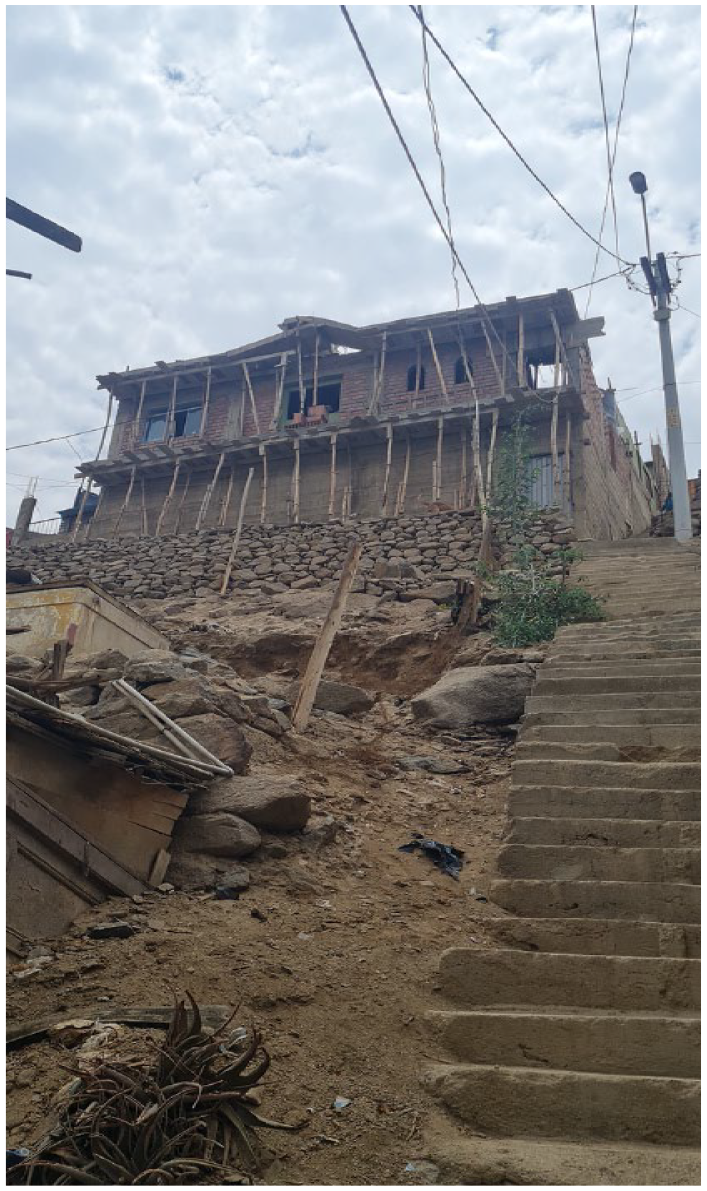
Self-built house with no technical assistance on unstable columns, Human Settlement Association of Nicolás de Piérola in Lurigancho-Chosica
The social, sometimes criminal, process of land grabbing to build homes also has an impact on public spaces. An illegitimate appropriation of public space regularly occurs throughout the Metropolitan Area. Owners, their offspring, or new land invaders appropriate public spaces, including streets, to build their houses, and in the absence of local authorities or at times in collusion with them, whole streets disappear. Neighbours take over the green areas in front of their houses and turn them into garages, and, in other cases, have incorporated electricity poles into the built area of their home (see Photo 2 for an example from Nicolás de Piérola). This situation is further complicated when neighbours occupy areas on which disaster risk protection or mitigation works are being built and find themselves located in the middle of these (Photos 3 and 4 from Nicolás de Piérola).
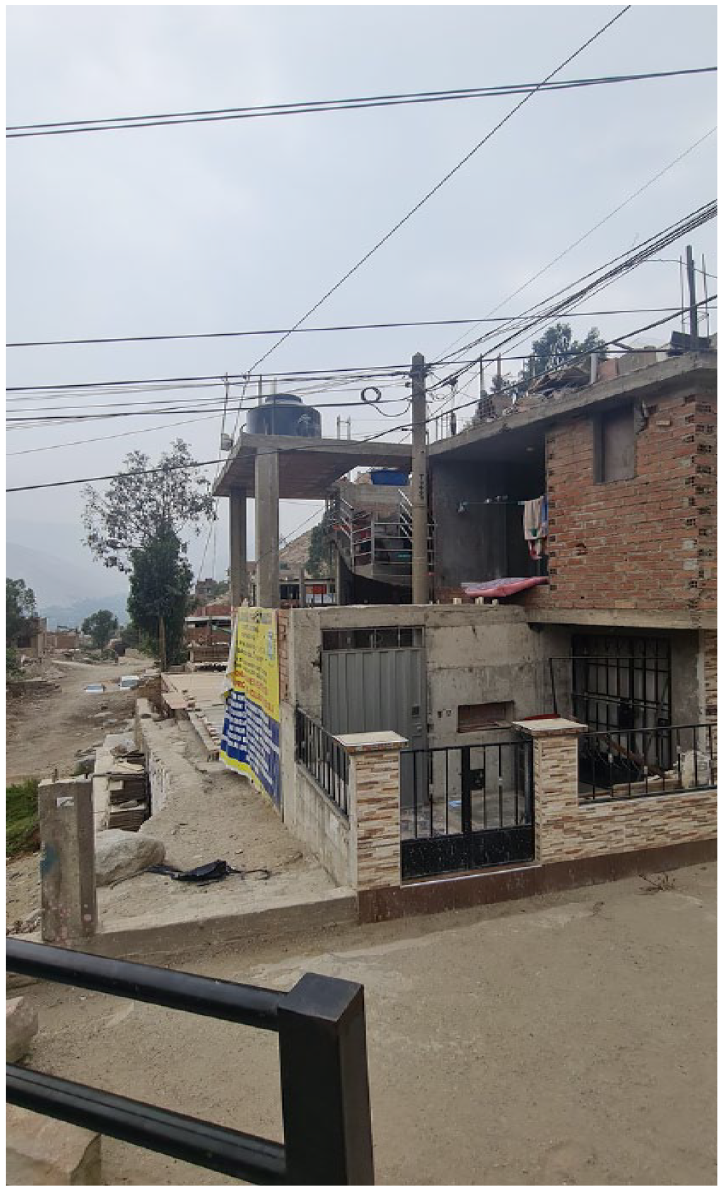
Electric pole incorporated within the built area of the house, Human Settlement Association of Nicolás de Piérola in Lurigancho-Chosica
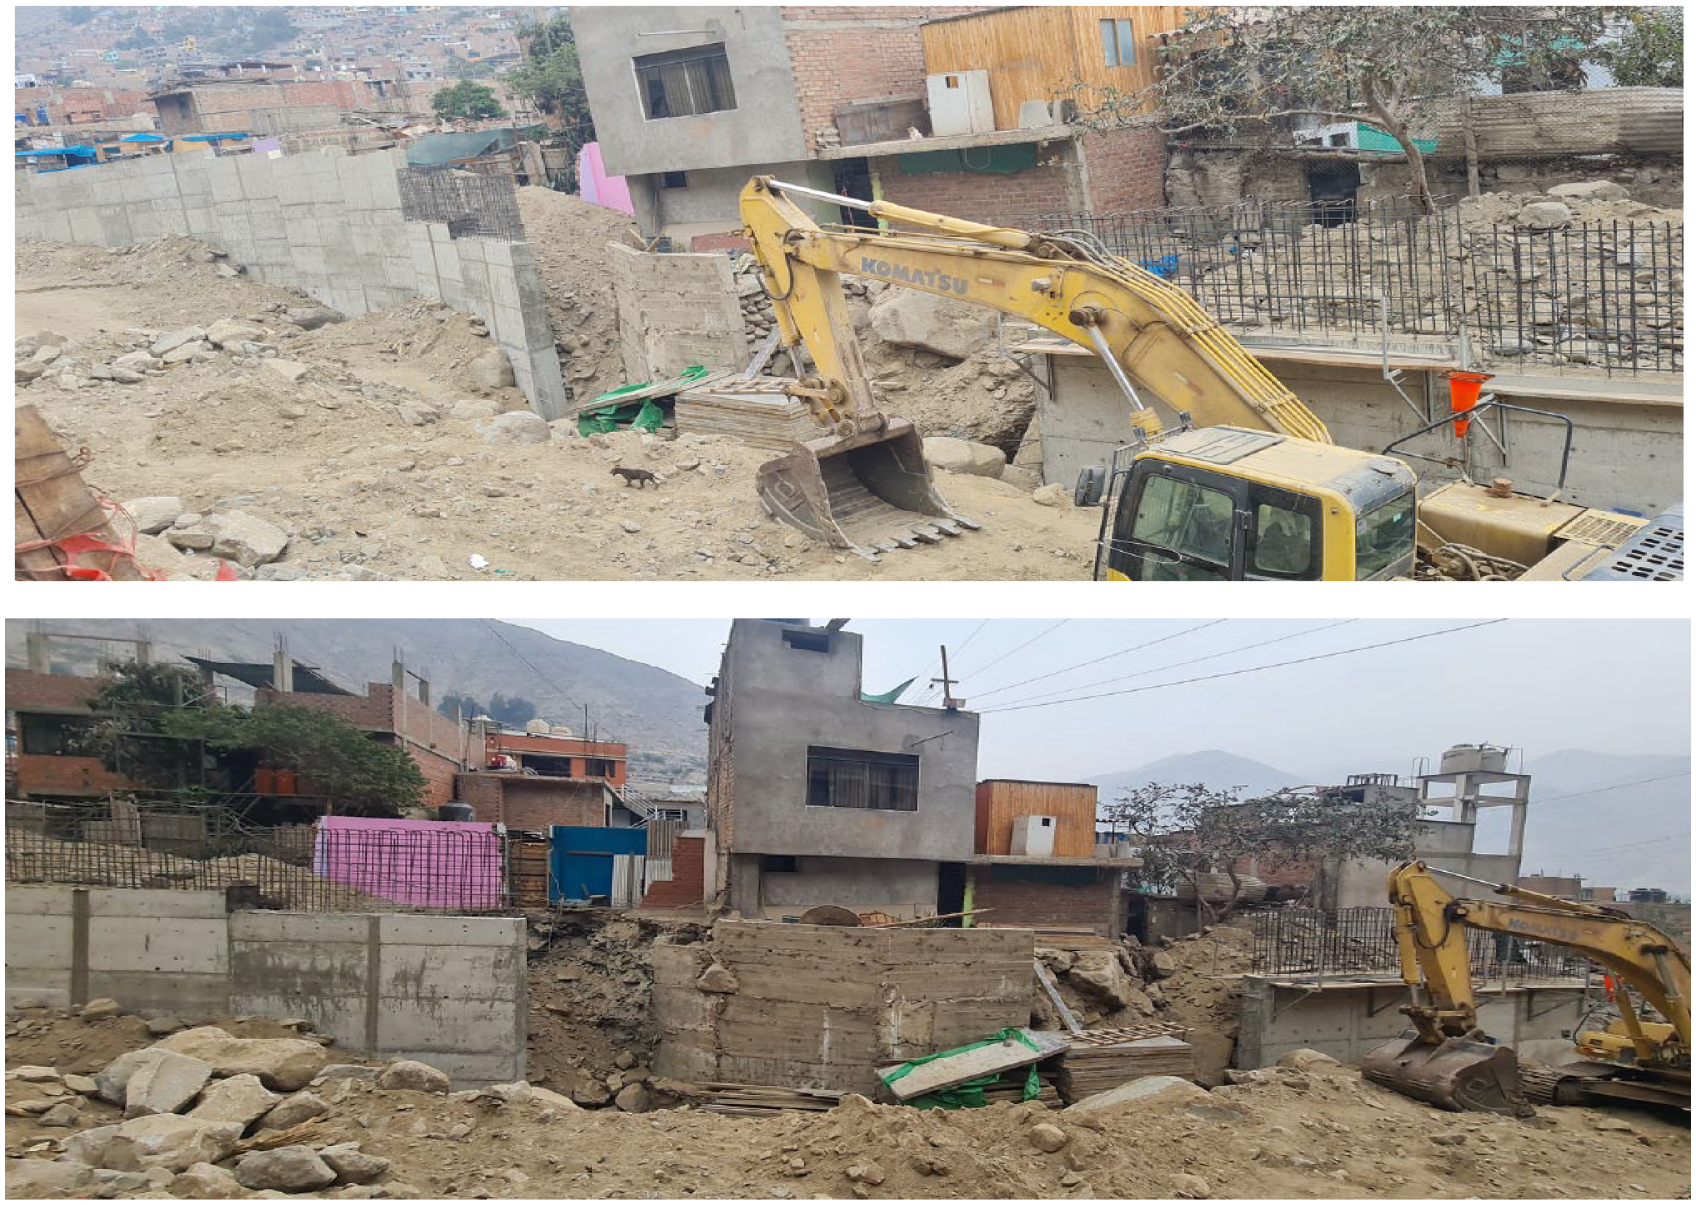
Housing obstructs the construction of the retaining wall on the left bank of the Quirio creek, Nicolás de Piérola Human Settlement Association in Lurigancho-Chosica
A profound social chaos results from the lack of respect for public space or social protection – in Nicolás de Piérola and throughout the Metropolitan area. This is rarely resolved through enforcement of the law. Because there is little dialogue between neighbours, leaders and the authorities themselves, the short-term benefit for a few becomes a public risk for others. Risk is socialized and moral hazard circumstances are prevalent.
Examining the Nicolás de Piérola case more closely we find that the Quirio ravine frequently suffers huaycos (debris flows). Peru’s central highlands experience seasonal rains from December to March, which activate landslides in Nicolás de Piérola (and other proximate areas), affecting the exposed population. But it is extreme rains, often associated with El Niño periods, that produce the most destructive events, as was the case in 2017.
In addition, the ravines have very steep areas with loose material, mainly large rocks, which are at times occupied for building. The area also experiences earthquakes that activate dangerous landslides, affecting the population, housing and basic services. Faced with the scarcity of safe urban land, both homes and basic services are in topographically difficult areas. They occupy steep slopes or gain land through the construction of stone walls or retaining walls, with the homes mounted on top. The weight and pressure of these houses lead to land sliding when heavy rainfall occurs. The national institutions responsible for providing sanitary facilities for the properties require local authorities and residents to provide DRR measures as one of the requirements for this process to be undertaken.
Nicolás de Piérola, as in the case of other settlements, is an area with great technological diversity in the construction of stone walls and retaining walls and hydraulic energy dissipaters for reducing flow. Many of these are technically sound and others not so. Some have already fulfilled their period of useful life and are not properly maintained. Others are new, built as a requisite for legal formalization of their neighbourhood. The landslide channels are often narrowed by the houses themselves and clogged by solid garbage and construction debris.
The KNOW researchers, together with community leaders from Nicolás de Piérola, undertook a field visit to the Quirio ravine on 8 January 2022 to study the damage caused by a magnitude 5.6 earthquake that had occurred the previous day. The quake had an epicentre 19 kilometres northeast of the city of Lima and a depth of 119 kilometres. It produced high levels of ground shaking and generated landslides in the eastern districts of the city with steep slopes, such as San Juan de Lurigancho and Lurigancho. In this context a community leader from Nicolás de Piérola explained the problem of the stone walls, dykes and the clogging of the channels of the huayco, as detailed below:
“We found ourselves standing at the Nicolás de Piérola cemetery, worried after this event . . . our concern was to examine the accumulation of stones in the channel of any possible future huayco . . . this includes not only the accumulation of rocks which possibly fell due to the event but also the accumulation of all the rocks on the riverbed . . . in the background we saw the dynamic meshes [built to stop rocks filling the lower river plain] that resist rocks in an eventual landslide. But below that mesh we see that there is a lot of loose material, rocks, stones along the riverbed. It is urgent to clean up this entire sector, because with an eventual landslide, all this material will be carried to the lower parts. We only have one dam, a dyke that is located in the lower part, about 50 metres from the cemetery. It is the only existing dyke in this channel, the lower part does not have any dykes. What does this mean? A disaster in the lower part, considering that we do not have retaining walls . . . the rocks are a latent danger. We need the authorities, our leaders to undertake an urgent cleaning of this sector.” (Leader of the second zone, Nicolás de Piérola)
During a later field visit to the Quirio ravine, accompanied by neighbours and a civil engineer, who is a member of the KNOW team, an analysis was offered in relation to the pircas (self-constructed walls using unconsolidated techniques):
“We are located at the height of the channel. The main barrier we have here are the self-constructed stone walls. These stone walls are unstable and a threat to the residents. In a seismic event, let’s say, the walls are going to tumble down and once they land up in this channel, they are going to impact the houses below. As the houses have light roofs, they will fall and contribute to the generation of a disaster. This is why we recommend that, on the one hand, the height of the stone wall be reduced and the possibility of building a retaining wall be considered. In any case, the option to add concrete should be considered so that the stone walls hold together. On the other hand, a retaining wall should be built to protect the houses in the lower parts of the ravine.” (Interview with civil engineer, KNOW project team member)
b. More common disaster risk and hazards
The most populous districts in Peru are in the eastern and northern areas of Lima, comprising the districts of San Juan de Lurigancho and San Martín de Porras, the first with more than one million inhabitants and the second with just under a million. The poorest and the most vulnerable families have built their homes here on mudslides, in rockfall gullies or on the flood plains and dejection cones of the Rímac and Chillón rivers. They are constantly affected by hazard events.
The southern districts of the city (including Villa El Salvador in particular) are those most exposed to seismic hazards, due to the low resistance capacity of the soils to seismic movement. The districts of the middle and lower basin of the Lurín River (including Cieneguilla, Lurín and Pachacamac) are the most exposed to flooding. All coastal districts are exposed to tsunamis, especially the district of La Punta, which is a peninsula.
Analysis of Figure 4 confirms that the outskirts of Lima are simultaneously unsuitable for urban development but out of control in terms of urban occupation due to illegal land trafficking. Informally occupied areas are also areas experiencing the highest hazard and socially constructed risk.
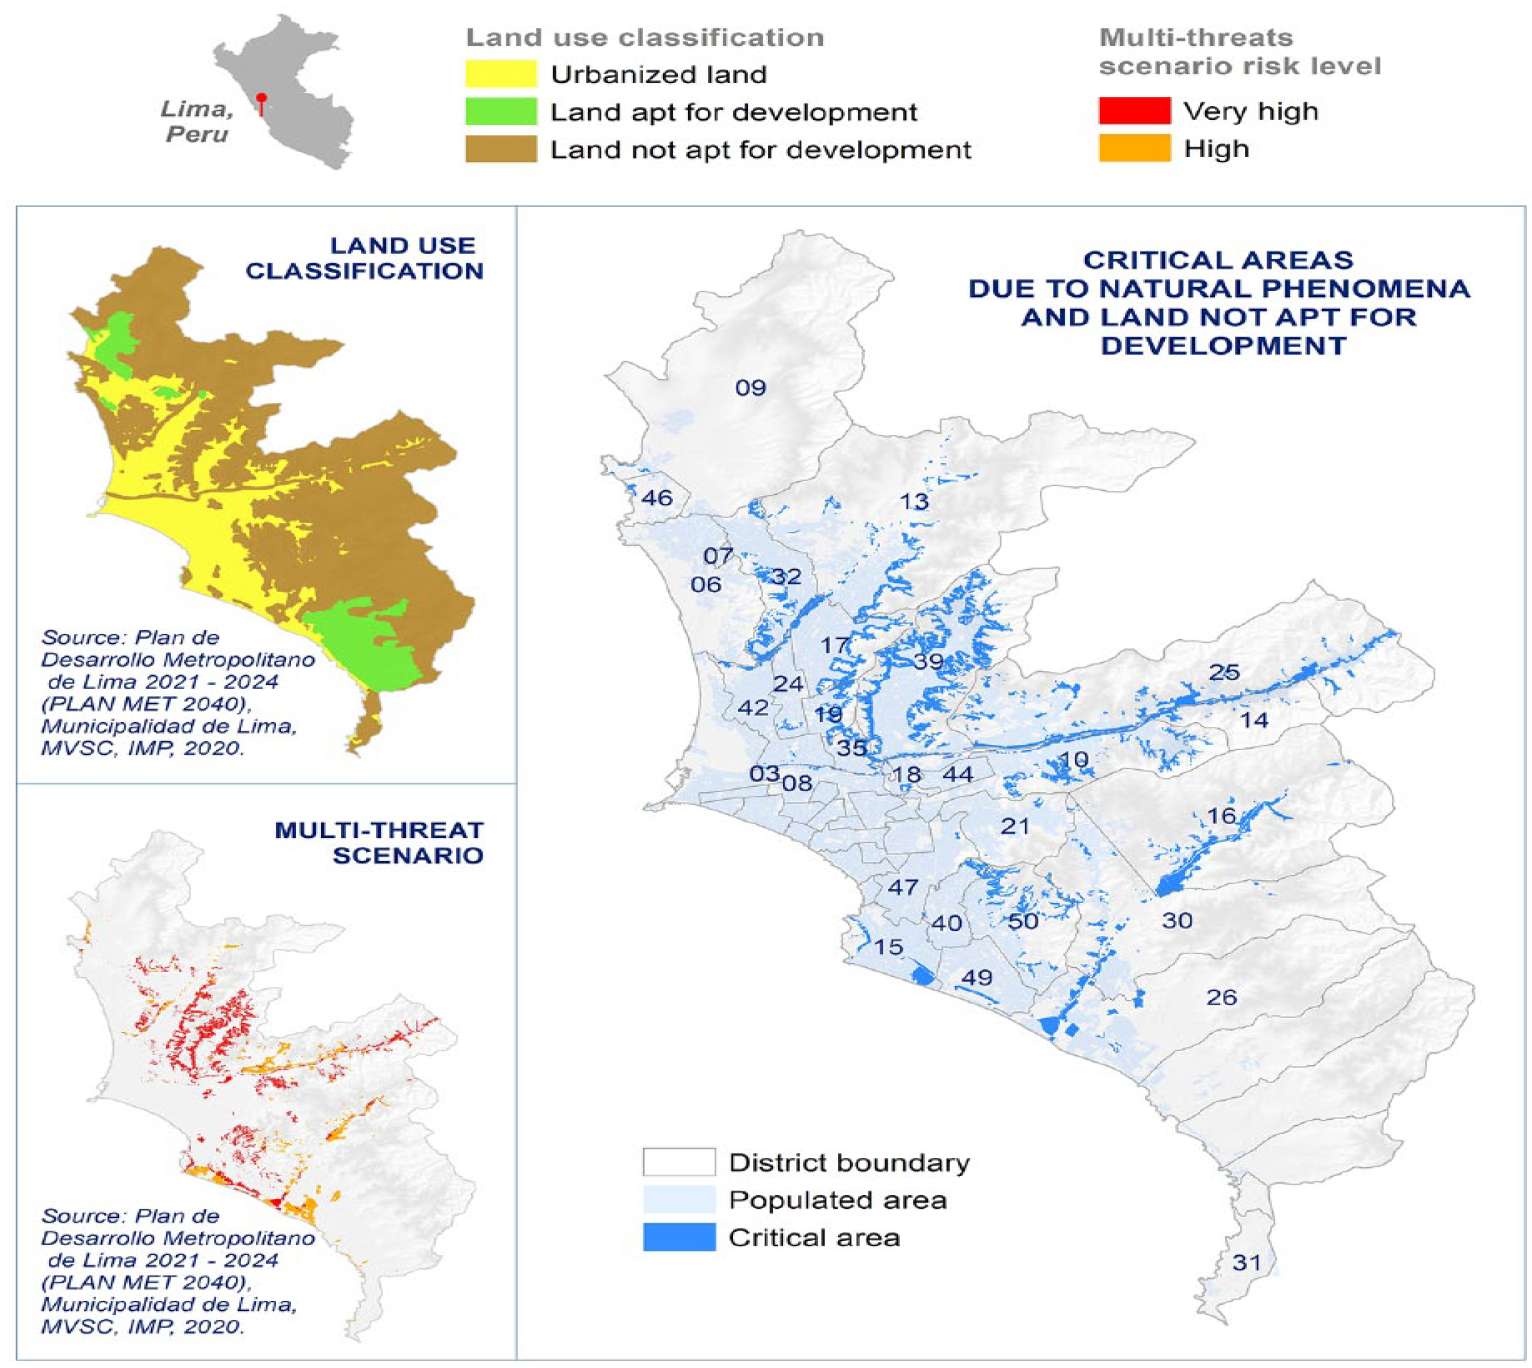
Coincidence between natural hazard risk and land not appropriate for development
This coincidence between risk zones and areas that should be designated as inappropriate for construction would seem to be evident, because such exposure would, following appropriate urban planning principles, be a direct reason for designating an area inappropriate for construction. However, this relationship is not obvious for many technicians defining urban zoning regulations. They are not very familiar with the disaster risk approach, and they define areas as unsuitable for urban development, using environmental, eco-systemic, archaeological, rugged topographies and other criteria to make decisions, without relating these criteria directly to disaster risk. The obvious nature of the relationship becomes clear as an indirect outcome of analysis, not as a major central issue for analysis. In Nicolás de Piérola, for instance, the ravine has been defined as a “marginal area” by the National Water Authority (ANA). But residents had already acquired legal rights to the land, and ANA lacks the legal power to limit urban expansion. The only alternative would be to initiate a relocation process in dialogue with the residents, requiring political will and financial resources. In Peru today there is still no successful experience of population resettlement due to the existence of disaster risks.
c. COVID-19, risk and misconceptions due to experience with more common hazards
According to the testimony of residents consulted during our research, the social support mechanisms and food aid offered by the government during the COVID-19 health crisis did not include the population occupying what were deemed to be well-built or adequately built houses. According to many, aid was prioritized for those living in precarious houses and circumstances. Here, the common-sense approach of officials accustomed to dealing with disasters that manifest in physical loss and damage led them to assume mistakenly that the population with adequately built houses did not need food aid.
This “discrimination” occurred in a context where government-mandated social distancing and lockdown measures had serious impacts, particularly in terms of economic loss and the bankruptcy of small, informal street businesses. These impacts did not involve the kind of direct physical loss and damage that results from earthquakes or floods. However, the obligatory government restrictions in response to COVID-19 were, in fact, a social earthquake. They generated an effect of unequal exclusion(25) for those with an adequately built home. The construction of these homes had often been achieved with family investments and sacrifice over 50 years, the age of the oldest human settlements on the outskirts of the city.
Low-income families, with and without adequate housing, had to reduce the number of meals they consumed per day. According to the World Food Programme, based on the survey it conducted in Peru during the second wave of the pandemic in September 2020, 50 per cent of respondents had had insufficient food during the previous 30 days. In all, 54 per cent of respondents had resorted to coping strategies that negatively affected their food consumption. Twenty-one per cent reported having had only one meal (14 per cent) or nothing to eat (7 per cent) the day before the survey.(26) Although this information was not collected specifically for Nicolás de Piérola, similar data were reported for the immigrant Venezuelan community in Lima. The crisis generated by the pandemic exposed the poorest and most vulnerable families to the risk of unemployment and limited their access to food, goods, basic services and quality health care.
In 2020, INEI published a Stratified Map of Metropolitan Lima showing per capita monthly income per household in Peruvian soles.(27,28) The map shows that, as one moves from the centre to the outskirts of the city, economic conditions become increasingly precarious. Before the pandemic, the economic conditions of the families on the outskirts of the city were challenging, and with COVID-19 the situation became more critical because of the paralysis of livelihoods resulting from lockdown.
Because the population needing food assistance had been inappropriately identified, many of those affected were forced to come up with their own responses. Women self-organized to cook food collectively, through what are called “common pots” (ollas communes).(29) This mechanism, practised historically by communities faced with more commonly experienced disasters, illustrates how local capacity and social solidarity rely on resilience practices that make up for their structural vulnerability and the lack of government action.
Figure 5 shows how high and very high-risk areas coincide with low-income areas on the periphery of the city.
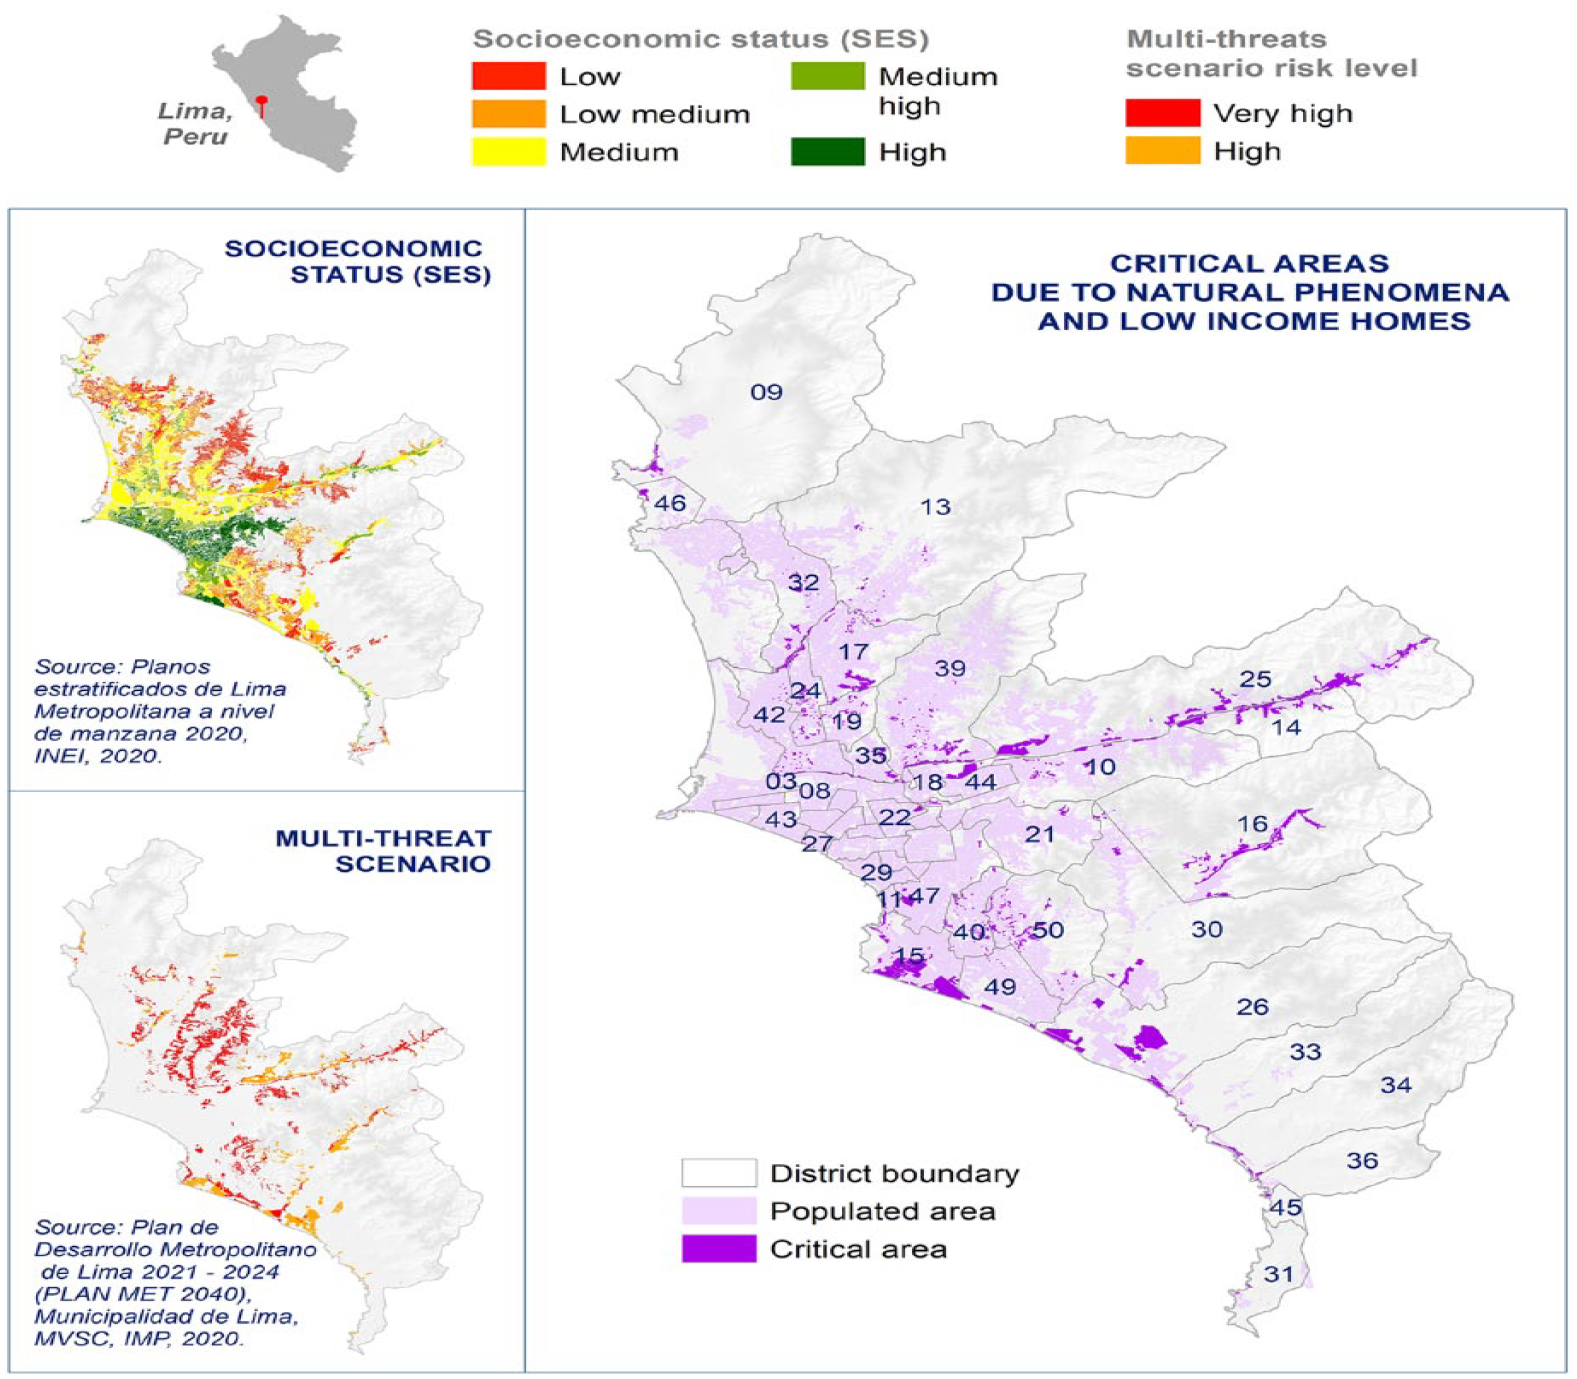
Spatial coincidence between natural hazard exposure and low-income homes
Poverty and the underlying inequalities that precede the residence of families in hazard-prone locations, and which exist once hazards materialize, are the bases of livelihood insecurity, vulnerability and risk. All these conditions are accentuated in iterative fashion once disaster loss and damage occur both intensively and extensively.(30)
III. Basic Services: Potable Water and Sanitation
a. Inequality and exclusion
As of 2017, according to the INEI 89.2 per cent of Peru’s population were connected to the public potable water network, 94.4 per cent in urban and 71.4 per cent in rural areas.(31) Nearly 11 per cent lacked access or were supplied by tanker truck (1.4 per cent), wells (1.9 per cent), river or ditch (4.4 per cent) and other means (3.1 per cent). Regarding sanitation, 72.0 per cent of Peruvians were connected to the public sewage network, 88.1 per cent in urban and 17.6 per cent in rural areas. The 28.0 per cent without access use a latrine (2.2 per cent), septic well (6.8 per cent), blind well (9.3 per cent), river or ditch (1.1 per cent) or other means (8.6 per cent).(32,33) In Lima and Callao, there is an average estimated gap in access to potable water services of 11.59 per cent and a sanitation gap of 11.55 per cent.
There are two types of areas where lack of access to basic services is far higher than average: those historically excluded by the State, due to bureaucratic obstacles that prevent service provision (e.g. Lurigancho with a 46.05 per cent water and 50.10 per cent deficit for sanitation, and Cieneguilla with 55.46 per cent and 55.90 per cent, respectively); and new areas occupied through land invasions (e.g. Punta Hermosa with 76.56 per cent and 63.48 per cent, Santa Rosa with 63.94 per cent and 66.01 per cent, among others).(34,35) These are the same areas typically suffering disaster hazard and risk. Populations that historically have lacked access to basic services have installed temporary solutions, often financed and built themselves.(36) Electricity is often obtained through clandestine connections and by paying neighbours who have formal access.
Both exclusion processes amplify the gap in basic services, generating informal or insecure conditions. Informal electrical installations are very basic and are not monitored by the utility and hence may be subject to fire hazard. In the case of water, families buy from nearby farms or from tanker trucks, often without adequate sanitary treatment. Some of these informal providers lobby on their own behalf in municipalities and ministries so that the problem of unequal access is maintained in their interest. Once more, risk is socialized in the search for individual gain.
Nicolás de Piérola is one of four settlements located in high-risk zones on the right bank of the Rímac that lack formal water and sanitation services. (The others are San Antonio de Pedregal Alto, Sierra Limeña and Pro-Hogar Propio San Miguel de Pedregal.) The four formed an association (Unión de Trabajo por el Agua Potable “PACHACUTEC” – UTAPP) in 1968 for access to water that is not intended for human consumption, but in practice is used for this purpose. UTAPP was legally constituted on 5 January 2005. Nicolás de Piérola, now 76 years old as a settlement, still lacks a formal and legally established potable water and sanitation system. This is due, among other reasons, to the high-risk condition of the area which by law prevents government from providing such services. A leader, member of the board of directors of the second of the settlement’s four zones, provided his understanding of the water problems in his area in the face of a seismic threat:
“. . . the leaders of the 3rd zone are going to have to promote a solution, because we have seen with the recent 5.6 [magnitude] quake that there have been quite a few landslides, and with a quake of 8 degrees which so many predict will happen, there will be many misfortunes and many victims . . . as you see, the water pipes are going to collapse, because they are directly under the walls and when the stone walls fall, those people will be left without water. Moreover . . . if that retaining wall falls, the drainage channels will also fail because the drains are in the middle of the street . . . All of this must be prevented but how do we do that? By building retaining walls in a more solid and stronger way.”
b. Commonly experienced disaster risk
Hazard events affect basic service infrastructure in peripheral urban areas on steep slopes and river flood plains. For this reason, municipalities do not provide a definitive solution for service provision, leaving residents to invest themselves in services that are highly exposed to hazards. In effect many of the existing services are temporary. The construction of basic service infrastructure on steep slopes, ravines or hillsides is far more expensive and can be up to five times greater than in the more consolidated districts in the lower areas of Lima.(37)
When the occupied areas have a high recurrence of disaster impact, legal impediments to the provision of basic services by the local or national government exist, dictated by DRM policies. Thus, to qualify as habitable, the Informal Property Formalisation Agency (COFOPRI) requires that risks be mitigated in the affected area and when the occupants cannot mitigate the high-risk conditions, they are unable to obtain the legal physical sanitation of the property and, consequently, basic services.
In this sense, DRM policies have a direct impact on inequalities in the provision of basic services. Restrictions in access are based on a technical assessment, made or requested by the relevant subnational government, that declares the area’s risks as mitigable or non-mitigable. If they are determined to be non-mitigable, basic service provision is denied.
Many areas are, de facto, in a condition of very high and non-mitigable risk, although assessments that formalize this condition have not actually been carried out. Yet the condition is still grounds for denying basic services to vulnerable populations. This then ends up perpetuating the exclusion of the exposed low-income residents from basic services. They may then live for decades in high-risk areas without basic services.
Nicolás de Piérola is a clear example of this: no technical risk diagnosis has been carried out at a local scale. But following the mudslides that activated the Quirio ravine during the 2017 coastal Niño phenomenon, the ANA determined ex post that the area was marginal, making it legally unacceptable for urban occupation, despite the fact that the area has been densely inhabited for several decades.
This structural exclusion from access to basic services then exposes residents to the impacts of potentially harmful biotic events, as is the case with COVID-19.
c. Risk due to COVID-19
Families who have built their homes in high-risk areas (whether they are declared mitigable or not), and who lack access to water and sanitation services, are more susceptible to exposure to, and the spread of, COVID-19 and other contagious diseases. Without sufficient high-quality water and sanitation in homes, schools and workplaces, people cannot adopt adequate hygiene practices. The kinds of sanitary supports that could help protect the excluded and poor from COVID-19 infections do not exist. Restrictions on service provision related to other types of hazards are manifest in the impacts of this new biotic hazard.
The COVID-19 vulnerability scenario and model, prepared by the National Disaster Prevention Centre (CENEPRED), considered disaster conditioning and triggering factors and the identification of exposed elements.(38) The conditioning factors included population density, the use of public markets and the percentage of the population with unsatisfied basic needs (UBN). The triggering event, SARS-CoV-2, the virus that causes COVID-19, is represented through the geographical distribution of COVID-19 (shown using heat maps). The more vulnerable populations were those between 30 and 59 years old (the population with the greatest spatial mobility) and those over 60 years old (the inherently most affected population). Employing these variables, CENEPRED constructed its risk maps for COVID-19. For more common pre-existing physical hazards, maps delimit the exposure of houses located on the margins of rivers or on steep slopes and debris flow channels, among others, and their vulnerability levels.
Risk areas for COVID-19 and more well-known and common hazards converge in informally occupied areas where households with fewer resources settle by their own means. Such areas dominate the infection patterns of the SARS-CoV-2 virus. Although different variables have been used to prepare the more common physical and COVID-19 hazard scenarios, the affected areas coincide in good part, due above all to the influence of high population concentration and deficit in basic services, including health care, in both scenarios.(39) Figure 6 depicts both the calculated vulnerability of urban blocks to more common hazard events and the level of coincidence of these with calculated COVID-19 risks.
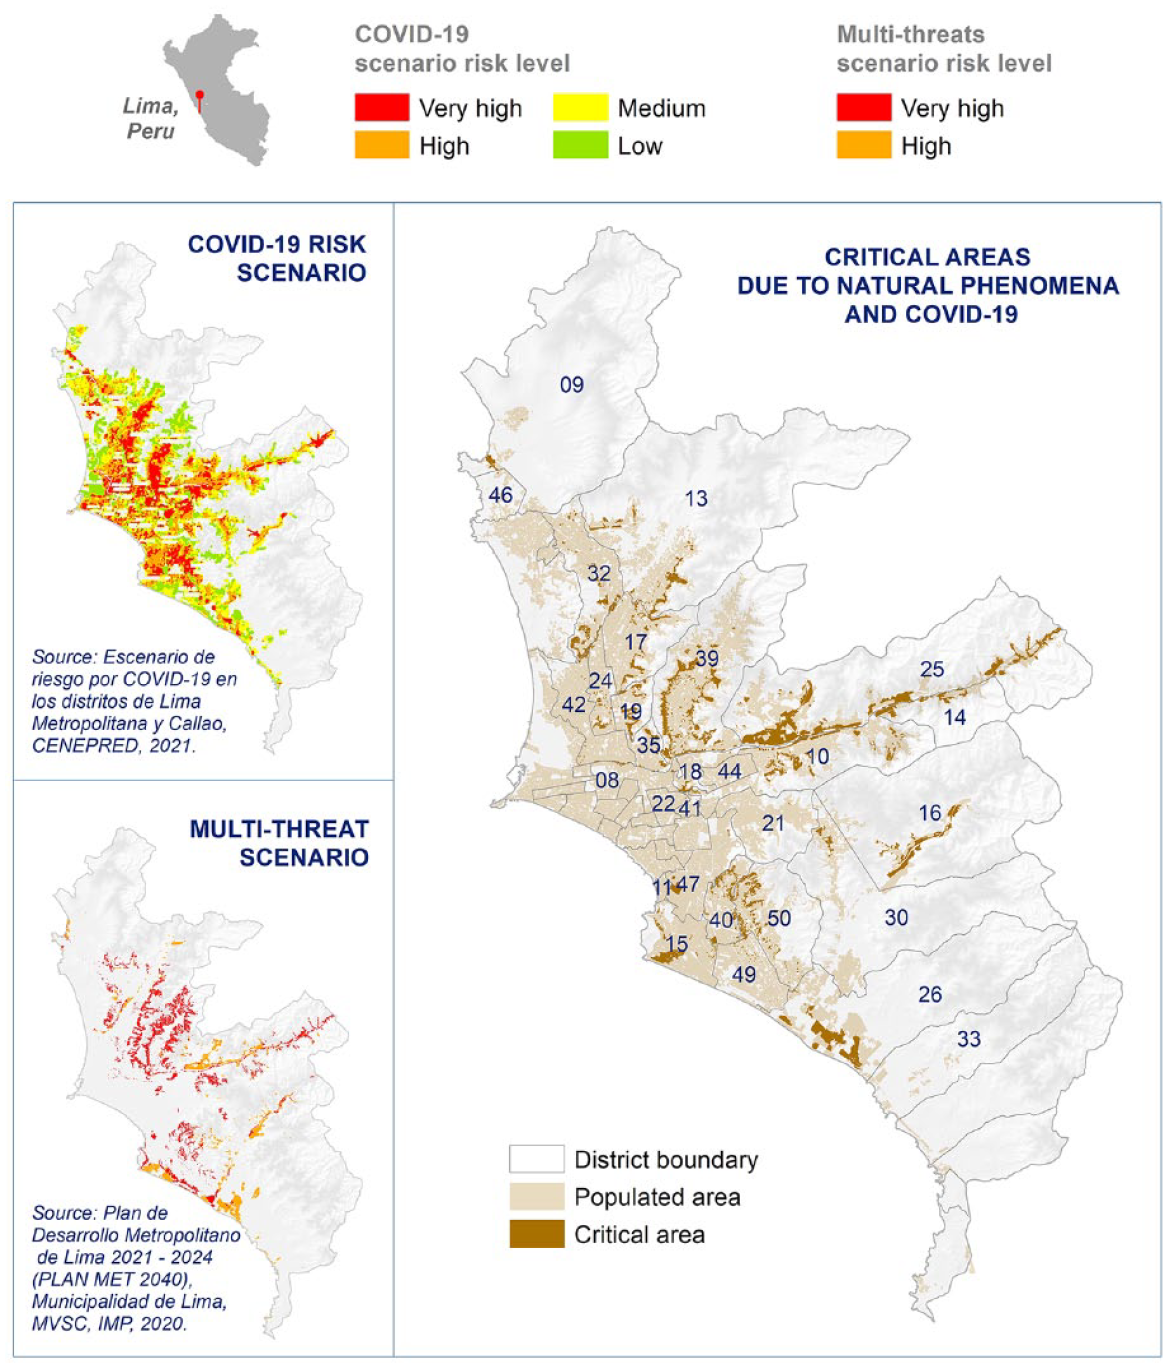
Spatial and social coincidence of natural hazard based risk and COVID-19
IV. The Vulnerable Informal Economy
The size of the country’s informal economy is extremely important, and informality, inequality, exposure and vulnerability to disaster hazards are closely related. Between 2007 and 2019, the informal economy in Peru generated 18.9 per cent of GDP, and in 2019, provided 52.7 per cent of total employment.(40) The high exposure of the informal economy to COVID-19 was closely related to the gap in basic service provision in places where the informal economy operates. Seventy-eight per cent of informal production units lack drinking water, 90 per cent lack access to sewage, 99 per cent have no landlines, 97 per cent have no internet and 47 per cent have no electricity.(41)
Informality, as it pertains to livelihoods, is a term that generally refers to an economic activity that is not ruled by existing laws. If it is in accordance with the current laws, the activity is usually considered formal. Yet informality and illegality are not synonymous. Not all informal activities are illegal – street trading, for instance, is legal in many places. Nor are the lines between formal and informal always clear. Many formal companies, for example, depend on informal enterprises, or use legal loopholes to cover their informal activities. Often, business start-ups are informal, because they do not initially have sufficient resources to comply with regulations. In other cases, informal entrepreneurs do not want to become formal because it may affect their profitability. Instead, they opt for the low overhead of legal but informal street trading.(42)
In 2019, informal employment in Metropolitan Lima and Callao accounted for 60 per cent of total employment. This proportion later expanded due to the pandemic control measures(43) and the precipitous drop in formal employment. For the quarter June–August 2020 (as compared to the same quarter the previous year), formal employment decreased by 47.1 per cent (1,501,500 people). In the same quarter, 3,611,300 people in Metropolitan Lima were employed overall, a reduction of 26.8 per cent (1,320,800 people), compared to the same quarter the previous year. The unemployment rate rose to 15.6 per cent over the same quarter, 9.8 percentage points above that in the same quarter the previous year.(44)
In general, the COVID-19 health crisis has profoundly damaged employment opportunities for some of the most vulnerable groups. The female unemployment rate stood at 16.3 per cent, only 1.3 percentage points higher than that of men, showing that COVID-19 was not overly gender discriminatory as regards unemployment. Similar figures are recorded for young people (14 to 24 years old) and the less qualified.(45)
Together with the government measures to attend to the health emergency, the “Reactivate Peru” programme was implemented to support micro, small, medium and large companies through credits allowing the continuation of business and a moratorium on the payment of fees and taxes. Despite this, the controls hit all businesses hard, especially the smaller ones. In 2019, there were 6.06 million Micro and Small Enterprises (MYPES) distributed throughout the country, most of them (84 per cent) informal. In 2020 there were 3.1 million MYPES, a reduction of 48.8 per cent,(46) and the level of informality increased very slightly to 85 per cent (+0.8 over the previous year) (see Figure 7).
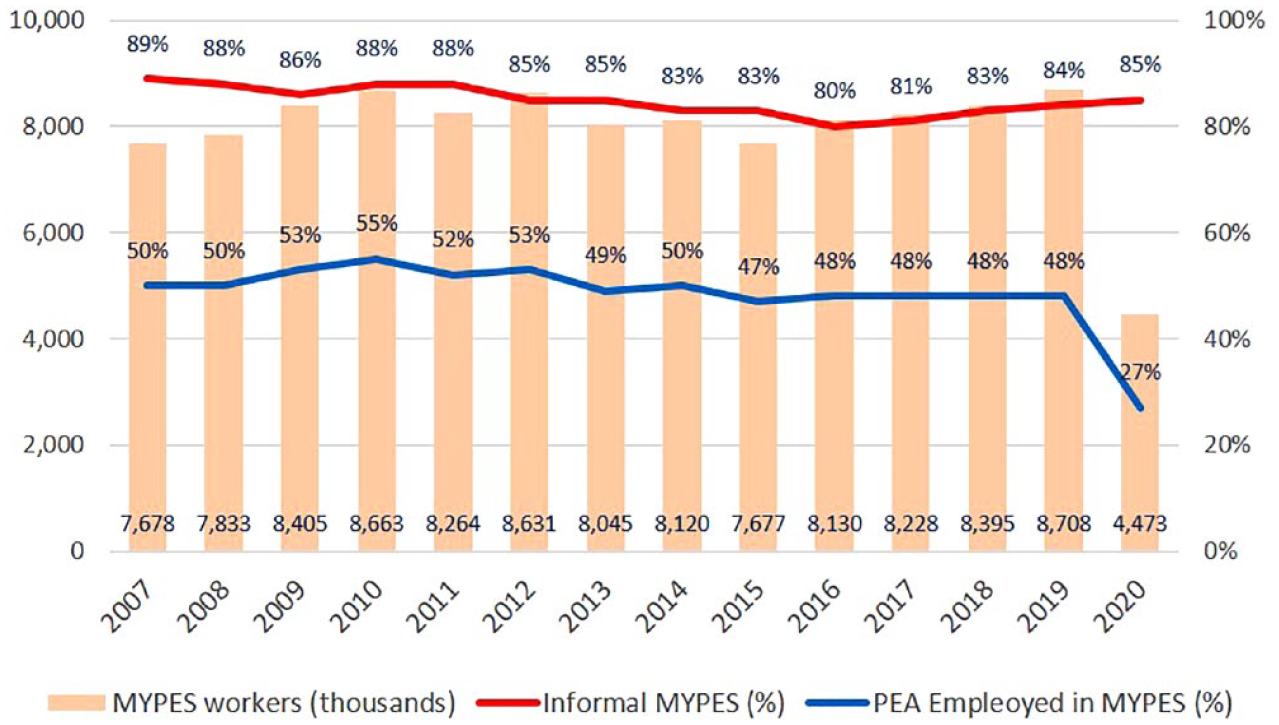
Employment in MYPES in Peru, 2007–2020
In 2019, informal productive units based on households accounted for 88.4 per cent of the national total, while in Metropolitan Lima they accounted for 80.4 per cent. Although Lima has one of the lowest levels of informality among cities in the country, its levels are very high in the global context. Here, income derived only from the formal sector accounted for 51 per cent in 2019, while 15 per cent came exclusively from the informal sector. Income from combined informal–formal businesses and formally informal sectors amounted to 34 per cent.(47)
The conditions faced by informal workers in Lima in 2019 worsened with the pandemic. The paralysis of the formal economy as a result of COVID-19-related restrictions generated massive dismissals and a reduction in formal employment. This led to an expansion in informal employment, which in turn increased the level of exposure and increased infection among the more vulnerable sectors of the population, who had been economically affected by the pandemic. Overall, informality is associated socially and territorially with everyday and disaster risk.
Peru attempted to mitigate the effects of the pandemic with government release of money from the Compensation for Time of Service (CTS) and Pension Funds (AFP). But Peru is largely without unemployment insurance because of the preponderance of informal workers, and only 30 per cent of the population were protected by these measures.(48) For this reason, a programme of family subsidies, targeting approximately 9.09 million beneficiary households, was initiated to respond to the food crisis and to persuade people to respect lockdown measures.
These subsidies, however, were less effective than they might have been, since there was insufficient preparation for implementing financial transfers on a national scale. The main failure in implementation was the lack of an updated national database. Several modifications to this database were necessary to ensure that support went to those most in need. Between this and the absence of more traditional insurance mechanisms, there has been little financial protection during emergencies and the pandemic, especially for the vulnerable informal sectors. In Nicolás de Piérola people eventually got their transfers but these were subject to delay, and they had to work despite the lockdown measures.
V. The Distribution of Covid-19 Impacts
As indicated earlier, past disasters meant authorities had clear knowledge of the physical damage to homes and services by adverse physical events such as earthquakes and floods. However, the consequences associated with biological disasters were mainly unknown, despite experience with lesser epidemics such as cholera and dengue. Understanding the impact resulting from epidemics or pandemics was strictly limited to health issues until the social and economic impact associated with COVID-19 became so clear, especially on the poorest, most vulnerable populations.
Peru, with 217,287 COVID-19-related deaths, is the third most-affected country in Latin America, after Brazil (689,155) and Mexico (330,495). Metropolitan Lima–Callao was by far the most affected city, with 108,608 registered deaths – 49.98 per cent of the country’s total – and a mortality rate of 5.75 per cent (Metropolitan Lima 4.71 per cent and Callao 6.79 per cent). The infected population here numbered 2,165,853, almost 51.53 per cent of the total in the country (data updated to November 2022). The high population density of Lima and Callao (3,276 per km2 in the former and 6,815 per km2 in the latter),(49) combined with the lack of basic services, was a principal contributing factor. In addition to the fatalities, the pandemic generated a new group of people and families in poverty. During the first year of the pandemic the number under the official poverty line increased by 13.3 per cent in Metropolitan Lima and Callao, pushing the fight against poverty back 10 years.(50)
The districts with the lowest socioeconomic levels had deaths numbering in the highest death quintile (ranging from 3,000 to 13,000): San Juan de Lurigancho (8,628), Comas (6,003), Ate (4,929), Villa El Salvador (4,377) and Villa María del Triunfo (3,855). The lower-middle class districts with fatalities within this same range were Lima Cercado (8,682), San Martín de Porres (6,774), Los Olivos (3,249), San Juan de Miraflores (3,395), Callao (12,302) and Window (4,042) (see Figure 2). All these areas, particularly those of lower socioeconomic levels, coincide with established high disaster risk areas. By contrast, the richest districts in the country, located in Lima, appear in the lowest quintile of deaths (400–999): Pueblo Libre (923), San Isidro (512), San Borja (848), Magdalena (642), Lince (943) and Barranco (474). Only Miraflores (1,059) and La Molina (1,050) were slightly above, in the penultimate quintile of deaths (1,000–1,500).
The same pattern holds true for levels of transmission. Although all social classes suffered the impact of COVID-19, the poorest districts had the highest risk of infection and these, again, coincide with more common hazard risk zones. According to the CENEPRED study,(51) the districts with a very high risk of infection from COVID-19 were:
Very low-class districts (socioeconomic stratum D/E) such as: San Juan de Lurigancho (49.4 per cent of blocks with high COVID-19 risks), Lurín (38.6 per cent) and Santa Rosa (33.8 per cent)
Lower-class districts (socioeconomic stratum C/D) such as: Ate (52.6 per cent; 4,785 deaths), Chaclacayo (52.8 per cent), El Agustino (47.5 per cent), Comas (42.1 per cent; 5,803 deaths), Carabayllo (40.7 per cent) and Rímac (48.1 per cent)
Mixed middle and lower-middle class districts (socioeconomic stratum B/C) such as: San Juan de Miraflores (43.2 per cent; 3268 deaths), Barranco (42.0 per cent) and Independencia (47.1 per cent)
Middle-class districts (socioeconomic stratum B) such as: Jesús María (38.2 per cent) and Magdalena del Mar (39.5 per cent)
A contributing factor to these serious levels of impact is the large gap that persists in the health service, which for decades was underfunded and headed for bankruptcy. This led to public opinion in favour of the privatization of the health service. This situation has been changing with the pandemic, and the authorities have been more interested in strengthening the public health service, although the gaps are too wide to be reversed in less than 10 years. For example, in the Department of Lima, 99 per cent of Health Establishments (ES) at the primary care level (out of a total of 851) and 100 per cent of hospitals have inadequate capacity.(52) Despite these deficiencies, the country, and in particular Metropolitan Lima, managed to face the pandemic with difficulties, but with a very acceptable level of vaccination – 89.2 per cent of the population received the first dose and the 84.1 per cent the second (a total of 8,449,278 people),(53) thus generating a level of protection across all socioeconomic strata that bodes well for economic recovery.
In this context, Nicolás de Piérola’s residents had to face the mandated lockdown without access to safe water or formal employment. However, they were able to manage the health crisis, taking advantage of the fact that fortunately there were no landslides during the two years of the pandemic. Being accustomed to facing disasters, residents had built up a level of resilience that helped them face the pandemic. Common eating pots were organized, mutual support among families generated economies of scale and neighbourhood health brigades were organized, among other measures.
VI. Conclusion: Imagining Pathways to Greater Urban Equality Through Disaster Risk Control and Reduction
This field note has sought to demonstrate empirically that the impacts of the COVID-19 pandemic were causally related to the very same processes that have led historically to the impacts of more commonly known and suffered hazard scenarios in Lima. COVID-19 impacts were one more manifestation of the close association between everyday risk and exclusion, marginalization and poverty. These factors materialize in disaster for the very same populations, no matter what the hazard. There is a concatenation of more common hazard-based risks with less common biotic hazard-based risks which persists right up to the present day.
Due to the global nature and the intense local effects of the pandemic, many of the factors that resulted in differential effects among the population were revealed with greater clarity and brought to the fore in debates and discussions at the national and city levels. This has helped consolidate ideas about disaster risk construction and has highlighted the role of exclusion and poverty in risk creation and the need for integrated multi-hazard development-based approaches to disaster risk management and reduction.
Both intensive and extensive disaster risk are built on existing everyday risk conditions and the playing out of urban development processes, all of which have social, economic, cultural and political origins and expressions. Thus, the pathways to the reduction and avoidance of urban disaster risk (and thus, to reduced inequality, poverty and exclusion) are inevitably linked to the promotion and application of risk-informed sectoral, territorial and land use processes and planning, along with improved access to services, land, employment, participation and democratic governance.(54) This is as true for earthquakes and huaycos as it is for virus and disease.
The instruments for disaster risk avoidance, so-called prospective management, are the same instruments as those supposedly employed for urban development more generally, although these should be emphatically informed by risk considerations. Unfortunately, contrary to the principles of the social construction of risk paradigm, DRM in both its prospective and corrective forms is still dominantly considered as an externally conceived set of disaster risk sector instruments. And despite calls for multi-hazard approaches, mono-hazard approaches are still common and stem from siloed views of risk and disaster.
Corrective risk management (the attempt to reduce existing risk) does, in fact, have specific, very high-cost instruments (such as retrofitting and relocating communities, shoring up slopes and other mechanisms). This is also true of preparedness and response strategies. But access to these instruments is very restricted temporally, spatially and socially. Corrective risk reduction is most likely to be financed and supported when the investment impacts positively on various other social and economic goals (double or triple dividend effects). Thus, for example, building a riverside dyke could protect against flooding but could also open up areas for agricultural production and maybe even allow for running and cycling. This generally excludes poorer populations due to the ways cost–benefit-based decision-making and other analyses work.
Only by achieving greater equality in the allocation of resources, services, land, voice and recognition at the urban level can disaster risk be reduced or avoided. This is the conundrum as regards inequality. Reducing disaster risk would, from our perspective and intuition, inevitably reduce urban inequality. But only by decreasing inequality, and thus the poverty and exclusion built into existing urban processes and planning, can reductions in disaster risk be achieved. Neither can be achieved without fundamental changes in the ethos and paradigm for urban development and development in general.
Inequality begins with and is expressed through a lack of opportunity due to restrictions on employment and income. It then spreads to inequality in access to land, services, recognition, voice, vote and social protection. The spontaneous process of urban socio-spatial segregation has in many cases been consolidated by elitist urban planning processes in cities in Latin America and the Caribbean. The resulting disaster risks, when actualized in large-scale loss and damage, or in continuous recurrent low-scale loss and damage, then feed back into the different processes and expressions of urban inequality, and thus into related patterns of exclusion and poverty. A cumulative, snowball effect is the common result, within a catch-22 context.
Footnotes
Acknowledgements
The authors express their thanks to local populations and local government in Lima for their interest, knowledge, collaboration and the information they proffered.
1.
Disaster risk refers to the probability of loss and damage once a hazard is materialized as a real event. Intensive disaster risk refers to larger scale events associated with higher scale, temporally longer return period damage and loss. Extensive disaster refers to lower scale, more frequent and recurrent loss. The same area may be subject to both patterns of loss and damage. These notions are now commonly adhered to and have been developed by the UNISDR-UNDRR in its series of Global Assessment Reports between ![]() and 2022.
and 2022.
3.
Prospective risk management refers to the avoidance or limitation of future risk. Corrective management attempts to reduce already existing risk. These notions contrast with reactive or compensatory management where risk has been actualized as disaster and society responds to the loss and damage. This classification of DRM approaches derives from early work by Lavell (1998, 2003) and has been introduced into the disaster risk lexica worldwide through the UNISDR Global Assessment Reports between 2009 and 2015, and the Sendai framework. See Wisner et al. (2004); also Oliver-Smith et al. (2016); ![]() .
.
4.
Quotidian or everyday risk refers to ongoing, everyday living conditions that principally, but not exclusively, affect poorer and excluded populations and seriously affect opportunities for a healthy, productive and safe life. These include health, unemployment or informality, lack of disposable income, addiction and personal and social violence. See ![]() , for an early discussion of this notion.
, for an early discussion of this notion.
5.
Lima is the name of the metropolitan city, which is the capital of the country; it is also the name of the department, where Lima and Callao are located. Many times when Lima is mentioned, Callao is also implicitly included, due to the integration of Callao with Lima and also because Callao is very small.
6.
Literature on more common hazard and risk contexts and that of COVID-19 did not exist when this field note was written. During the pandemic, the government summoned professionals from the social sciences to analyse the pandemic, many of them without prior experience with disasters or epidemics. Subsequently, books have been written on COVID-19 without linking it to disasters in general. See Burga et al. (2020); also Ascencio (2020); Jiménez Quispe (2021); ![]() .
.
7.
See Wisner et al. (2004); also Lavell and Maskrey (2014); ![]() .
.
9.
Metropolitan Lima is the capital of Peru. It is in a coastal desert in the central zone of the country, on the shores of the Pacific Ocean, and is crossed by three rivers (Rímac, Chillón and Lurín) that generate valley microclimates. Metropolitan Lima together with the proximate constitutional province of Callao cover 2819.26 km² and the combined population exceeds 10 million inhabitants (31 per cent of the total Peruvian population).
12.
Actors involved in popular urbanization: Family Group, Human Settlement Association, Agricultural Association, Residents’ Association, Housing Association, Pro-Housing Association, Popular Neighbourhood, Comprehensive Plan, Housing Programme, Housing Project, Comprehensive Project, Young Town, Populated Centre.
13.
Actors involved in private urbanization: Homeowners Association, Cooperative (Individual Capital), Real Estate Developer (Urbanization), Illegal (Pirate).
14.
State actors: Housing Programme, Residential Programme, Satellite City, Neighbourhood Unit, Popular Urbanization, Urbanization.
16.
Within the framework of the National Urban Housing Programme (PNVU) of the Ministry of Housing, Construction and Sanitation (MVCS), the concept of “habitability” is understood to be the capacity of built spaces to satisfy the basic needs, both material and immaterial, of individuals and groups. Hence, habitability allows the free physical, biological, psychological, social and cultural development of the person and groups of people in cities and population centres. See ![]() .
.
19.
The Lima Metropolitan Development Plan 2021–2040, Plan MET 2040, was approved by Ordinance No. 2499–2022 on 14 September 2022.
20.
The Metropolitan Plan for Urban Development of Lima and Callao 2035 is a preliminary version of the Met Plan 2040.
22.
According to population growth rates, the 24 departments of the Constitutional Province of Callao, the province of Lima and the Lima Region can be classified into three groups: highest growth (2.0 per cent and more), intermediate growth (1.0 to 1.9 per cent), and those with lower growth (less than 1.0 per cent).
25.
During the pandemic, there were many signs of exclusion, including the contradictory distribution of aid, given that the authorities had no established criteria for dealing with the evolving context. Moreover, they “punished” informal workers for selling on the streets, without first assuring a subsidy so that they could quarantine. Cases of exclusion were systematic, part of a logical and even inevitable process related to the State’s institutional weakness and lack of preparation to deal with complex crises. The flagrant signs of exclusion that became evident will hopefully not be normalized or repeated.
28.
According to the INEI, the socioeconomic stratification of households by per capita income employed the Dalenius–Hodges method (1959), which recognizes strata where variance of the means is minimum within the stratum and maximum between them. Five income strata were defined: high, upper middle, middle, lower middle and low (according to monthly income). This guarantees a different stratification for each urban region, which allows adequate targeting of the lower-income population when applying any public policy at the regional level.
30.
See note 4.
36.
Available statistics show that the water and sanitation service gap is still high in Lima. Many old and consolidated districts have no services. The quality of public water supplies in Lima (where available) is adequate, unlike the rest of the country where the quality is questionable due to faecal and heavy mineral contaminants. The gap in current coverage and service quality in Lima had a serious effect during the pandemic, with a direct or indirect impact on the number of deaths or the risk of infection from COVID-19. See ![]() .
.
37.
This calculation was made analysing the costs of the technical files and/or projects of the Unique Code of 141100, 2114659, 2343022, 142171, 2501447, 2517538 and 2403501, accessed from the National Public Works Information System (InfObras), available at ![]() , of the Office of the Comptroller of the Republic.
, of the Office of the Comptroller of the Republic.