
Abstract
This paper explores the research gap involving the links between railhead temperature, relative humidity, and coefficient of friction (adhesion level) at the wheel/rail interface as found on track across the UK. Existing work done in this field has mostly been carried out in laboratories which limits variation of environmental conditions. Weather and friction data were collected from different sites across England, generating a real representation of the railhead conditions. Correlations were established between the environmental dataset and the railhead friction to give a greater insight into the mechanisms of low adhesion and when low adhesion can be expected to take place. This can provide an avenue to better predict the occurrence of low adhesion in the wheel/rail interface, therefore improving safety within the rail network. Results from the data analysis showed that high humidity conditions, independent of the railhead temperature, reduces the adhesion level on the railhead. Showing that low adhesion can occur in warmer temperatures, such as those typically experienced in early autumn where there is high relative humidity.
Introduction
One of the major causes of train delays during autumn has been identified as low adhesion at the wheel/rail interface. These delays may be caused by braking problems resulting in Signals Passed at Danger (SPADs) or station overruns, which are also significant safety concerns, or delays can result from poor traction which affects acceleration away from stations. The effect of low adhesion is said to cost an estimated £355m annually during autumn in Great Britain where roughly £290m is the performance impact cost, £0.5m is due to safety impact cost and £64m is spent on cleaning, management and prevention costs. 1
The railhead friction/adhesion level is defined in terms of the Coefficient of Friction (CoF, μ) which is the ratio of friction force between the wheel/rail interface to the normal force. Typically, this ratio is referred to as the coefficient of traction or adhesion while the wheel/rail interface is in a state of partial slip. Once the contact is fully saturated with slip this also becomes a coefficient of friction. Within the industry and literature these terms are used interchangeably though. Work carried out by Stock et al.
2
and then updated by White and Lewis
3
helped define wheel/rail friction regimes (see Figure 1). The ultralow regime (0.05 and below) is where a train will definitely experience difficulties with braking and traction.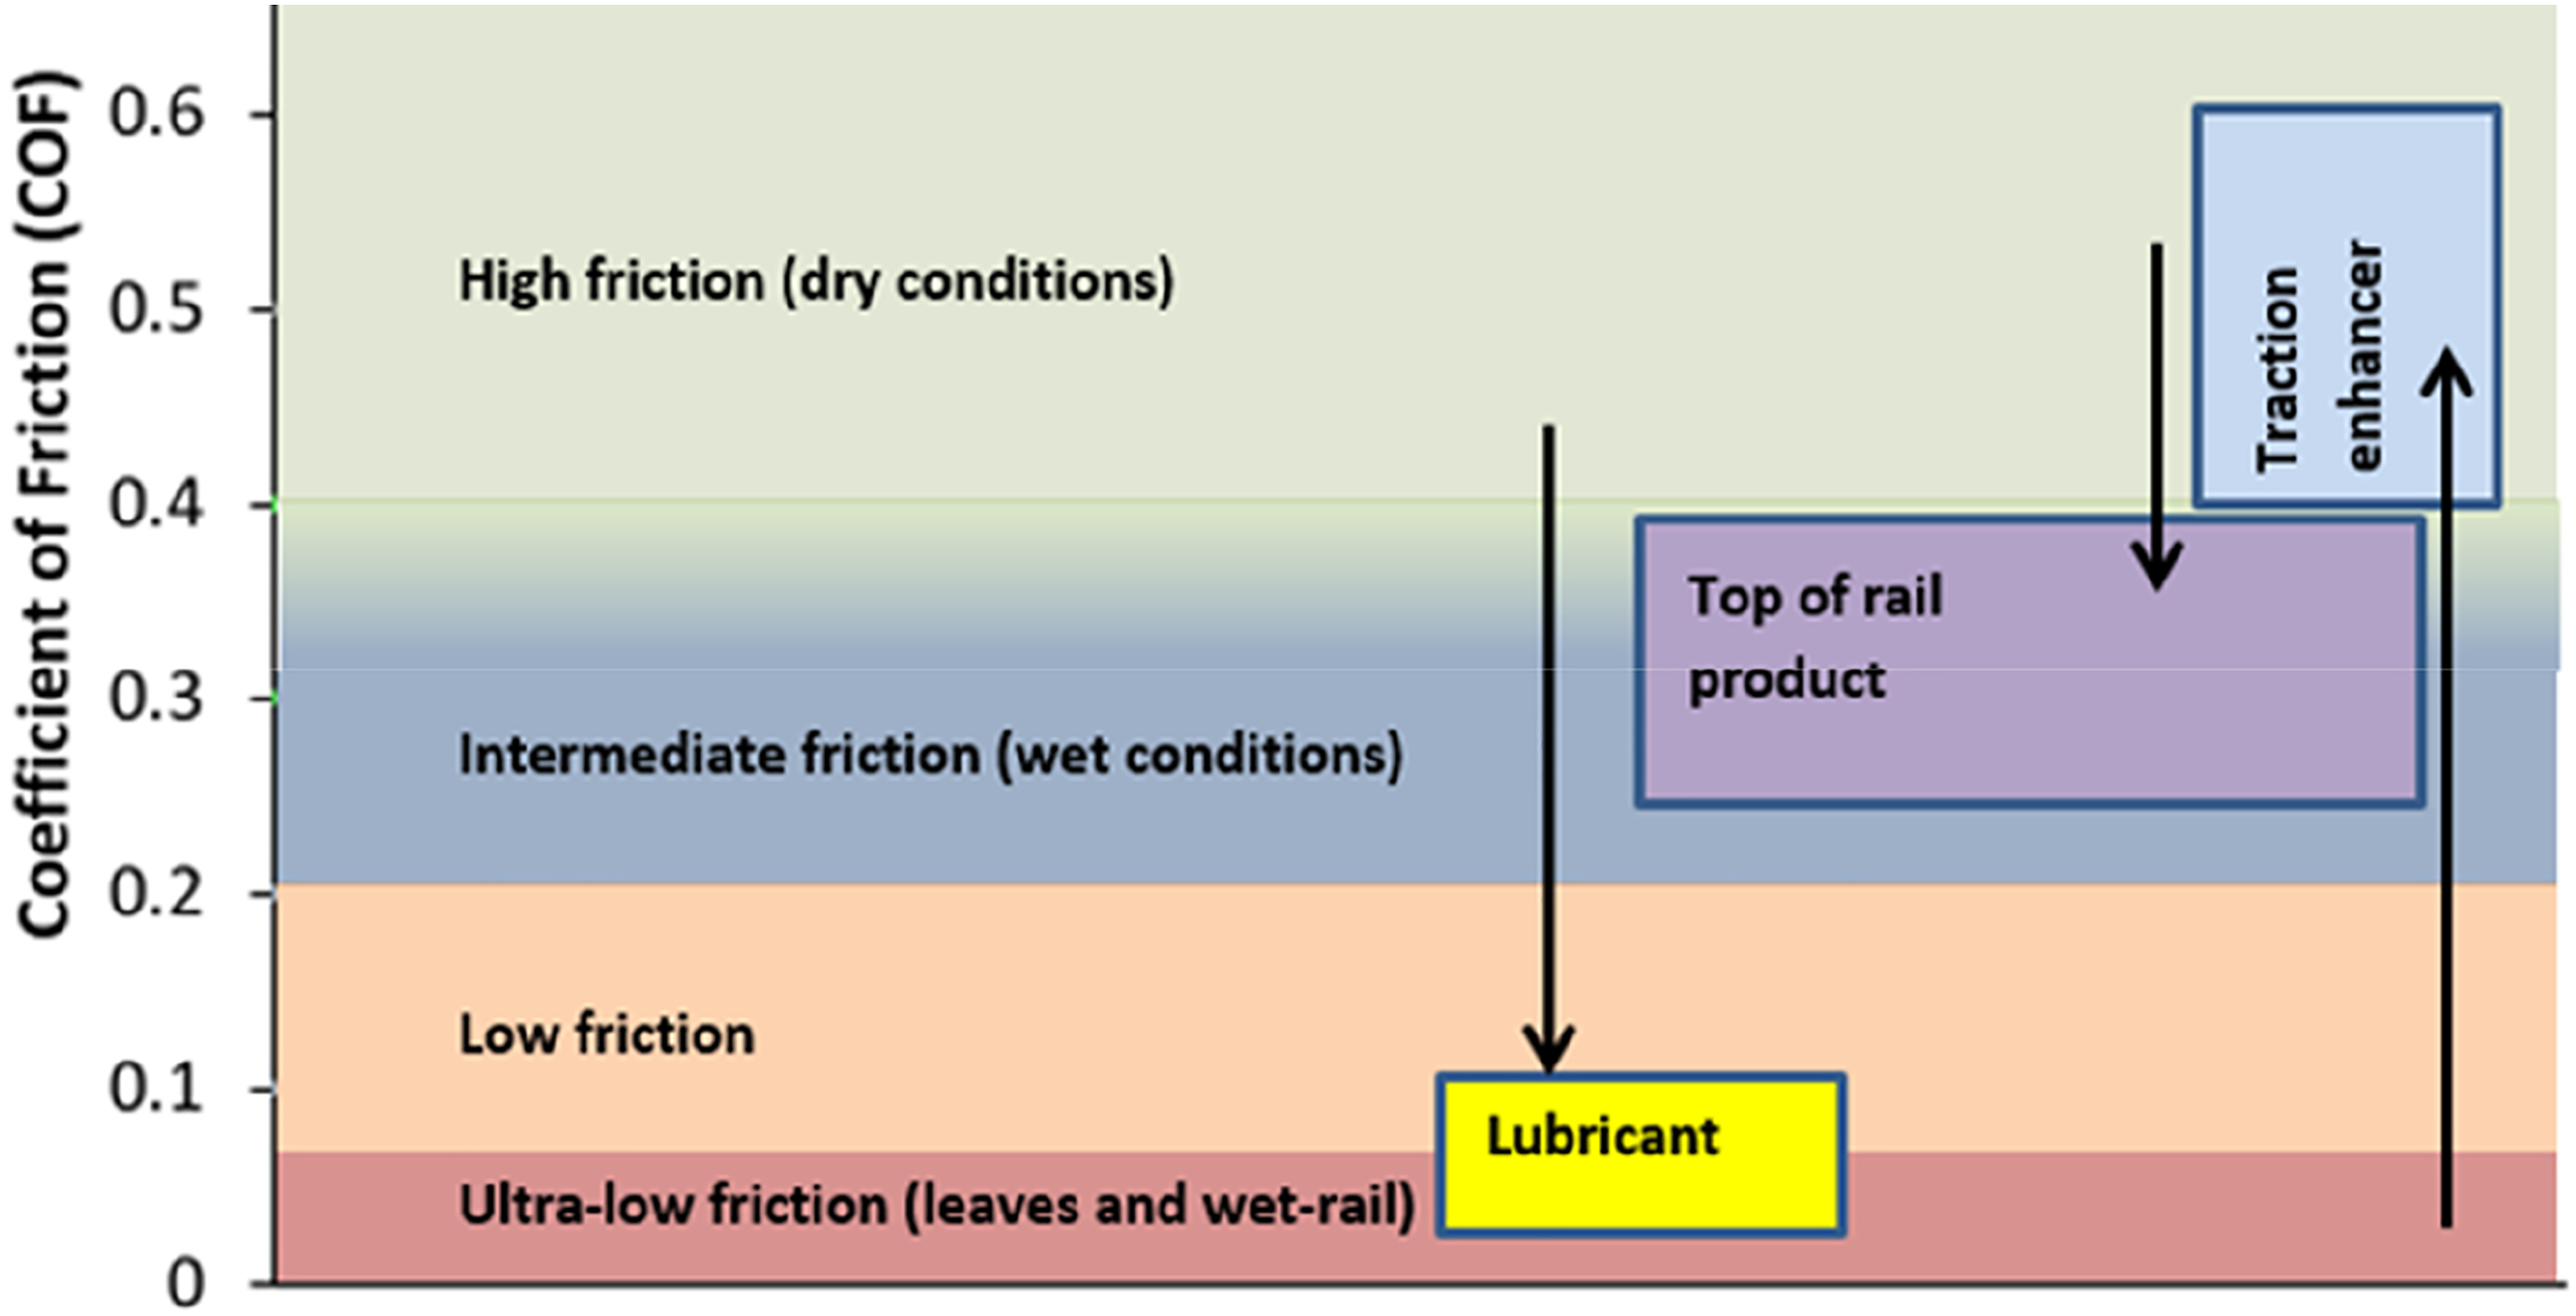
These very low values of friction can result from two different mechanisms: leaf layers which present a reduced shear strength layer and the “wet-rail” phenomenon, which occurs when small amounts of moisture and oxides mix to form a solid lubricant/low adhesion paste on the railhead. This is caused by the interaction of a range of different influences and not just one factor such as dew or oil. 4
Low adhesion commonly occurs during autumn and winter due to the change in temperature and humidity.5,6 The authors noted in their work, looking at station overrun data, that there was a high incident occurrence in the early hours of the morning between 06:00–09:00 and at night between 20:00–22:00. These incidents were attributed to low adhesion areas as a result of dew (moisture) present on the railhead that either creates oxides layers on the rail or adds moisture to leaf layers present.
The wheel/rail interface is an open system where changes in the environmental conditions, such as relative humidity, railhead temperature and air temperature affect the level of adhesion. 7 From tests carried on a pin-on-disc test rig it was proven that increasing relative humidity (RH, which results in a lubricating film of water) leads to a decrease in CoF until it reaches a saturation point where the CoF becomes stable. These tests also showed that low temperature with increased absolute humidity significantly affects the CoF. 8 These changes in the environmental conditions also affect the amount of moisture present in the atmosphere (later deposited on the railhead). 9 There have been few investigations carried out on relating the effects of the environmental conditions to the levels of adhesion found in the field, one of them being a report done by Kelsan Technology Corp. This analysed the relationship between railhead temperature; air temperature; humidity; dew point and the CoF. Their results showed there was a strong correlation between the temperatures, humidity and the CoF. It was noted that the changes in railhead temperature and air temperature showed similar trends against the CoF. 10
From the research discussed above, it can be seen that environmental factors (seen in the variation of humidity and temperatures) have an important effect on the adhesion levels, hence the need to study it further.
Safety KPI comparison for 2012 and 2016.
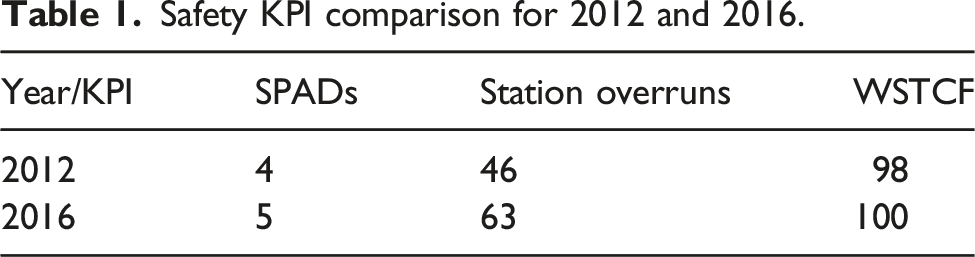
Thus, proving that low adhesion is still a major railway safety issue. It is therefore important to analyse and understand the effects of temperature and humidity on the adhesion level on the railhead to prevent the incidents caused and ultimately reduce railway running costs.
Aim and objectives
The aim of this research was to analyse and understand how the change in rail temperature and humidity affects the measured railhead friction. This was achieved by using weather and friction data collected over Autumn/Winter 2019–2020 to study the trends developed.
Measuring wheel/rail interface friction
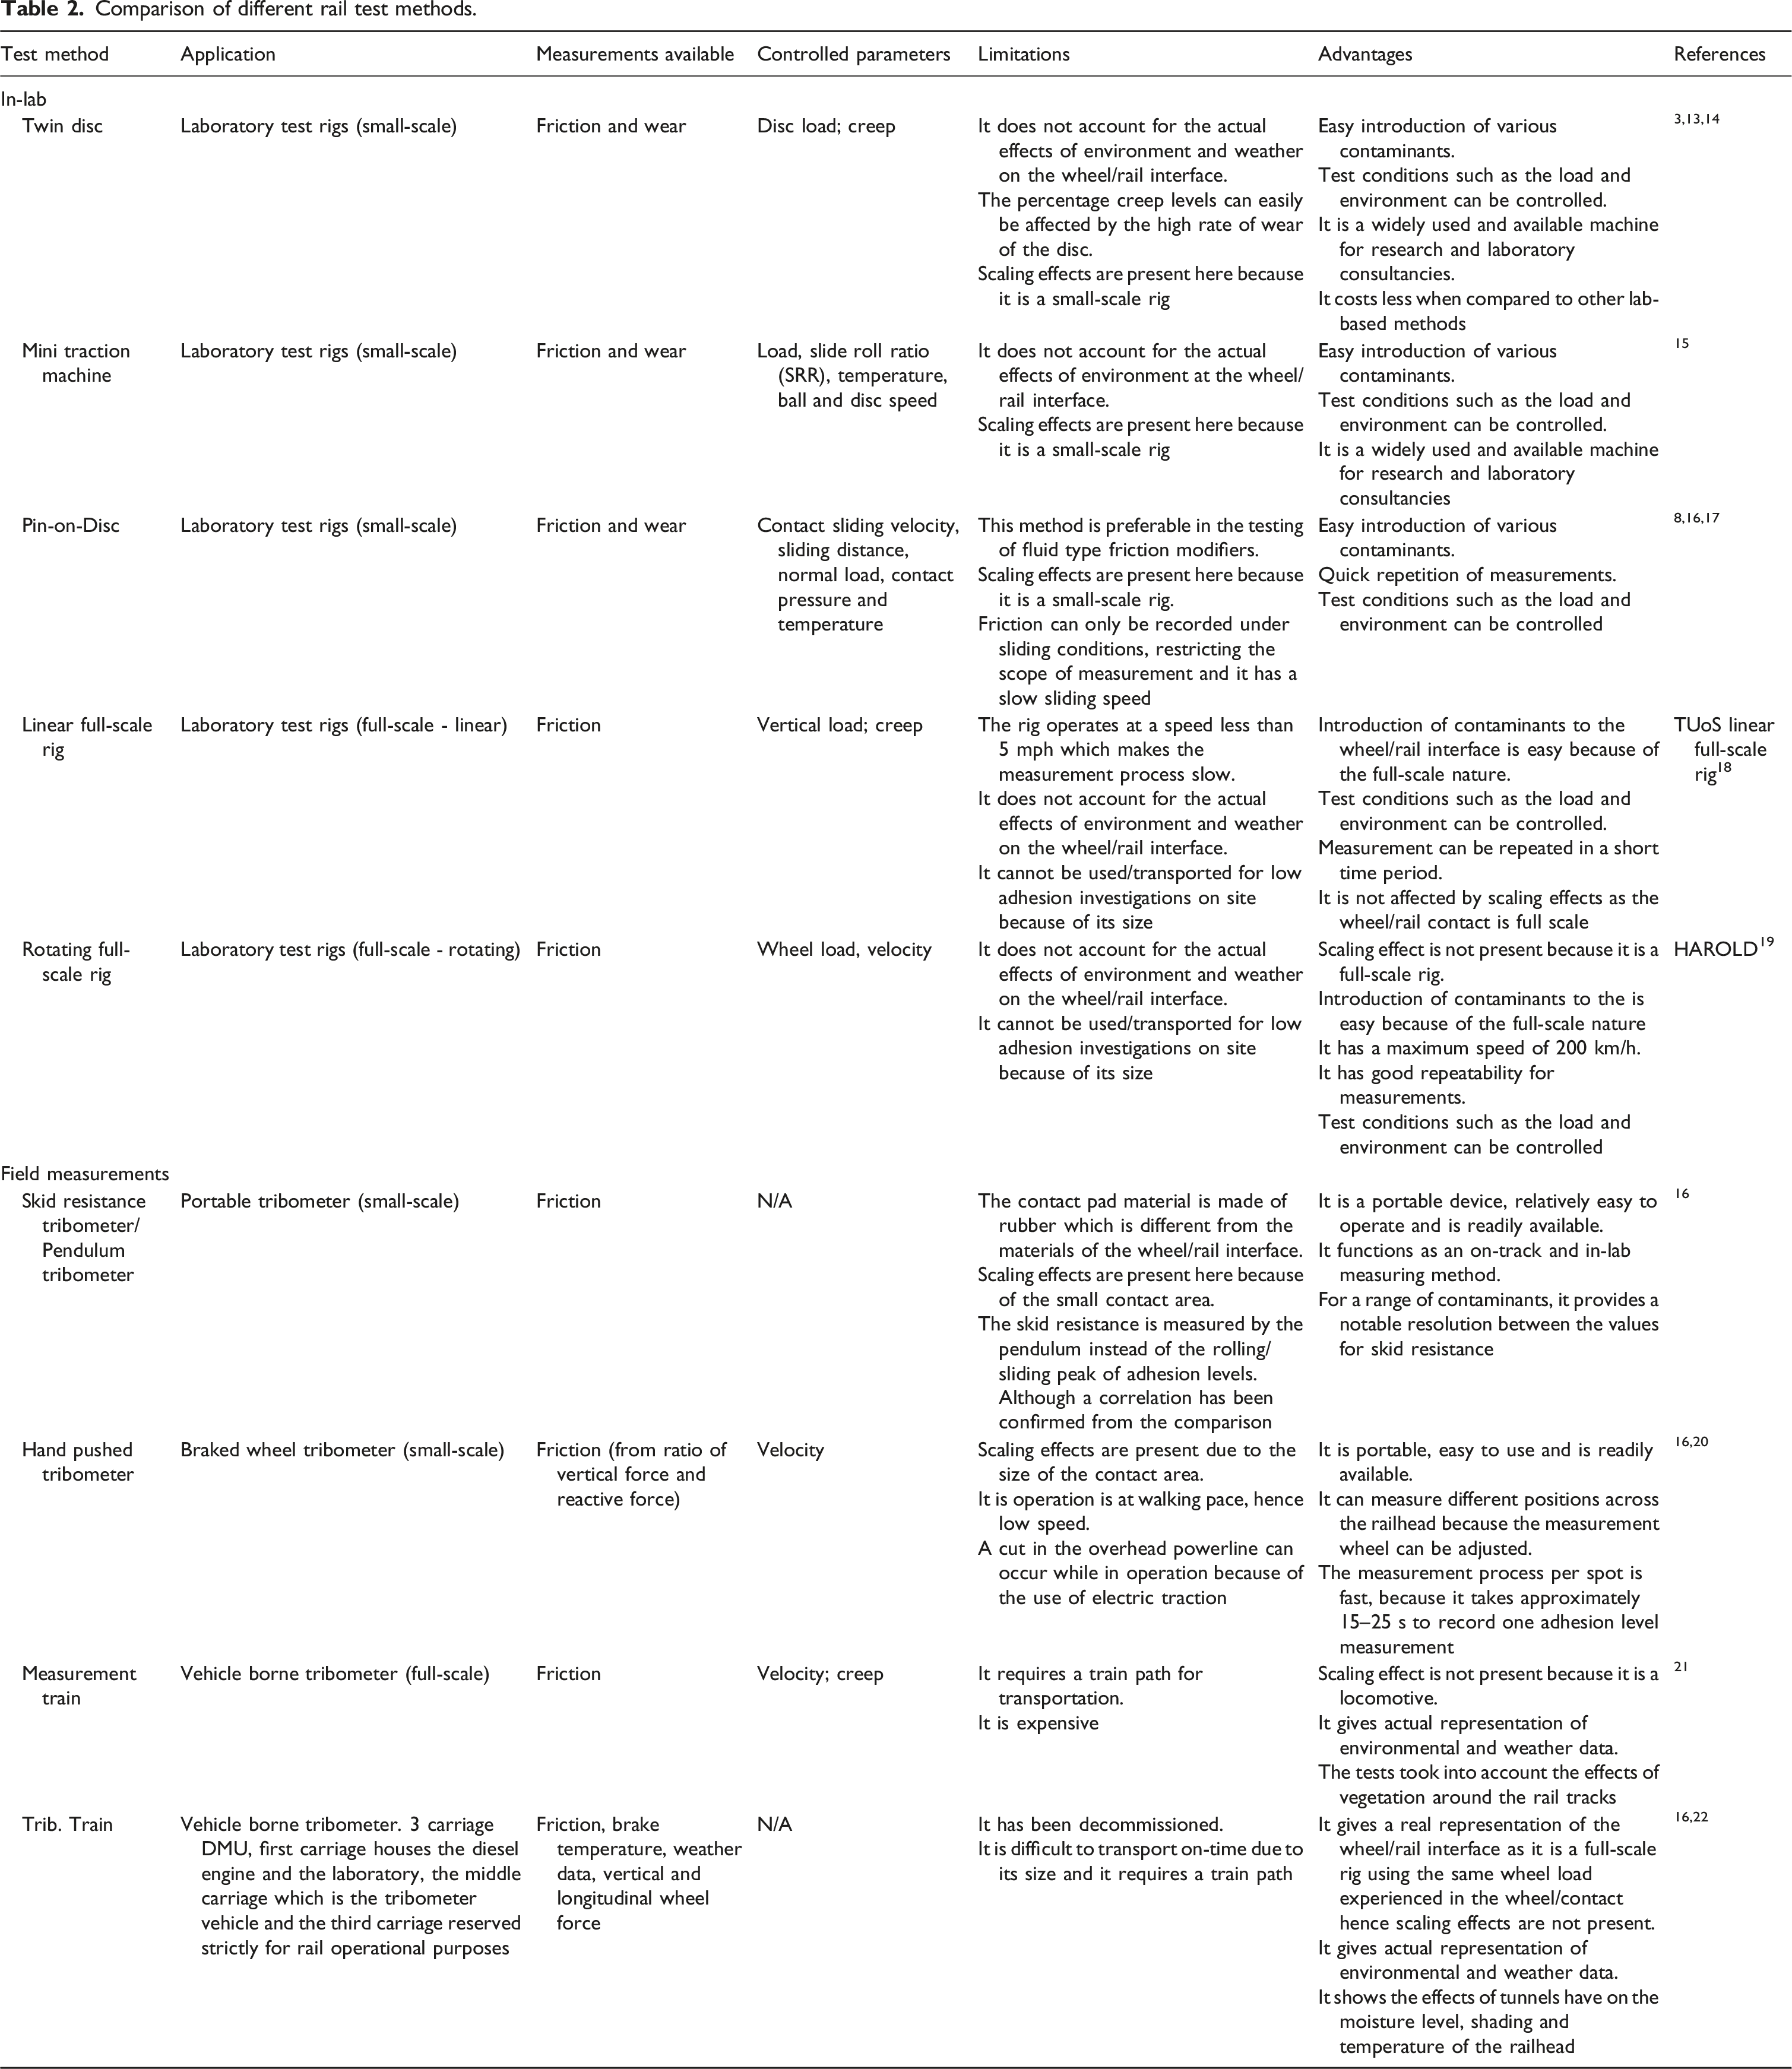
There are various methods for measuring the friction level at the wheel/rail interface which makes it possible to characterise the effects of low adhesion and aids in the testing the efficiency of low adhesion mitigation techniques. The methods for friction measurements can be broken down into; Laboratory test rigs Portable railhead tribometers Vehicle borne tribometers
Comparison of different rail test methods.
Of the field-based measurement approaches, the most useful are those based around railway vehicles where an actual wheel/rail interface measurement can be taken for the correct contact conditions. Also, data can be collected continuously as the vehicle moves (see Figure 2(a) and (b)). The data collected also shows differences due to low adhesion (see Figure 2(c)). However, such approaches are hard to access and get to a specific site.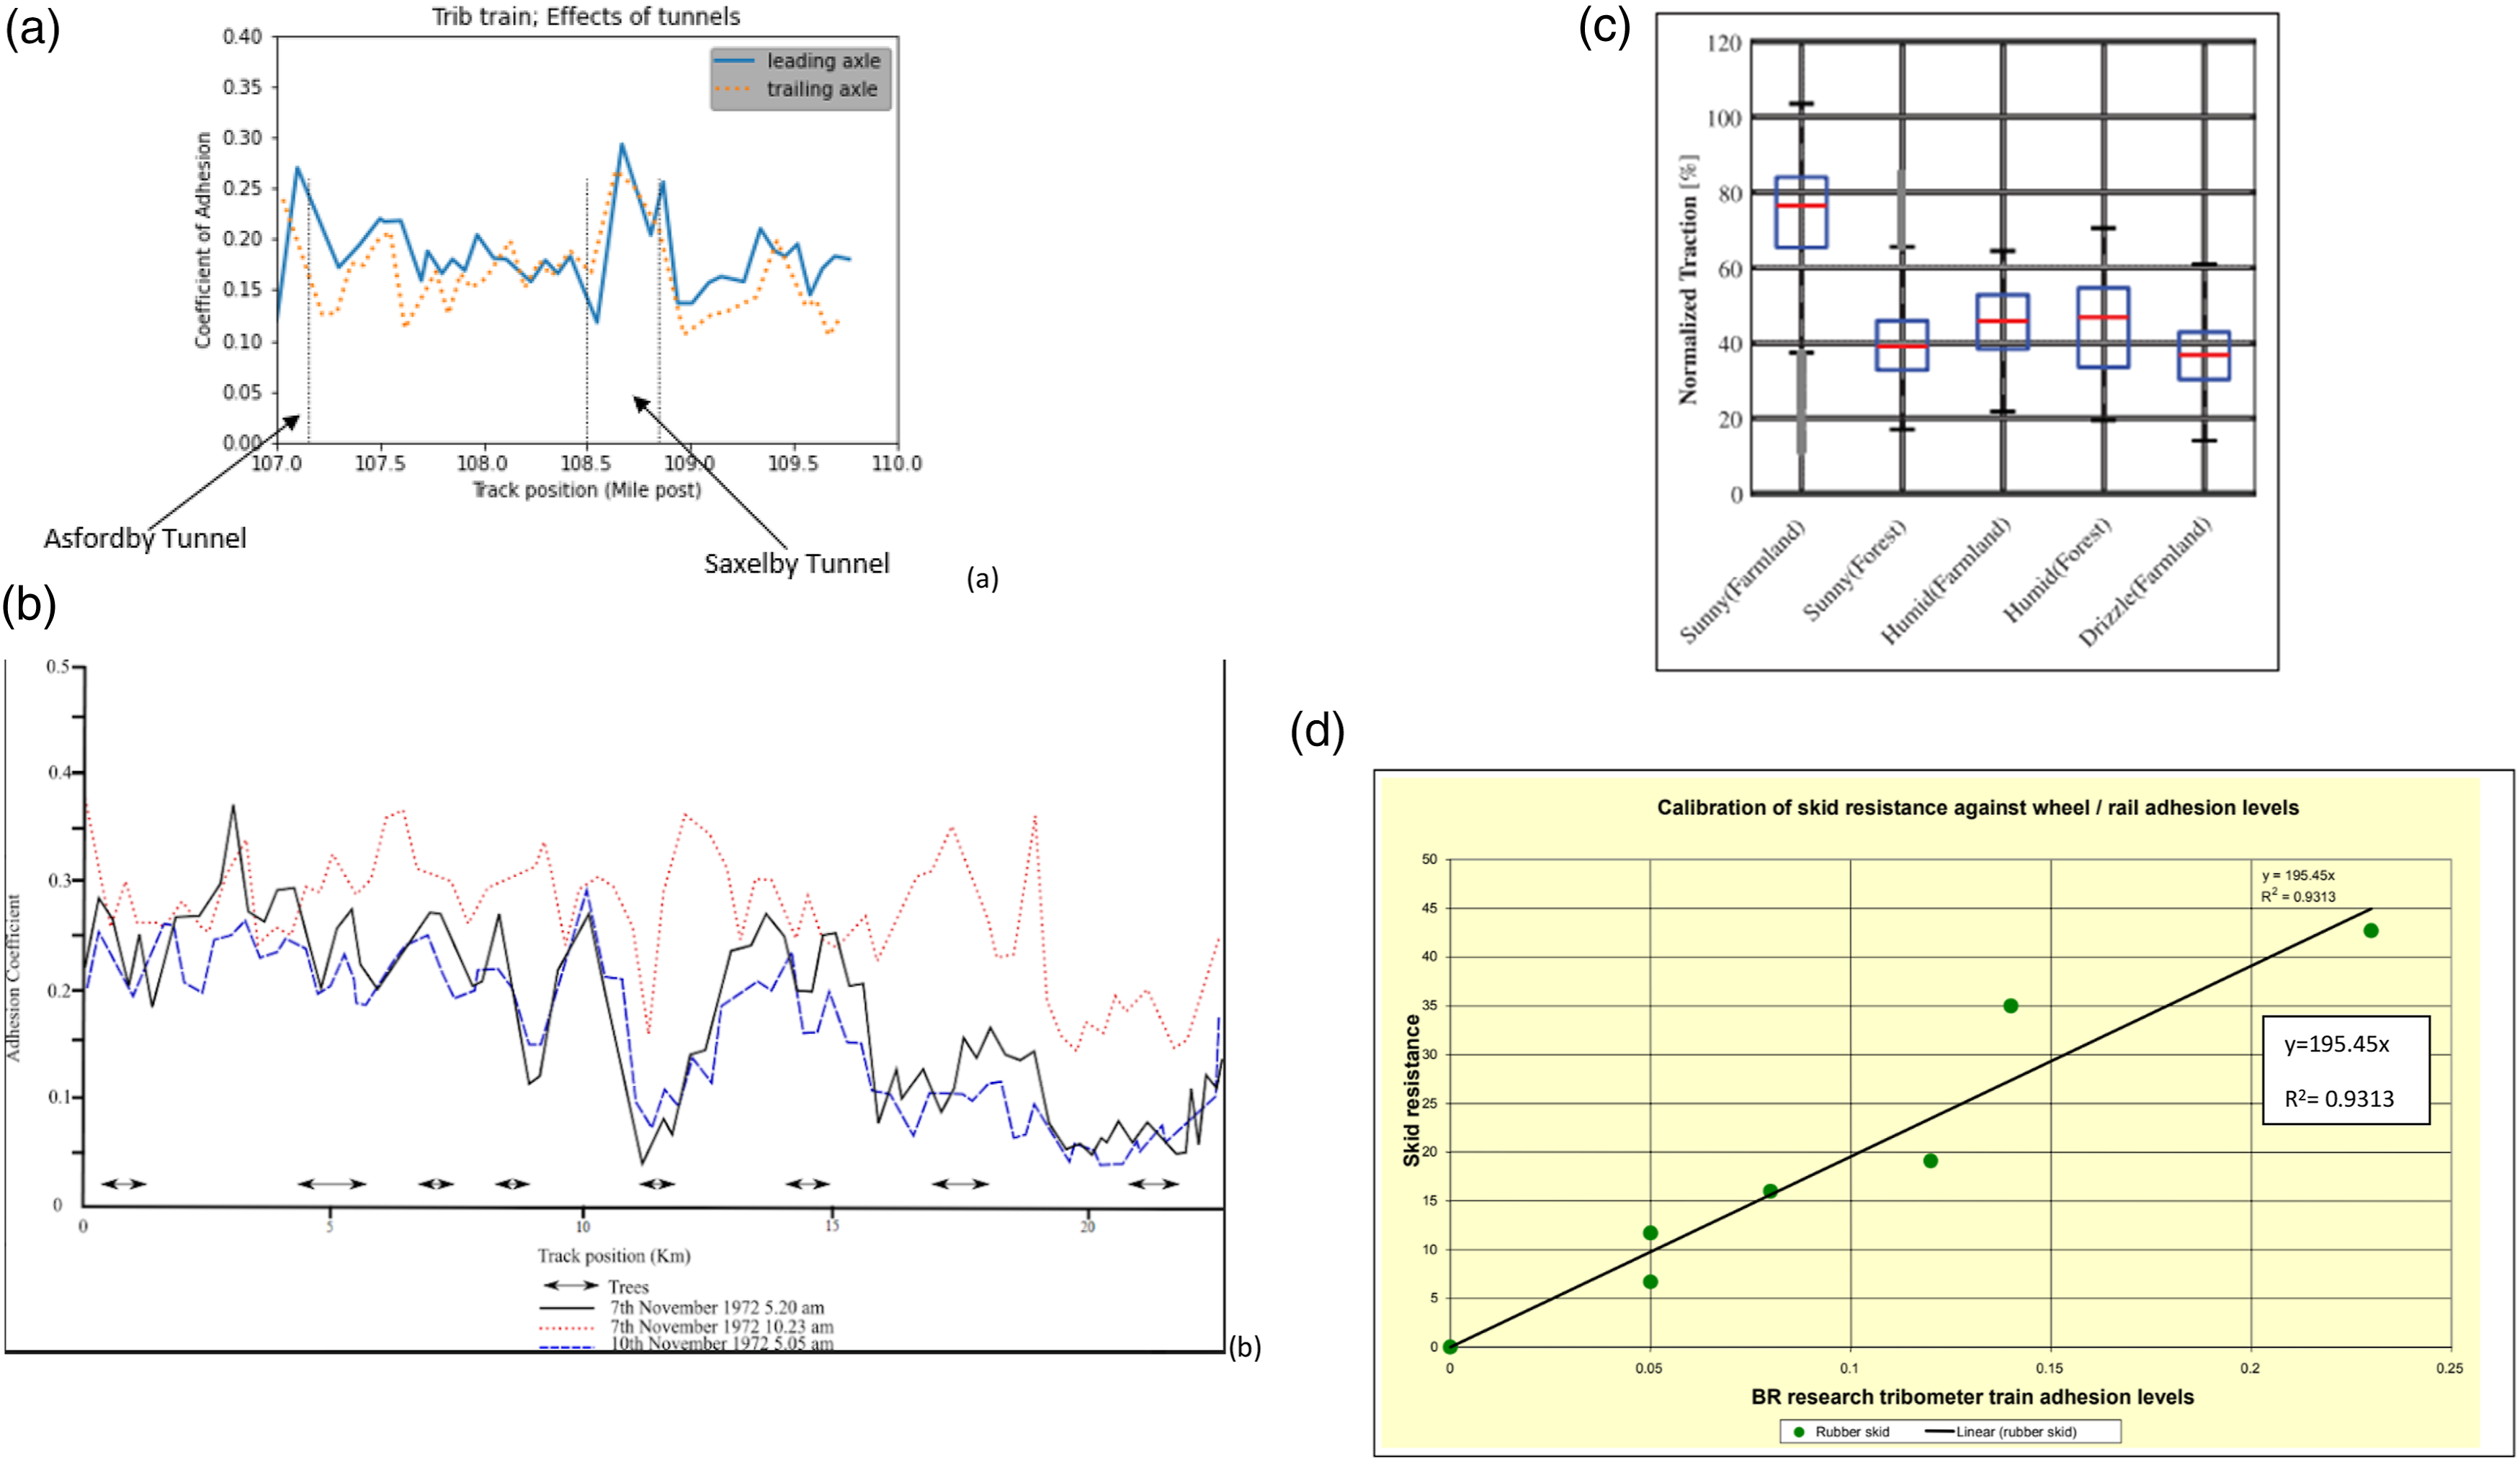
Due to these reasons the pendulum tribometer is the tool of choice because it is portable and takes friction measurement under the actual environmental conditions and can measurement in a specific place, unlike the push-tribometer. The pendulum tribometer does not give an accurate representation of the wheel/rail interface contact pressure as it uses a rubber pad to strike a section of the railhead. However, RSSB guidance on low adhesion friction measurements
16
reports work comparing the friction values obtained from a pendulum tribometer and the British Railway Research Trib. Train at the same point on track at different conditions. The comparison graph shows a linear trend line fit (see Figure 2(d)), and this showed a 93% confidence level from the
Methodology
Apparatus
A pendulum tribometer is shown in Figure 3(a) and was used to carry out the readings of the railhead friction values, due to its portable nature and ease of use. This mobile friction measurement tool (originally created as a “slip resistance meter”) functioned as a measurement device for slip resistance of floors/pedestrian surfaces, roads and can be used in slip incidents reporting.13,23,24 (a) Fully labelled diagram of the pendulum tribometer and (b) Pendulum tribometer schematics diagram, where a is the measurement scale; b is the pendulum arm pivot (with adjustable height); c is the pendulum arm; d is the rubber pad; e is carriage handle; f is the levelling screw; g is the Pendulum arm head.
13
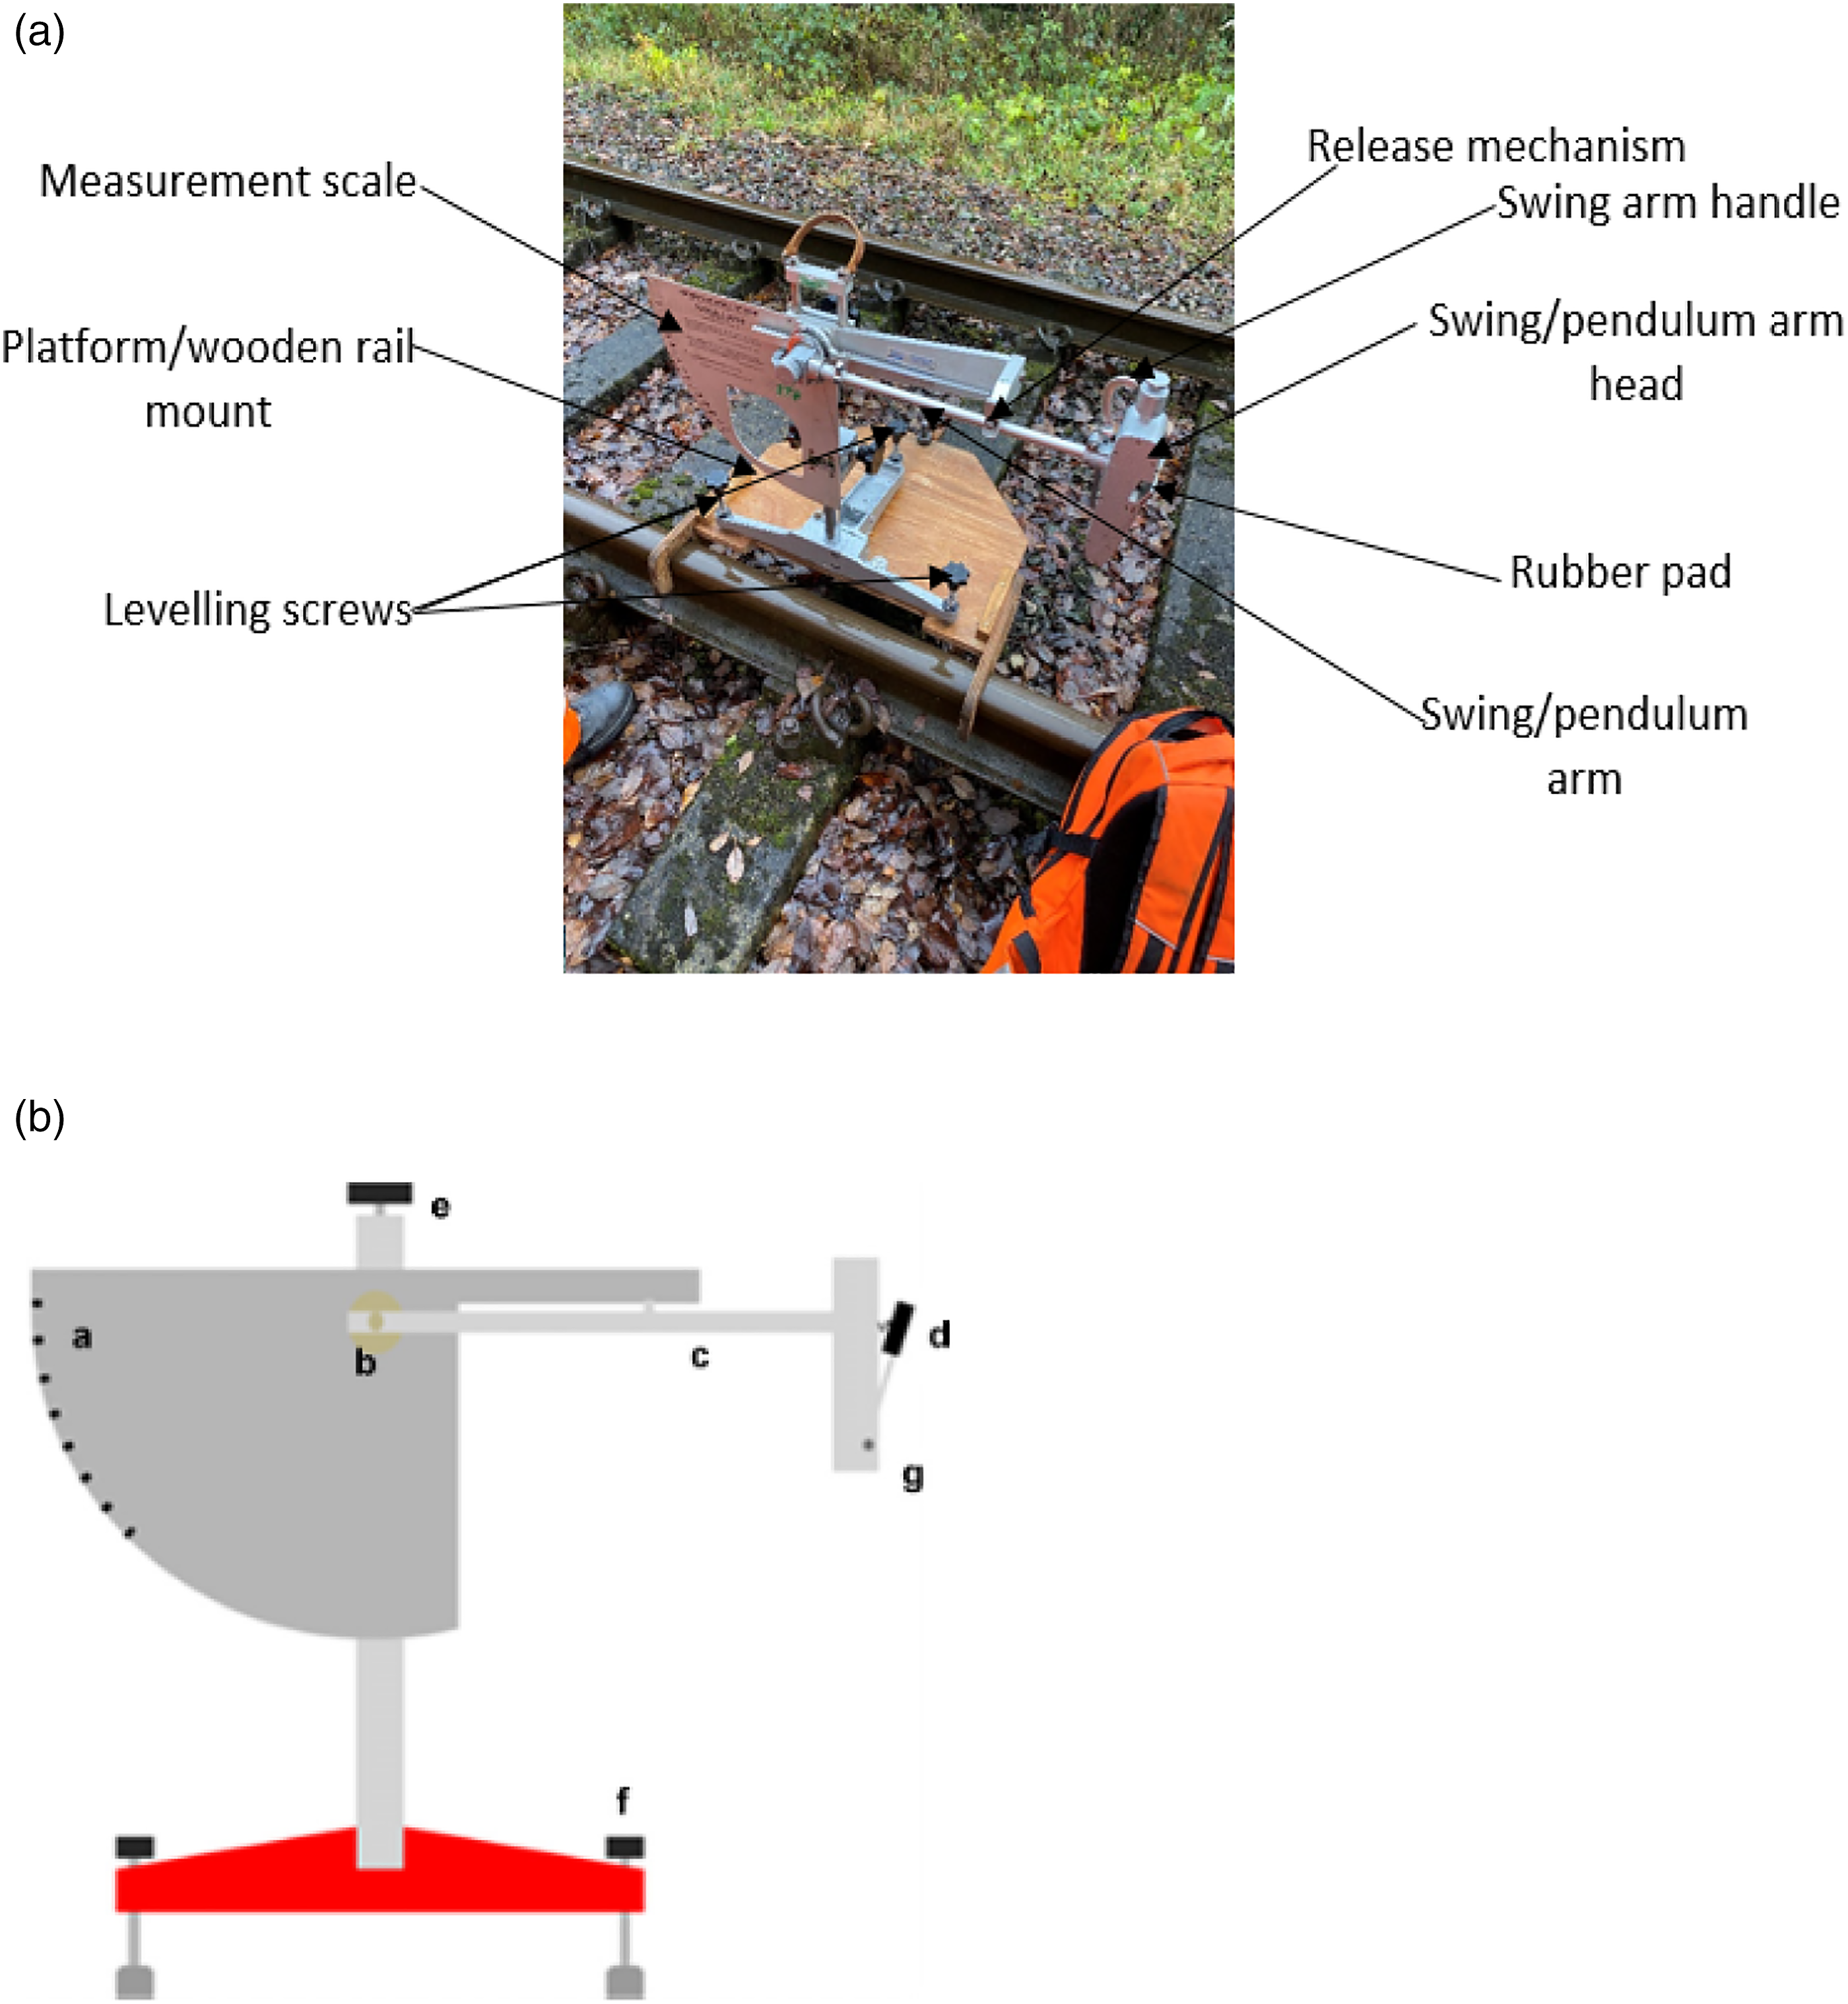
Lewis et al. 25 Successfully converted a pendulum tribometer to a tool for measuring railhead friction. The pendulum tribometer functions similarly to the principle for that of a Charpy impact test, an energy loss principle. The friction reading is taken when the pad (d) of the pendulum arm head strikes the test material, the contact produces friction consequently producing an energy loss (pendulum test value), which is measured on the scale (a), as seen in Figure 3(b), as the arm swings through.
The choice of rubber slider used on the pendulum tribometer was the 96-rubber slider (Four-s rubber). It was selected for enhanced wear resistance coupled with its like other existing test methods. The contact length between the rubber pad and the test surface (railhead) is 127 mm and was used to derive a formula to convert the pendulum test value (PTV) to the friction coefficient, μ.
24
The equation given as: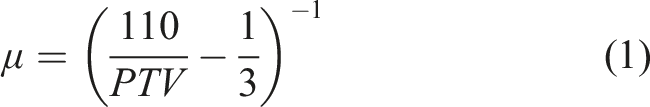
This works well for flat surfaces where the pad is in full contact across its width. It is stipulated that for this equation to be valid the swing must have a contact length of 127 mm on the surface being assessed. For a railhead the pad is not in contact across its width so the equation is less accurate. It was used in previous work
23
where pendulum values were compared to twin disc CoFs and the correlation was satisfactory, but not for all conditions. In this work it was decided to use the formula derived from the BR research Trib. Train conversion (from Figure 2(d)), which is given as:

The resulting equation (3) was used to convert the PTV to the friction coefficient in this work.
Weather elements which are important when examining adhesion include: RH (%), air temperature (°C), and railhead temperature (°C).
These were recorded using a non-contact Infra-Red (IR) thermometer. Other weather conditions (such as: drizzle, heavy rain, sunny, cloudy amongst other possible conditions) were recorded per day and time of the site visit.
RH is defined in 26 is a measure of the amount of water vapour in the air in comparison to how much the air can hold at that same temperature, this varies with air pressure. These parameters give an indication of the level of moisture in the railhead’s surrounding.
To define the levels of RH values measured in the course of the site visits carried out in this research, the average, minimum and maximum RH for the UK in the last year were considered to provide a guideline. Data collected from an independent weather station in Hampstead, London was considered to give a representative range of RH values across England. The average annual RH for the last year as at (08-08-2021) is between 57% (05-04-2021) for minimum average and 95% (5-12-2020) for maximum average. The lowest recorded minimum of 20% (9-06-2021) and highest recorded maximum of 98% (04-02-2021) was obtained in a single day. 27
Using the above data as a guideline, RH levels can be defined as:
Railhead images were taken using a GoPro camera to aid the comparison of the railhead conditions at different sites. The images gave a physical representation of what sort of contamination a railhead had, in terms of the presence of oxidisation (rust formation), leaf layers, moisture, dry or finally, no physical contamination (clean railhead).
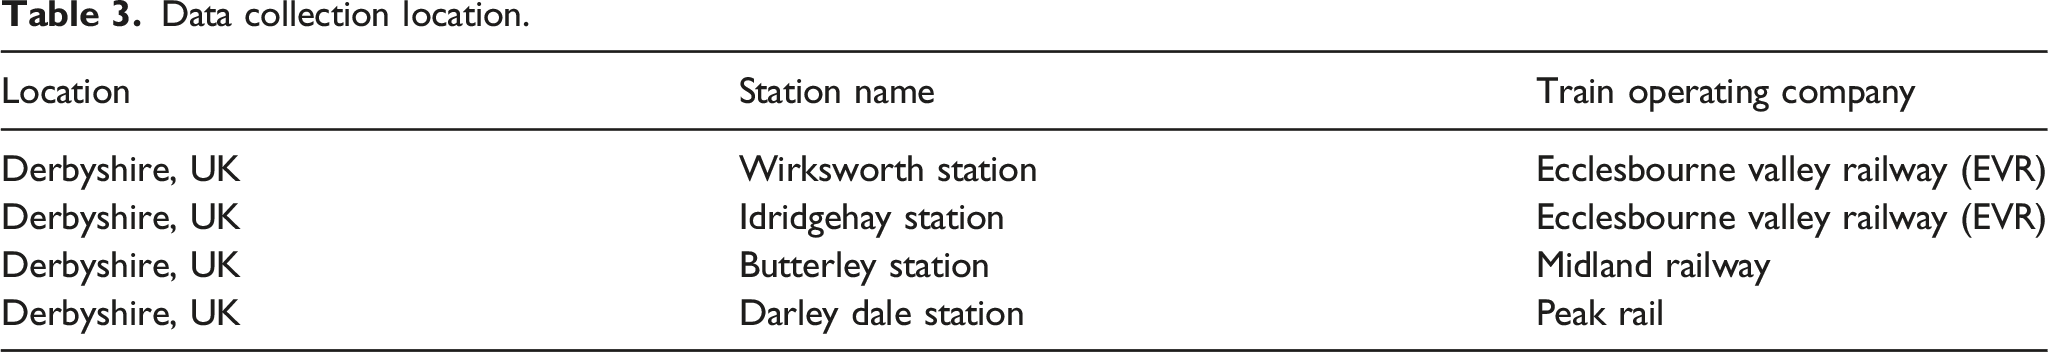
Data collection location.
Test methods
At each site visit the aim was to gather as many PTV readings at different points on the railhead with corresponding weather data and railhead photographs. The following steps were employed: The pendulum tribometer was visually inspected for damages before assembly and then set-up on the selected section of the rail. The Infra-Red thermometer was used to record the RH, railhead, and air temperature. The pendulum tribometer was set on a wooden mount to balance the tribometer on the railhead and it was set level using the three adjustable levelling screws (confirmed via a spirit level). The fittings of each part of the pendulum tribometer were checked by swinging the pendulum arm for any loose fits, or potential damages. The swing/pendulum arm head was clamped securely in the spring-loaded release mechanism and the GoPro camera was clamped on the pendulum frame to take the railhead image. After the image was taken, the GoPro was detached as it will be an obstruction for the swing/pendulum arm movement. The rubber slider was checked for damage, its scale was set zero and the contact length between the rubber pad and the railhead was set to approximately 127 mm.
13
Test site information
Butterley, Derbyshire (midland railway), UK
Data was collected from this site on four different dates: 05-09-2019; 01-10-2019; 22-01-2019; 14-11-2019.
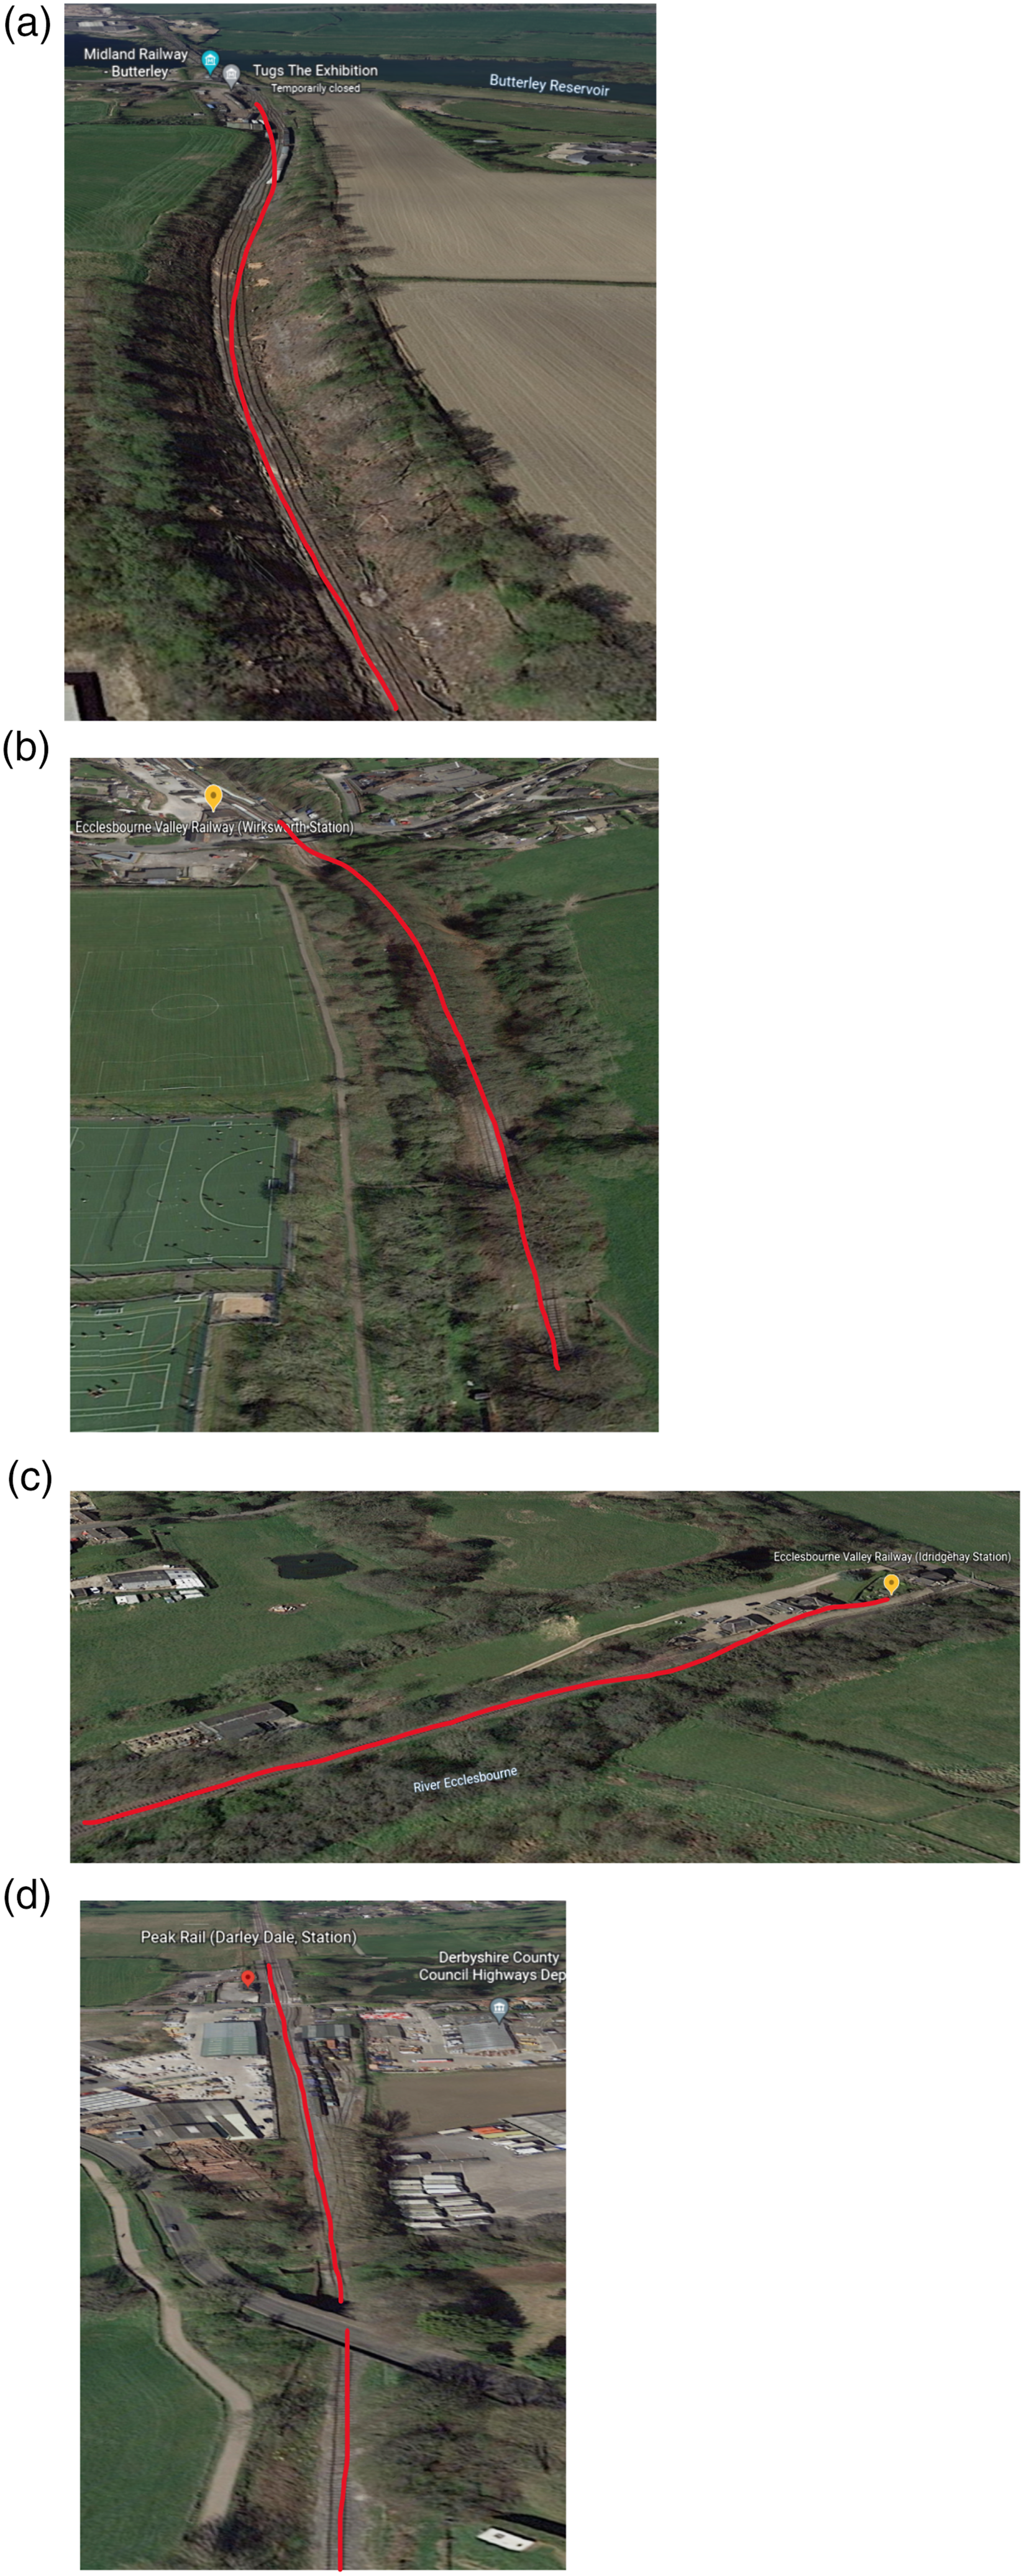
The track side and path of measurements depicted by the red line (seen in Figure 4(a)) had a sparse tree coverage at the time of the visits. The trees were at about a 7 m distance from both sides of the track and the only effect they had on some of the track sections was shading caused by the overhead angle of the sun. (a) Aerial view of Track at Butterley, “red line” showing measurement path,
28
(b) Aerial view of track at Wirksworth, “red line” showing measurement path,
29
(c) Aerial view of track at Idridgehay, “red line” showing measurement path and (d) Aerial view of track at Darley Dale, “red line” showing measurement path.
30
At the time of the visits there was no visible sign of the leaves near the track. A section of the track is located across a very low traffic road which minimises the effects of contaminants on the railhead.
Wirksworth and Idridgehay, Derbyshire, (ecclesbourne valley railway EVR), UK
Data was collected from these sites on the following dates: 14-08-2019; 28-08-2019; 16-10-2019; 13-11-2020; 20-11-2020; 25-11-2020; 01-12-2020; 08-12-2020.
The track side has a dense tree coverage in the summertime and early autumn, the trees lost most of their leaves by the end of November, hence a sparse tree coverage into the winter (as shown in Figure 4(b) and (c)). The path of measurements is depicted by the red line.
The track sections that were measured were not located near the road (seen in Figure 4(b)). The rail tracks were still in use in 2019 (date of track visit), which meant the railhead was relatively clean with little oxidation. However, visits in 2020 (during the COVID-19 pandemic) meant the track was less used than normal and had a visible layer of oxides on the railhead. The EVR lines were not operational during the lockdown, they only had a few operational trains in a 9-month period, used to ‘warm up’ the trains and for routine maintenance checks.
Darley Dale, Derbyshire (peak rail), UK
Data was collected from this site on the following dates: 02-10-2019 and 08-11-2019.
The track side had sparse tree coverage at the time of the visits, the trees hung over very little of the track. There was tree shadow being cast over a section of tracks resulting in protection from the sun, and likely less heat exposure during the day. The path of measurements on the track (depicted by the red line) is located alongside a low traffic road, seen in Figure 4(d).
Results
The railhead temperature, RH, and railhead friction (μ) collected from each site were collated for each measurement (per day) to help understand their relationships. The μ data was plotted on the y-axis as the dependent variable while the RH was plotted on the x-axis and railhead temperature was represented on a colour map as independent variables, enabling visualization of effects of RH and railhead temperature on μ.
The data was collected ensuring environmental parameters varied across the points of measurements at some sites, causing significant variations in the measured μ. This is represented in Figure 5. μ against relative humidity with a colour map representing railhead temperature for the complete data.
Not all data plots from Butterley, Wirksworth and Idridgehay are included individually, to avoid repetition. The plotted graphs not covered have been included in the Appendix.
Butterley, Derbyshire UK
The plots of the measurements taken at Butterley are shown in Figure 6(a)–(c) and the independent effects of high humidity on the railhead friction are highlighted. (a) μ against relative humidity with a colour map representing railhead temperature for Butterley on 22-10-2019, (b) Dry railhead under shade (left) and damp railhead under shade (right) at Butterley on 22-10-2019 and (c) μ against relative humidity with a colour map representing railhead temperature for Butterley on 01-10-2019.
Figure 6(a) shows a noticeable cluster of lower μ values between 0.12 and 0.15 were seen on 22-10-2019, around the region of high RH 72%−7 6% and lower temperatures for late October 5°C–10°C compared to μ of 0.30–0.32 recorded in the region of higher temperature 10°C–16°C and lower RH 54%–62% where the railhead was visibly, dry shown in Figure 6(b).
Figure 6(c) shows data collected 01-10-19, temperatures were in the range of 13.5°C–15°C combined with high RH of 70%–90% due to drizzle at the time the measurements were taken.
Darley Dale, Derbyshire UK
Figure 7(a) shows μ readings measuring within a temperature range of 9°C–16°C with low RH. There was a standout μ of 0.13 compared to range 0.22–0.38 was recorded, shown circled on the image, the railhead image for the standout reading can be seen in Figure 7(b) showing significant rust contamination. (a) μ against relative humidity with a colour map representing railhead temperature for Darley Dale on 02-10-2019, (b) Corresponding railhead image for the Darley Dale μ of 0.13, (c) μ against relative humidity with a colour map representing railhead temperature for Darley Dale on 08-10-2019 and (d) Railhead with dew present (left) and railhead with exposure to the sun (right) at Darley Dale on 08-10-2019.
Measurements taken under shaded and sunny conditions were recorded in Figure 7(c) at a temperature range of 7.5°C–18.5°C and RH range of 50%-68%. Dry railhead conditions yielded a μ of 0.28–0.35, a sample of the dry sunny railhead can be seen in the right-hand image of Figure 7(d). A low μ of 0.13 was recorded under shaded conditions with dew present as seen in Figure 7(d) (left).
Wirksworth and Idridgehay, Derbyshire UK
Below in Figure 8(a)–(i) are plots of the measurements and railhead images taken at Wirksworth and Idridgehay. These figures show the effects of high relative humidity in conjunction with railhead temperature on the railhead μ. The independent effect of the relative humidity on the railhead μ can also be seen. (a) μ against relative humidity with a colour map representing railhead temperature for Wirksworth on 14-08-2019, (b) μ against relative humidity with a colour map representing railhead temperature for Idridgehay on 14-08-2019, (c) Plot of μ against relative humidity with a colour map representing railhead temperature for Idridgehay on 21-11-2019, (d) Shaded dry railhead (left) and artificially wetted railhead (right) at Idridgehay 21-11-2019, (e) μ against relative humidity with a colour map representing railhead temperature for Wirksworth on 21-11-2019, (f) Dry railhead (left) and damp railhead (right) from Wirksworth on 21-11-2019, (g) μ against relative humidity with a colour map representing railhead temperature for Wirksworth (left) and Idridgehay (right) on 13-11-2020, (h) Railhead image with visible oxidisation with μ of 0.33 from Wirksworth on 13-11-2020, (i) μ against relative humidity with a colour map representing railhead temperature for Wirksworth (left) and Idridgehay (right) on 20-11-2020 and (j) μ against relative humidity with a colour map representing railhead temperature for Wirksworth (left) and Idridgehay (right) on 08-12-2020.
Figure 8(a) shows a temperature range between 15.6°C and 16.9°C and a RH ranging between 88.5% and 97% with μ ranging between 0.09–0.16 for Wirksworth. Data on the same date from Idridgehay shown in Figure 8(b), with slightly higher temperature range of 17.25°C–19.0°C and RH of 97%–100% with μ ranging between 0.08 and 0.17 for a wet day.
Figure 8(c) presents data from Idridgehay of artificially wetted railhead and the natural railhead state while Figure 8(d) shows railhead images sample of both railhead conditions. The μ ranged from 0.11 to 0.33 with railhead temperatures of 4.2°C–5.0°C and RH ranges of 71%–79%.
Wirksworth data collected on the same day shown in Figure 8(e) with railhead temperatures ranging from 1.7°C to 4.0°C and Influence of RH between 53.5% and 71% resulting in a μ of 0.12–0.33. Figure 8(f) shows image sample of the railhead state of the under dry conditions (left) and the one damp patch condition (right) highlighted in the plot shown in Figure 8(e).
Figure 8(g) presents data collected on the same day from both sites with upward progression of environmental conditions with RH ranging from 60% to 78% and 69% to 80% with railhead temperatures of 3.6°C–9.4°C and 7.8°C–10.9°C for Wirksworth and Idridgehay respectively. The state of the railhead showing visible oxidation present at the time of data collection can be seen in Figure 8(h).
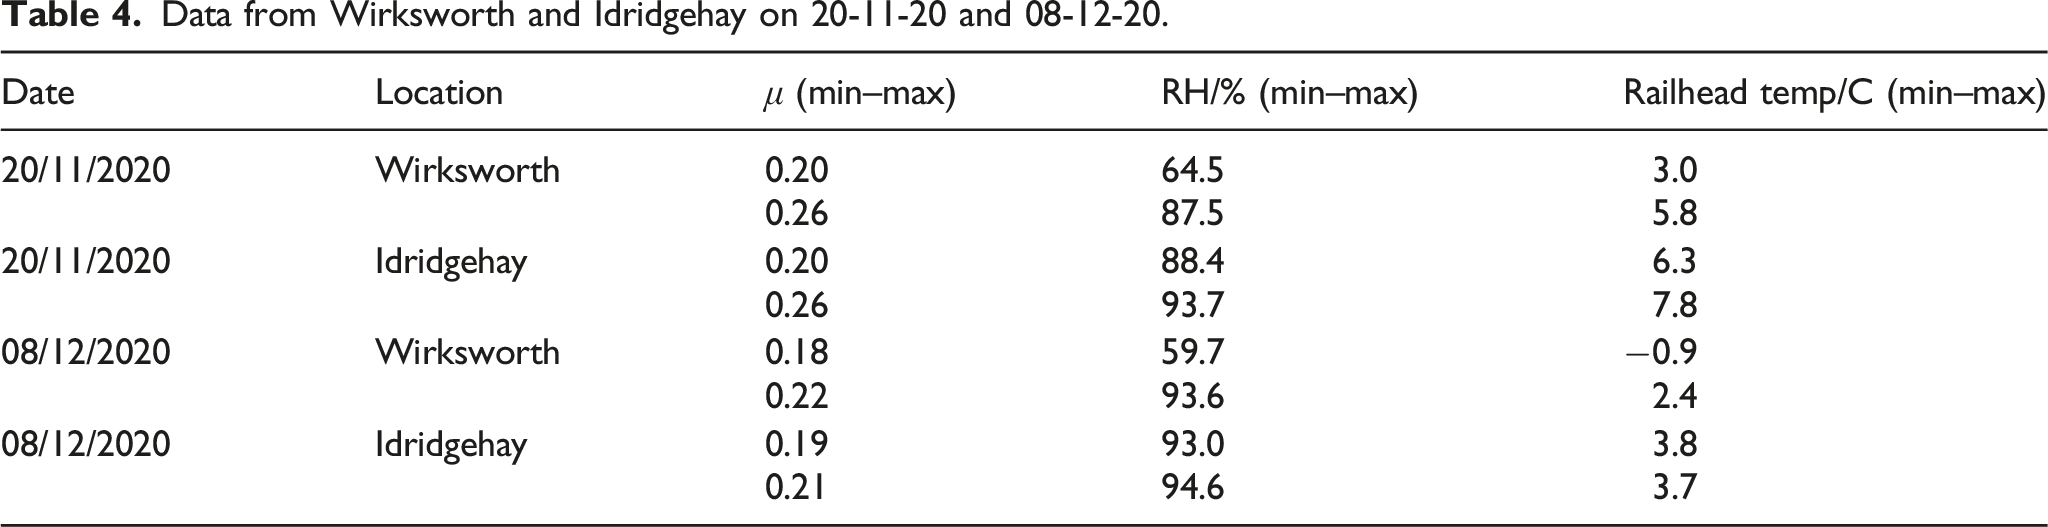
Data from Wirksworth and Idridgehay on 20-11-20 and 08-12-20.
Discussions
Figure 5 shows the plot of all the data analysed in this work. When compared to Figure 1(b) showing the ranges of μ, the majority of the measured μ values falls under the “intermediate” friction level. The second popular region is the low friction regime and then a small cluster entering the range of ultra-low friction. The plot shows that very high humidity strongly contributes to a lower adhesion level. The plot also shows that low adhesion can occur at a warm temperature when under favourable environmental factors which will be discussed further below.
Butterley, Derbyshire UK
Work done by researchers in (Zhu et al.) on a Mini-traction machine showed that there was a considerable decrease noticed in the μ from approximately 0.16 of the rough specimen used when submerged in water of 5°C compared the a μ of approximately 0.16 at water of 20°C. 15 Although this experiment does not give a representation of the field conditions, but it supports the occurrence of lower μ under reduced temperature. Lower μ was recorded in a shaded and damp section of the track. It was noticed that there was a temperature drop in the region (comprised of four data points circled in black) of the lowest μ which is the right conditions for dew formation where warmer temperatures allow for moisture to be held in the air and a drop in the temperature (as seen on the graph in Figure 6(a)) releases the moisture as dew. 31 This accounts for the higher RH reading in that region. While the higher μ values were recorded on a dry section of the track.
A μ of 0.16 on the plot was recorded at a medium RH of 62.2% and lower temperature of 2°C, has shown that even at low temperatures the RH must be high before any significant drop in the μ value is recorded. At this point the moisture content on the railhead had reduced supported by the RH value recorded.
Although the temperatures recorded (13.5°C–15°C) with high RH (70%–90%) on 01-10-19 (seen in Figure 6(c)) are not classified as low, the data from the plot shows that if the temperature were to have dropped further (on some points of the track) the friction would potentially have reduced. The data shows the μ reducing as the railhead temperature reduces with the high RH in the presence of moisture.
The second lowest temperature recorded on the same date was 13.6°C with a RH of 74.5% which accounted for the lowest μ of 0.125 recorded. This shows that low adhesion can occur in warmer temperatures and with different railhead contaminants under the right conditions, especially high RH on the railhead.
Darley Dale, Derbyshire UK
The highest RH recorded on 02-10-2019 at Darley Dale of 64.5% with a temperature of 11.7°C produced the lowest μ of approximately 0.13, shown in Figure 7(a). Ideally, it is expected that the μ values should all be in the intermediate region as the railhead conditions were dry with a combination of sunny and shade effects, but the lower μ reading stood out which was possibly caused by contamination of the railhead at that point, which was very likely a patch of grease noticed on the railhead shown in Figure 7(b). The temperature variation was caused by the transition to shady environment from sunny environment. Shade and track orientation causes a drop in railhead temperature. 32
On 08-10-2019, similar trends were noted as on the previous visit with similar weather conditions. Although a lower μ of 0.13 was recorded within the medium RH range of 59.7 and railhead temperature of 8.7°C (see Figure 7(c)). The presence of dew due to the drop in the temperature (this can promote the “wet-rail” phenomenon) on the rail section explains the drop in μ as the presence of moisture contributes to the reduced friction value on the railhead if mixed with oxides, which were clearly present here shown in Figure 7(d). 5
Wirksworth and Idrigdehay, Derbyshire UK
On 14-08-19 in Wirksworth, there was a small temperature range on the high side between 15.6°C and 16.9°C and a high RH ranging between 88.5% and 97% with weather conditions of heavy rainfall and wind, shown in Figure 8(a). At this temperature the μ values recorded were lower than expected and this was due to the high RH levels caused by the rainfall and the moisture deposited on the railhead. The lowest μ of 0.097 was recorded at the highest temperature and highest RH, 16.9°C and 97% respectively.
The μ trend at Idridgehay on 14-08-19, seen in Figure 8(b), was like that of Wirksworth as they are located 3.7 miles apart with similar weather conditions. The lowest μ recorded was 0.081 under light rainfall with 100% RH and railhead temperature of 18.2°C. This μ value is very close to the ultra-low friction region. In-lab tests carried out by 9 on a ball-on-disc apparatus supported that low amount of moisture (such as light rainfall) brought about a significant drop in μ, while flooding conditions did not cause any noticeable drop in the μ values.
Data presented in Figure 8(c) had two sections of the railhead were artificially wetted at Idridgehay on 21-11-2019 resulting in a lower μ of approximately 0.11 and 0.15 compared to the recorded range of 0.30–0.33 on the dry railhead in overcast conditions, shown in Figure 8(d).
While at Wirksworth on the same day a μ of range 0.29–0.33 was recorded (shown in Figure 8(e)) because the railhead was dry with overcast conditions, but a section of the rail which was damp had a μ of approximately 0.12, shown on Figure 8(f). The cause of dampness at that point may be as result of its closeness to a field (vegetation) where condensate from the plants may have been dispersed by wind. 21 Conducted tests at the Vuz Velim test tracks which had a section alongside a farmland, a drop in traction force was noted on that section citing moisture or visible leaf fall as the cause. Both the wet phenomenon (referring to when there is visible moisture on the railhead) and damp phenomenon (referring to when there a moderate moisture coverage on the railhead which may be visible or felt by touch) show the effect moisture presence on the railhead has on lowering the μ.
The unused rail tracks caused by the Covid-19 lockdown, resulted in some parts of the railhead having slight oxidation which will have influenced the PTV readings and the μ values.
On 13-11-20 in Wirksworth (Figure 8(g)), it was sunny and dry, hence the μ values recorded were in the intermediate range of μ between 0.258 and 0.327. A lower μ of 0.183 was recorded on the same day, although not ultra-low but it was significantly lower than the range recorded for the weather conditions. This can be attributed to some visible oxidisation of the railhead at that point of measurement as seen in Figure 8(h). Similar results were recorded in Idridgehay, shown on the right-hand of Figure 8(g), without the oxidised railhead μ data noted at Wirksworth.
From Table 4, on 20-11-20, the lowest μ ranges were recorded at a combination of low temperatures between 3°C and 3.9°C and RH of 78.5%–80.6% at Wirksworth. The μ recorded were in the intermediate range corresponding with expected wet conditions.
At Idridgehay a higher RH of 93.7% was recorded with a corresponding μ of approximately 0.24 within the intermediate μ range likely due to the temperature of 7.3°C not being low enough.
Data collected on 08-12-20 showed μ values ranging between 0.180–0.219 and 0.178–0.214 for Wirksworth and Idridgehay respectively. The μ values are similar to the expected values for wet railhead between the low and intermediate range for μ with high RH levels reaching 94.6% at Idridgehay and 93.6% at Wirksworth.
The temperatures recorded at Wirksworth ranged between −0.9°C and 2.4°C with the lowest μ of 0.18 occurring at a temperature 0.1°C and a RH of 67.3% under raining conditions. Similar trends were noted as Idridgehay as the temperature reduced, and the RH increase the μ decreased as seen in the plot in Figure 8(j) right-hand side. This suggests that lower temperatures also contribute to the occurrence of low adhesion. These results were recorded without physical contamination meaning the presence of contaminants will further increase the risk of low adhesion occurring. Research done on simulating ice formation on a railhead using a pin-on-disc tribometer showed that in the absence of ice/snow on the disc surface with a temperature range of temperature of 3°C to −15°C, had low temperature embrittlement acting which was the main cause of wear and increased friction. When an ice layer formed with the further temperature reduction to −25°C, the ice layer condensed forming a layer of moisture on the surface which caused the friction to drop, hence reducing wear. 33 The researchers also stated that with the addition of snow crystals to the pin-on-disc test with an increasing temperature from −25°C to 3°C, the wear and friction levels reduced as the snow melted creating a lubricating layer of water. This again proves the importance of high humidity and the presence of moisture on the railhead in the creation of low adhesion in agreement with lab tests carried out by,9,10 while the effect of snow/ice becomes dominant when it melts which can occur in reality by heat produced between the wheel/rail interface.
These results have shown that relative humidity is an important factor in understanding low adhesion on the railhead as seen from the data presented in this work. The variation in the RH data makes the results unique, which is usually not considered in in-lab or controlled environment testing. Further work should be considered for including variations of RH levels for in-lab friction tests.
The test method used in this work was successful in linking on-field weather elements to friction data, with the use of the British railway research train conversion factor. The RH and temperature were effectively taking at every point of friction measurement because the pendulum tribometer is portable and can be moved easily from point to point. Compared to in-lab test methods, where the railhead temperature is independent of real weather elements. On the contrary, for on-field measurement techniques where the railhead conditions are dependent on the weather element, but the exact measurements of weather elements for a corresponding friction reading cannot be determined because the exact point of measurements on the railhead is not easy to determine.
Relative humidity is an important factor in understanding low adhesion on the railhead as seen from the data presented in this work. The variation in the RH data makes the results unique, which is usually not considered in in-lab or controlled environment testing. Further work should be considered for including variations of RH levels for in-lab friction tests. Air temperature was recorded during the field visits, but was not included in the analysis done, as no independent trend was identified. This was partly because an increase or decrease in the air temperature brought the same effects on the railhead temperature, therefore producing similar trends. 34 On the other hand, where some part of the rail was shaded from the sun the railhead recorded a lower temperature compared to sections exposed to the sun as seen in Figures 5(g) and 6(a).
Conclusions
The data analysed in this work was collected on the rail tracks in the field, which gave a real representation of the railhead condition across a broad timeline. This data is also representative of actual environmental conditions and not a simulated scenario. This provides a better understanding of the variations that occur in the μ because of the open system nature of the wheel/rail interface showing the unpredictable changes in environmental conditions.
From the findings in this paper, the key conclusions are as follows: The general trends noticed in the analysis showed that an increase in RH usually brings about a decrease in the μ even in warmer temperatures as seen in Figure 5. At 75% RH and above low adhesion will be highly likely especially with the presence of moisture on the railhead, even with warmer temperatures. A significant drop in the railhead temperature leading to a rise in RH is seen to be accompanied by a decrease in the adhesion level. This can be attributed to the formation of dew (light moisture) on the railhead. In terms of railhead temperature, the adhesion level is seen to vary relatively to the RH levels. It is expected to have low adhesion present with temperatures below approximately 4°C with high RH because of moisture or melting ice on the railhead. The effects of tree coverage on the adhesion level were evident in the data obtained at Darley Dale and Butterley. The shading effects caused by the leaves present on the tree led to dampness around the affected rail section and lower temperatures from the lack of exposure to the sun resulting in lower adhesion levels.
Footnotes
Acknowledgements
The authors appreciate the contribution of Railway Safety and Standard Board (RSSB) towards this research through the COF-UOS-02 project.
Declaration of conflicting interests
The author(s) declared no potential conflicts of interest with respect to the research, authorship, and/or publication of this article.
Funding
The author(s) disclosed receipt of the following financial support for the research, authorship, and/or publication of this article: The work was also supported by the EPSRC Programme Grant “Friction: The Tribology Enigma” (EP/R001766/1).
Appendix