
Abstract
The railway industry uses top-of-rail products to control and manage the friction in the wheel/rail interface to help ensure efficient train operations and reduce wheel and rail damage. A product is typically applied from a wayside applicator that pumps a puddle onto the rail head where a passing wheel will pick it up and then transfer it down the track. The aim of this study was to study the transfer mechanisms of water-based top-of-rail friction modifiers (TOR-FMs) and how they are linked to the friction conditions in the wheel/rail interface. The transfer mechanisms were split into three parts: pick-up, carry-on and consumption. Pick-up looks at how the product transfers from the puddle on the rail to a wheel tread, whereas the carry-on mechanism relates to the product transfer back to the wheel. Consumption focuses on the removal rate of the product layer from the wheel or rail. A full-scale rig and twin disc machine were chosen to perform the tests because each rig could give different insights into understanding the product transfer mechanisms. Two products were tested of similar formulation. Results show that there are differences in the transfer and friction between the two products despite them being relatively similar. The test methods developed can clearly resolve differences between varying product types, which could be useful for product development studies or approvals work. The outcomes could also be used to develop a model of transfer/consumption.
Keywords
Introduction
Friction management is commonly on railways as different operational situations require different friction ranges. To achieve the friction required, a range of products have been designed
1
: • • •
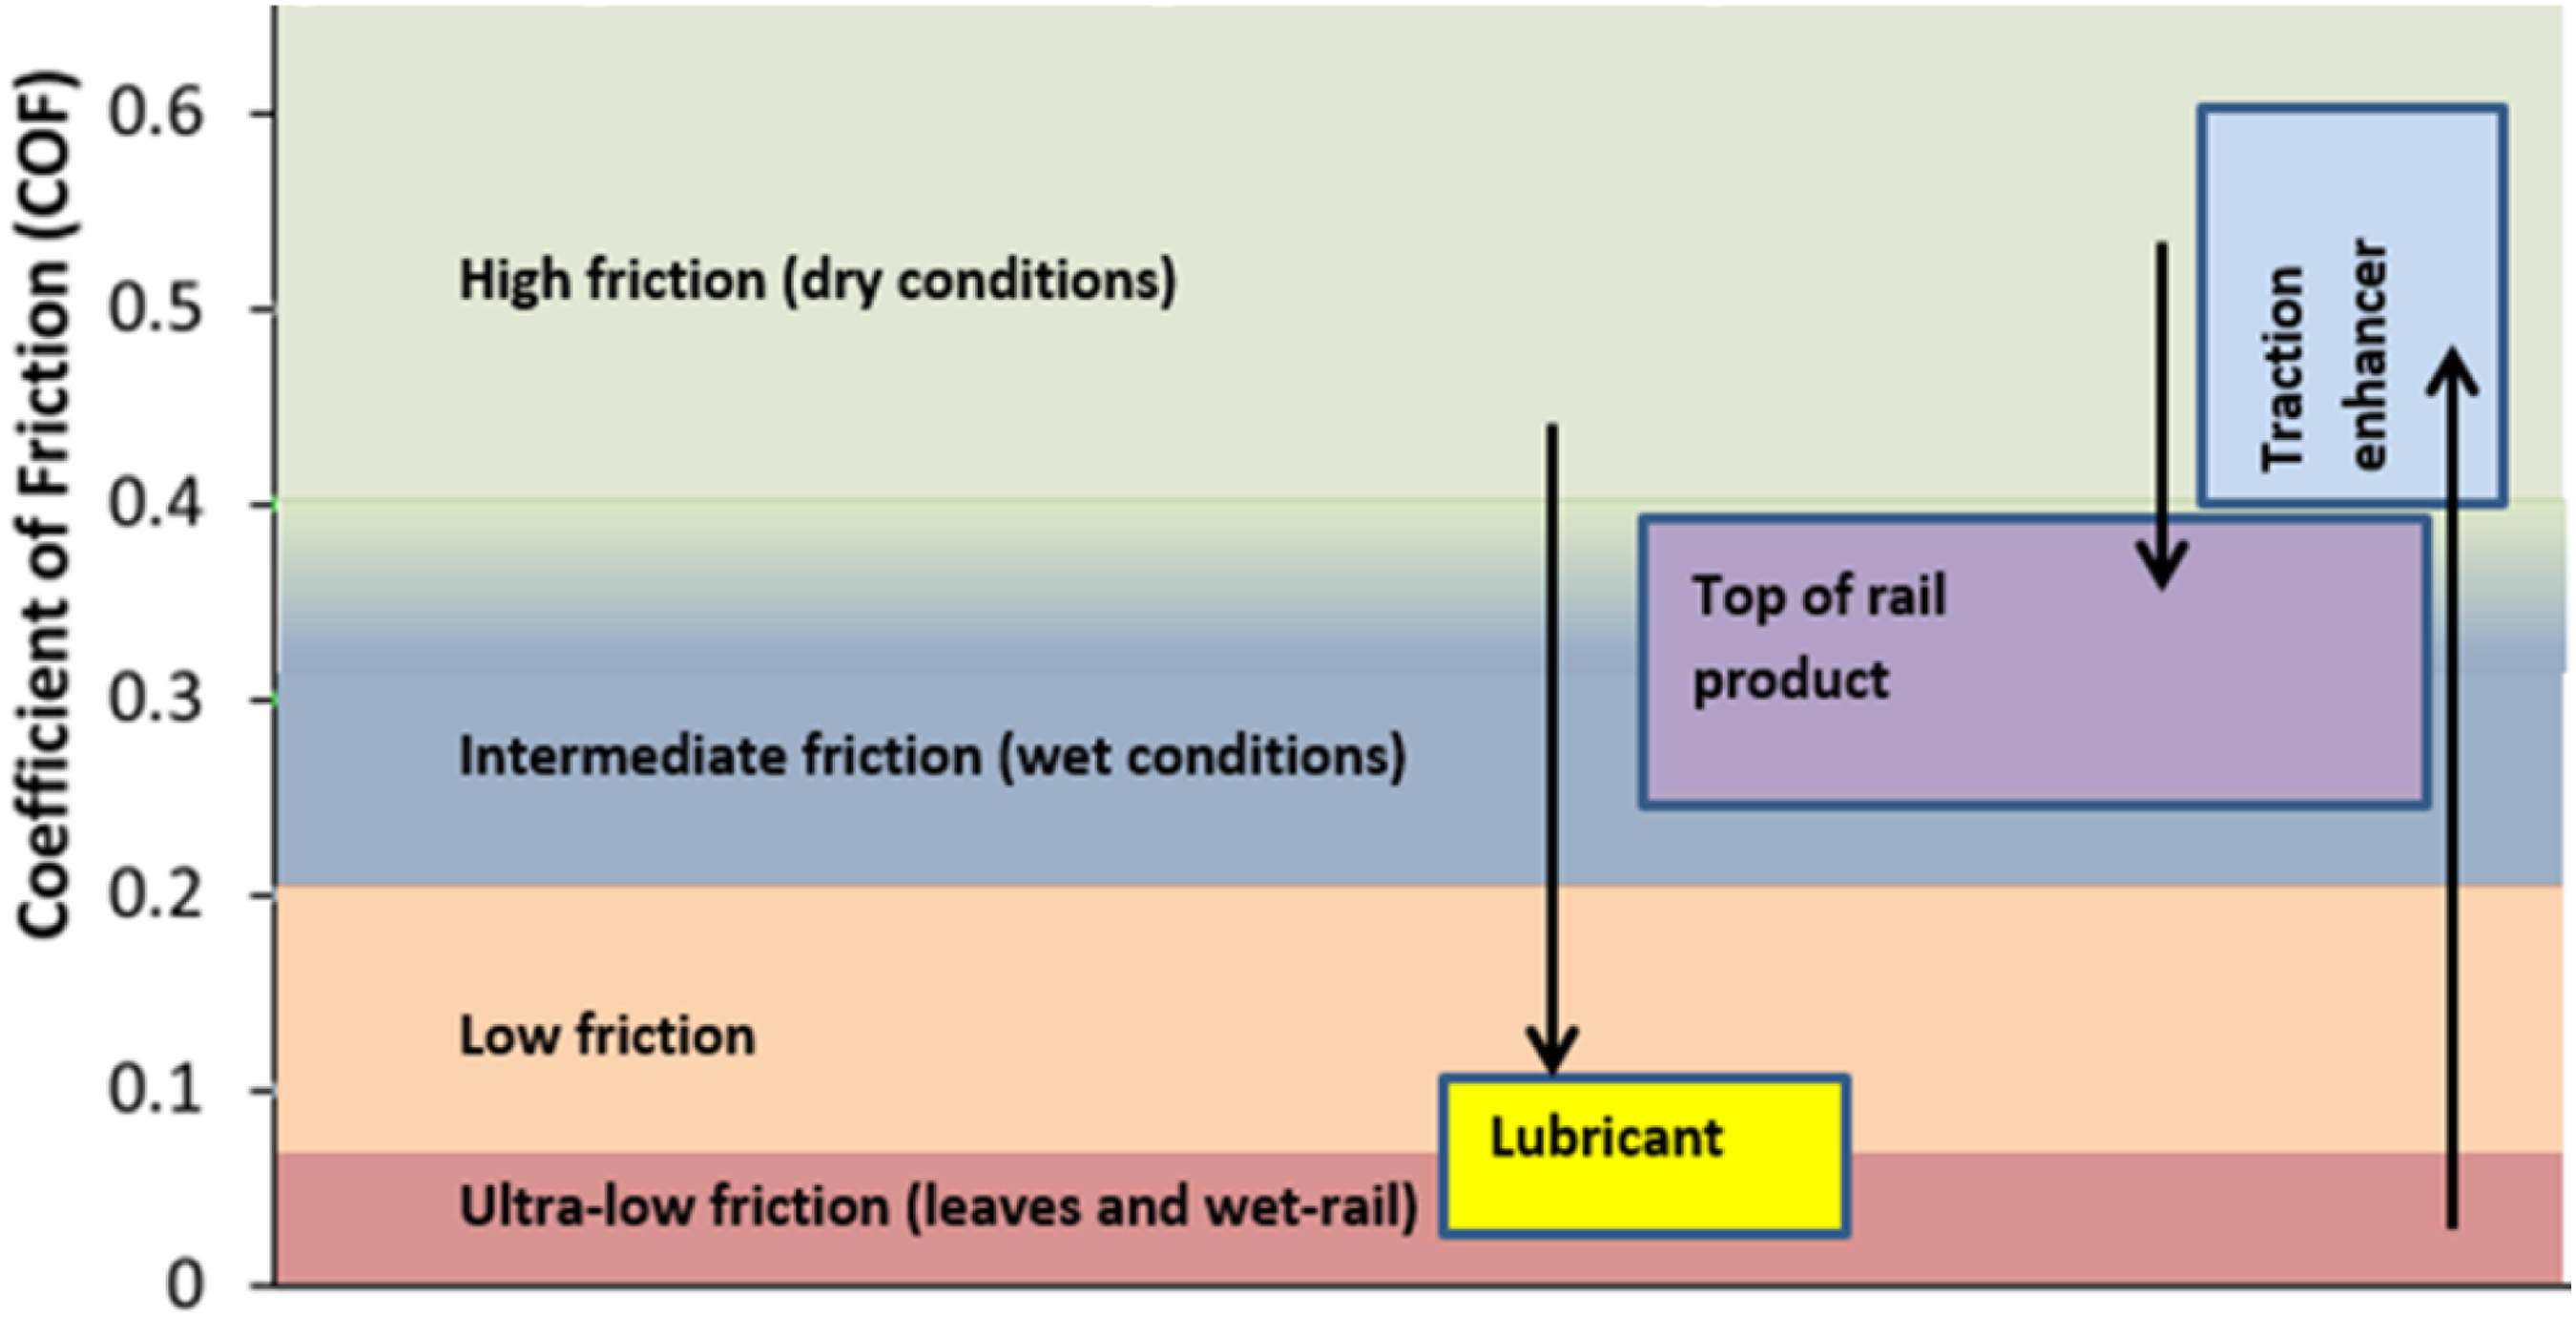
Figure 1 shows defined friction regimes for the wheel/rail interface as well as how friction management products are expected to change friction levels.
2
Managing and controlling TOR friction helps in tackling issues such as noise,3,4 damage development
5
and energy consumption.6,7 A range of TOR products have been designed to achieve this, which are often characterised by their “drying behaviour”
8
: • • • Wheel/rail interface regimes and impact of friction management products.
2
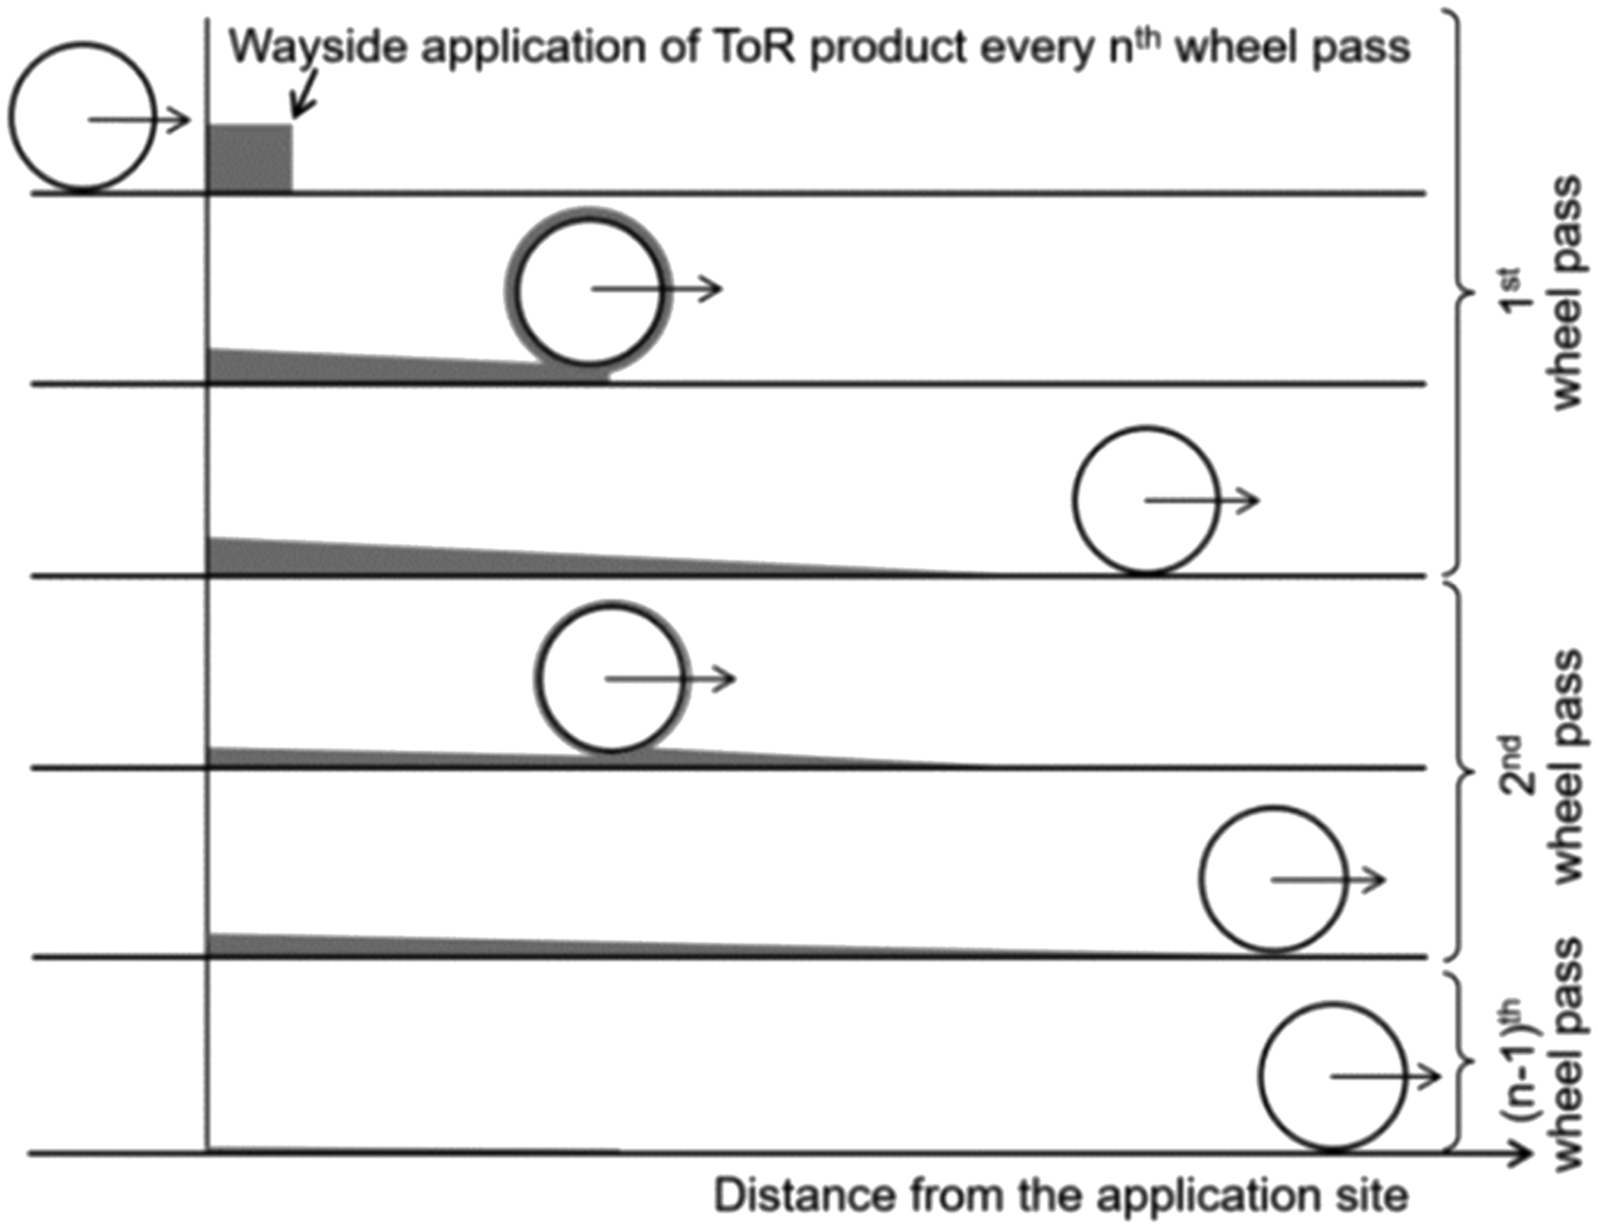
TOR products are generally applied using a wayside applicator that pumps them from a reservoir directly onto the rail head as a puddle. Train wheels pass through the puddle picking-up the product and then transferring it back to the rail with each subsequent contact, spreading it further down the track, as shown in Figure 2.
9
Numerous studies have investigated the influence of TOR products on wheel/rail interface friction using a range of test rigs of different scales, such as a pin-on-disc machine;
10
a twin disc rig,11,12 full-scale rigs (FSR)6,13 and scaled-wheel rigs
14
and more recently a high pressure torsion rig
15
However, few studies have investigated product transfer mechanisms that dictate product are pick-up, carry-on along the track and consumption. Some work has been carried out investigating this for grease used for curve lubrication.14,16 While these studies give possible test approaches, the application process and properties for TOR products are very different to greases, so the findings cannot be transferred. One laboratory-based study has been carried out on TOR product pick-up,
17
but in this work, friction was not measured and mechanisms of pick-up/carry-down were not explored in detail. Recently field studies carried out have shown that TOR products do not appear to be carried down more than a few hundred metres on the rail18,19 From this work, however, indications were that the product on the wheel could be effective for >3 km. This ties-up with lateral force measurements that have shown that TOR products have an effect 3 km from application.
20
Effects of TOR pick-up, carry-on and consumption on TOR coverage as a function of position on track and number of wheel passes.
9
In this study, the transfer behaviour of TOR products during a wheel/rail interaction has been simplified into three mechanisms: pick-up, carry-on and consumption. Pick-up looks at product transfer from the puddle on the rail to a wheel tread; the carry-on mechanism relates to product transfer back from wheel to rail, as shown in Figure 3 and finally, consumption mechanism refers to the continuing depletion of the TOR layer until the wheel/rail contact surfaces are clean. Product squeezed from the contact was also considered as part of the consumption mechanism because this “excess” product does not contribute to the friction management process. Illustration of (a) pick-up tests using the FSR at nth wheel/rail interaction cycle (n ≥ 1); (b) carry-on tests using the FSR at nth wheel/rail interaction cycle (n ≥ 2).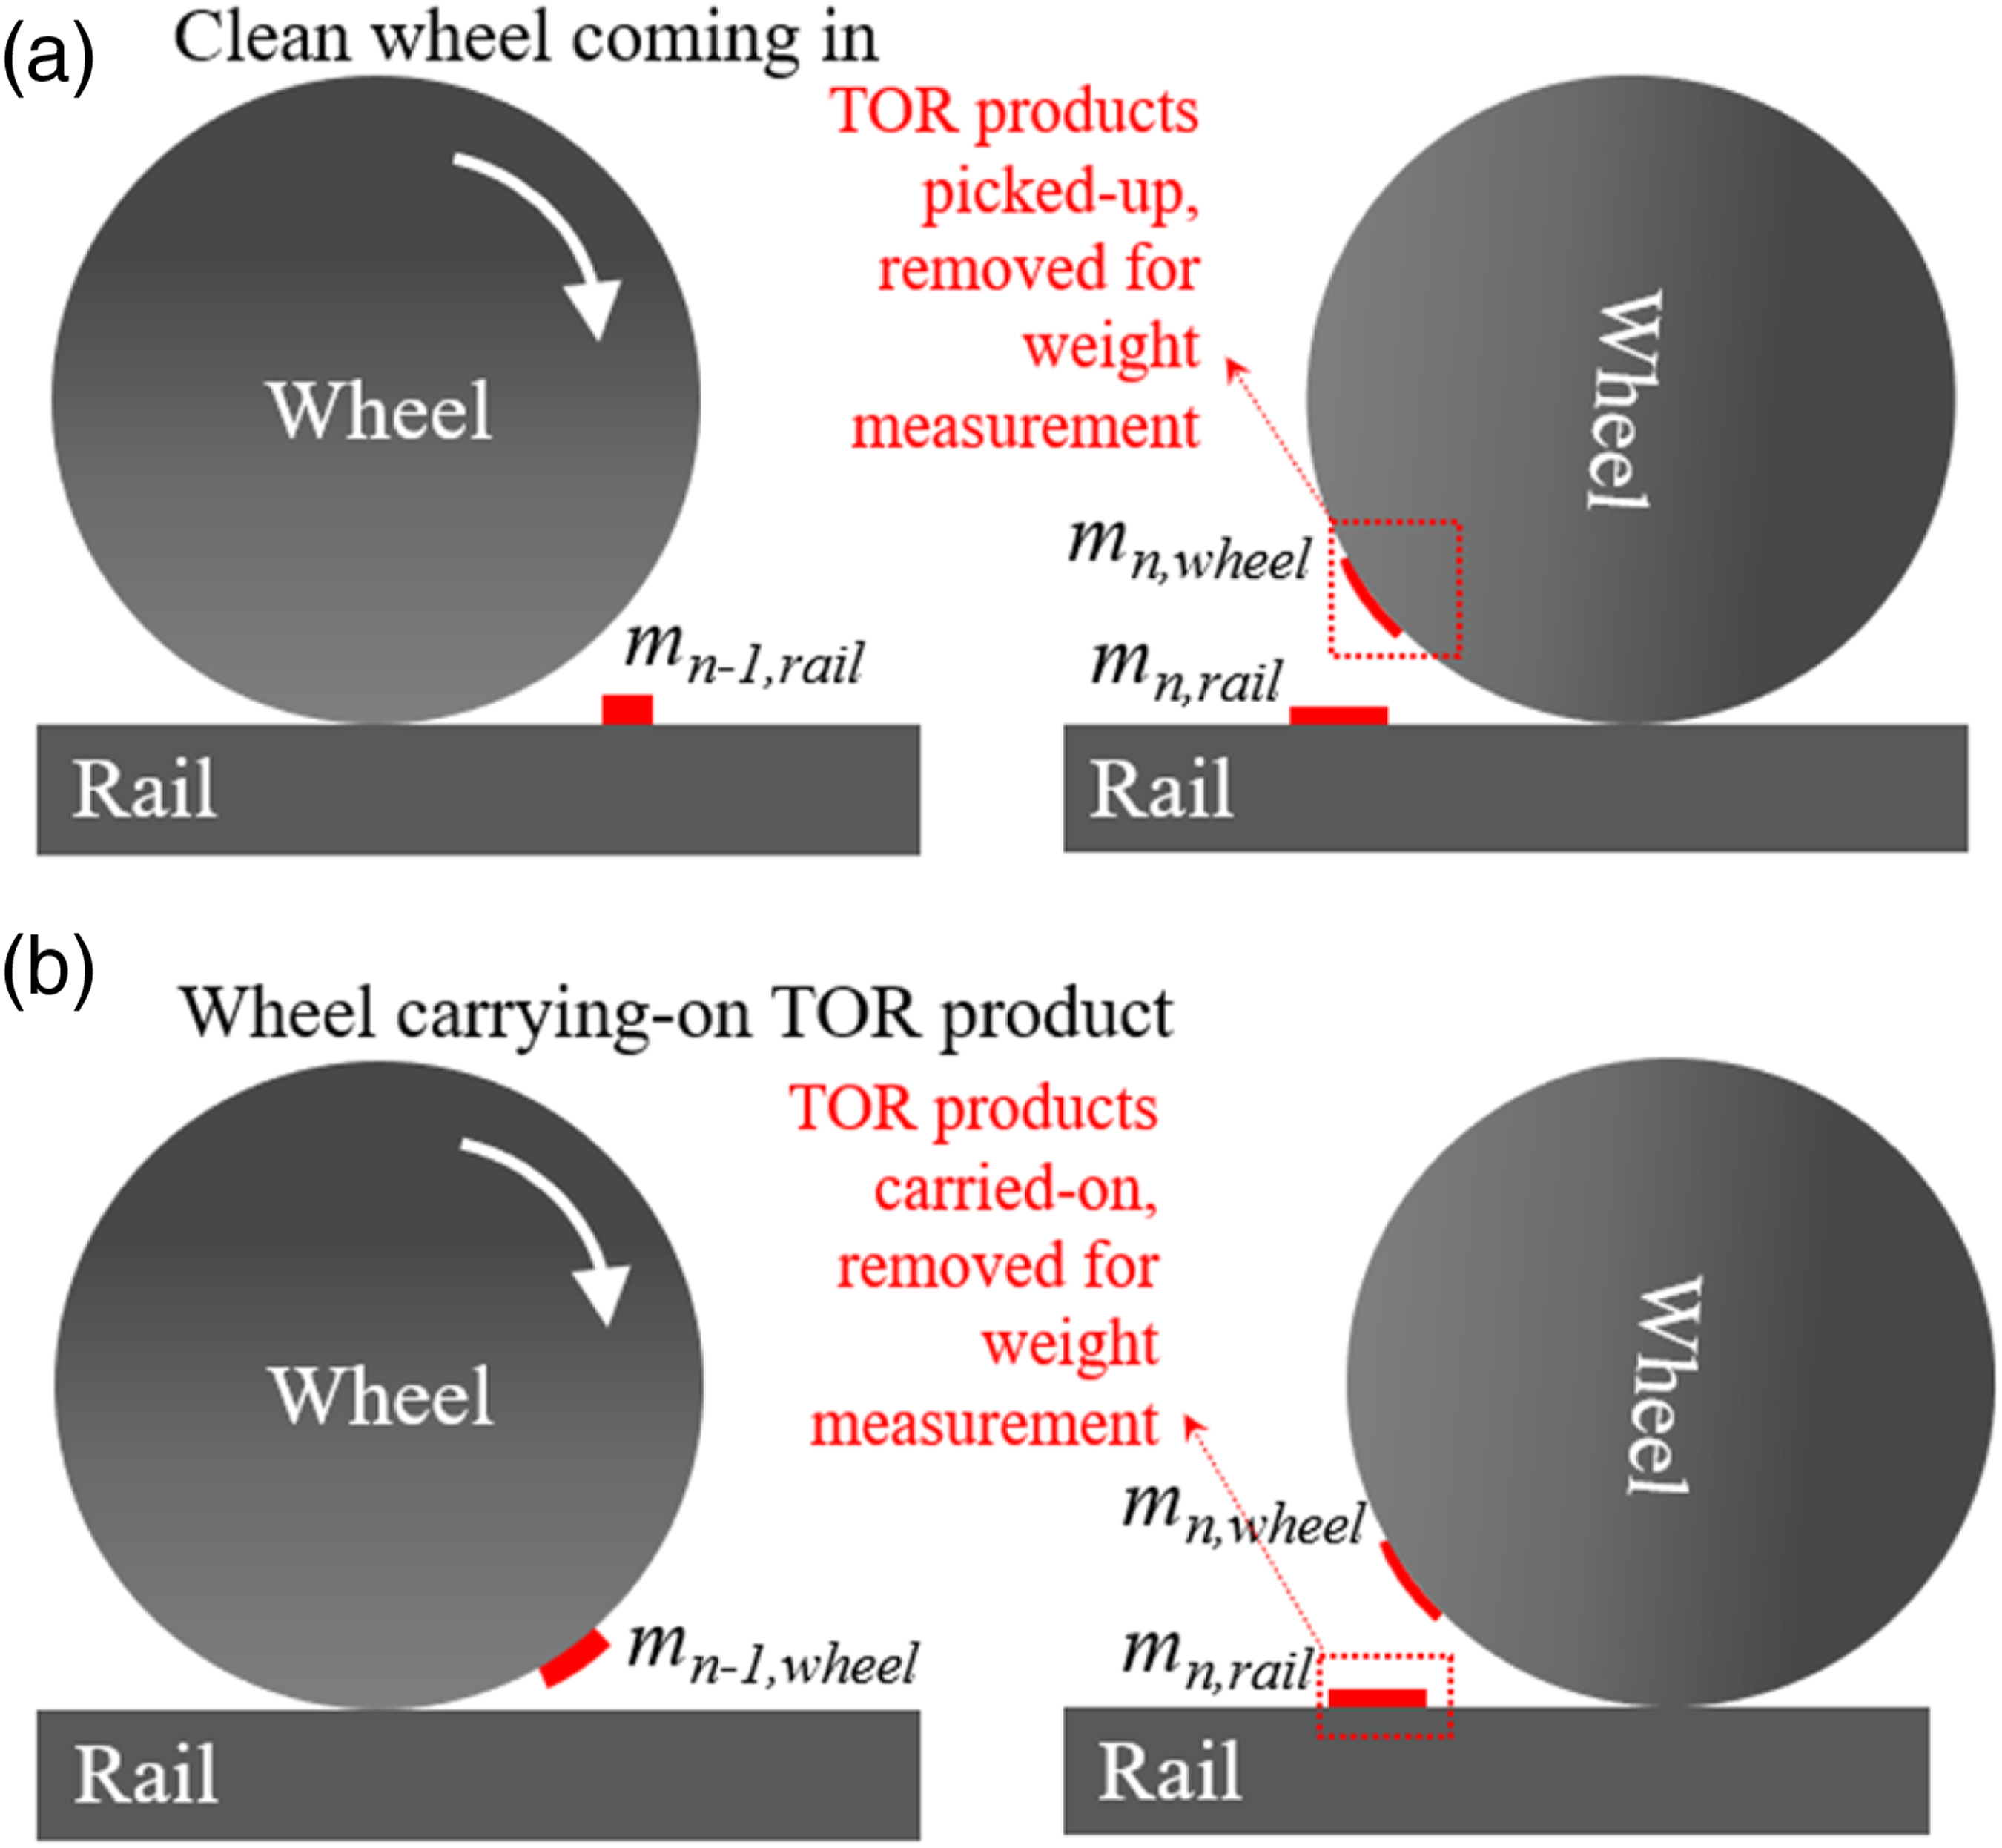
The aim of this work was to characterise TOR-FM transfer and carry-on behaviour. This was achieved by measuring the amount of product transferred from the rail to the wheel and vice versa in a FSR. Twin disc testing was also used to determine consumption rates. The study also defined the relationship between product distribution and friction.
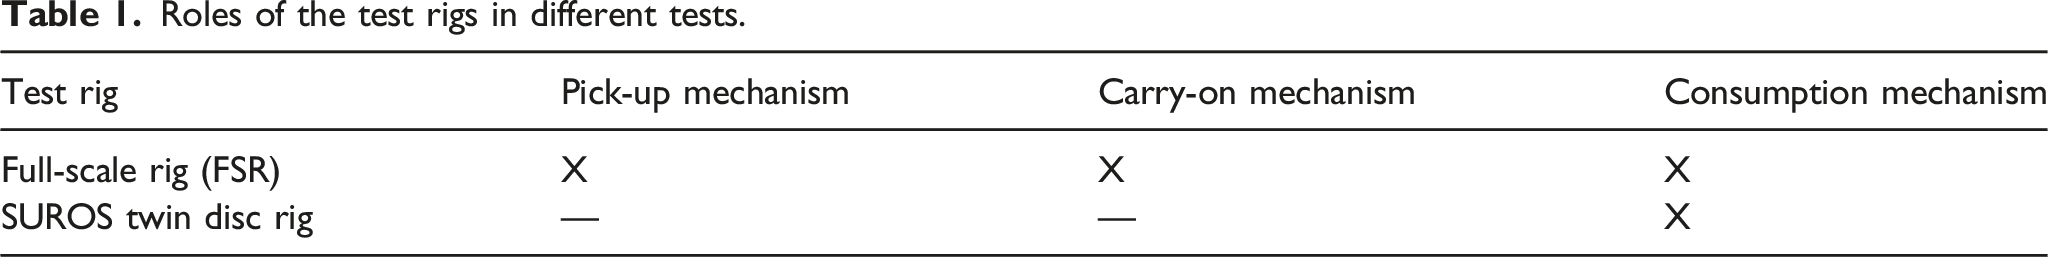
Test rigs and methodologies
Roles of the test rigs in different tests.
Two TOR-FM products were chosen for the tests, labelled as TOR-FM “A” and TOR-FM “B.” Although both products are water-based friction modifiers, both products have visibly different viscosity and tackiness. TOR-FM “A” was quite tacky whereas TOR-FM “B” was more watery.
Full-scale rig
The FSR is built to test a full-sized train wheel and rail. 21 It has the capability to simulate a range of wheel/rail interactions realistically by controlling the normal load applied, the wheel speed and the slip level.
An actual wheel is fixed in position and loaded normally against the rail by a hydraulic actuator. This vertical axis is load controlled with force being monitored via a 180 kN load cell. The rail is pulled under the wheel using a second actuator. This longitudinal axis is controlled via a magnetostrictive position sensor and load cell. For general operation this longitudinal axis is operated in position control only. A third actuator then pulls a chain attached to the wheel and turns it at the rate needed to achieve partial slip in the contact. This actuator is mounted on the slider bed on which the rail is mounted. Thus, displacement of the slip axis is relative to the displacement of the rail axis. This longitudinal axis is controlled via a load cell and LVDT. Before a test cycle commences, the slip axis is pre-tensioned to re-move any slack and fully extend the chain. The amount of pre-load can be adjusted for friction conditions and is dependent on the level of vertical load applied to the wheel. A more detailed description of the rig can be found in. 21
Water-based top-of-rail friction modifiers are typically applied at a rate of 0.2–0.6 litres (260–780 g) per 1,000 axles. An example of application from a wayside applicator is shown in Figure 4(a). The pick-up test started with the application of a pre-set amount of TOR product on the rail. For these tests, 0.1 mL (≈130 mg) of product was applied as a baseline and then higher amounts were used (increment of 130 mg up to 780 mg). A typical applied puddle is shown in Figure 4(b). It was applied using a micro-pipette. This is the amount active in the contact when a wheel pass scaled from the amounts mentioned above.
15
A whole puddle is not needed as the lateral position of the wheel does not change in this test. The “puddle” was 225 mm from the starting point of the wheel and the wheel rolled 125 mm beyond the puddle (see Figure 3(a)). After the first wheel/rail interaction, the product transferred to the wheel was removed and weighed to determine product picked-up by the wheel and to leave a clean surface for the next wheel pass. This was achieved using a clean cloth and high-resolution weighing scales with an uncertainty of 0.1 mg (AAA 300L, Adam Equipment Co. Ltd.) with an enclosed chamber to ensure minimal environmental influence. The weight measurement was only taken when the value stabilised after putting the samples on the scale. The clean cloth was carefully weighed before the removal process took place and then afterwards to determine the product amount. This was performed on the first three cycles. Further cycles were performed without measuring the amount of product transferred/remaining because the amount was too small to be measured. (a) Wayside friction modifier application onto track; (b) puddle of product applied in the tests (just in the running band).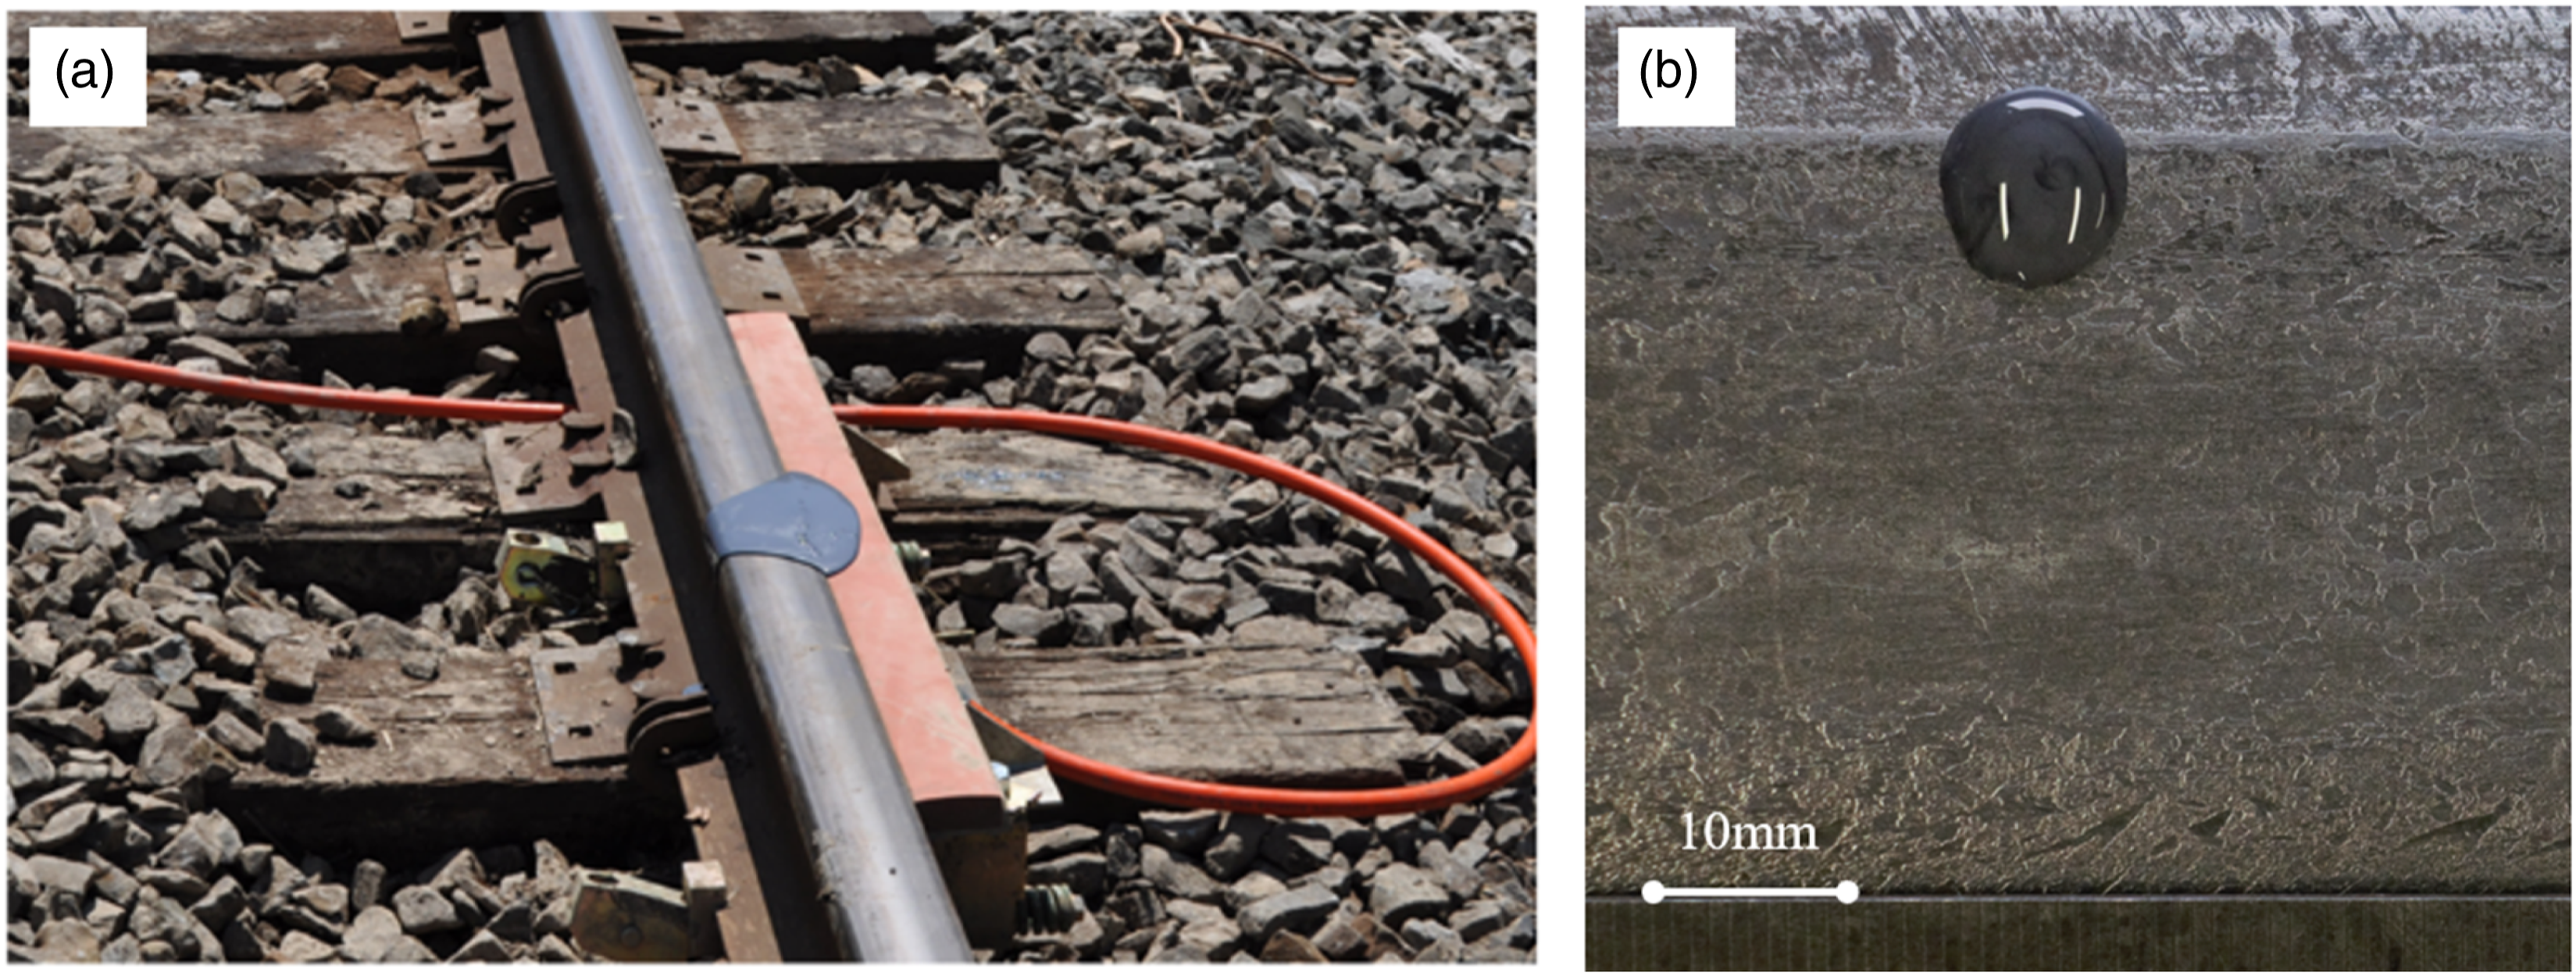
Using equation (1), the mass percentage of TOR product remaining on the rail surface, M
remaining on rail,n
, can be determined for each cycle. In Figure 3(a), m
n,wheel
is the mass of product transferred to the wheel during the cycle, whereas 
Carry on tests were performed separately because the location of product removal for weight measurement was different, as shown in Figure 3(b). The carry-on mechanism only started from the second cycle because the wheel has to pick-up the product in the first cycle to realistically represent how the wayside TOR product is applied. Then cycles 2–3 involve product being deposited onto a clean rail surface. The position of the puddle and the wheel traverse were the same as used in the pick-up test. Therefore, the TOR product was applied on the rail to allow the wheel to pick-up in the first cycle. Then the product left on the rail was removed and weighed using the same approach used for the pick-up tests. This was repeated until the third wheel/rail cycle. The product distribution in the carry-on tests was analysed in a similar way to the pick-up tests, as shown in equation (2) and the respective illustration in Figure 3(b). It should be noted that as the wheel must first pick-up the product from the rail before carrying it on to the rail, M remaining on wheel of the carry-on mechanism starts from the second wheel/rail cycle (n ≥ 2).
In Equation (2), m
n-1,wheel
is the mass of product on the wheel before the transfer cycle, whereas m
n,wheel
is the mass of product remaining on the wheel after the transfer cycle (where m
n,rail
is transferred back to the rail) and n is the number of wheel/rail interaction cycles (n ≥ 2). If M
remaining on wheel,n
is 0%, this means that all the product is transferred to the rail. On the other hand, if there is no product transferred from the wheel to the rail, M
remaining on wheel,n
is 100%.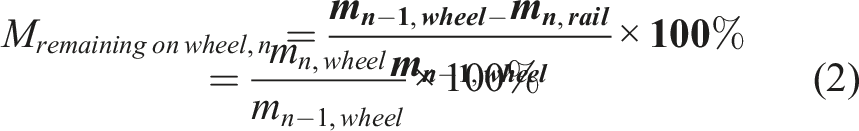
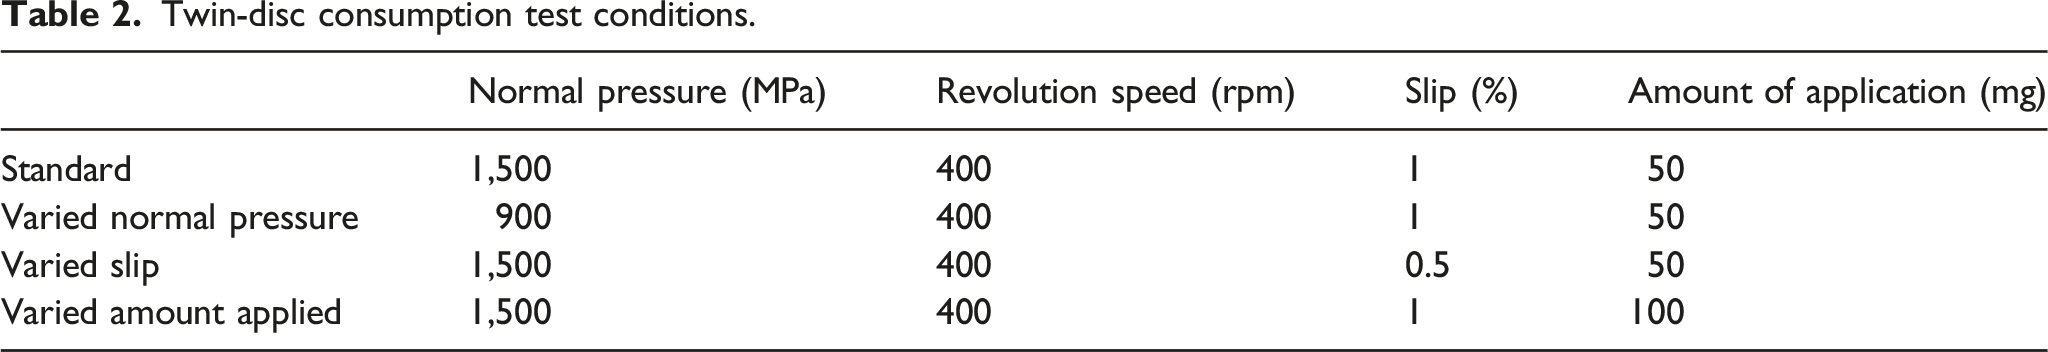
The consumption test using the FSR was performed by rolling the wheel repetitively on the rail without removing the product from the wheel or the rail (as done by Buckley-Johnstone et al. 13 ). The test was run until the product was fully consumed when the traction (measured from slip axis) reached a stabilised value. Coefficient of traction (CoT) can be computed by dividing the traction measured to the vertical load measured from vertical axis. Three consumption tests were performed on each TOR-FM product with varying amount applied (130 mg, 390 mg and 780 mg) on the mid-section of the rail.
The pick-up, carry-on and consumption tests using FSR were performed at 80 kN normal load, 100 mms−1 wheel circumferential speed and 5% slip.
SUROS twin disc rig
The SUROS twin disc rig is a machine built specifically to perform rolling contact tests on a pair of disc shaped specimens made from a rail and a wheel steel respectively. It is a re-purposed Colchester Mascot 1600 lathe and has a driving system installed that can be hydraulic loaded to simulate the train weight and a torque sensor to measure the traction on contact. 22 Twin disc used a more complex formula to compute CoT, which is explained in. 22 This rig has generally used to study rolling contact fatigue and wear in wheel and rail materials, but has also been used extensively for studying friction of leaves23,24 and the effectiveness of TOR products. 13 Pick-up and carry-on studies were not possible due to the recycling nature of the disc contact. Therefore, this rig was used only to study the consumption mechanism and how it related to friction in the contact.
Twin-disc consumption test conditions.
Results
Pick-up and carry-on tests
The transfer outcomes for the two different products are shown in Figure 5. Percentage of product left on the respective surface is plotted against the amount of product on the wheel (for carry-on test) or rail (for pick-up test) surface before the cycle. Amount remaining on the wheel (carry-on) or rail surface (pick-up) [%] in relation to the amount on surface prior to the wheel/rail interaction.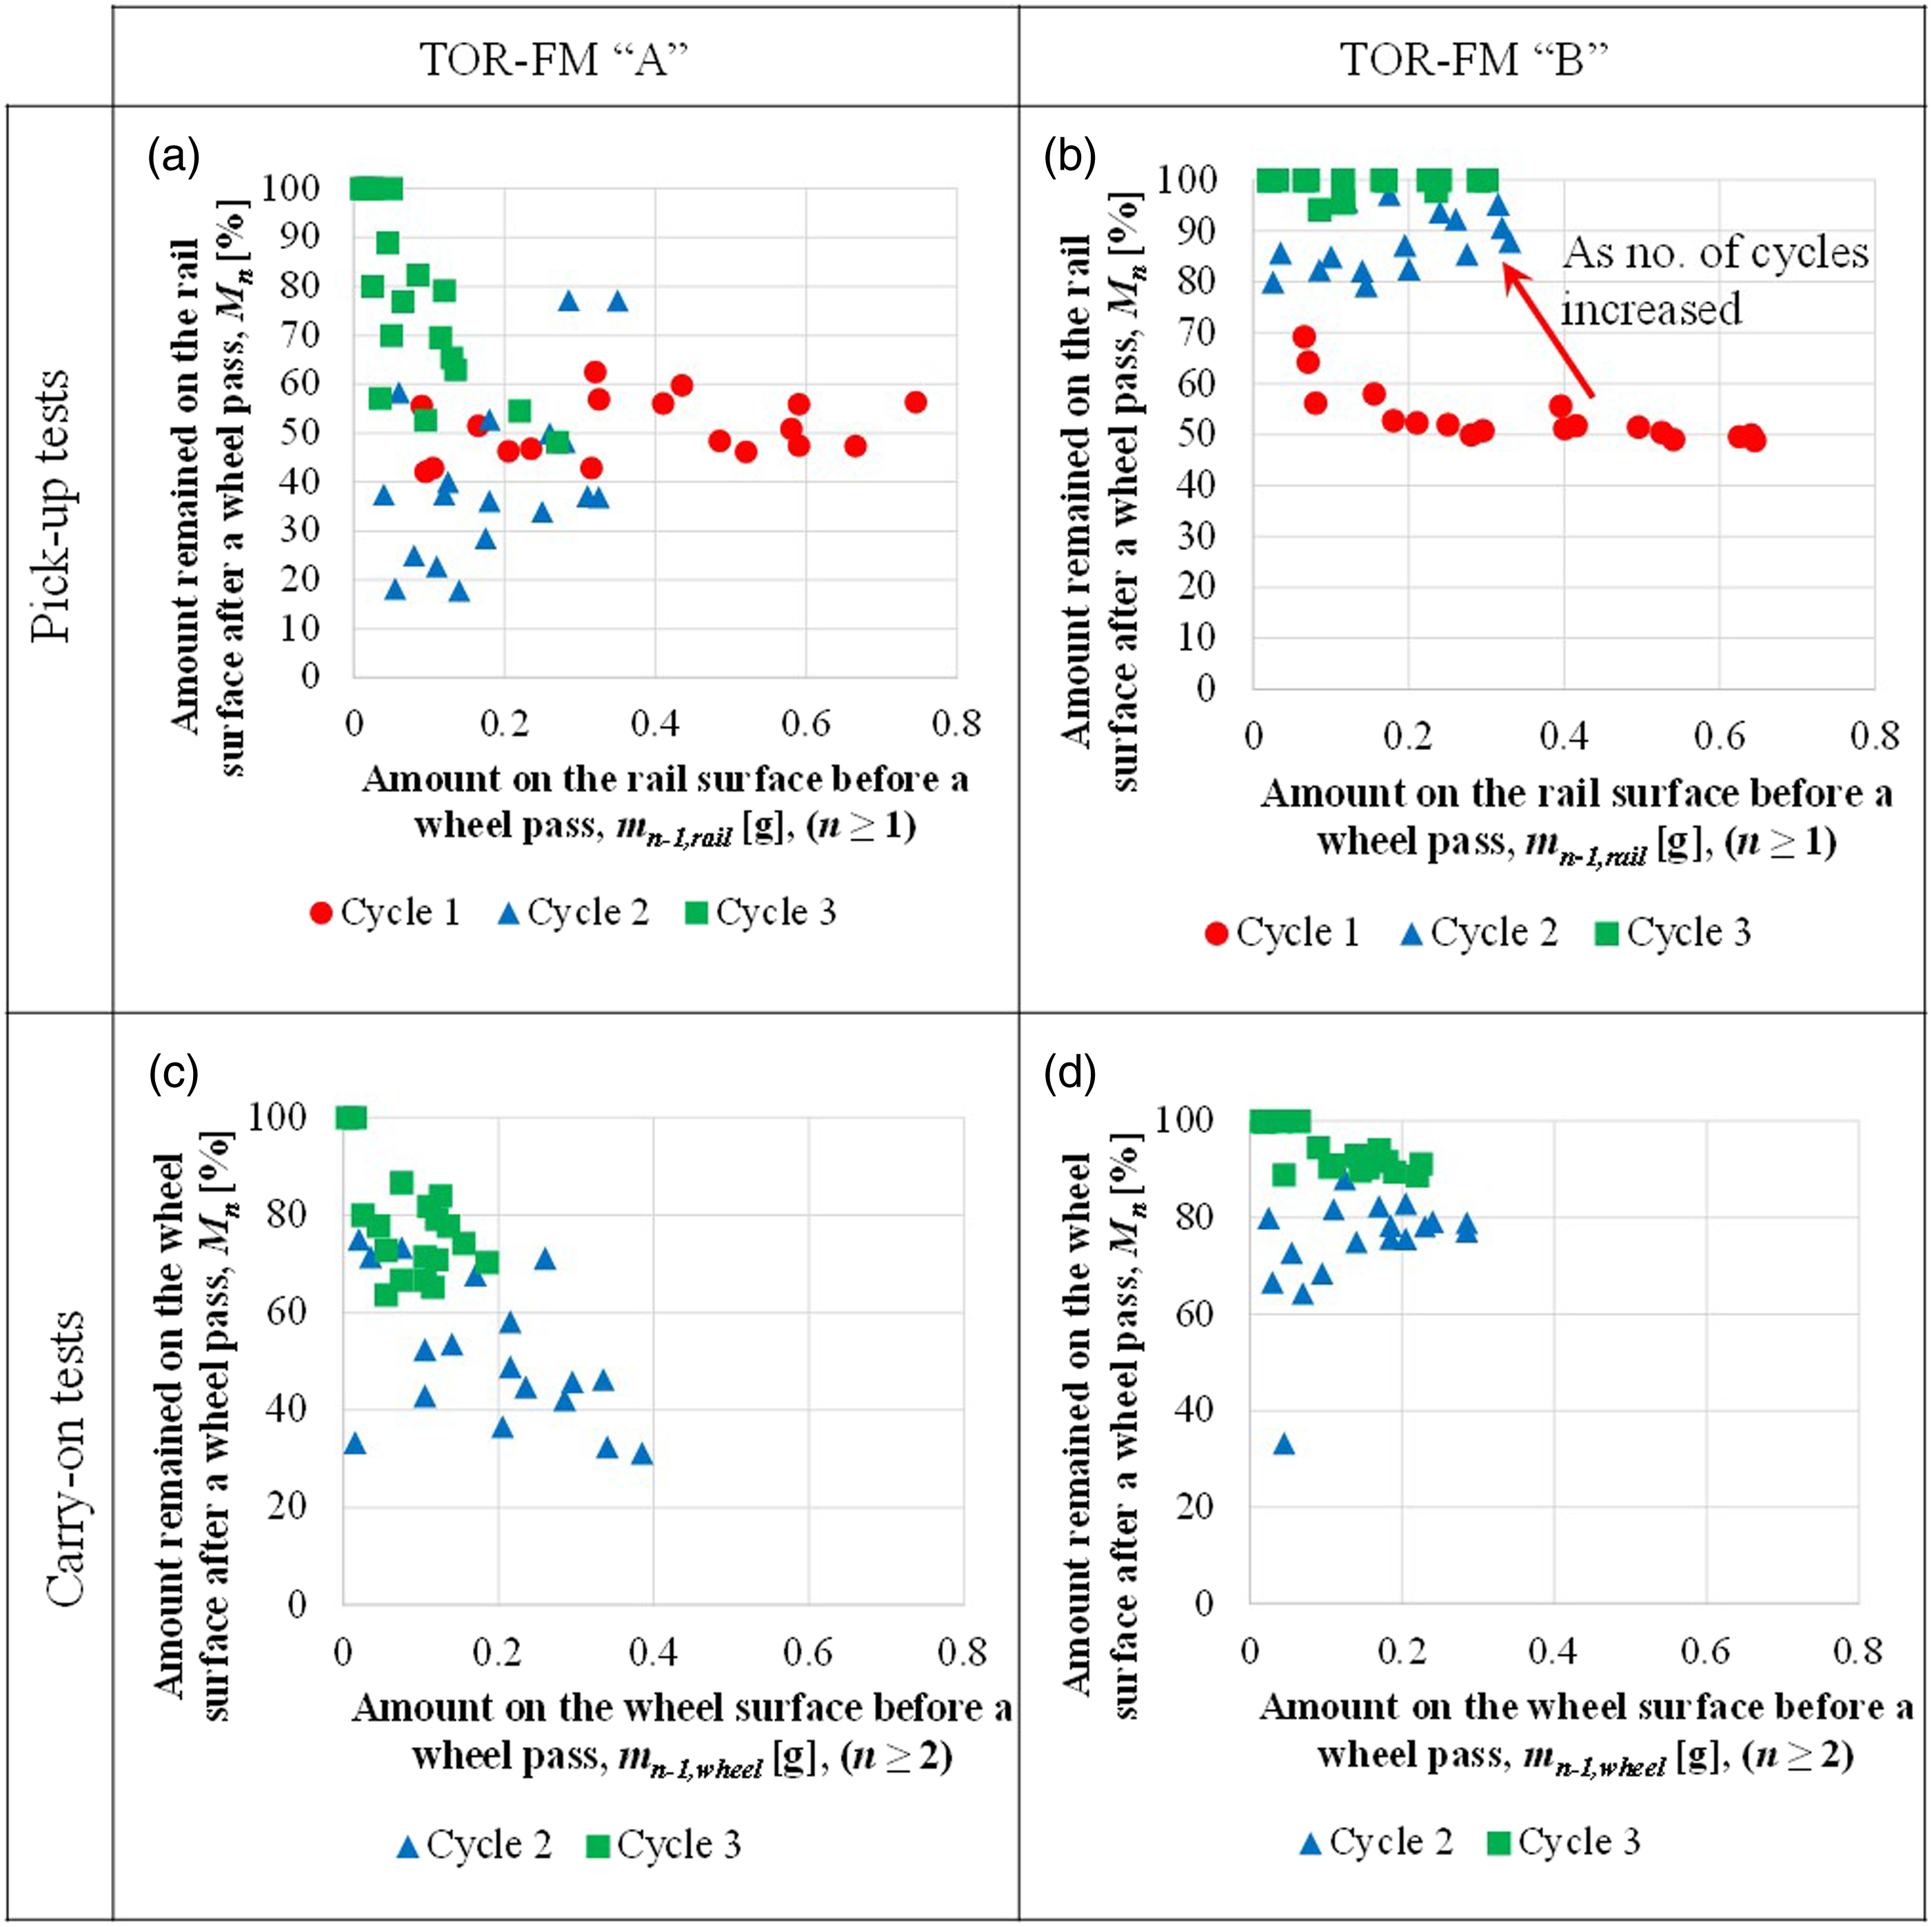
In the pick-up tests, TOR-FM “A” initially had approximately 50% product transfer percentage when the first wheel went through the puddle of product, as shown in Figure 5(a). The figure also shows that 50% of the product would be picked-up by the wheel regardless of the amount applied on the amount applied. When the second “cleaned” wheel passed through the puddle, the percentage amount remaining on the rail ranged from approximately 15%–78%. This means that the amount picked-up by the second wheel ranged from 22% to 85% of the product left from the first wheel-rail interaction. The large range of amount picked up occurred because the product was very viscous in nature. When the first wheel left the puddle of product in the first wheel-rail interaction cycle, some product fell back onto the running band. However, this amount was not consistent, resulting in a large range of percentage amount remaining on the rail in the second wheel-rail interaction cycle. This phenomenon is discussed in section 4.1. As the third cleaned wheel passed through the puddle of product, the overall percentage amount remaining on the rail increased, ranged from 60% to 100%. This means that there were some cases where the products were squeezed out of the running band and the wheel could not pick-up a measurable amount of product from the rail, assuming the wheels were running on the same running band. However, if the product still fell on the running band, it would then be continually picked-up by the subsequent wheels.
The general pick-up behaviour of TOR-FM “B” is much more predictable, as shown in Figure 5(b). In the first wheel-rail interaction cycle, approximately 50% of product was picked-up by the wheel. However, there was a clear trend that the percentage amount picked-up by the wheel decreased as the amount applied decreased when the amount applied was less than 0.2 g. When the second and third “cleaned” wheel passed through the puddle of product, the percentage amount remaining on the rail increased with the subsequent wheel passes because there was little product at the contact to be picked-up by the wheel. This was caused by both the product consumption and the product being squeezed out of the running band. As such, the subsequent wheels would pick-up less and less products from the rail.
The carry-on tests in Figure 5(c) and (d) only showed the percentage amount remaining on the wheel at the second and third wheel-rail interaction cycle because the wheel needed to pick-up the product in the first wheel-rail interaction cycle before “carrying-on” the product onto the further rail ahead.
After the wheel picked-up the TOR-FM “A” in the first wheel-rail interaction cycle, approximately 30%–75% of the product remained on the wheel as it passed through a “cleaned” rail in the second wheel-rail interaction cycle (Figure 5(c)). This means that 25%–70% of the product was carried-on to the rail further ahead as the wheel roll along. The figure also shows that the percentage amount remaining on the wheel increased with the subsequent wheel-rail interactions. This is reasonable because the amount remained on the wheel surface was so little and spread out that it would result in the tendency to remain on the wheel surface.
The carry-on behaviour of the TOR-FM “B” was also quite predictable, as shown in Figure 5(d). As the wheel transporting the product to the rail further ahead, most product tended to remain on the wheel. The percentage remaining on the wheel increased as the wheel-rail interaction cycles increased. There was an outlier at the second wheel-rail interaction that resulted in approximately 33% amount remaining on the wheel surface. This was probably caused by a small amount of product flowing back to the running band as the rail was being cleaned.
Figure 6(a) shows the general friction development of the wheel/rail interaction as the wheel rolled along the rail. When the wheel started rolling, the CoT increased and stabilised as both the wheel and rail reached the set speed. As the wheel became in contact with the pool of product located at approximately 230 mm along the rail (labelled using a green arrow in Figure 6(a)), the CoT instantly dropped and slowly increased as the product thinned out further along the rail. The CoT in the highlighted region was averaged and plotted against the respective cycle number. The respective results of the pick-up and carry-on tests are shown in Figure 6(b) and (c). It should be noted that the overall dry traction in Figure 6(a) was lower than the peak traction when the rail position was at 100 mm. This was caused by the ineffective cleaning of rail or wheel in narrow spaces when the wheel was resting on the rail. Wheel/rail friction development: (a) generally with rail position; (b) the pick-up test; (c) the carry-on tests and (d) the consumption tests of TOR-FM “A” and TOR-FM “B” on the FSR, with a measuring uncertainty of 0.01 for CoT.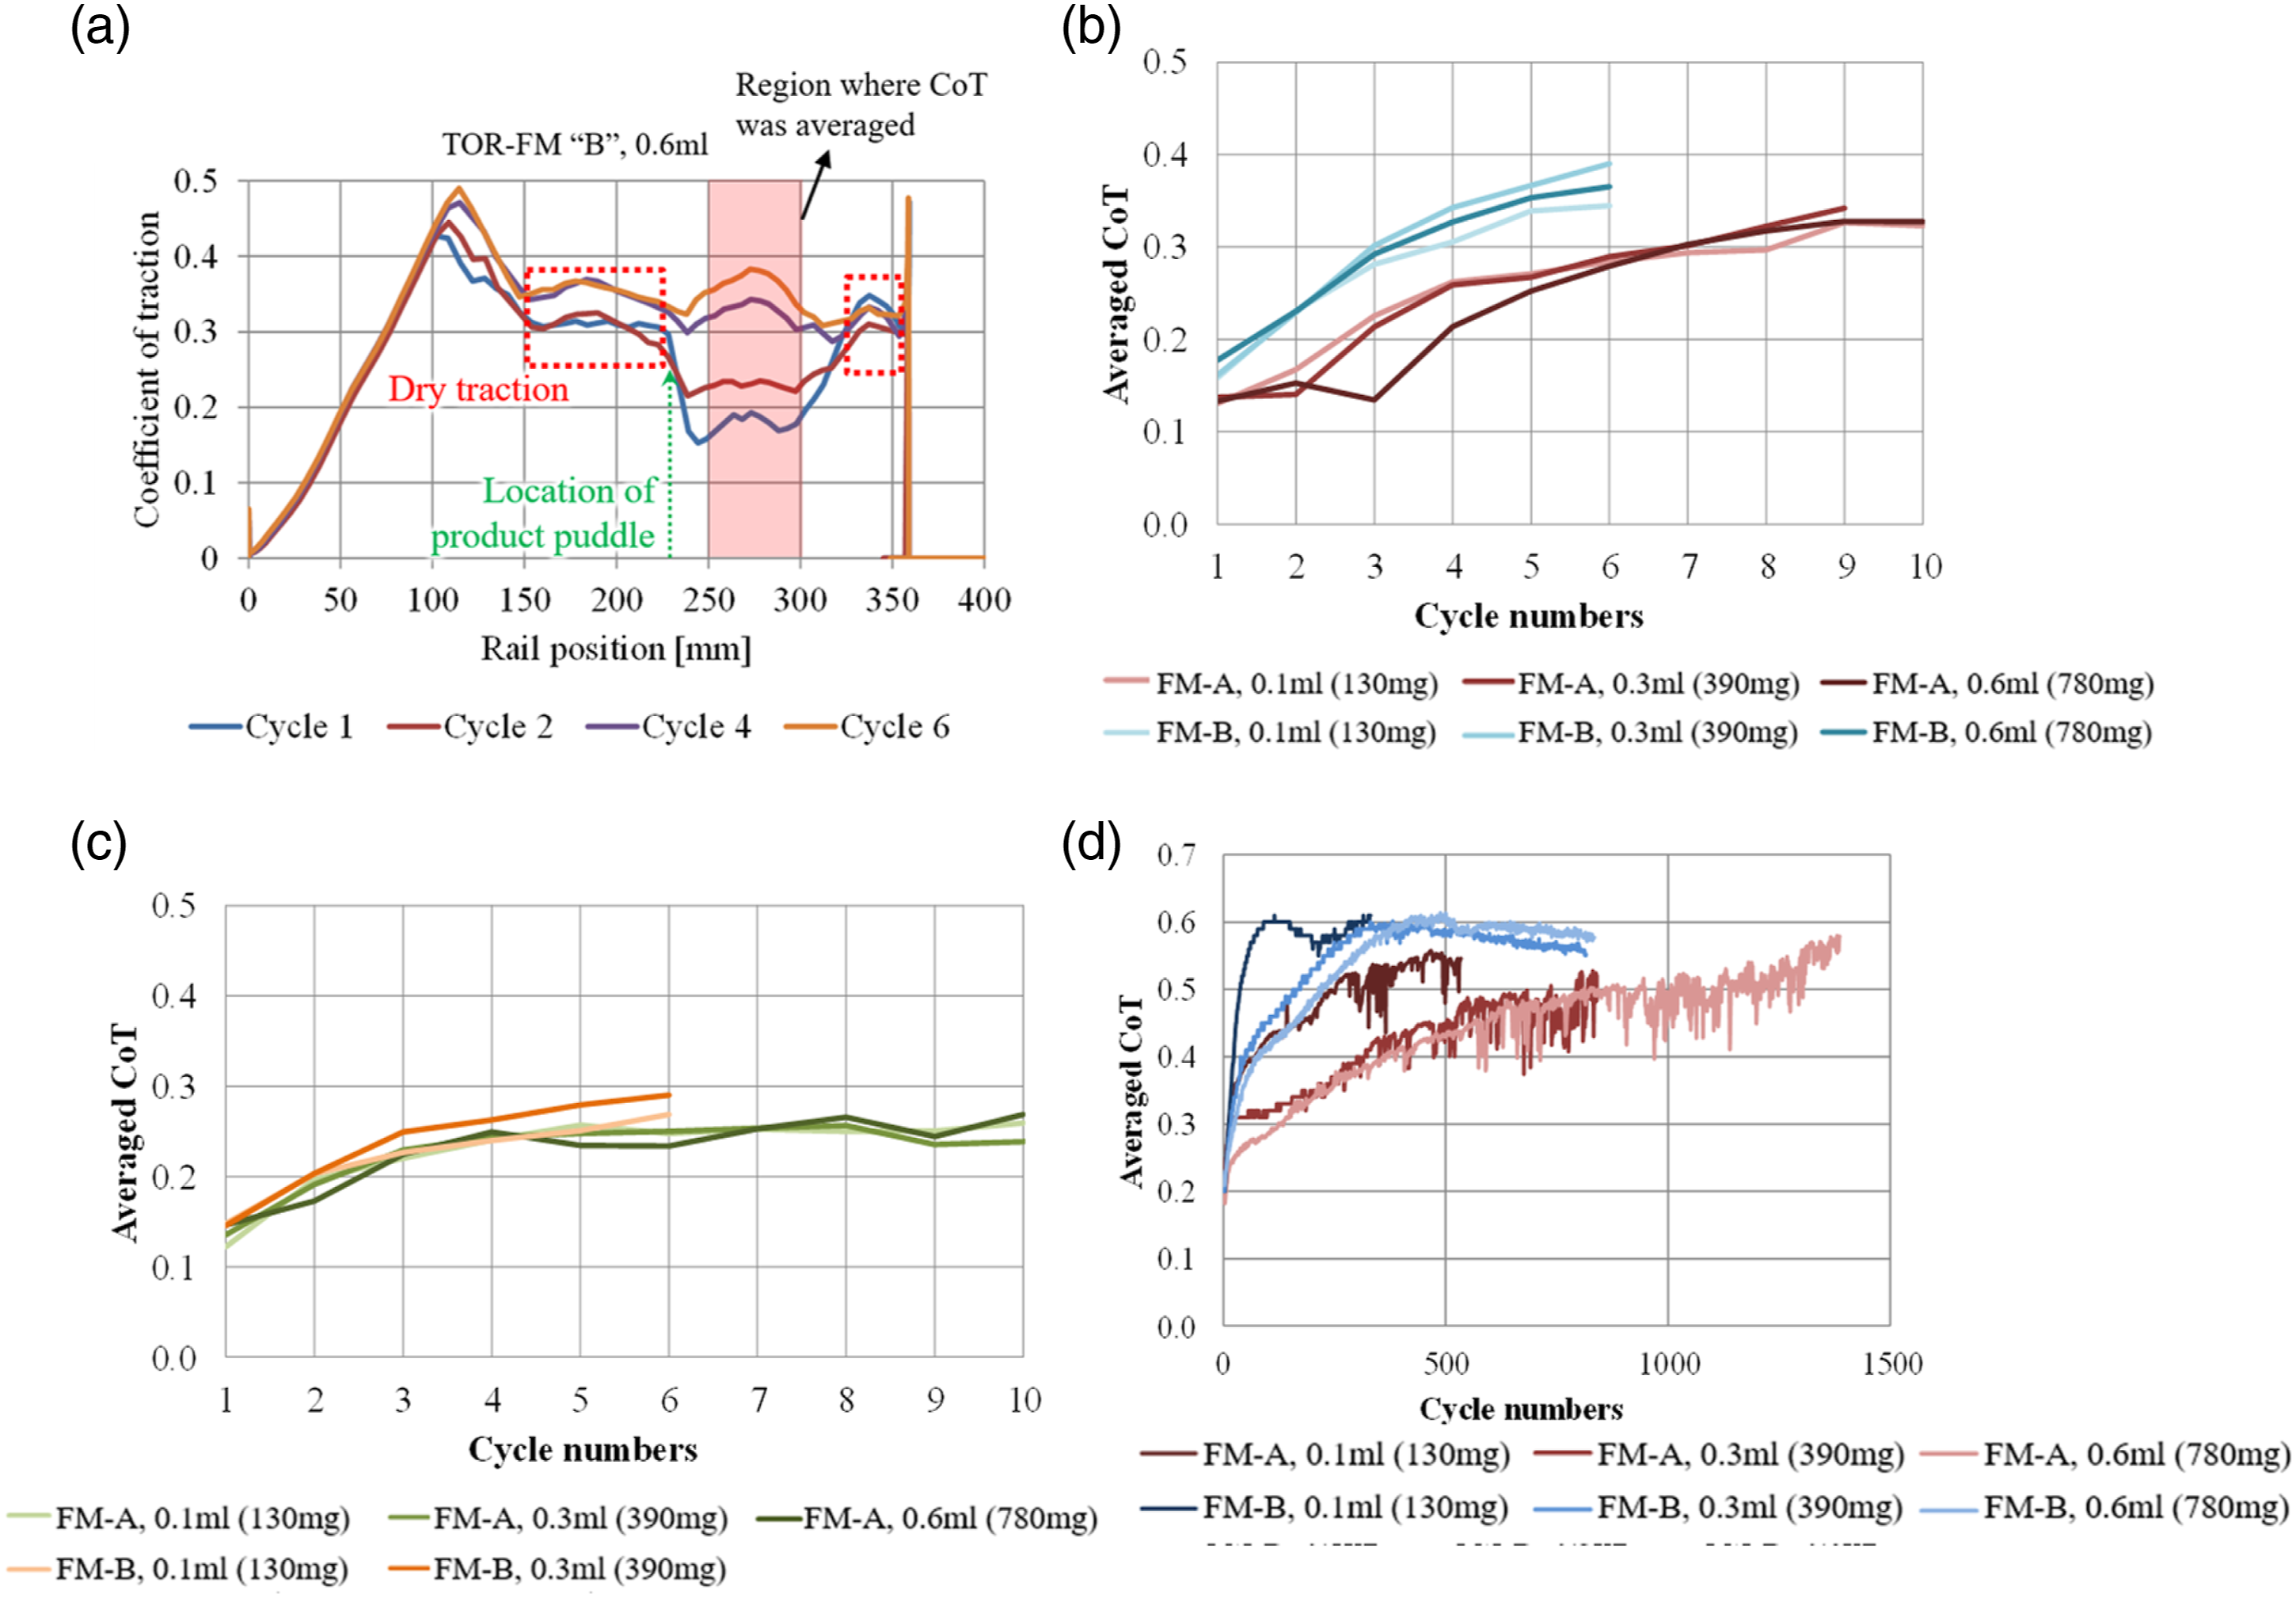
In the pick-up tests, there was a clear difference in the CoT behaviour between TOR-FM “A” and “B” in Figure 6(b). The overall CoT of TOR-FM “B” is higher. This seemed to correlate with Figure 5(b) because there was no significant product transfer between rail and wheel. Even though there was still some product (up to 0.3 g) remained on the rail, but most product was most likely located outside the running band. Therefore, the little product left in the running band would be consumed faster. On the other hand, there was still some TOR-FM “A” product remained within the running band of the rail. Therefore, the overall CoT of TOR-FM “A” is lower.
For the carry-on tests, both TOR-FM products had the same CoT behaviour in Figure 6(c). This also seemed to correlate with Figure 5(c) and (d) as both TOR-FM shared similar data distribution and pattern. This means that the working principle of the carry-on mechanism of TOR-FM “A” and “B” is likely similar after picking-up the TOR products. This phenomenon is explained further in section 4.1.
Consumption tests
Both rigs were used to study the consumption mechanism. The difference of the consumption tests was that the tests do not require product removal from either the wheel or the rail before each cycle pass.
The friction development of the consumption tests using the FSR is shown in Figure 6(d). It shows that the higher the amount of products applied, the slower the rate of CoT increase. Slower CoT increase also means slower product consumption. Consistent with the friction development in the pick-up and carry-on tests, TOR-FM “A” also showed slower product consumption rate in comparison to TOR-FM “B.” The CoT of all the FSR consumption tests eventually reach the dry CoT as the products were steadily consumed.
The friction development of the consumption tests using the SUROS rig showed a similar consumption pattern as the FSR. Figure 7 shows the CoT of the interface in response to the different application rates and test conditions for both TOR-FM products. Similar to the FSR consumption test results, TOR-FM “A” has a slower rate CoT increase. Therefore, the overall peak CoT decreased as the rate of product application increased from approximately the 16,000th cycle. The increase in the product application rate had little effect on the peak CoT throughout the tests. Changing the test conditions (reducing pressure and slip) showed little effect on the peak of CoT. Interestingly, the friction development of the consumption tests on TOR-FM “B” seemed to be affected by doubling the product amount applied in the long term, whereas for TOR-FM “A” this did not. This might mean that the product applied in the standard consumption test had already reached the amount threshold in where any more product applied would show little improvement or changes on the frictional behaviour of the discs. Friction development of SUROS consumption tests using: (a) TOR-FM “A” and (b) TOR-FM “B,” with CoT measuring uncertainty of 0.01.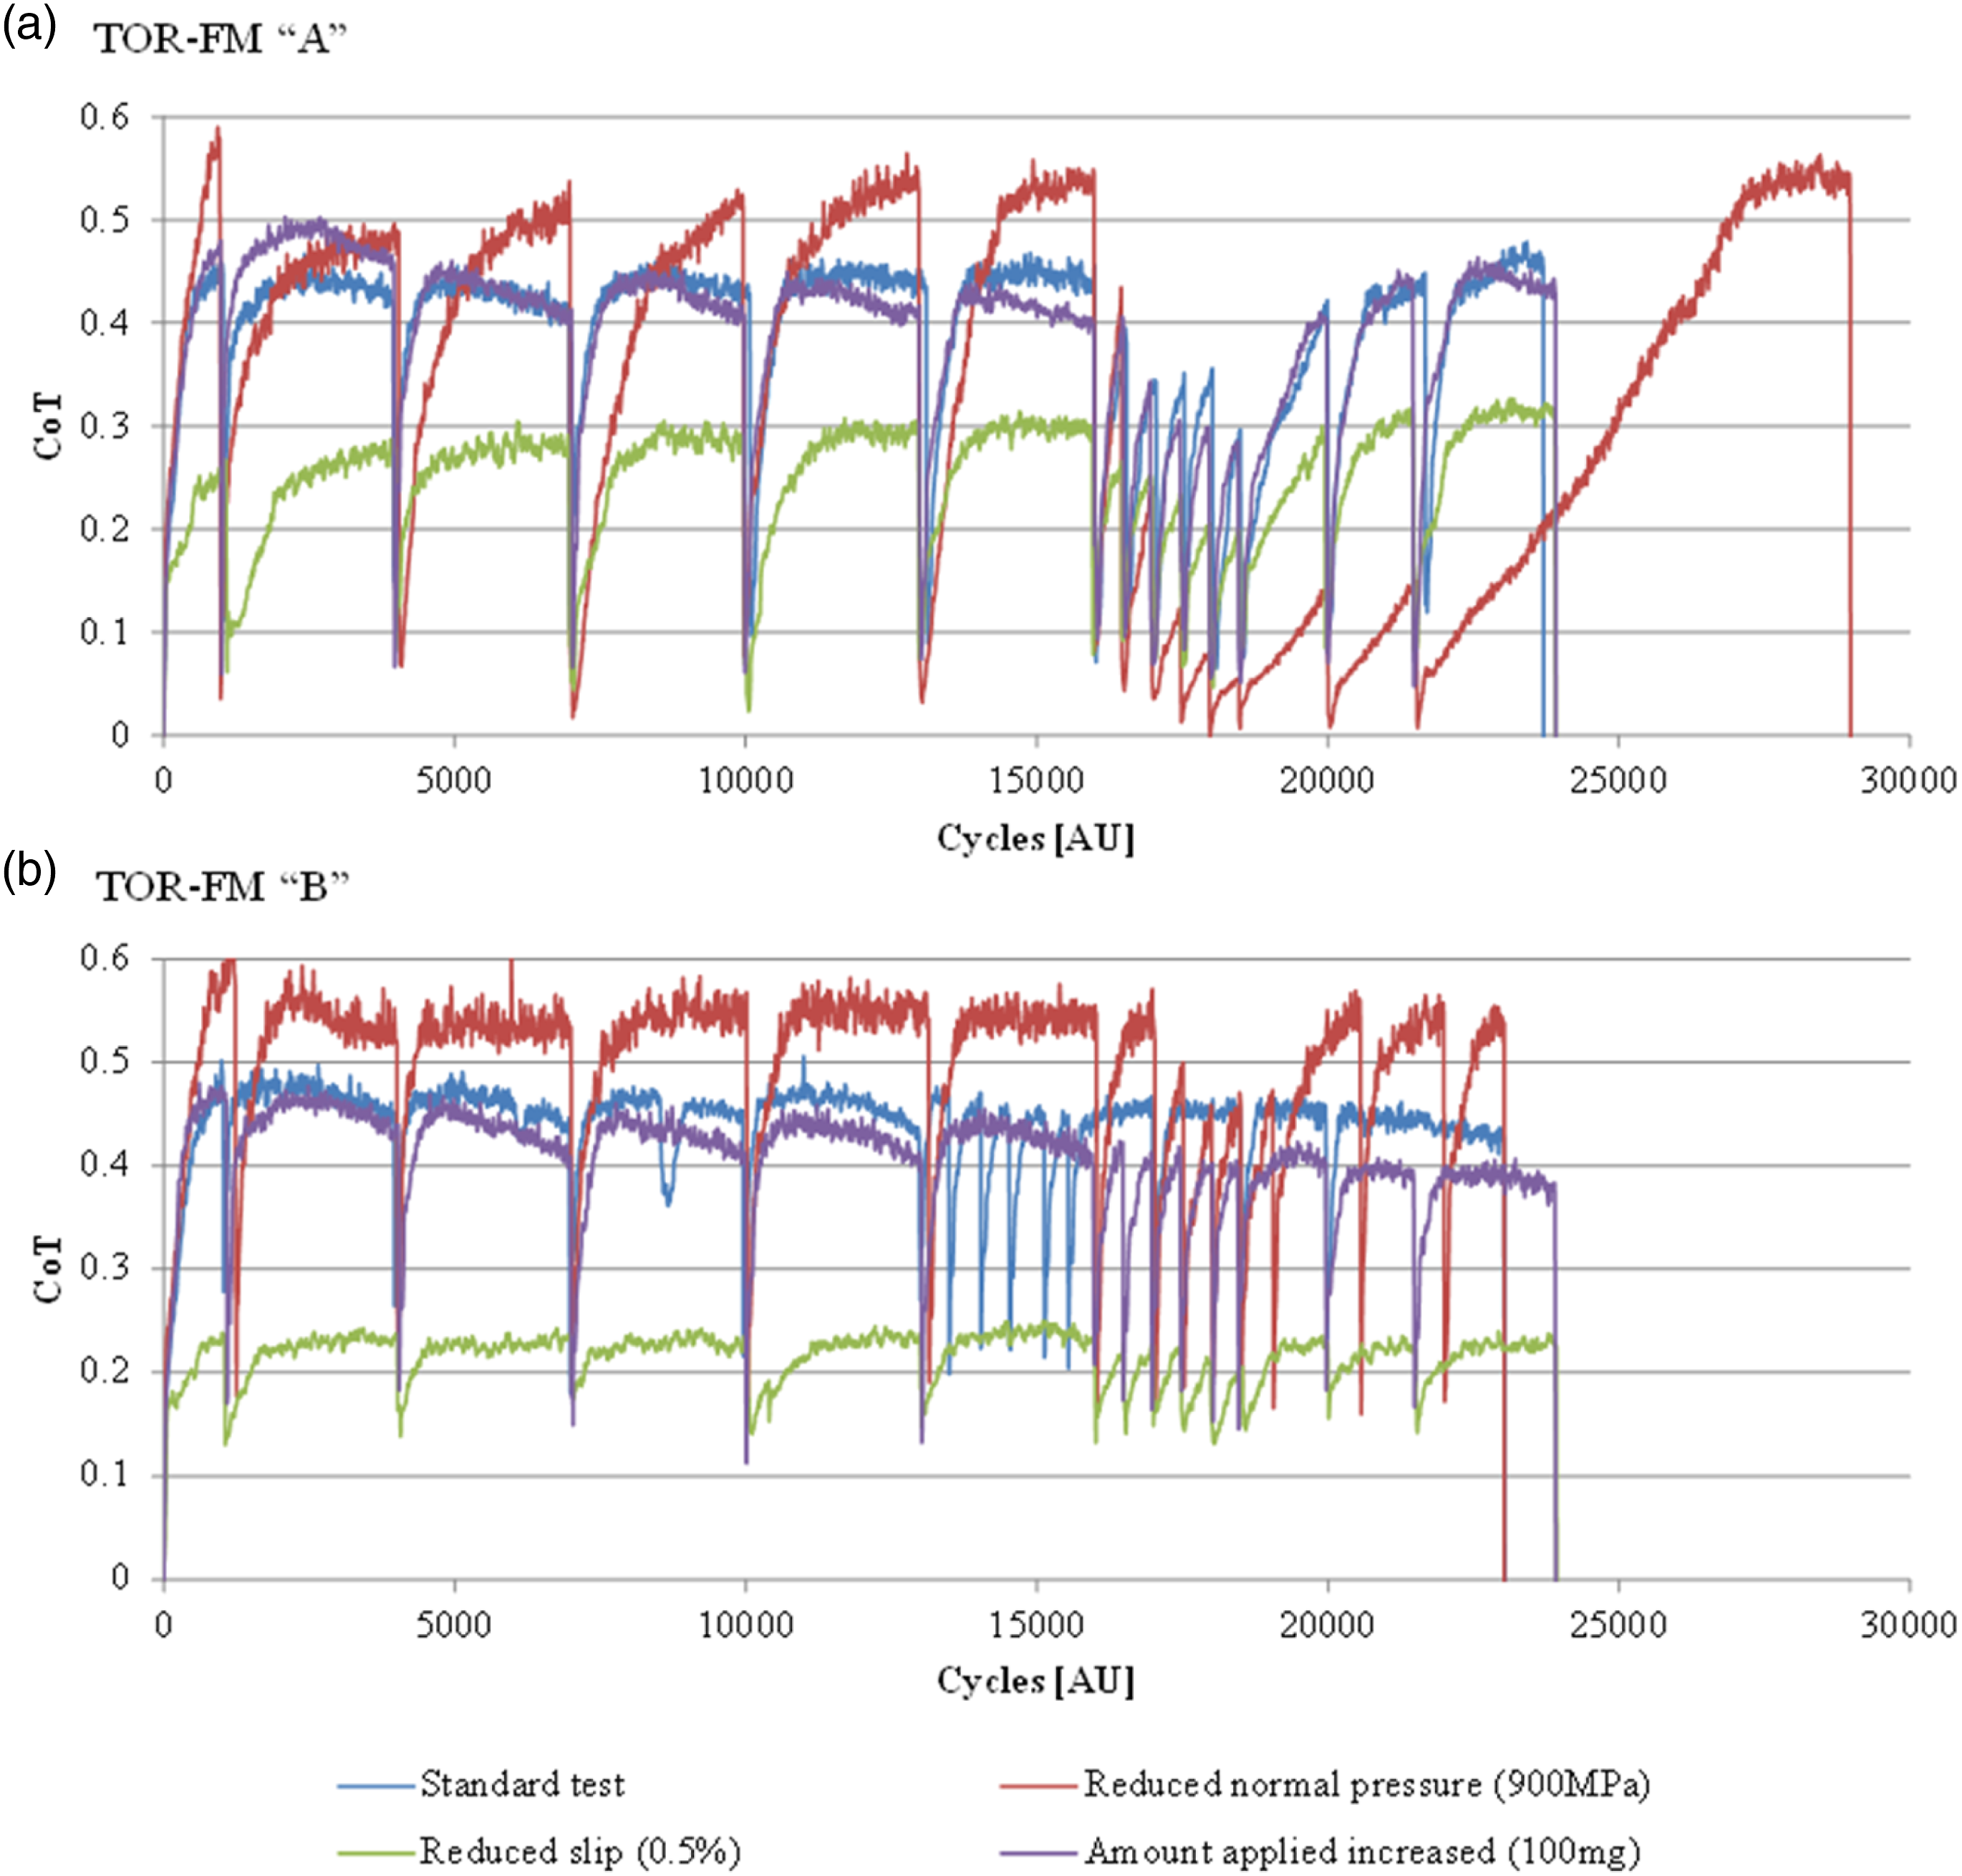
Discussion
Transfer mechanisms of TOR-FM products
The transfer behaviour of TOR products is dictated by three mechanisms: pick-up, carry-on and consumption.
Understanding the pick-up and carry-on transfer mechanisms are essential because these will ultimately determine the effective carry-on distance of the TOR products. This is defined as the rail distance where the products are still effective to control the friction level of wheel/rail interaction.
The pick-up mechanism is the phenomenon when the wheel picks-up the products from the rail. When a train runs through a pool of TOR product freshly applied on the rail, the results showed roughly half of the product at the running band will be picked-up by the first wheel. Assuming the subsequent wheels are free of third body contaminants and travelling along the same running band as the first wheel, the amount transferred to the wheel from the product pool often decreased with the number of wheel passes. This leads to high percentage of product remaining on the rail surface. This happens due to the thinning of the product that significantly reduces the capability for it to be transferred. The amount of product transferred also relies on the product tackiness.
16
As example, TOR-FM “A” could still be picked up by subsequent wheel passes whereas TOR-FM “B” often lost the capability to be transferred after the first wheel pass due to TOR-FM “A” being tackier. When the FSR wheel passed through the tacky TOR product, strands of product were observed as the wheel left the product pool. Some product strands fell on the running band as the strands broke from the moving wheel, which allowed subsequent wheel passes to be able to pick-up more of the product. This behaviour is similar to that seen in the field as shown in Figure 8(a). (a) Locomotive field trials of TOR-FM pick-up showing strings; (b) product distribution (i) before, (ii) during and (iii) after a wheel-rail interaction.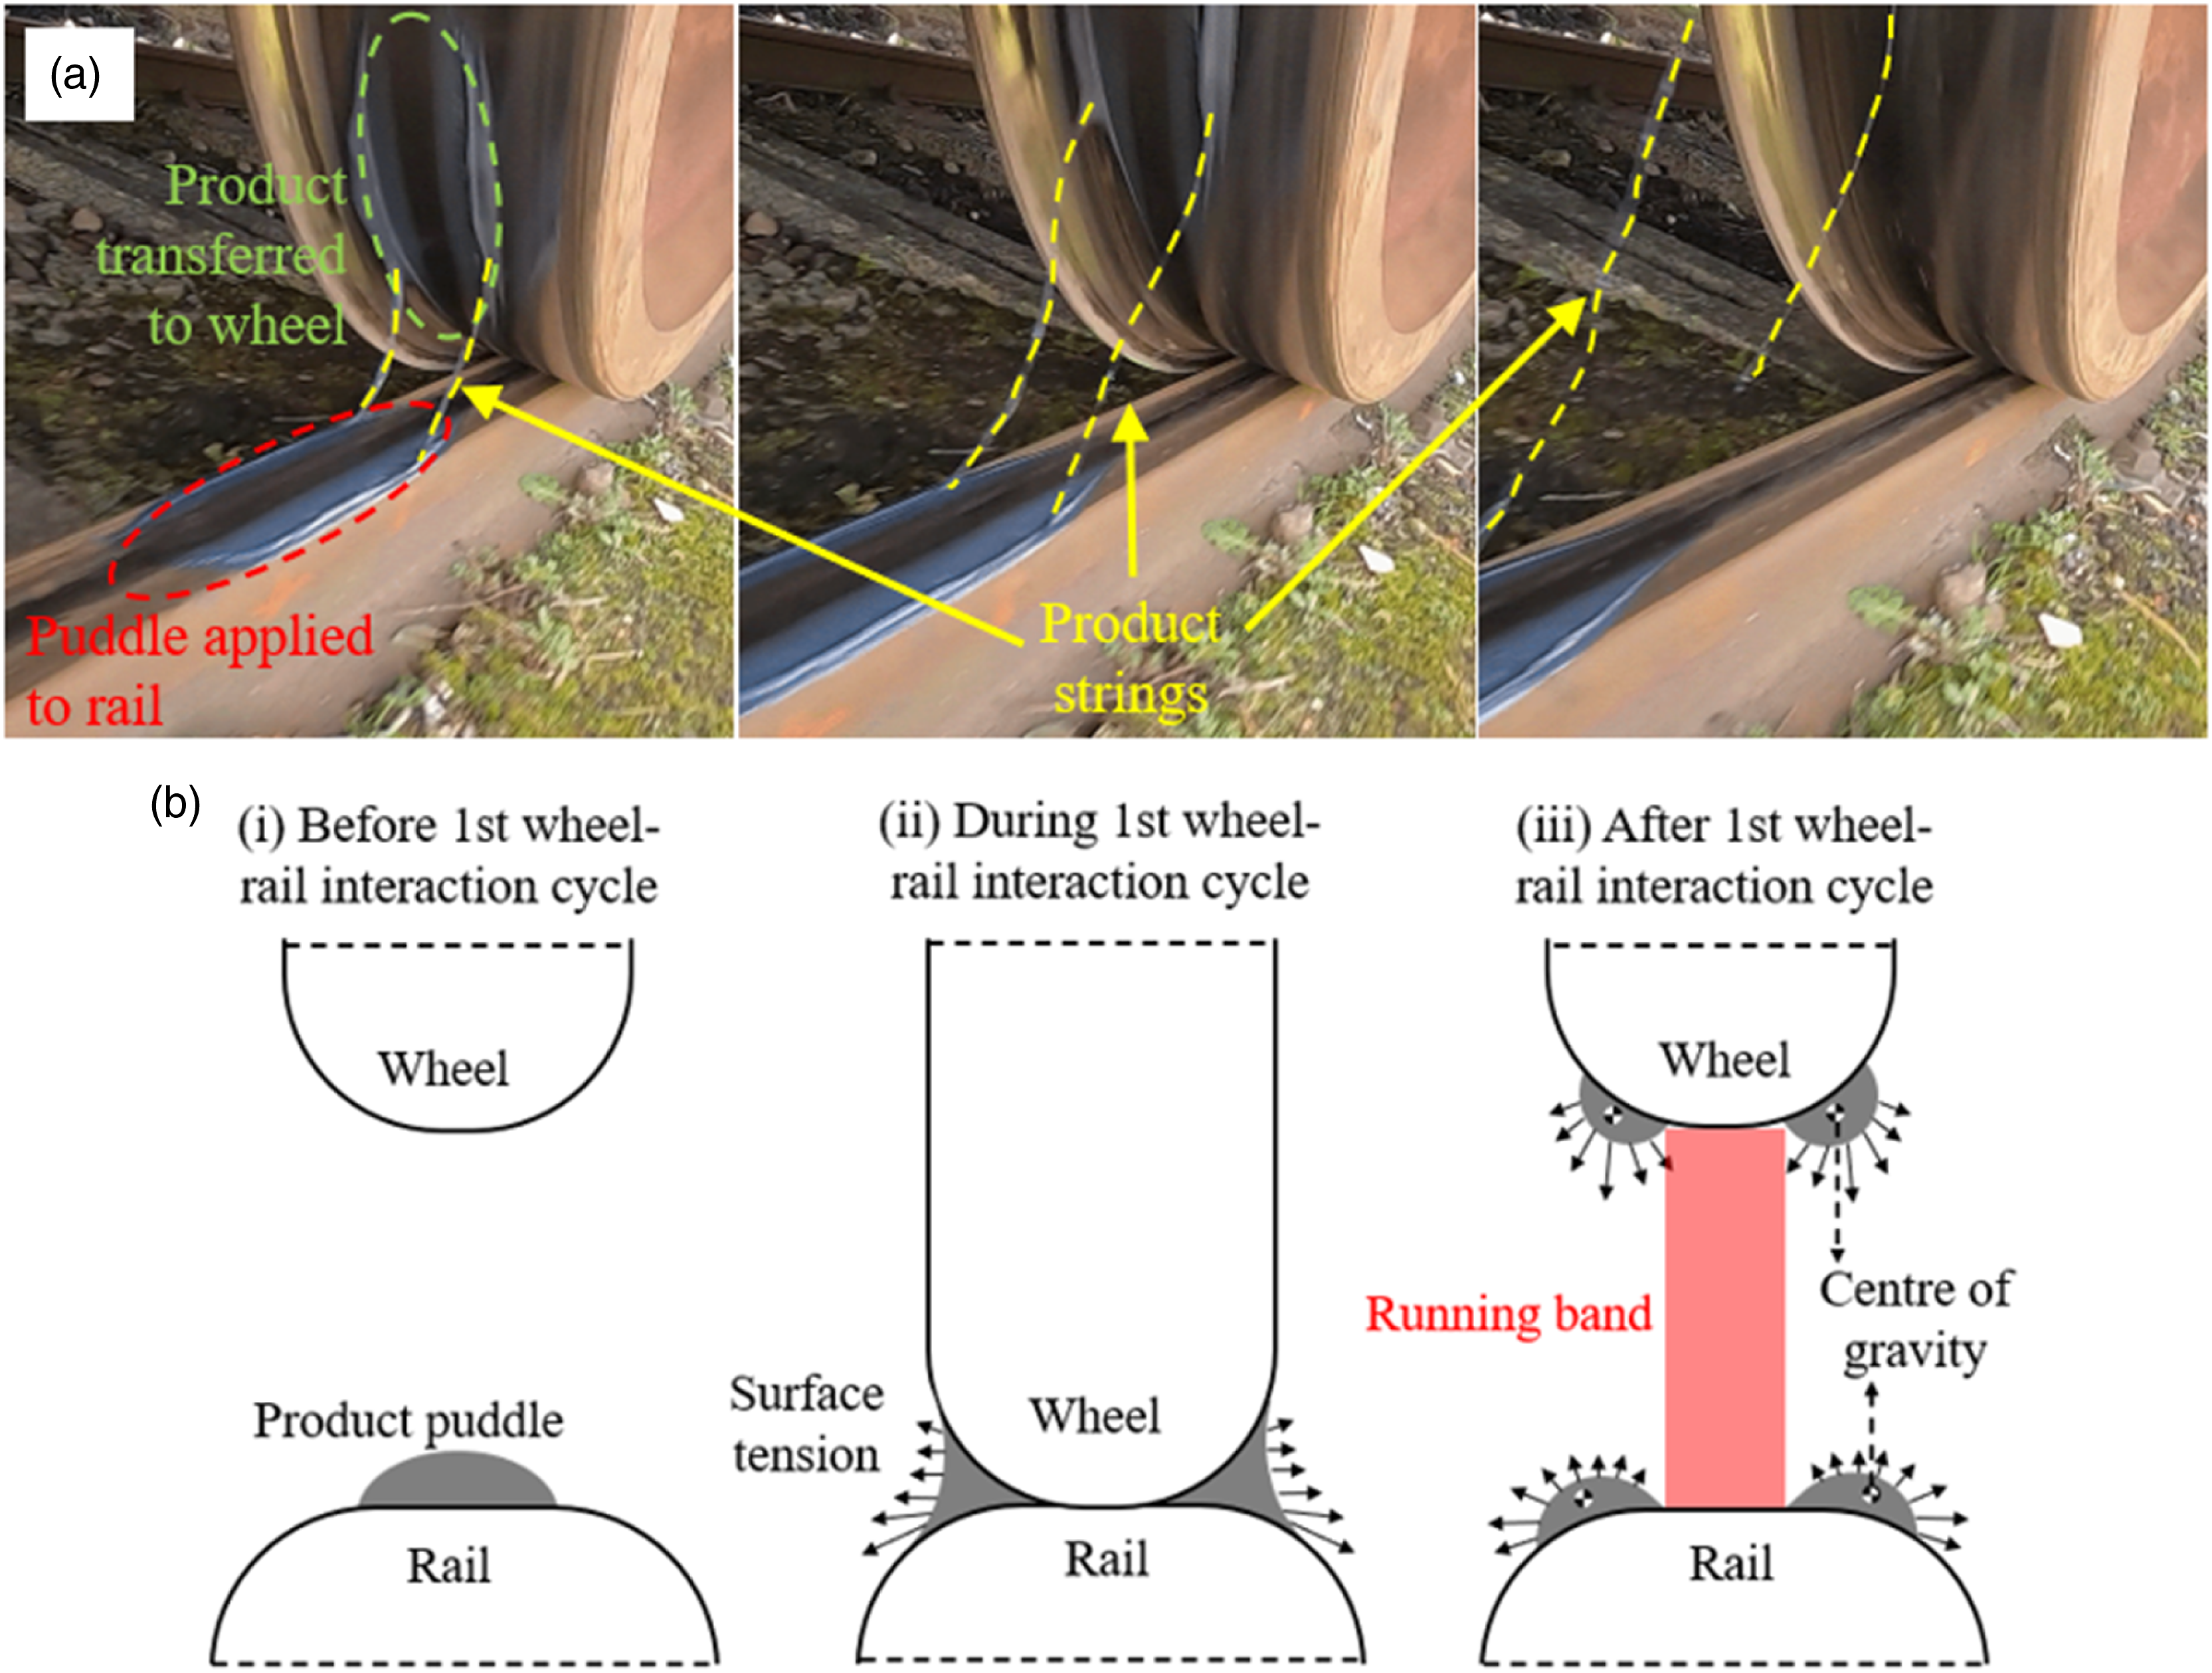
The carry-on mechanism is the phenomenon where the railway product is transferred from the wheel back to the rail after being picked-up from the applied puddle. Despite the performance differences between TOR-FM “A” and “B” in the pick-up tests, Figure 5(c) and (d) show the overall pattern is not much different between both products in the carry-on tests. Based on the friction results in Figure 6(b) and (c), TOR-FM “B” functioned better in carry-on tests than pick-up tests because the overall CoT is lower. The slightly improved performance could be due to a combination of surface tension and centre of gravity. After the wheel picked up the TOR-FM “B” product, the shifting of the centre of gravity towards the running band could pull some product squeezed out from the running band of the wheel back into the running band, as shown in Figure 8(b)(iii). Surface tension on the product also helped spread out the product, making it easier for it to go back onto the running band. TOR-FM “B” did not have similar CoT behaviour in the pick-up tests because gravity pulled the product away from the running band. This could also be proven using Figure 5(b) as the product remained on the rail surface reached 100% from the third cycle in most pick-up tests.
Both pick-up and carry-on mechanisms are susceptible to the thinning of the TOR products. However, despite the inability to initiate the product transfer between the wheel and rail, a layer of product still exists on the wheel or rail surface. Therefore, the friction level should remain or steadily increase as the product layer is consumed due to wear.
It should be noted that this study investigated the pick-up and carry-on mechanisms in a laboratory-controlled environment. In the real world, the train wheels will be in contact with the TOR products at different lateral positions and would possibly have a different product transfer performance. This will be explored further in future research. However, it can be assumed that when wheels pass through the puddle at different lateral positions more of the puddle will be consumed. It also means that product could be spread further along the track as a wheel may pick-up at one lateral position and then not contact the rail again at that point for some time. It is also likely that a dried layer will build-up on the wheel in the same way it could on the rail head. On the wheel, though consumption would be delayed if the contact point with the rail varies. This could help explain how the effects of TOR-FM are seen at significant distances from the point of application, even when product cannot be detected on the rail head. For example, a 35% lateral force reduction was detected 3 km from the application point of a TOR-FM in field trial described previously. 19 While detection of product on the rail head can be achieved, checking wheels is difficult in normal field trials as the trains pass and go. In a recent track trial, using a locomotive running through the same puddle of product repeatedly, with the same lateral position for the wheels, 18 it was shown that product could only be detected using a swabbing technique for up to 450 m down the track. While the technique used was probably not suitable for detecting the very low amounts of product that could have been present further down the rails, it was shown that for the wheels, the product stayed active for >3 km across the whole running band, showing that effects could be present in the wheel/rail interface at far greater distances.
Consumption mechanism of TOR-FM products
Studying the consumption mechanism of the TOR-FM products helps in understanding how the products are exhausted through a series of consecutive wheel/rail interactions to maintain the desired traction level.
Both rigs show that TOR-FM “A” had a lower consumption rate than TOR-FM “B” possibly due to the capability of TOR-FM “A” to mostly remain within running band during the wheel/rail contact. The SUROS tests simulated the situation where the products are reapplied on the rail at a set time interval (in the field product would be applied several times during the passage of a train, axle intervals vary depending on the network operating set-up). Both TOR-FM products had similar CoT behaviour following the standard test protocol as the typical peak CoT was around a value of 0.45. This peak CoT value was used as a reference and referred as the dry peak CoT. This traction was achieved when the discs ran with a dry contact, or the product was fully consumed. The difference between the two TOR products manifested itself in the region where the rate of product application was increased. The peak CoT of TOR-FM “A” reduced steadily in this region because the existing product layer was not fully consumed before the following product application. On the other hand, the TOR-FM “B” product layer was consumed in the time before the following product application even when the production application rate was increased. Therefore, the peak CoT could return to the dry peak CoT value.
The results showed that changing test conditions would result in a different friction behaviour to some extent, but generally the difference between TOR-FM “A” and “B” remained throughout the tests, excluding the “doubling amount applied” test results. The CoT behaviour of both TOR-FM products did not deviate much from the standard test protocol because most likely the amount threshold had already been achieved in the standard test protocol. Therefore, additional product would end up being squeezed out of contact. A threshold amount has been identified in field trials above which “carry-on” is not increased which backs-up the findings here. 25
Conclusions
This study proposed and investigated three product transfer mechanisms that occur during the application of TOR-FMs: pick-up, carry-on and consumption. These mechanisms are generally affected by the amount of TOR applied, the tackiness and the test conditions. It is essential to study these mechanisms to understand how TOR products function and gain insights on what to expect from these products. A well-performed TOR-FM should have long carry-on distance while maintaining effective traction for as long as possible.
In this study, two TOR-FM products of different physical properties were selected for testing. Both TOR-FM products showed that the amount of application has a positive influence on the consumption rate of the product layer formed on the wheel/rail contact surfaces. However, the consumption rate would not further decrease if the amount of application has reached a threshold.
The tackiness of the TOR-FM products plays an important role in the carry-on performance of TOR products. The results showed that both products might have a similar carry-on distance. However, the carry-on performance of low tackiness TOR-FM product would suffer from the second running wheel because there is a significant decrease in product being picked-up by the second and subsequent wheels. High tackiness TOR-FM product benefits from the tackiness property because some strands formed after the wheel/rail interaction may fall on the running band. This optimises the amount of product applied and reduced any waste from the product squeezing out from the running band.
The operational conditions of the train also have an impact on the product consumption in the wheel/rail interface. Results showed that trains with lower weight would decrease the consumption rate of the product layer. The consumption rate would decrease as well if the train could run smoothly with lower overall slip throughout the journey.
The tests developed in this work can be used in the future to study the performance of other TOR products for comparison with the TOR-FMs tested in this project. They would also be appropriate for building into a testing standard for TOR products.
The frictional behaviour and the transfer behaviour of the TOR-FM products are being used as an input to a separate study in modelling the frictional conditions in the wheel/rail interface.
Footnotes
Acknowledgements
G. Trummer and K. Six gratefully acknowledge additional funding within the COMET K2 Competence Centers for Excellent Technologies from the Austrian Federal Ministry for Climate Action (BMK), the Austrian Federal Ministry for Digital and Economic Affairs (BMDW), the Province of Styria (Dept. 12), and the Styrian Business Promotion Agency (SFG). The Austrian Research Promotion Agency (FFG) has been authorized for the program management. For the purpose of open access, the author has applied a Creative Commons Attribution (CC BY) license to any Author Accepted Manuscript version arising.
Declaration of Conflicting Interests
The author(s) declared no potential conflicts of interest with respect to the research, authorship, and/or publication of this article.
Funding
The author(s) disclosed receipt of the following financial support for the research, authorship, and/or publication of this article: This work was supported by the Federal Railroad Administration, U.S. Department of Transportation (contract number DTFR5317C00009).