
Abstract
Changing weather conditions are known to impact on adhesion at the railhead. However, the influence on actual leaf layer “seeding” (formation) and low adhesion has not been measured in the field. This paper presents findings from a field survey conducted in autumn 2023 on a narrow gauge railway in Wales, observing leaf layer initiation, development, and environmental influences on adhesion levels. Using friction testing, timelapse imagery, and chemical analysis, the study examines the impact of weather and layer characteristics on friction. Results show that moisture content in the layer has a significant impact on adhesion levels, with a linear relationship observed between moisture and friction. Leaf layer initiation and development were observed, with water playing a crucial role in layer formation. Chemical analysis revealed the presence of iron oxides and biopolymers in the leaf layers. The results give insight into the variation in adhesion levels in leaf layer that have been measured through indirect measures in the past.
Introduction
Leaf layers on the railhead reduce adhesion to unsafe levels, and disrupt the safe and reliable operation of trains. Recent incidents highlight the risk of leaf layers on the railhead to safe train operation.1,2 Leaf layers can reduce the traction level to well below the safe operating level of 0.1 3 with levels down to 0.03 being measured on the UK rail network. 4
Although the leaf layers are a known risk, there is limited understanding of the transient nature of the friction levels associated with them. Observations of station overruns 5 and signals passed at danger 6 linked with leaf contamination show them peaking in the early hours of the morning up to 09:00, implicating relative humidity (RH), water and limited traffic as factors that could affect leaf low adhesion. Humidity has long been identified as a factor in low adhesion and was assessed in some of the early British Rail Research (BRR) reports.7,8 High humidities reduced the traction on uncontaminated rails in scaled laboratory work9,10 and in the field.11,12
Scaled testing has also been completed on leaf contaminated surfaces, with higher humidity reducing the traction on a leaf contaminated surface, 9 across a range of temperatures 10 with a specific significant drop above 70% RH for lower temperatures (1°C and 10°C) where condensation formed.
Testing where the specific relative humidity of the leaf layer was varied by Guidoum et al. 13 found that, although Coefficient of Traction (CoT) did not always decrease as humidity increased, that the highest humidity (85%) consistently had the lowest traction at a range of slips. This work largely focuses on leaf layer once formed and is exclusively in the laboratory.
There has been limited assessment of leaf layers and how they form (naturally) in the field and no quantitative assessments that track layers as environmental conditions change, although anecdotal evidence suggests that heavy rain can disrupt their formation. This is due to track access being limited, and mitigation such as the use of railhead treatment trains (RHTT) disrupting layer formation. Some surveys of layers were completed in the early 1970s7,8 which provided initial observations and some industrial surveys were completed in the 1990-2000s 14 but this data is inaccessible beyond headline results. Techniques and equipment have improved since then making new insights possible. This paper describes a survey of leaf layers carried out in the field during the autumn season of 2023 on a heritage railway in Wales. A heritage railway was used as it provided access that is not possible on mainline rail in the UK.
The aim of the survey was to observe leaf layer initiation, formation and evolution in the field whilst tracking changes in characteristics of the layers. It was hoped that this would allow for observation of: - leaf layer “seeding” and growth on the railhead - evolution of the physical characteristics of leaf layers over time and axle passes (e.g. thickness and moisture) - changing traction characteristics with changing weather conditions
Access to the naturally occurring layers would also allow for chemical testing to give more insight into the layer formation process.
The Vale of Rheidol (VoR) narrow gauge steam railway located in Wales, linking Aberystwyth to Devil’s Bridge, was used for the measurement campaign. Low adhesion issues have been observed (in traction) travelling up the valley 15 towards Devil’s Bridge. The line travels through a variety of heavily wooded areas making it high risk for leaf fall related low adhesion. The railway provides an ideal measurement site as, unlike the main rail network, no trackside applicators or water-jet cleaning are used and the only mitigation methods being sand applied from locomotives.
The specific measurement site was between the Capel Bangor and Nantyronen stations (shown in Figure 1) and was accessed by foot.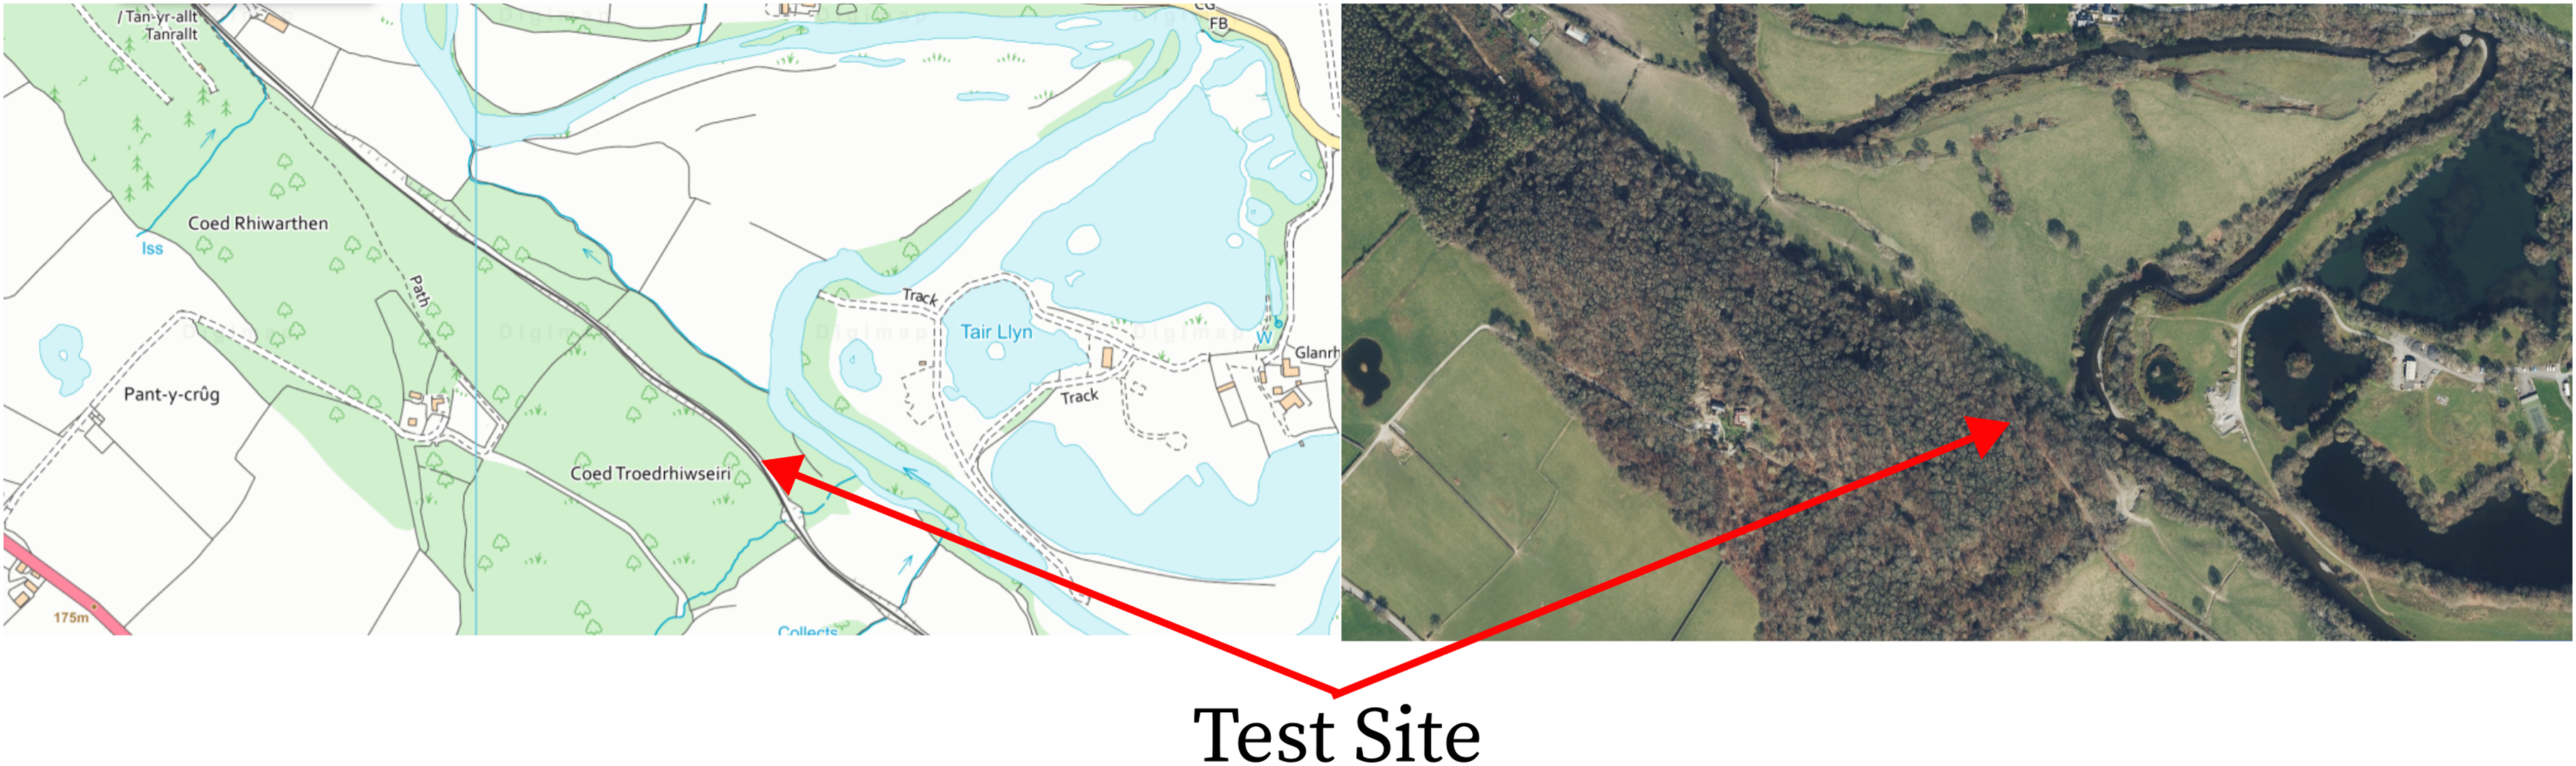
It has heavy tree cover, with a mixture of oak, sycamore and birch. The site is cut into the steep valley side and due to the fencing on the lower side of the track, leaves are retained and not blown away from the site (see Figure 2). These tree types have been highlighted as problem species in the Adhesion Working Group adhesion manual.
18
Measurement site (a) looking “up” towards Devil’s Bridge (b) looking “down” towards Aberystwyth.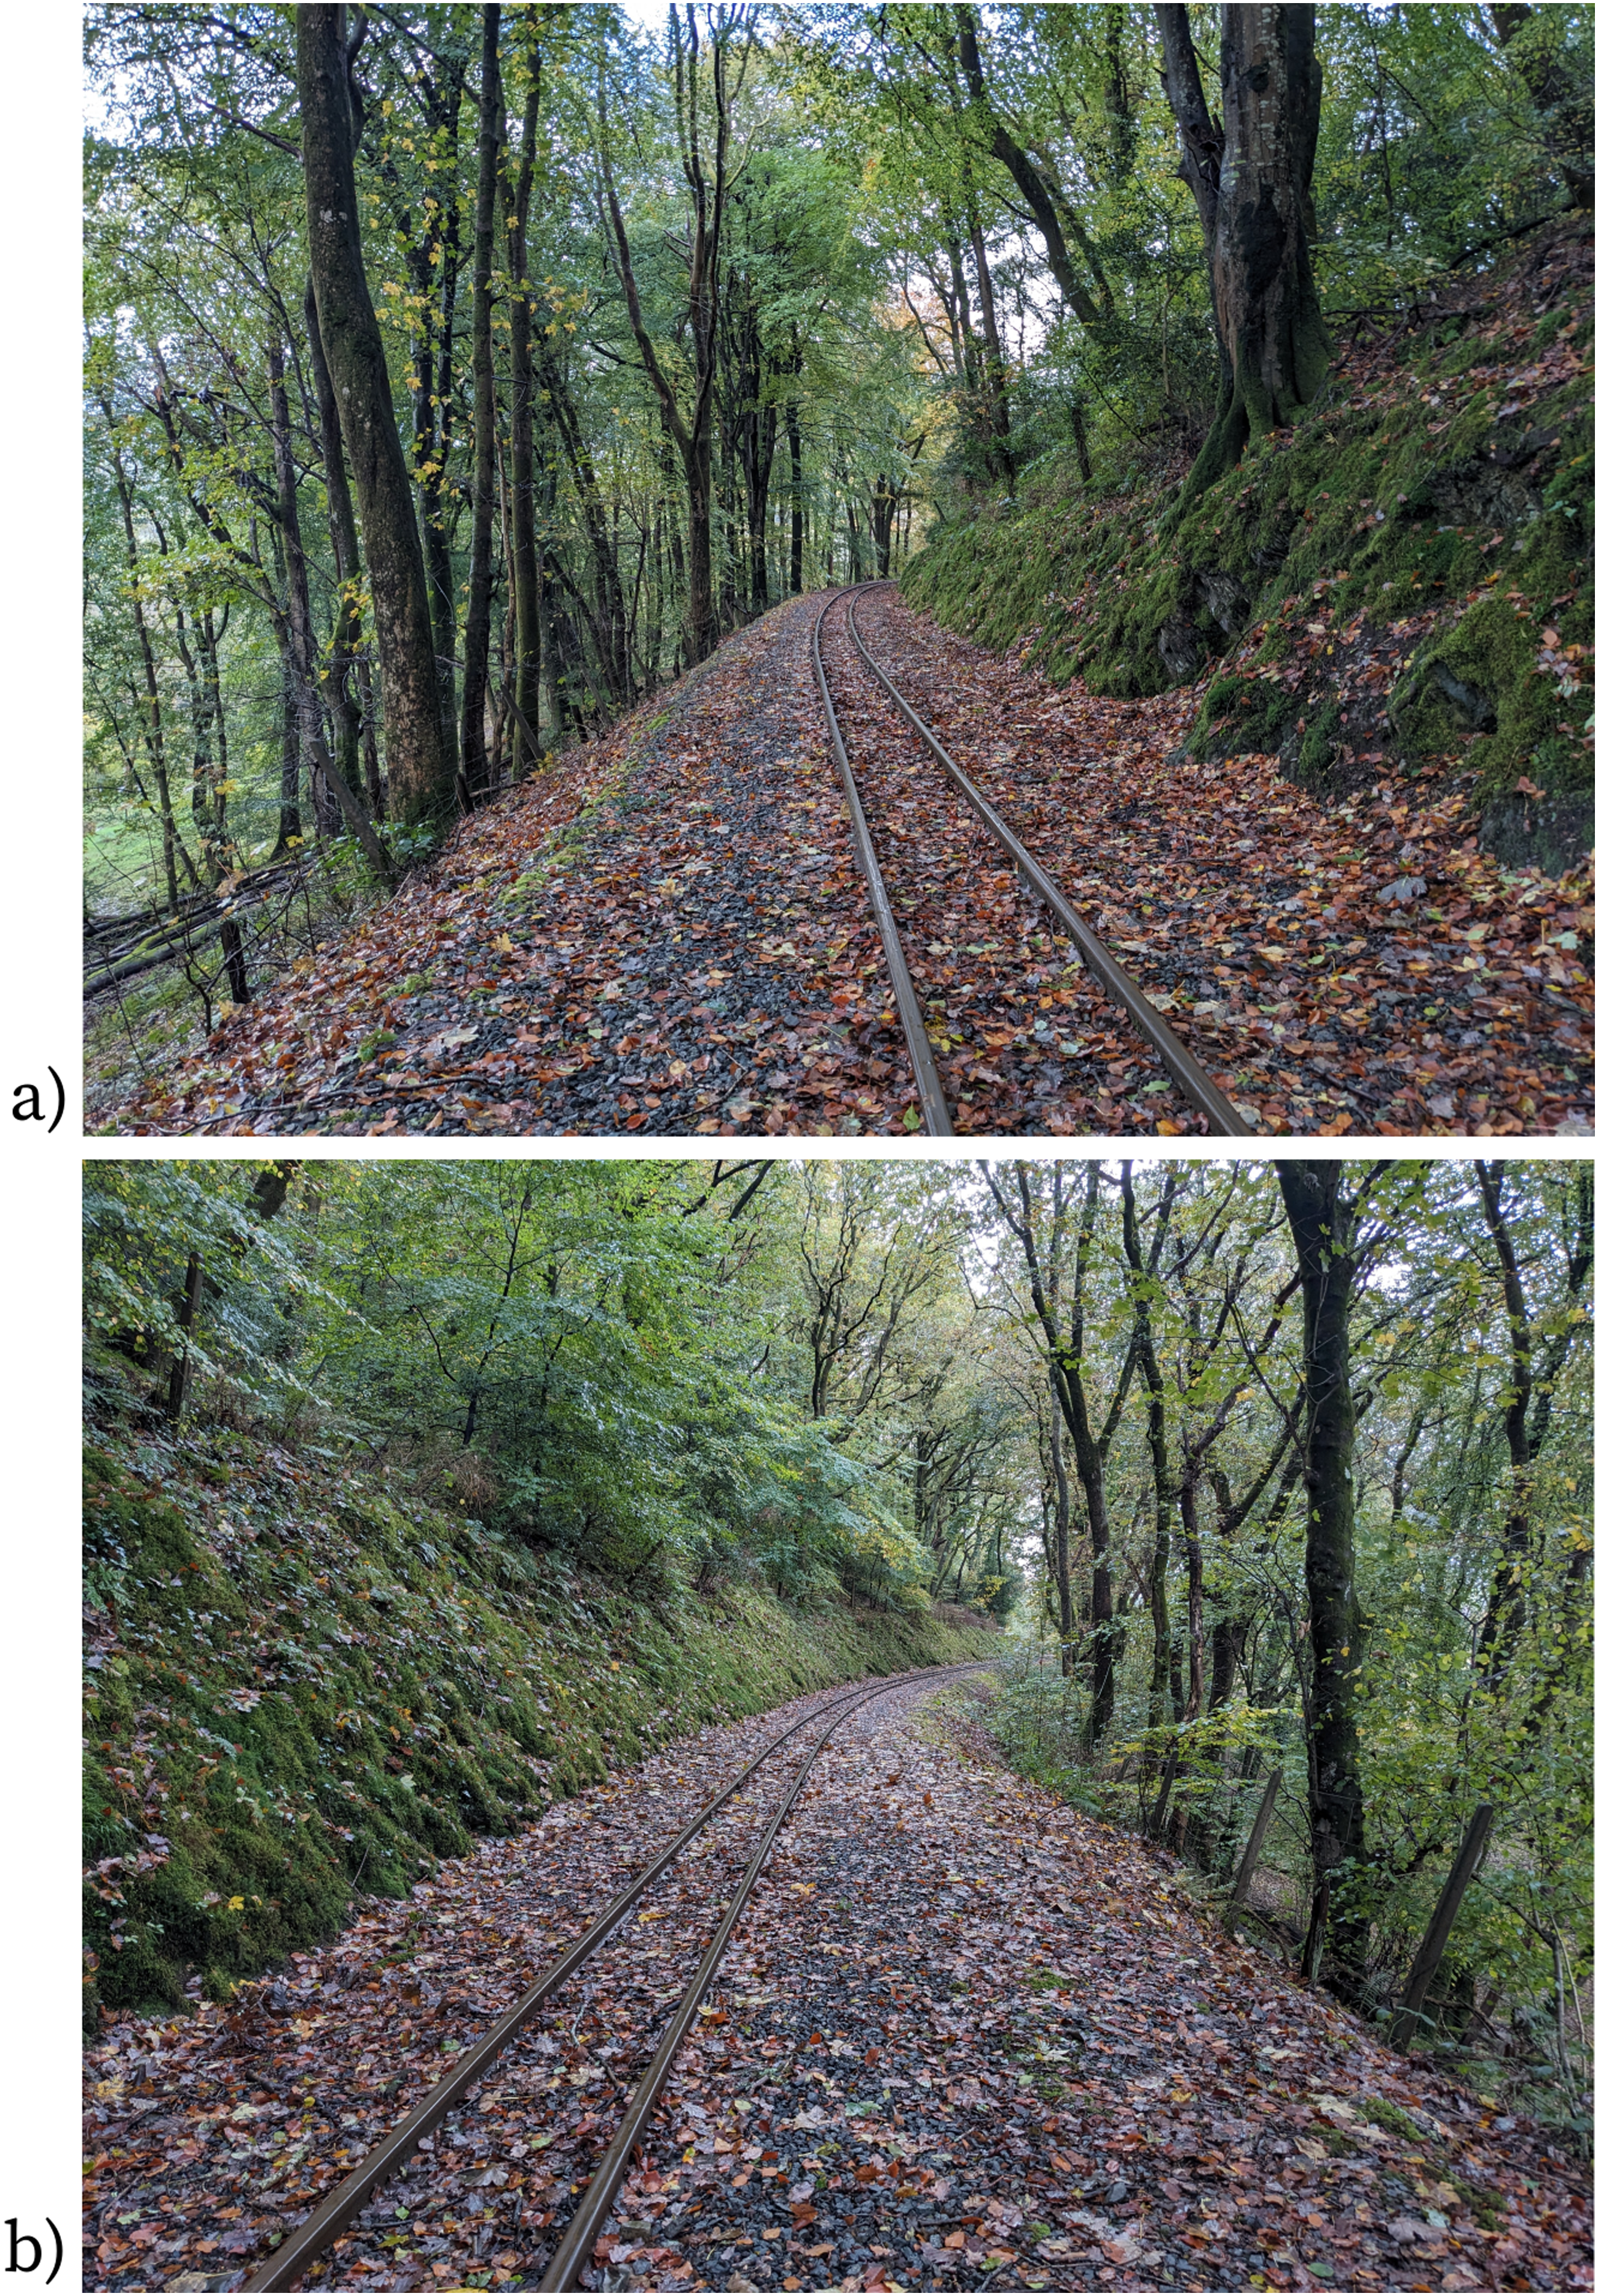
This location is at high risk of low adhesion based on a variety of risk measures. Using the a low adhesion model developed by Butcher et al.19,20 this site has a score of 116 (within the “High” risk category), and using the Network Rail identification of leaf fall risk site assessment 21 the site is at the highest risk of low adhesion (“Class 5”). The measure of ground litter that can impact adhesion (“leaves on the ground”) was predicted to rise from 2.5%–5.2% (with 5%–8% being the 3rd highest category) during the test week. 22 The amount of leaves still held in the canopy (“total leaf cover”) was forecast to drop from 71.0%–60.0%. The average “adhesion index” forecast, a measure based on a range of physical measures (such as rainfall rates and rails temperature 23 ), was “Poor” for the 5 days testing, meaning worse than normal autumn conditions.
Methodology
Friction testing was conducted using a pendulum, as outlined by Lewis et al.
24
The pendulum (shown in Figure 3(a))) was originally created as a tool for measuring slip on road and pedestrian surfaces, and uses an energy loss principal as the rubber pad swings and comes into contact with the surface being tested. The method has been adapted for use on railheads, and the measured pendulum test value (PTV) is converted to Coefficient of Traction (CoT) using a relationship defined by British Rail Research between wheel/rail interface friction measured on their Tribometer Train and a pendulum device
25
(see Figure 3(b)). (a) Pendulum tribometer in the field at the VoR test site (b) linear fit for conversion between pendulum test value and coefficient oftraction as measured by the BRR train
25
(c) timelapse camera set up.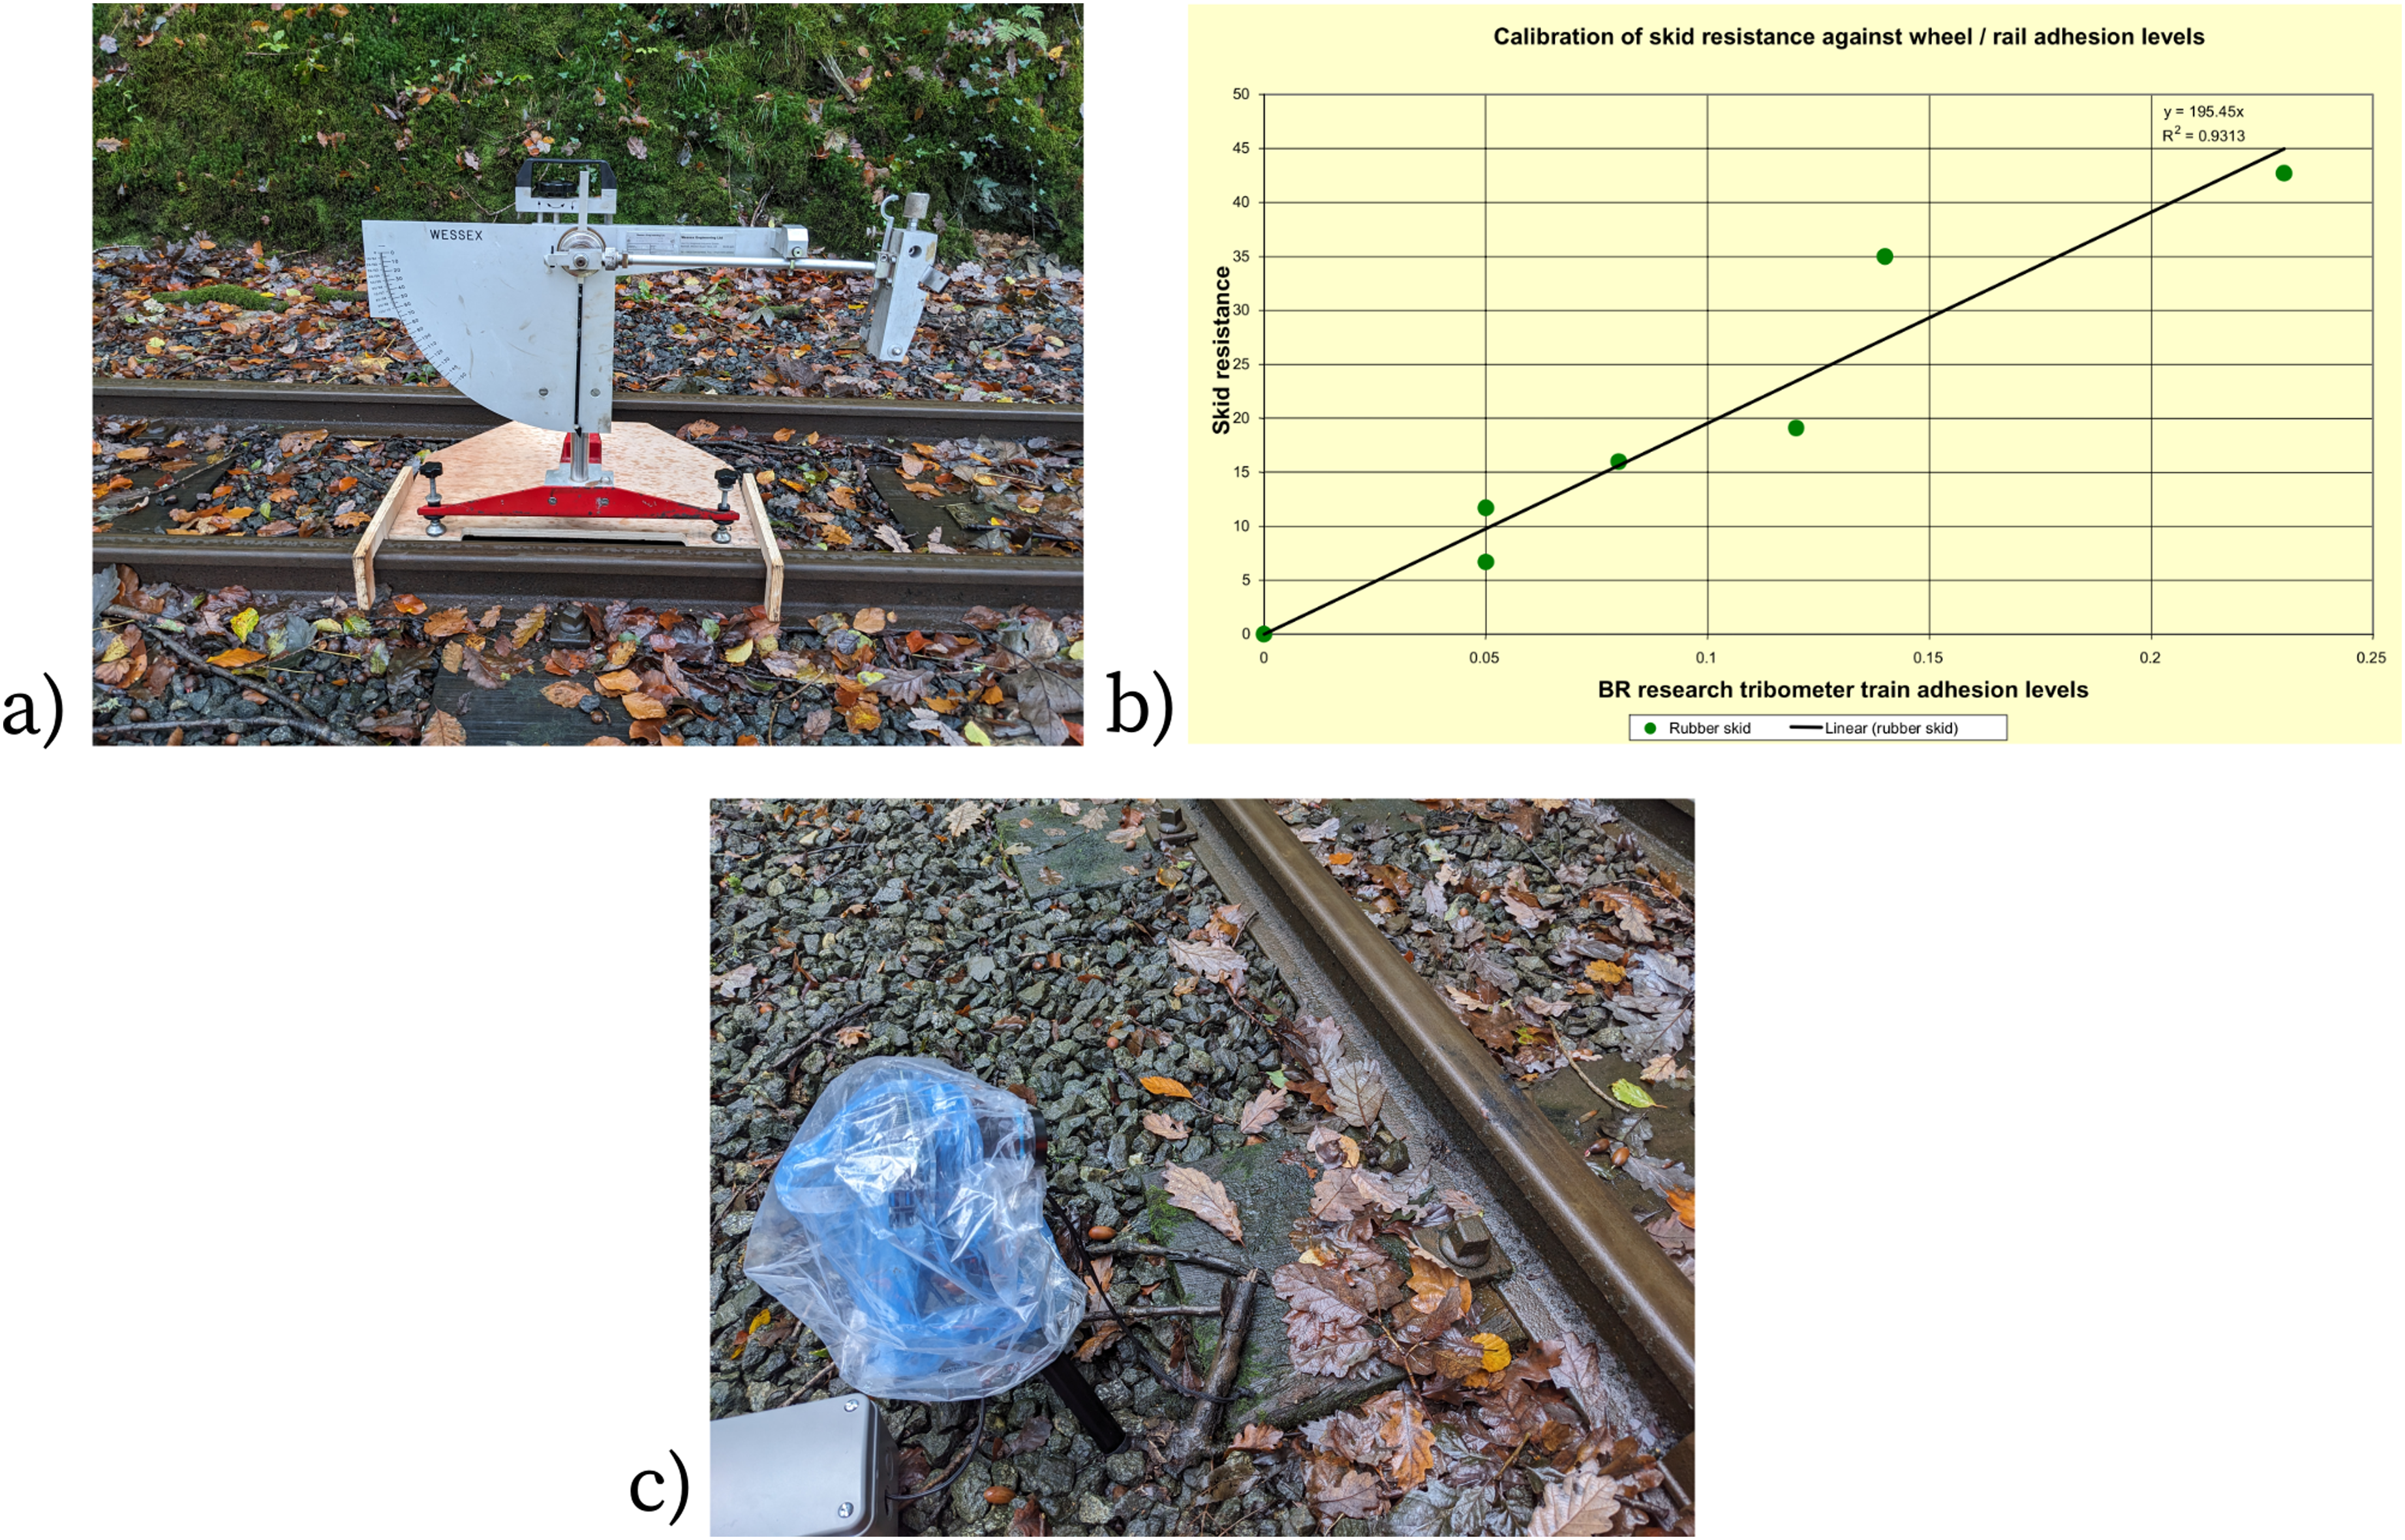
Layer thickness of the leaf contamination was measured with an eddy current device 25 (FN Evo Coating Thickness Gauge). Layer moisture content measurement was carried out with a Testo 606-1 using “curve 1”, which limits the readings between 8.8 and 54.8%. These values are for wood moisture equivelent (WME), which is the moisture level of a material that is in close contact and moisture equilibrium expressed as a percentage of the moisture content of wood. Both moisture and layer thickness were measured 3 times (at a marked location) for each timepoint and then averaged. Time lapse imagery was also collected from the railhead using a Raspberry Pi and camera (shown in Figure 3(c)).
Uniquely, Fourier Transform Infrared spectroscopy (FTIR) analysis of the leaf layers was completed in-situ using an Agilent 4300+ handheld FTIR spectrometer with specular reflectance lens attached. This removed the risk of sample degradation during collection and transporting specimens back to a laboratory. The method uses 64 background and samples scans with a resolution of 8 cm−1 between the wavelengths 4000-650 cm−1. Ex-situ FTIR has been use previously for leaf layer analysis26–29 so some comparison data exists. Samples were collected for Nuclear Magnetic Resonance (NMR) technique. This has not been used before for leaf layer analysis previously. It was hoped that this would give information on sp2 portion of carbons in the leaf layer as formed on the railhead. X-ray Photoelectron Spectroscopy (XPS) was also carried out. Samples for these approaches were collected by scraping the material directly from the railhead into aluminium foil, this foil was then stored and transported for analysis ex-situ. The foil ensures that the sample is protected from contamination through contact or from the container used for transport. 30
Local environmental conditions were logged using a Kestrel Drop D2 and a RS PRO RS-172 TK Temperature & Humidity Data Logger. The average conditions for October and November 2023 were 10.4°C and 86.6% RH based on Met Office synoptic data for the nearest weather station (Trawscoed). 31
Results
Leaf layer initiation
Due to the weather conditions over the week of testing (heavy rainfall) no leaf layers were observed developing over more than 24h, with early stage layers being removed through a combination of rain and train passes. Leaf layer initiation was observed through the week where leaves landed on or were crushed into the rail, a range of examples is shown in Figure 4. (a, d) Whole leaves fallen onto the track (b, c, e, f, g, h) leaves exhibiting signs of crushing from wheel passes.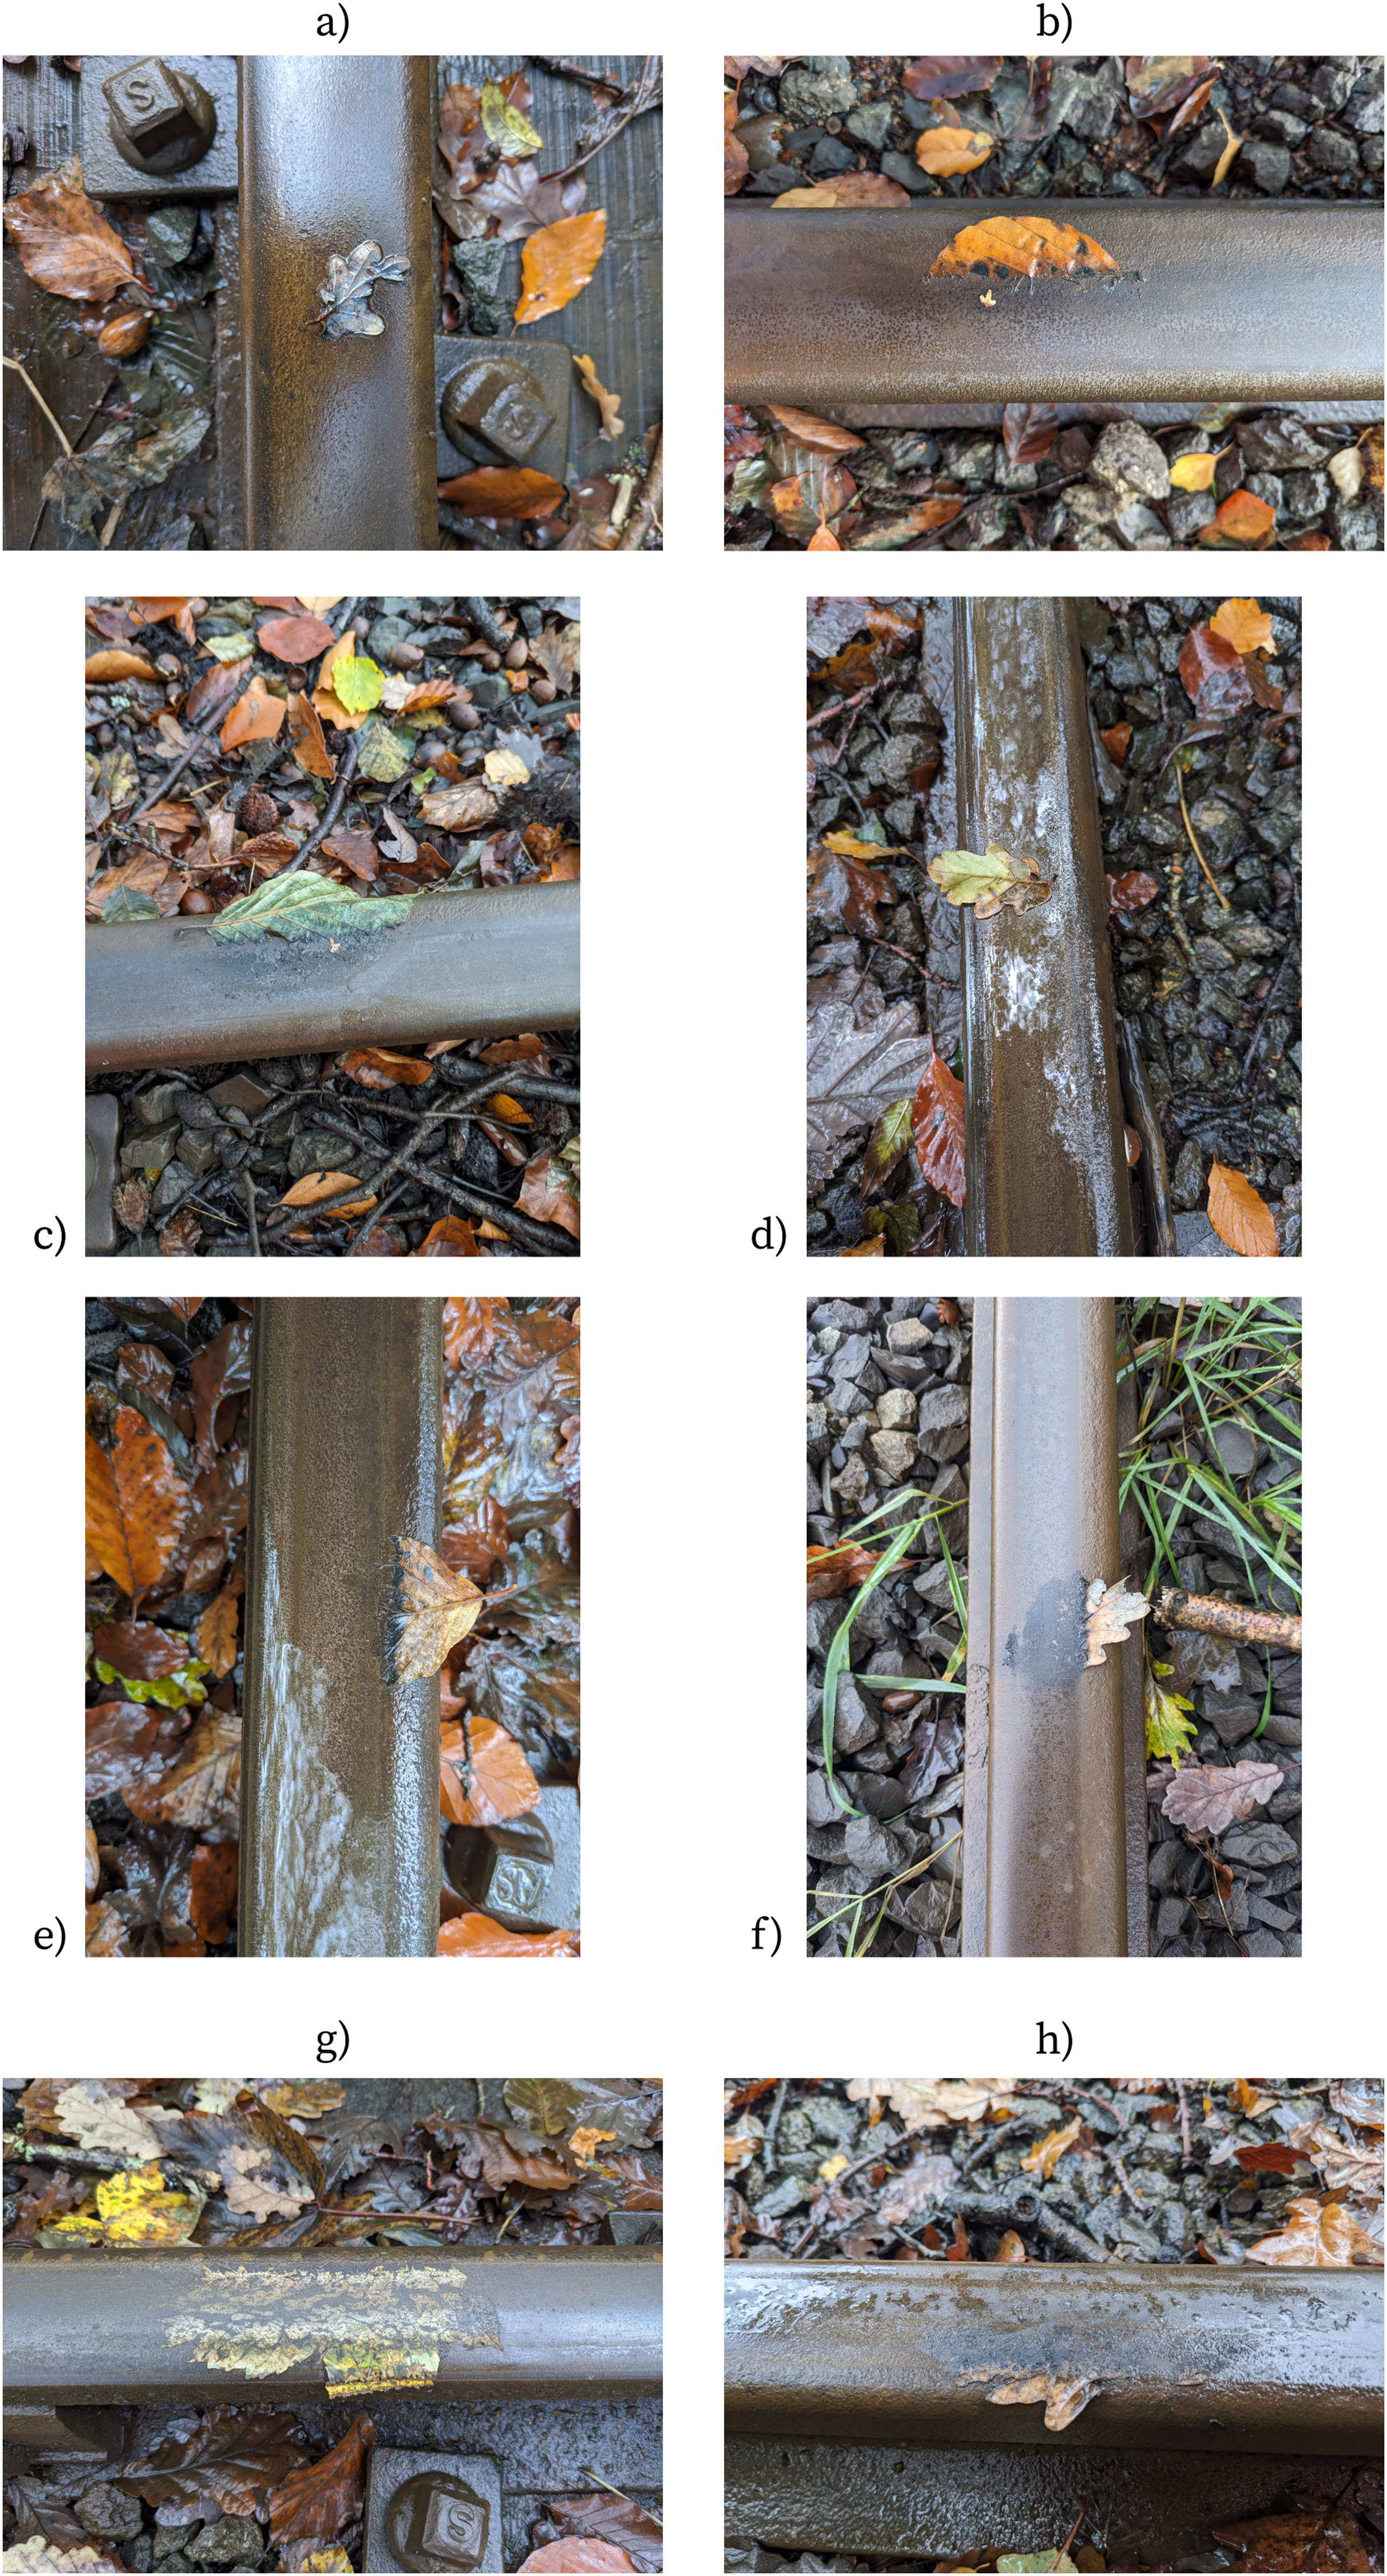
The black colouration typically observed in well established low adhesion leaf layers is seen here, developing first from the crushed or cut areas of the leaf. The crushing that has occurred on some (Figure 4(c), (e), (f), and (h)) of the leaves was from train passage, and they were pictured when accessing the rail the next day, approximately 17 hours later. For whole leaves that had fallen onto the rail (Figure 4(a) and (d)) the black colouration seemed to emanate from damage on the leaves (fungal spots or cracking). The leaf in Figure 4(g) was observed directly after a train pass and although the whole leaf was crushed, the black colouration only occurred in the moist areas of the leaf. This may have been due to the fact that at this point the railhead was extremely dry. This is explored further in the next section.
The mean value for the layer thickness during all of the testing was 11.6 µm and mean moisture level was 18.7%.
Timelapse imagery
Two main observations were made from the timelapse capture of leaf layers. During heavy rain, a well blackened section of contamination exhibited probable changes in surface energy and appeared hydrophobic (see Figure 5). The rail was “flooded”, but the area around the contamination appeared to repel the water to a large extent. (a) Apparent hydrophobicity of leaf layer in rain (b)-(c) crushed leaf discoloration over an hour.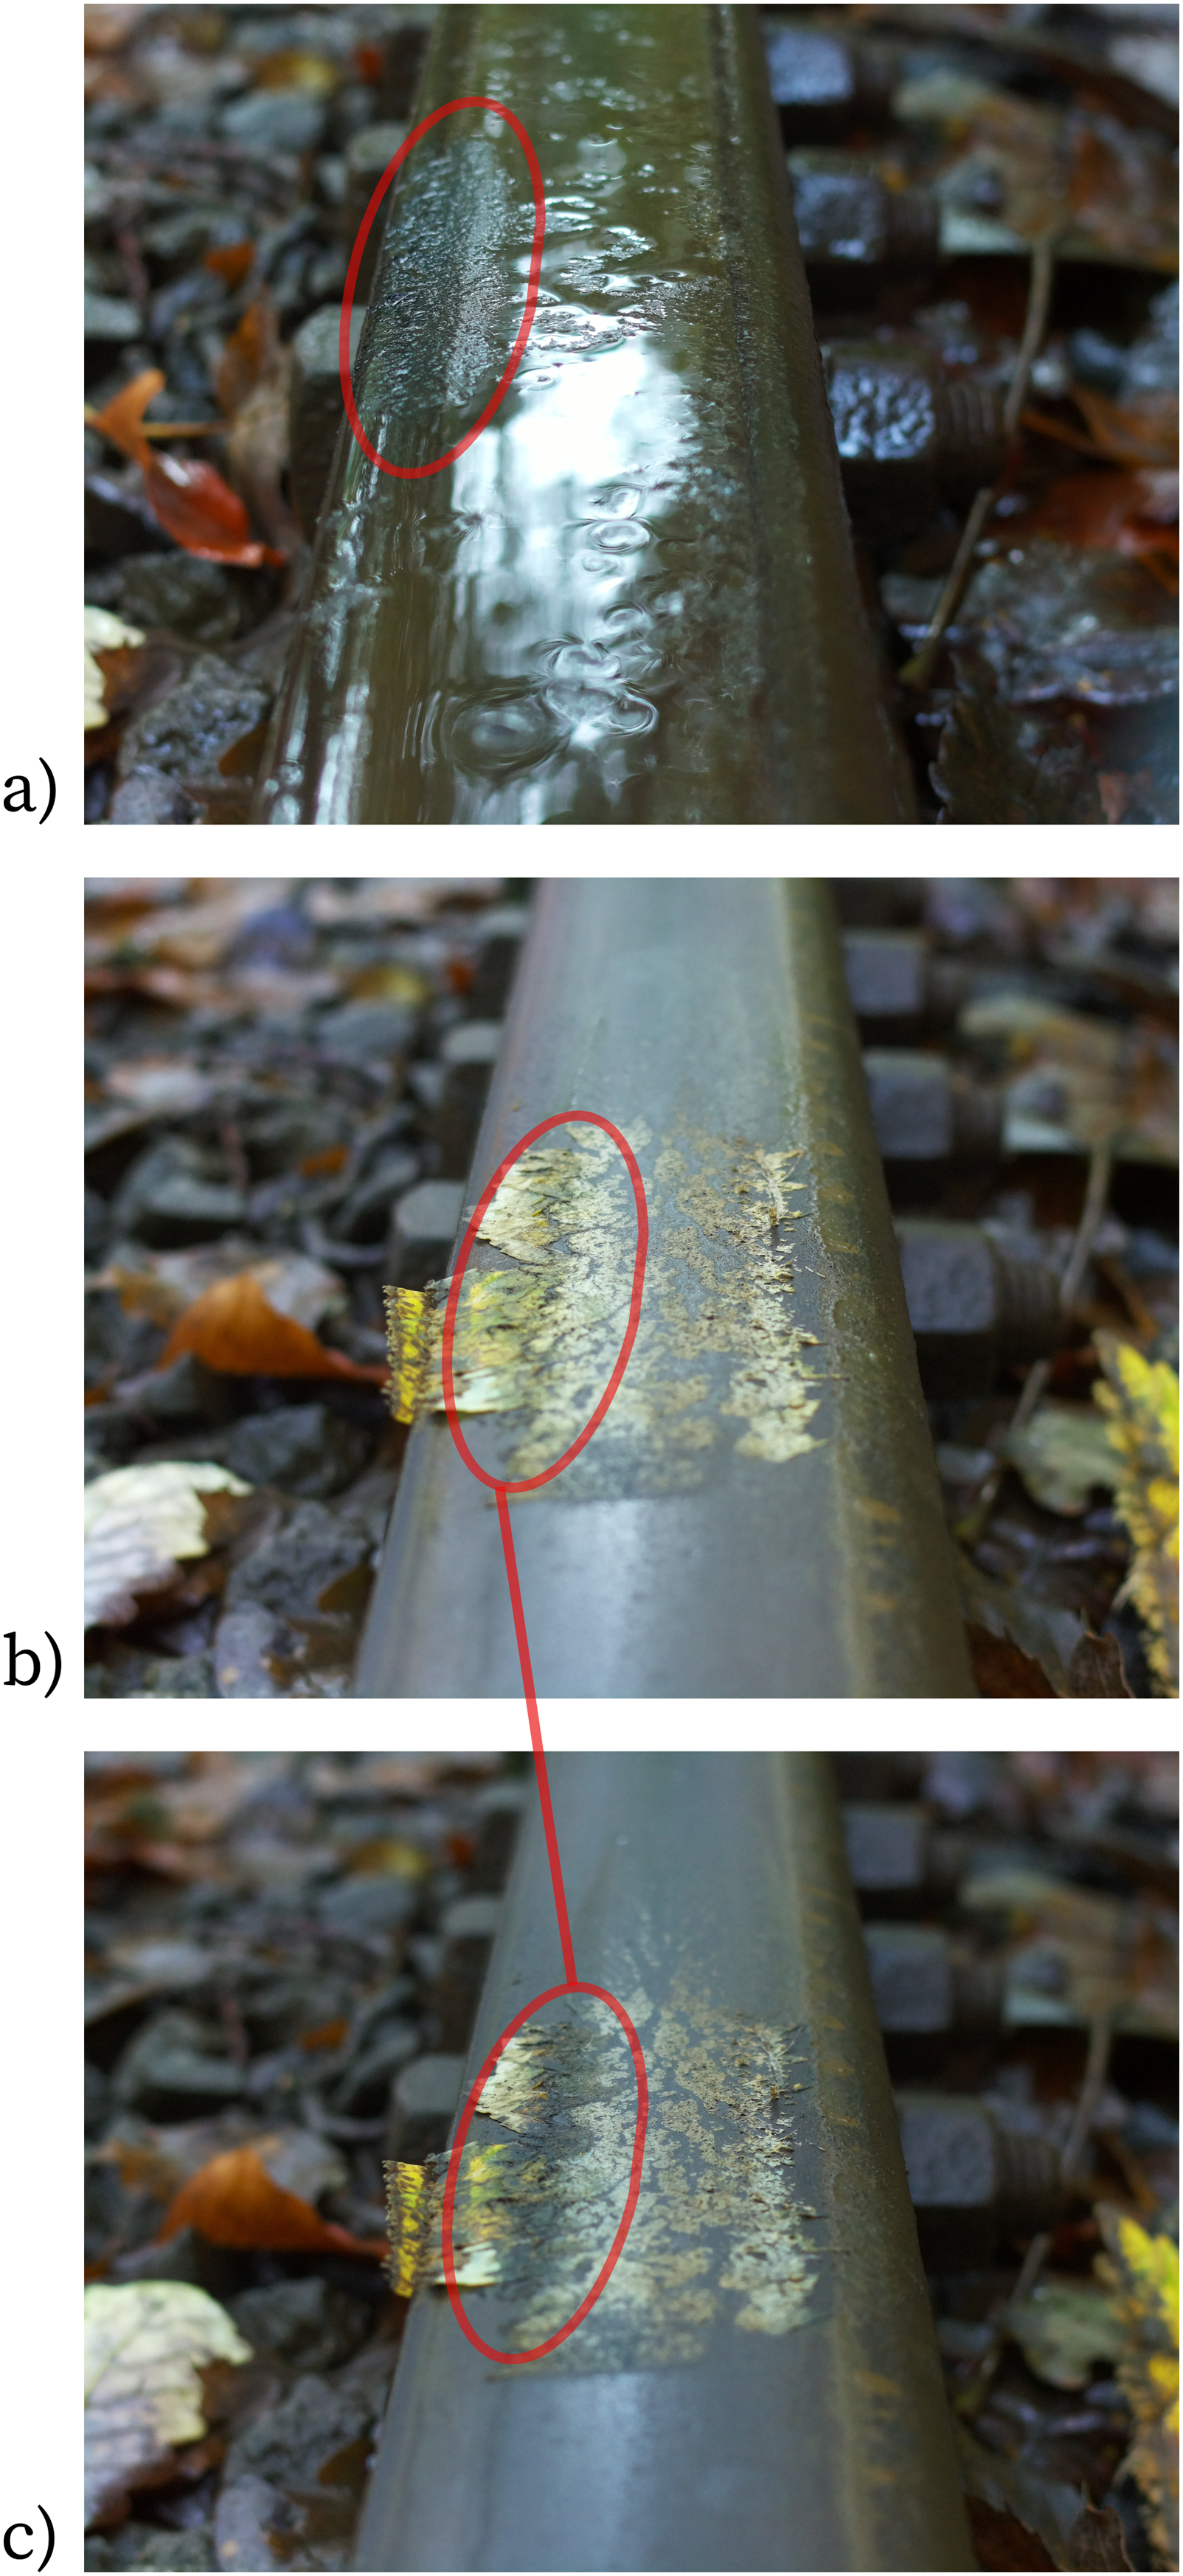
The leaf layers being tracked at the time of these images exhibited a standard level of moisture ∼25% despite the rail being visibly flooded.
The second observation was that on a dry rail with no rain, leaf layer discolouration (to black) occurred only in the moist areas of the crushed leaf (see Figure 5). In the space of 1 h and 5 min the only area with significant discoloration is the thicker, less crushed region of the leaf. The railhead at this time was extremely dry (9.7% WME) and other areas of leaf may have exhibited discoloration if they had been able to absorb moisture. Unfortunately, this leaf section did not remain overnight for further examination.
Axle passes
Layers only survived train passes on the second day of testing. This was likely due to limited rainfall. When the rails were flooded on other days, combined with newly formed layers which were not well bonded, layers were removed by train passage beyond the initial crushing onto the rail. The drying effect of axle passes seen in other testing
32
was seen visually (see Figure 6). Leaf layer observed degrading with axle passes.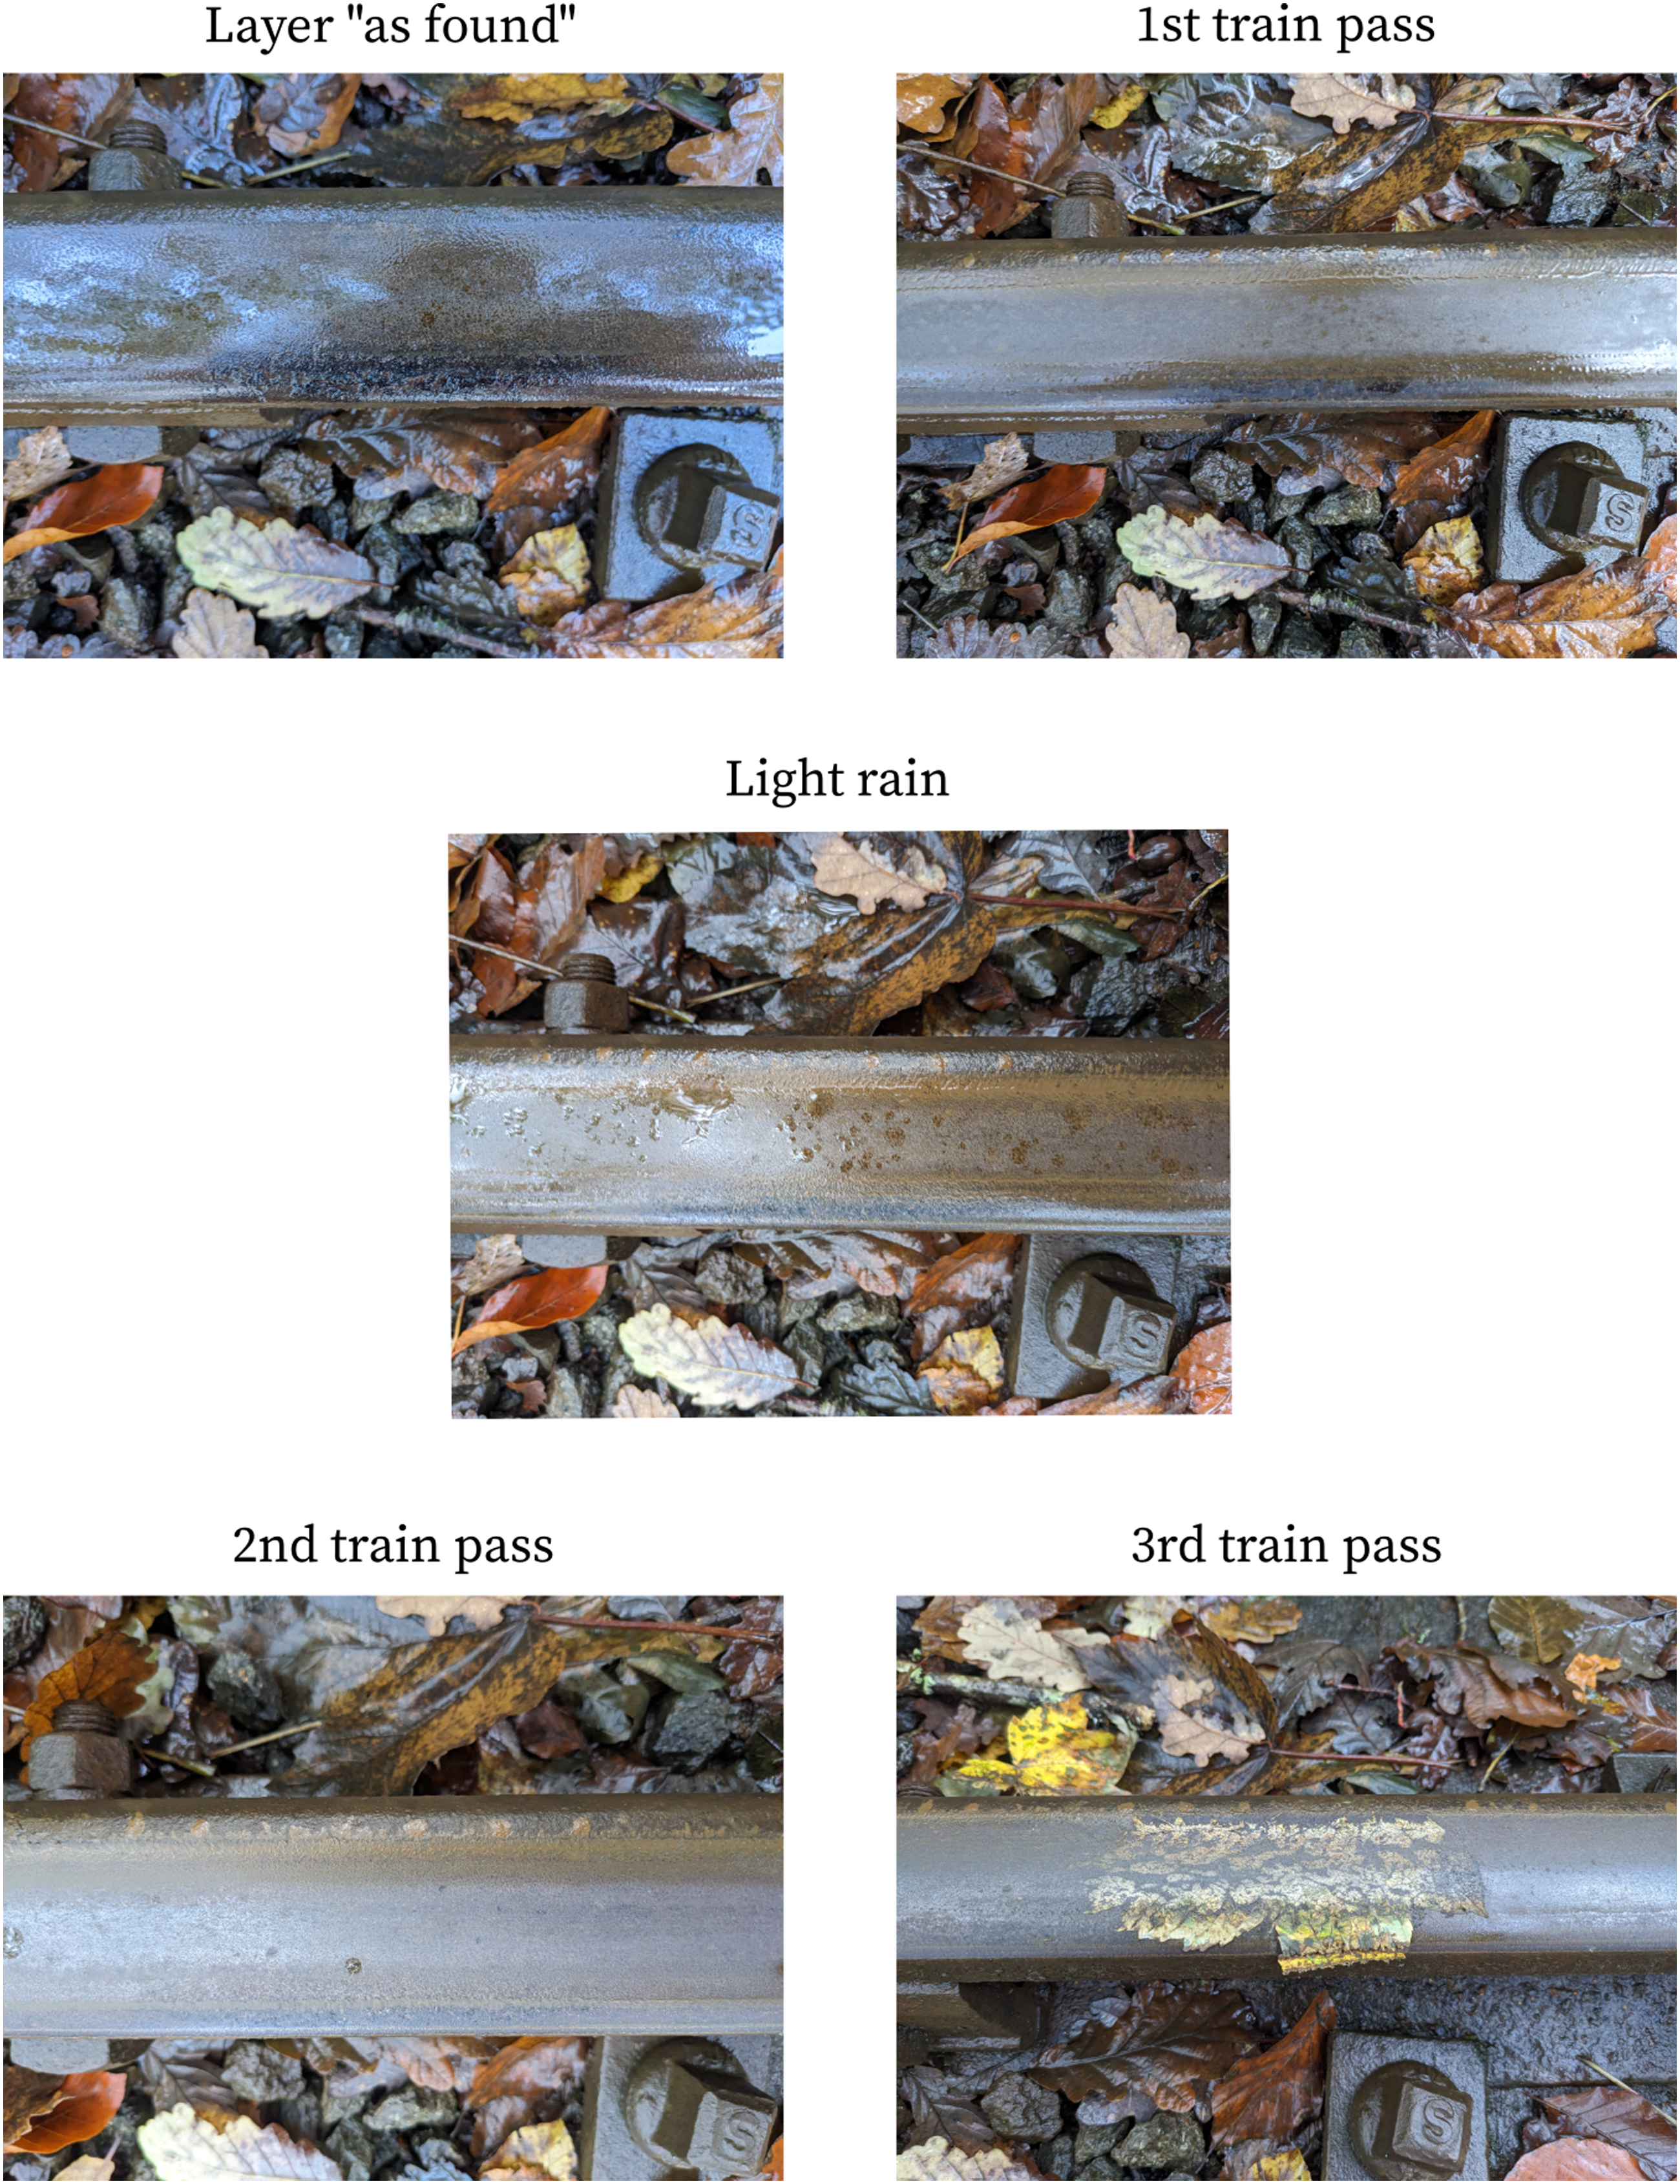
However, the changes in thickness and moisture observed in other testing were less apparent when measuring leaf layers on the railhead (see Figure 7). In leaf layer creation work32,33 layers start at the thickness of the applied material and then rapidly decrease to a more stable thickness that survives for a large number of axle passes. The layers at the VoR struggle to survive one train pass and the layers that did (1 and 6) were already well homogenised at the time of testing, and therefore the thickness 4-40 µm may have been the stable thickness seen in other testing. Capturing the initial material thickness in the field is extremely challenging as the leaves are often drawn into the contact patch as the train passes. The expected moisture trends were likely confounded by intermittent rainfall and the fact that layers began at a limited level of moisture. In layer creation testing, layers began at between 25 and 50% moisture, whereas these “as found” layers began below this level. There were little to no observable changes in CoT for the leaf layer after train passes. Train pass impact on leaf layers (train passes denoted by black line).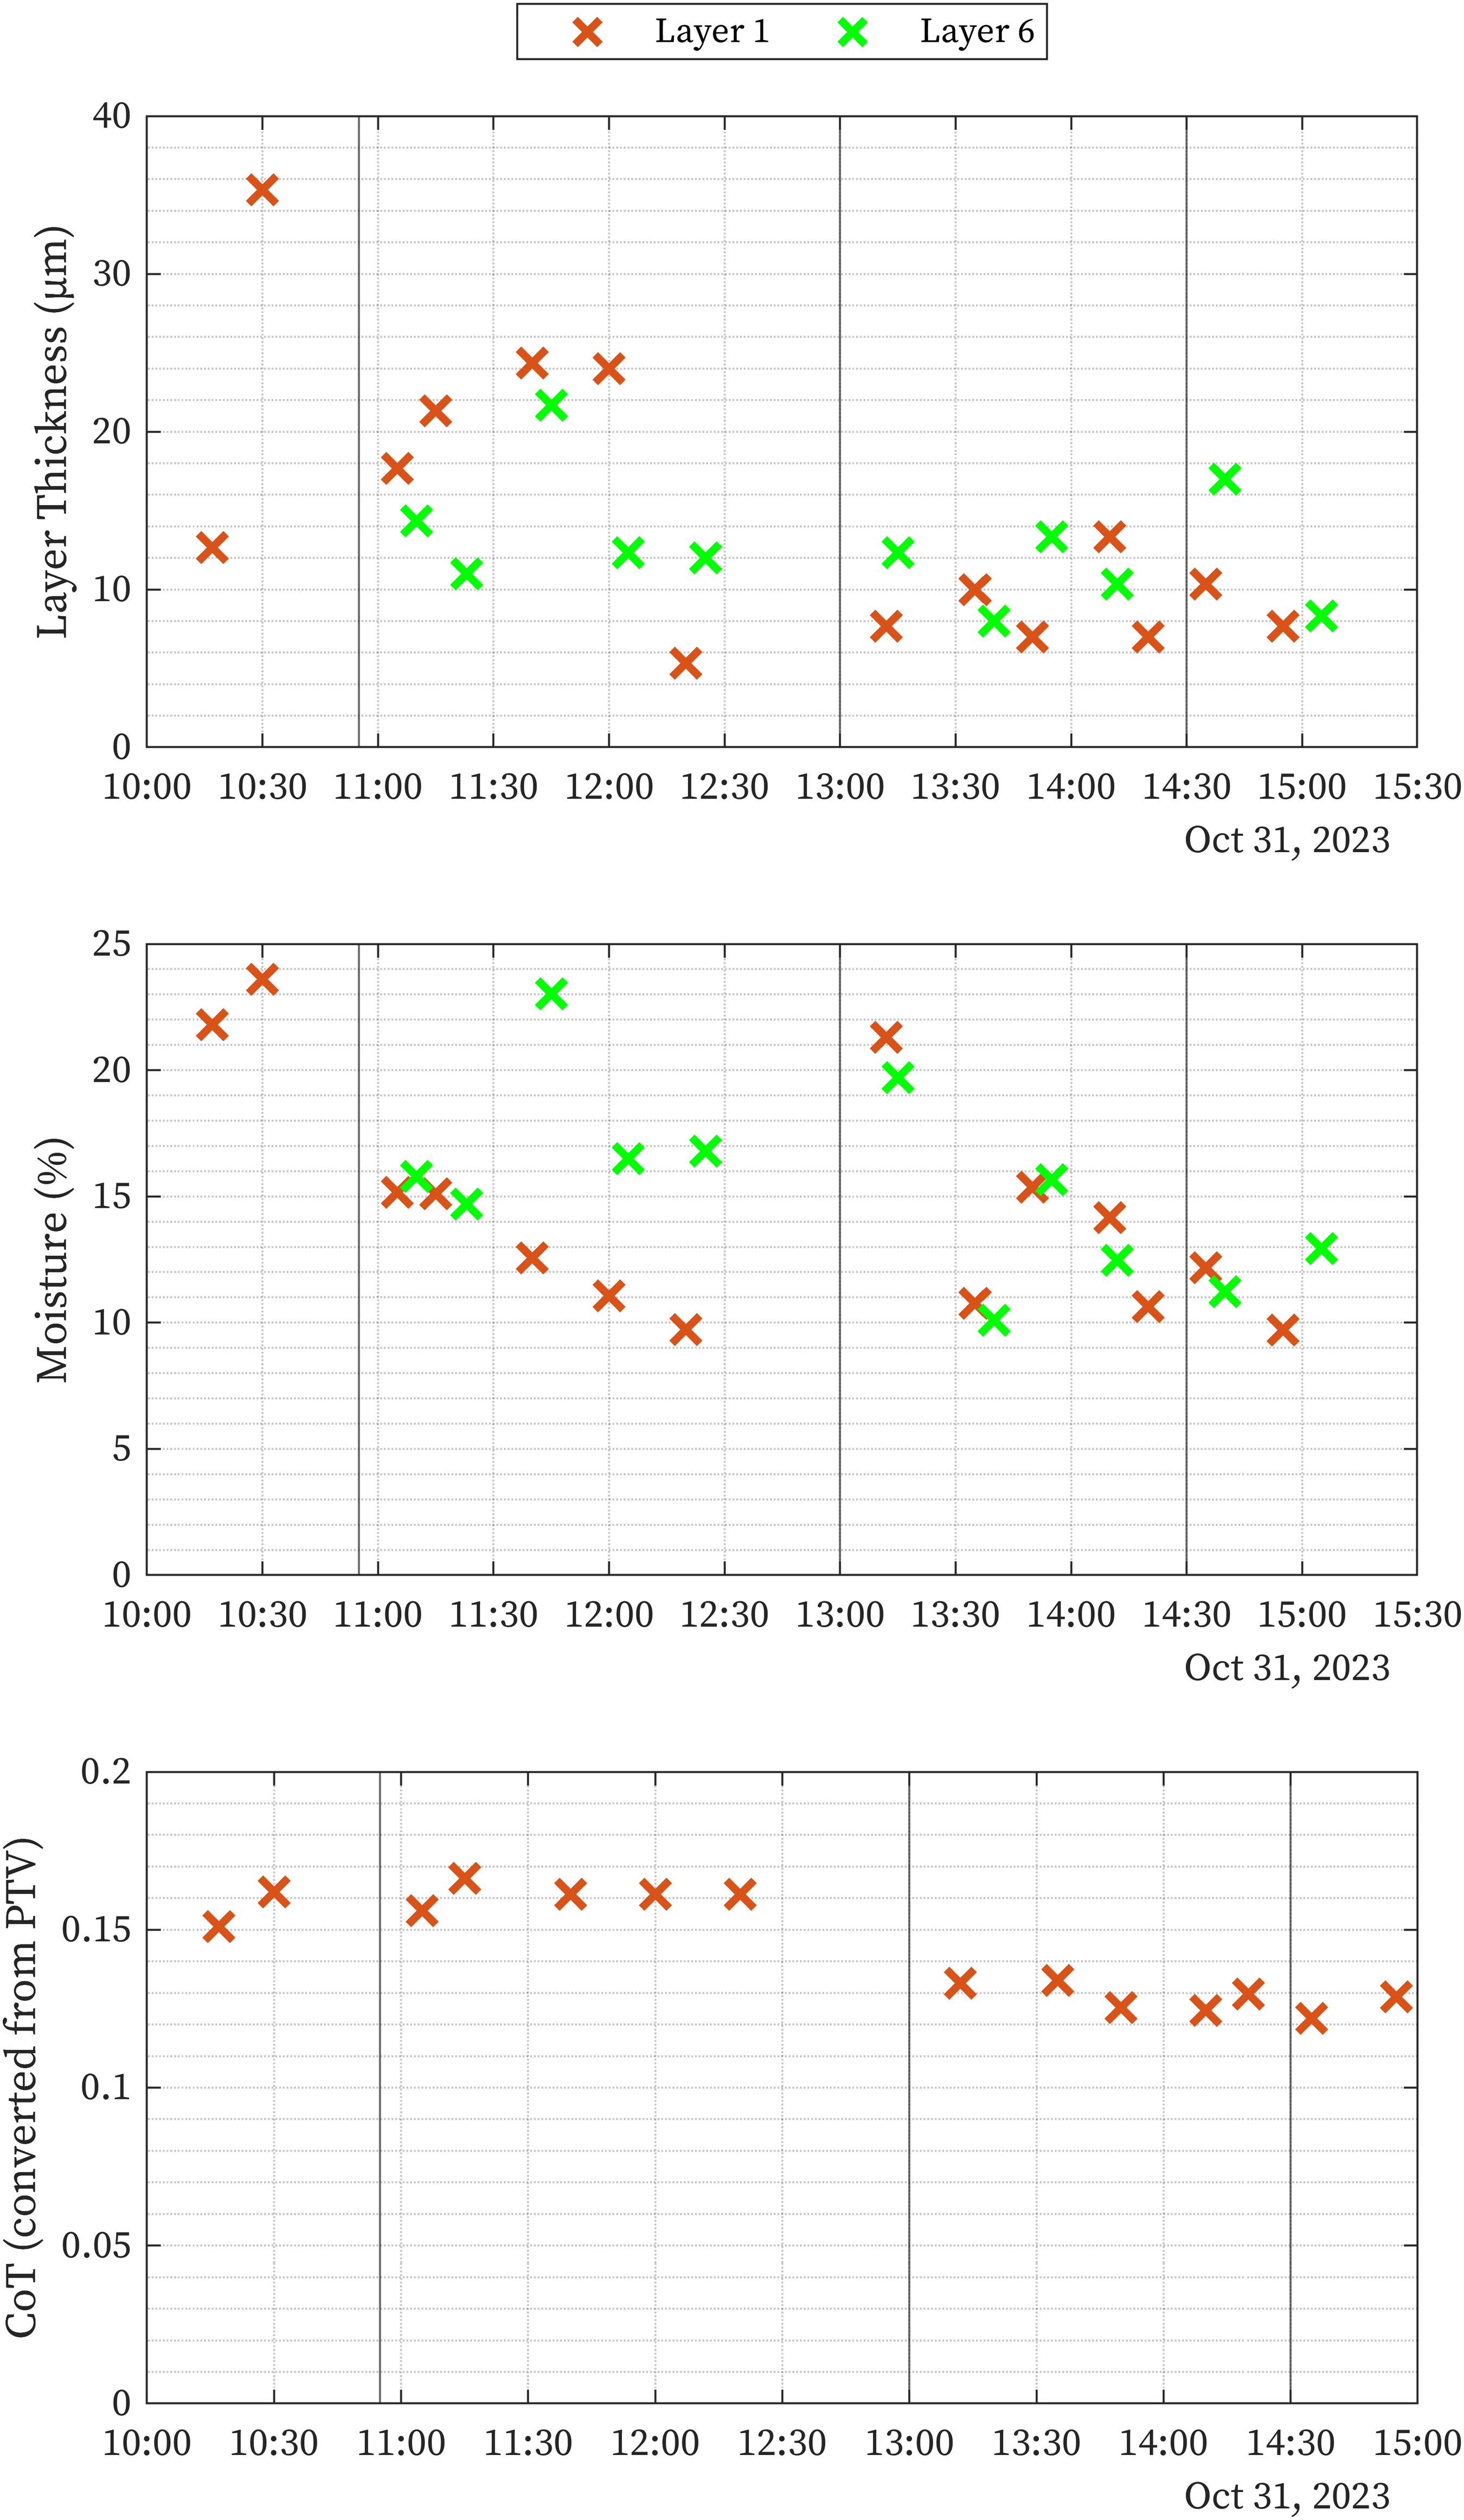
Friction testing
CoT was recorded against a variety of measures for the layers observed at the VoR low adhesion site.
The trend of layer thickness and CoT (Figure 8(a)) resembles a log function with CoT rapidly increasing as the layer thickness increases between 5 and 15 µm before reaching a stable level. However, no layers thicker than 35 µm were observed and so additional data is required to strengthen this assertion. (a) Layer thickness and variation in CoT for layers tested (b) layer moisture and variation in CoT for tested layers (c) relative humidity against CoT for layers tested d) relative humidity of local environment against against the moisture measured in layers.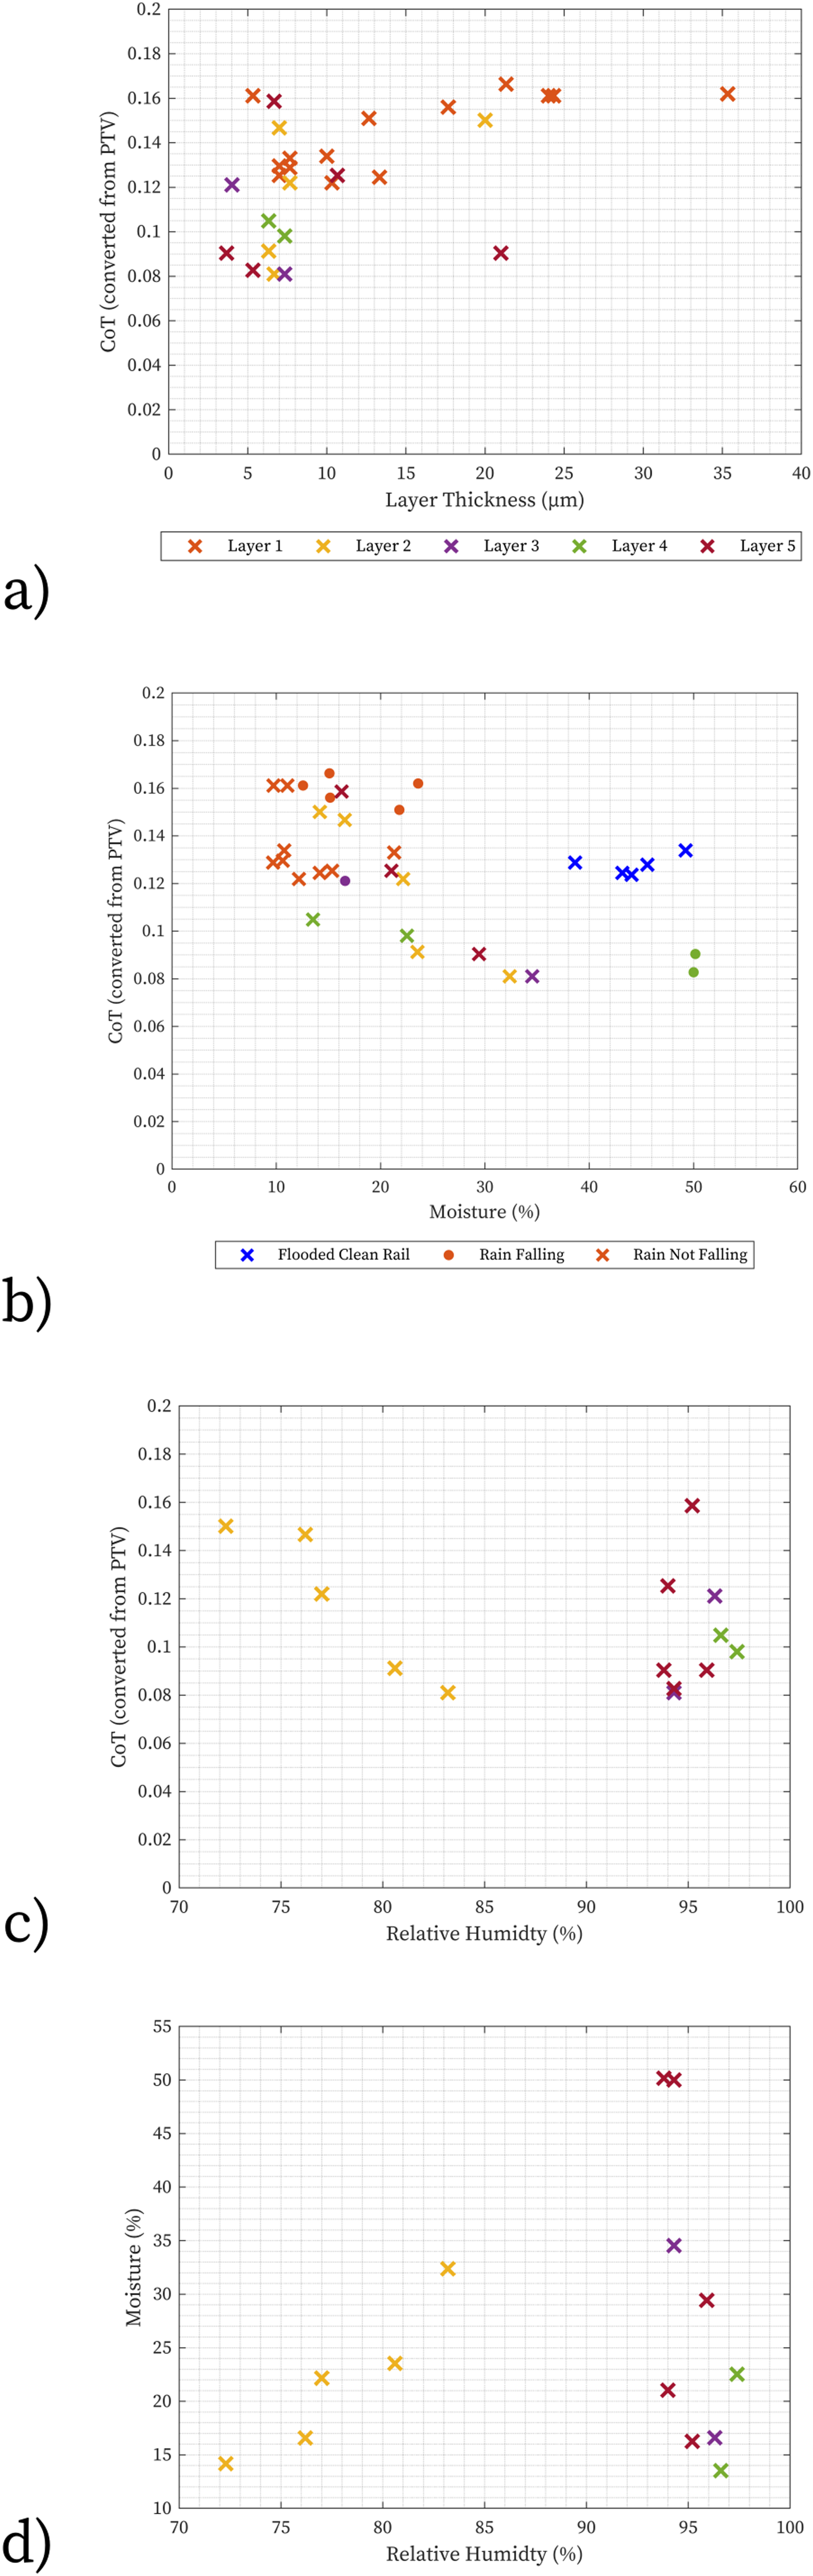
As moisture in in the layers increased the CoT reduced (see Figure 8(b)), this relationship (using linear regression) has an R2 = 0.4578. The linear regression relationship improves when the values for when rain was falling are removed to R2 = 0.5867. The blue values on Figure 8(b) are a reference reading taken at the test site for a cleaned, but flooded rail. There was no clear relationship between layer thickness and moisture in this testing. Moisture above 40% was recorded when the rail visually appeared flooded.
Due to the location and the weather, temperature was extremely stable at the site during testing (variation of 4°C) and no trends were observed related to change in air temperature unlike in testing with wider variation.11,12 Relative humidity at the site was hard to measure due to the heavy rain inundating measurement equipment. The valid relative humidity values are shown against CoT in Figure 8(c). One layer that existed for a significant time (through multiple wheel passes) and was tested at humidity <90% (“Layer 2”) follows the trend that has been observed for clean rails in the field 12 with CoT reducing as humidity increases (R2 = 0.8713 for a linear regression). No rain fell during the testing of this layer, and as the humidity reduced the layer also dried out (moisture dropping from 32% to 14%).
The moisture in this layer was well correlated with the reduction in humidity throughout the day (R2 = 0.8884), whereas the other layers (with associated humidities) were all measured during heavy rain (or extreme humidity before or after rain) where humidity was >90% and there was little relationship between RH and moisture in the layer (see Figure 8(d)).
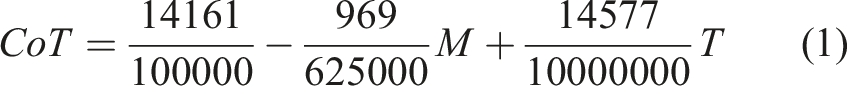
The results all traction measurements of the layers were compared with the moisture levels and layer thickness at the time of testing (shown in Figure 9). The field data was fitted using the linear regression into a general equation for traction based on directly measuring thickness and moisture on the layer (Equation (1)): Contour plot for regression relationship between moisture levels, layer thickness and CoT.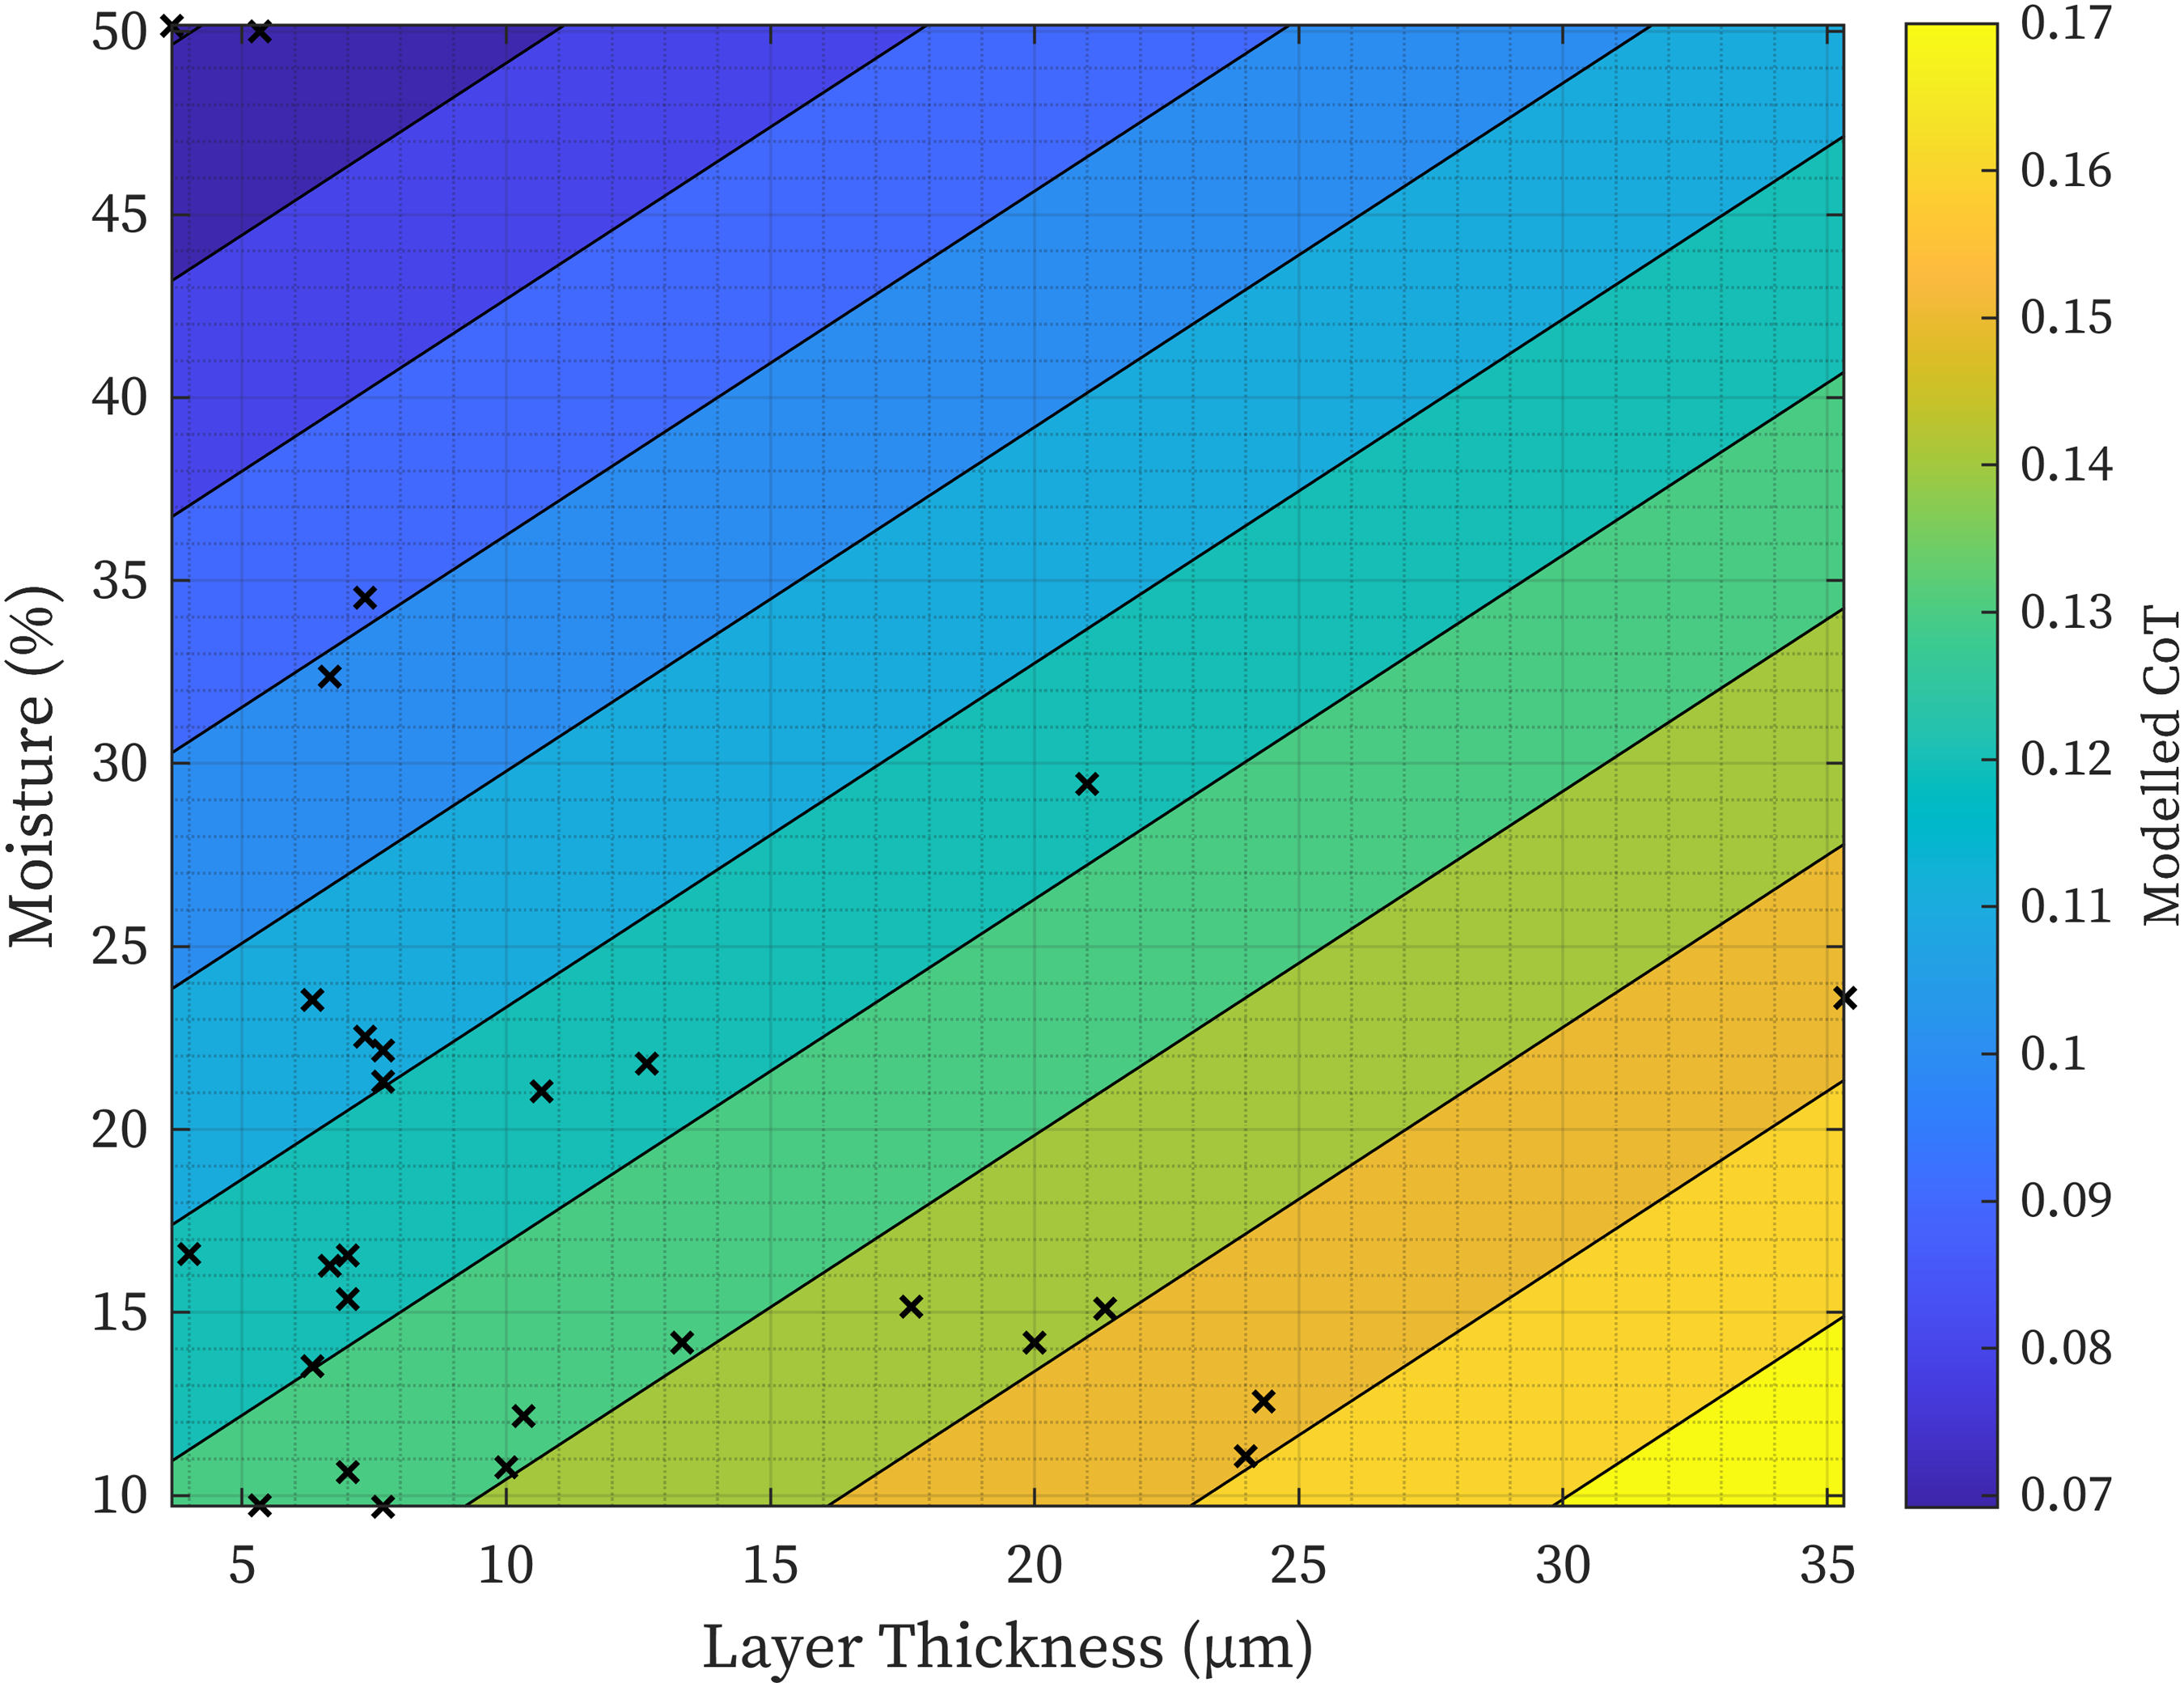
Chemical testing
FTIR spectroscopy analysis was completed on 3 separate leaf layers found around the VoR test site. The results and images of the railhead are shown in Figure 10. Samples were scanned as found and then dried with lint free paper as there was a significant amount of water on the railhead. The “as found” spectrum is excluded as it was dominated by the water signal. There is a clear difference between the cleaned railhead (“Rail” in Figure 10(a)) and the assumed leaf layers, with a strong spectral response demonstrating the presence of material with organic bonds. Even when patted dry the layers exhibited a ∼3600 cm−1 peak associated with the OH bonds in water, as the layers retain moisture. The peak at ∼1600 cm−1 is associated with an aromatic COO− bond and has been seen in other analysis of other organic (leaf) low adhesion layers.26,28 Sample 1 and 2 were then collected after the FTIR scanning for solid-state, carbon-13 NMR analysis and XPS. Dried layer FTIR spectra and photograph of analysed samples - (a) sample 1 (b) sample 2 (c) sample 3 (Layer 2 in the traction testing).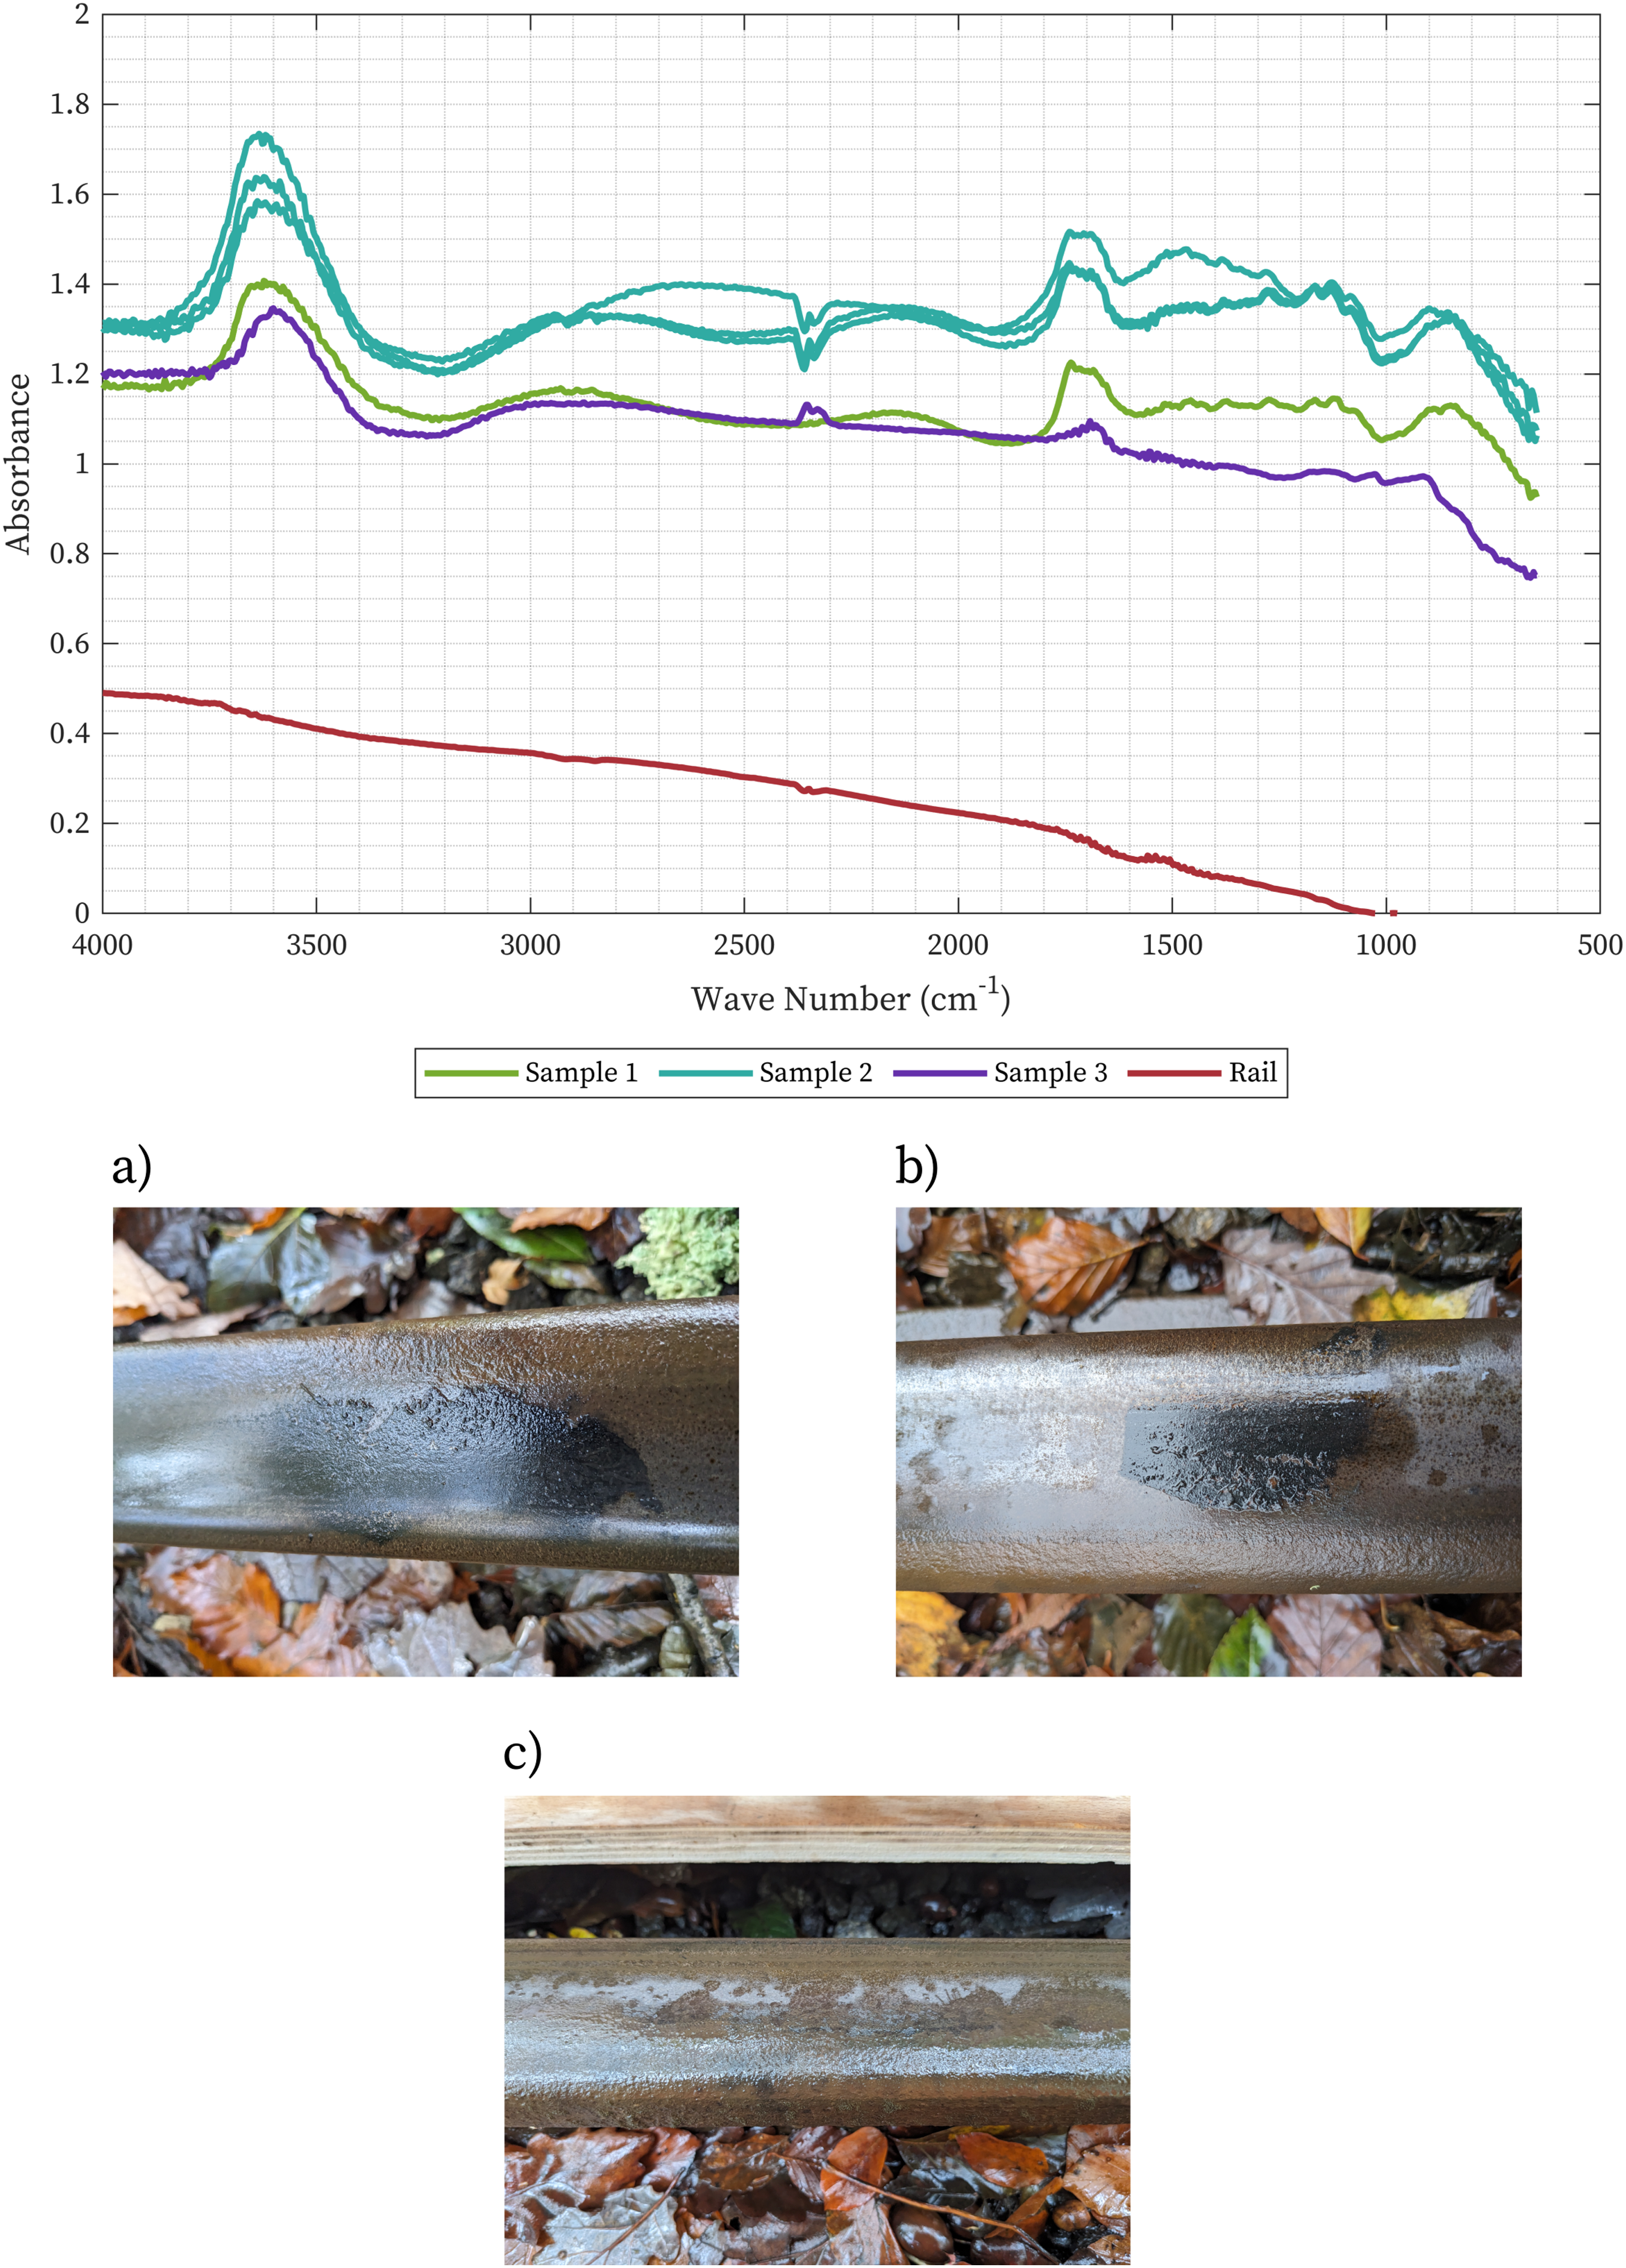
The NMR analysis was unable to resolve a satisfactory spectrum from the rail scraping sample. Created layers in previous testing had 200-450 ppm iron, 26 which was deemed low enough to attempt this technique. However, the rail surface at the VoR was likely significantly more oxidised than other testing sites and so the presence of more loose oxides in the sample may have interfered significantly with the process of resolution of the C13 solid state NMR. The nature of the field sample may also have meant it included a significant mass of non carbon material. Effective results from the NMR technique would have allowed for analysis of the carbon bonding in the leaf layer and facilitate comparison with the leaf material, providing further information about the transformation of leaves in to the bonded low adhesion leaf layer.
Surface composition (at%) determined from XPS high resolution scans.
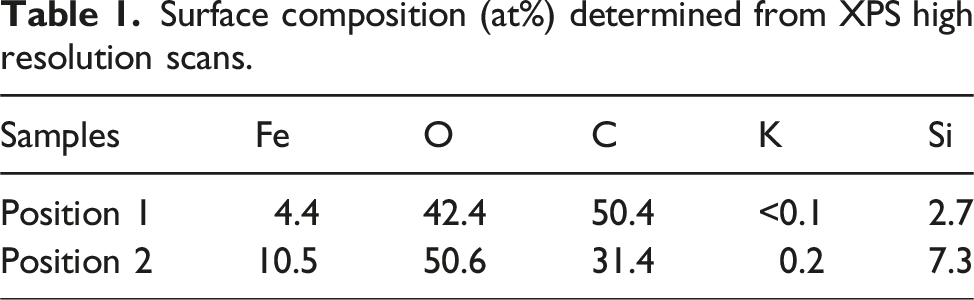
Large amounts of carbon and oxygen were detected in the sample suggesting that the sample is made up of organic material. The spectra for the high resolution scans are shown in Figure 11. High resolution XPS spectra for (a) Fe 2p (b) Fe 3p (c) O 1 (d) C 1 (e) Si 2p for the two positions in the sample.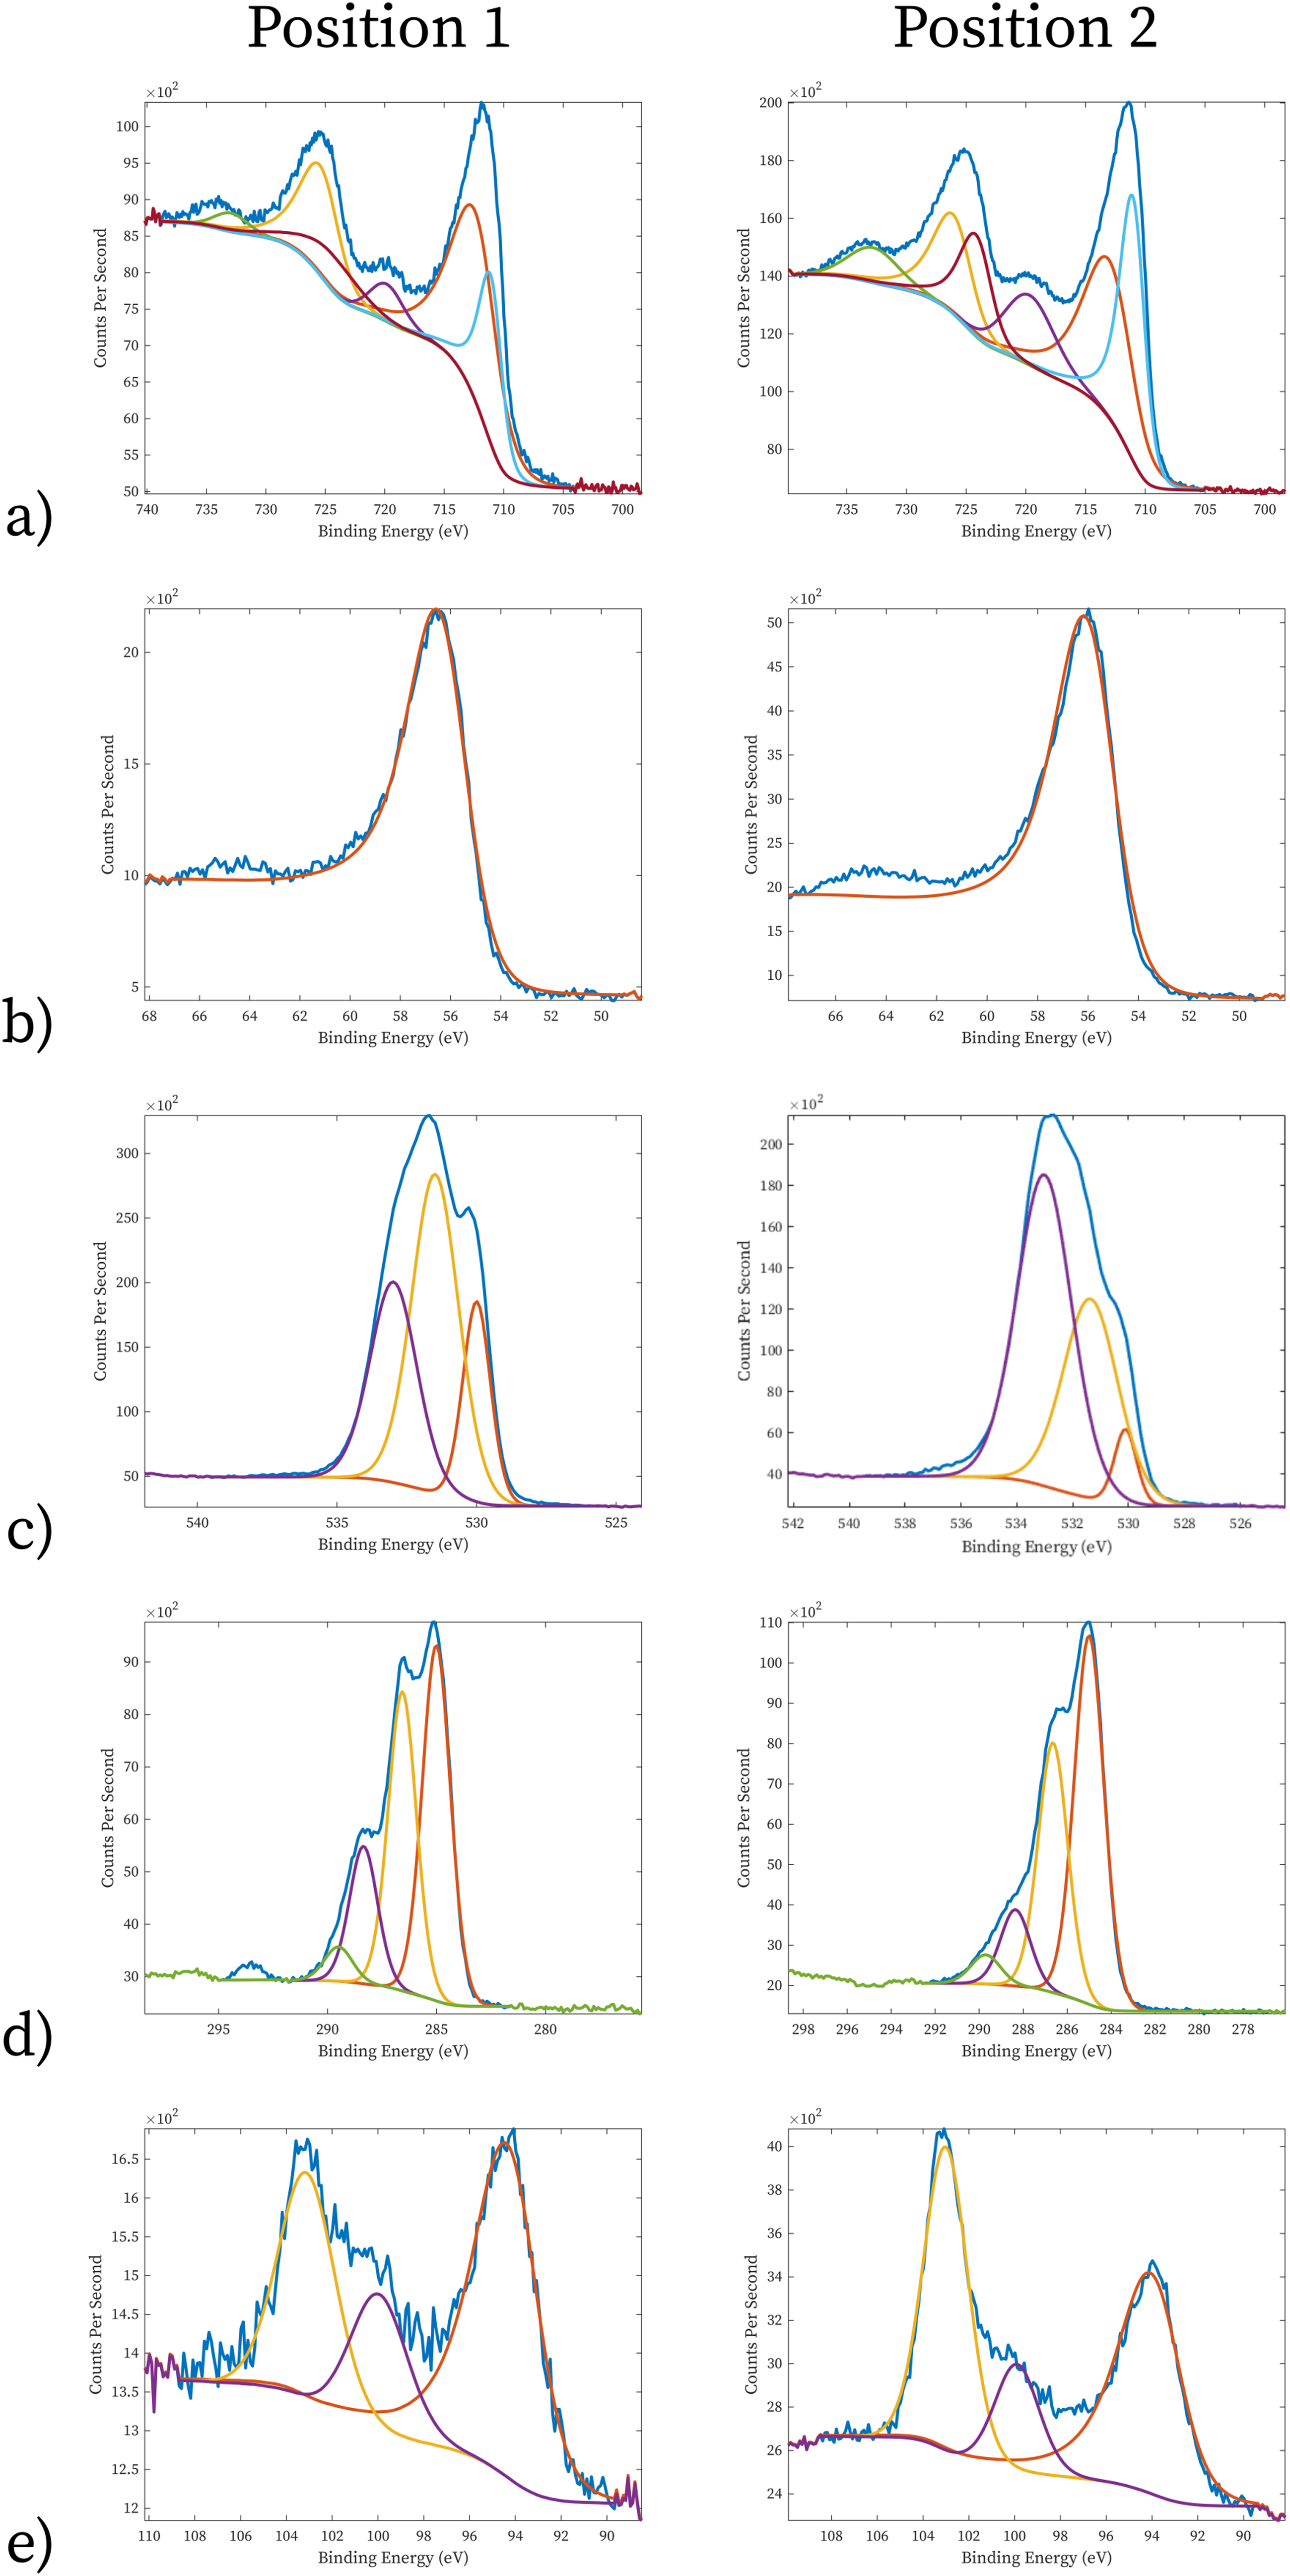
The pronounced peaks for the C spectra relate to C-C/C-H type carbons and the high proportion of C-O carbons aligns with the O1 data suggesting cellulose (or other biopolymers such as pectin or lignin) in the sample. A large proportion of the oxygen present is likely inorganic, appearing as oxides and hydroxides in the sample. The Fe fitting suggests Fe2O3 (iron (III) oxide) or potentially iron hydroxide. Silica is present and the analysis also suggests potentially bulk silicon, although this seems unlikely due to the samples and location.
Discussion
Despite the adverse weather conditions impacting the testing, novel observations about leaf layer initiation and the environmental impacts on layer friction were made. There has not been any direct observation of layer initiation conducted in the field before this work, and the effect of changing conditions on friction has not been analysed on found layers.
The range of layer thickness observed during this testing, 4-35 µm (mean 11.6 µm), was low when compared to some leaf layer surveys which were found to have thicknesses around 100 µm.4,14 The layers more closely matched layers that had had repeated axle passes measuring ≥35 µm 14 down to 4 µm. 34 This is likely due to there being extremely limited surveys on the leaf layer lifecycle in the field. The thicker layers were likely made up of multiple leaves, in the middle of the lifecycle, and then the thinner layers that have survived extensive axle passes are thinning and starting to degrade. The layers found here are thin, but at the early stages of formation with only had one or two train passes (except for Layer (2) before destruction through mechanical action or rain, as more leaves were not entering the contact patch and building up. Sycamore leaves vary in thickness between 100 and 200 µm, 35 but it is clear from laboratory testing that the significant change in layer thickness occurs during the first few axle passes. 33 Limited train passes gave less opportunity for more leaves to be drawn into the contact20,36 and for the layers to develop beyond the initial stages.
Hydrophobia and water take up
The hydrophobia observed in the time lapse imagery (Figure 5(a)) is a phenomenon that has not previously been observed in research on leaf low adhesion layers. This phenomenon may be due to the fact that these are early stage layers and so the leaf may not have been broken down and homogenised. The outer layer of leaves are made up of hydrophobic long chain hydrocarbons (epicuticular wax)37,38 which would resist water. The physical properties of the rain falling in large drops, rather than the fine mists or bulk water used in rig testing, may have also contributed. However, when the drops combined to be a bulk film on the railhead there was significant surface tension keeping the water on the flooded rail running onto the leaf layer. As previously stated there has been limited observation of layers in the field, and laboratory testing usually uses more homogeneous material (ground 39 and/or soaked leaves10,27) and so future testing should use freshly fallen leaves to be able to observe the hydrophobicity in controlled conditions.
Leaf layers are not completely hydrophobic, layers created in the laboratory 39 absorb water well when dry, and in this testing reached high moisture levels (≥50% WME). The hydrophobicity seen in the captured images highlights that there is a delay between high humidity/rainfall and water take up. The moisture of the layer when rainfall is not imminent or happening is well correlated with humidity (Figure 8(d)) and testing on a created leaf layer strengthens this assertion (see Appendix II). The relationship seen between moisture and RH in Layer 2 is due to the diurnal change in RH, with the change being slow and gradual as the air temperature rises. However, at the higher humidities due to rainfall there was a significant range (14%–50% WME) in moistures of the layer. This highlighting a potential delay in water take up when RH rapidly rises due to rainfall. Future work should ascertain the speed at which the layer takes up water from the air. During times in the day when dew forms this will likely be quick due to condensation forming on the rail, but during the day rail temperatures are likely to higher and condensation will not occur, slowing the rate of absorption. Although RH is a significant factor in adhesion of leaf contaminated surfaces,9,10,13 this is only as a proxy for the amount of water on the railhead/in the leaf layer. Past sensor testing has shown that high humidity alone does no correspond with a wetter railhead. 40 The dewpoint sensor used did not register a “wet rail” (a signal above 0V) during all of the high humidity periods. Therefore, future work on forecasting adhesion in leaf layers should focus on the moisture in the layer as the driver of change rather than RH variation on its own.
Layer formation and low adhesion mechanism
Layers observed in this testing were early stage. They were made up of single leaves that had fallen onto the rail and begun to bond, while surviving one or two train passes. Due to the weather and early stage of development, the material seemed less well bonded than other layers observed in the field. Evolution was limited by abundant rain water and infrequent train passage preventing further material being deposited on the rail. It seems as if the material needs to be constantly agitated from the lineside by train passes 41 for the layer to become more established in wet conditions, even if the train passages also degrades the material on the railhead at this early stage. Leaf layer formation occurs when there is a convergence of lots of factors (weather, trees and site geography), and so is generally unlikely to occur. Observations from this testing demonstrate that even in a high risk area, with the “problem” trees and adverse geography, weather conditions prevent leaf layers from developing beyond early stage “seeding”. The limited field surveys on leaf layers have observed some developed layers.4,14,34 These were made up of multiple leaves that have survived repeated train passes, and potentially many days and nights. Scaled testing on the lifecycle of leaf layers 13 has been completed, but the testing was completed with the layer experiencing 13-14 axle passes per minute. The layer development at the VoR was a more static situation, with much more available water and less axle passes.
Water appears extremely important for the chemical reactions that lead to leaf breakdown and to the characteristic black colouration as well as bonding to the rail. The time lapse imagery (see Figure 5(b) and (c)) showed the black coloration only appearing on the moist part of the rail. Static images of leaves that have fallen onto the rail show black colouration and degradation where the leaves have been broken and crushed, bypassing the outer cuticle layers of the leaves. Water allows the soluble iron oxides from the railhead to move freely and interact with the leaf material. The presence of water also provides a source of oxygen for further iron oxide formation. Iron oxides are an important to low adhesion layer formation6,27,42 and the captured video demonstrates that the presence of moisture is important for the oxides to move freely.
Traction
In this testing there was no strong relationship between layer thickness and CoT of the layer as a single measure. The layers in the testing were thin compared to other UK rail surveys,4,14 but past work has also found no correlation between layer thickness and railhead friction. 14
Shear strength of (created) layers is inversely proportional to moisture content 43 and this aligns with the moisture-CoT relationship found in this testing, with CoT being inversely proportional to moisture levels in the layers. This finding supports the suggested shearing based mechanism for low adhesion.6,13,44,45 The layers in this testing were assessed across a range of moisture levels, and the relationship between CoT and moisture appears linear, CoT dropping as moisture in the layer increases. This is the first time that layer moisture and CoT have been tracked for a naturally occurring layer, making it harder to compare with other data sets where moisture was not tracked. However, in this testing and the supplemental work (Appendix II) when rain is not falling moisture and RH have a positive correlation, and so the trends can be compared with RH standing in for moisture. The reduction in CoT as the layer moistens (with increasing RH or rainfall) is reflected in other surveys contaminated 12 rails. Leaf low adhesion incident timing 27 on national rail also peaks when humidity is highest across the day. Oxide caused low adhesion (“wet rail” 46 ) does not have a linear relationship between presence of water in the layer and the low friction. Instead, low adhesion occurs in a small window of water volume.47,48 However, this was not the case for the low friction layers at the VoR where it was a linear relationship, and a more moist layer had lower traction. Further, potentially rheological, testing could help to strengthen assertions about the moisture content of leaf layers and low adhesion conditions.
Limited relative humidity (RH) data was collected due to adverse conditions. The relationship seen between RH and CoT (in Layer (2) follows the expected pattern with reducing CoT as RH increases. The limited RH levels meant that it was not possible to observe if there is a discontinuity in the linear relationship between CoT and RH at lower RH as seen in scaled testing. 10
Combining moisture and layer thickness provided a stronger regression relationship to CoT compared to either individually (see Equation (1)). This relationship is weaker than rig based testing on leaf contamination 10 but stronger than field testing on clean rails 11 (both looking at CoT changes due to relative humidity and air temperature). If this model can be validated through expansion, potentially using full scale testing, 39 then it would be a useful tool as a proxy for adhesion using two directly measured values. As stated previous testing found no link between the thickness of a layer and the CoT, but if further research validates the relationship seen in this field survey this will help to develop the understanding of the low adhesion mechanism for leaf layers. It may be that thinner layers create lower friction when taking into account the moisture level of each layer (a measure not assessed in the last survey that tracked friction and layer thickness 14 ).
The leaf contamination observed in this testing was early stage. Even at this early stage, and in a transient state (easily removed by rain or wheel passage) it caused dangerous levels of friction, below the level required for safe breaking and traction. The observations from this testing showed that early stage leaf contamination could act like “wet-rail” – creating low friction (when wet) but also being destroyed by the passage of a train that experienced the low friction. 5 The initial material deposition can therefore create low friction in specific conditions or “seed” and begin the build up of more visible and well bonded layers seen in other testing.
Layer chemistry
The in situ FTIR analysis of the layers “as found” was dominated by the water in and on the layers, with a strong peak ∼3600 cm−1 for the O-H bond. The wet layers were similar to others recorded from the field, 39 due to both having extremely high water content. The layers, when dried, are similar to those created using the full-scale wheel/rail HAROLD rig. 39 These laboratory based layers had been subjected to 150 axle passes with a wheel load of 57 kN, very different formation conditions to the layers at the VoR layers. The VoR layers were wet and exposed to the elements (UV radiation and oxygen in the air) for a long period, but still demonstrated a similar chemical change to the high axel pass layers. Leaf material therefore might not require a certain number of axle passes to become a low adhesion layer, there may be an alternative route where with high moisture levels and longer exposure times breakdown the leaves and the limited axle passes prevent the degradation and removal of the material.
The XPS analysis of the sample has a similar ratio of elements to that of a leaf layer on a branch line on the national rail network 49 compared to a created leaf layer. As highlighted by Lanigan et al. 49 the raised oxygen is likely due to the length of time that the layers are exposed to the atmosphere compared to created layers that experience a high number of traction events, but limited time on the rail. The national rail branch line where the comparison sample is from is a highly wooded area, with limited traffic is similar to the VoR location. This chemical analysis shows demonstrates that the layers tested at the VoR are, at least, chemically similar to low adhesion layers found on standard rail and not something specific to this narrow gauge rail.
The presence of iron oxide in the leaf layer aligns with the other tests of the mainline26,49 and the raised iron (oxide) levels compared to more “mainline” rail 26 is likely due to the low traffic volume on the line meaning limited axle passes and long time on the rail in wet conditions. Lanigan et al. 26 found that the iron ppm increased significantly in a “full formed film”. The presence of a biopolymer (such as cellulose) confirms the testing completed on created layers. 26 These materials are still present in the leaf layers when visually they have transitioned from leaf materials into the homogeneous, black leaf layer in naturally occurring conditions. The cellulose in the leaf layer may also explain the ability to absorb high levels water, as discussed in the section on the observed hydrophobicity. Cellulose has significant hydrogen bond networks 50 increasing the wettability of the material.
The NMR data was unable to be resolved, likely due to high Fe (and oxide content), although no information can be drawn directly this is additional evidence that there is significant interaction between the organic material in the rail and the iron (and oxides) from the railhead in the formation of the low adhesion leaf layers. 26 Future work will analyse leaf layers created using a full-scale rig at the University of Sheffield 39 where there is more control over the conditions, and the level of loose iron oxides collected when sampling could be reduced.
Conclusions
Using a variety of field testing and chemical techniques, formation of naturally occurring leaf layers on a narrow gauge railway was assessed. Friction in the layers was surveyed as environmental conditions changed, and the layers were observed through photography and chemical techniques. One of the layers documented did experience multiple train passes, but the impact of this action was challenging to draw out due to other conditions. Previously published articles have assessed leaf layers in changing conditions, but these were created layers in scaled rigs, rather than naturally occurring layers on a railhead. The observation of layers occurring naturally allowed for a range of novel findings.
Low adhesion conditions (<0.1) were observed in the layers. The main findings of the study are: ⁃ Leaf discoloration (and layer formation) occurs from broken sections of the leaf and water appears to be an important factor in layer development. A layer appeared hydrophobic in heavy rain, this may have been due to limited axle passes (and lack of homogenisation) ⁃ The early stage (“seeding”) leaf layers still exhibited low adhesion without the some of the characteristics seen in other layer surveys (e.g. strong bonding to railhead) ⁃ Elevated moisture in the layer led to the lowest adhesion, in a linear relationship. Relative humidity is a good proxy for moisture in the layer, and therefore increasing humidity leads to reducing adhesion in the layer (when there are no other water mechanisms such as rain). A model for traction based on moisture and layer thickness was demonstrated ⁃ Iron oxide was heavily present in the low adhesion leaf layers, and biopolymers (such as cellulose) were also detected in the layers.
Future work should observe layers in a wider range of temperatures and at lower humidities when rain has less of an impact. Where possible testing on mainline rail of a similar nature would help to strengthen the assertions made. Laboratory based testing to gather more data on the moisture, layer thickness and traction relationship will be conducted. Additionally, testing to model the changes in layer moisture due to rainfall will complement the humidity to moisture testing conducted.
Footnotes
Acknowledgements
The authors appreciate the access granted by the Vale of Rheidol Railway. The authors appreciate the contribution of the Railway Safety and Standard Board (RSSB) towards this research through the COF-UOS-06 project and the EPSRC Programme Grant “Friction: The Tribology Enigma” (EP/R001766/1). For the purpose of open access, the author has applied a Creative Commons Attribution (CC BY) license to any Author Accepted Manuscript version arising
Declaration of conflicting interests
The author(s) declared no potential conflicts of interest with respect to the research, authorship, and/or publication of this article.
Funding
The author(s) received no financial support for the research, authorship, and/or publication of this article.