
Abstract
There are two options for testing the performance of rail vehicles and the application of material to the wheel/rail interface to influence friction, and therefore braking performance, in a low adhesion environment: laboratory work which is not representative of conditions in the field, and expensive track tests using fully instrumented modern vehicles largely using low adhesion simulants that are not representative of those that occur in the real world and usually applied over great lengths of track. This paper presents a third option: low-cost track tests. We determined the minimum of equipment and resources needed to produce low adhesion using a method more representative on Autumn conditions on rail and monitor the performance of rail vehicles when braking on it. This was mainly targeted at use for testing products applied to the wheel/rail interface to enhance traction, hence the need for real low adhesion causes. We present the methodology that we have developed, and some initial results showing that using it we can generate a low adhesion scenario when braking from 10 mph. This can be used to develop mitigation solutions for low adhesion in a more cost effective manner.
Introduction
A long-term challenge for the rail industry is that of low adhesion at the wheel/rail interface. This is caused by the presence of a third-body layer between the wheel and the rail that does not support high shear stresses. This can be formed from a variety of contaminants, including leaves, dust, and oxides of the rail.1–3 In certain circumstances, typically involving small quantities of water, such contaminants can reduce the braking performance of trains. There are obvious safety concerns if trains cannot stop when required, so once low adhesion is identified, more conservative braking and acceleration may be introduced along with timetable changes. This then has a large impact on both train operation and the associated customer experience. In the worst scenario, low adhesion can cause trains to pass a signal set to ‘danger’ (a SPAD), or overrun a station.
Currently, there are several test methods for assessing low adhesion mechanisms and the performance of products applied to the wheel/rail interface to overcome them using small-scale, laboratory based test-rigs. This testing is very useful for furthering the understanding of fundamental mechanisms occurring in the wheel/rail interface. However, some aspects of this type of testing do not accurately reflect the full-scale application. One test approach used frequently is the twin disc type machine. 4 With this system, a wheel material and rail steel disc are placed in contact with each other, with conditions designed to match the wheel/rail interface (such as contact pressure and creepage). It has been established, however, that twin disc machines do not allow for the heat dissipation that would occur as a locomotive continues normal travel down the track and the twin disc surfaces are constantly recycling over each other. 5 The small contact also leads to scaling problems with some of the applied products, particularly those involving particles. Full-scale rigs are another common method used in railway tribology. These more-accurately model certain aspects of full-scale behaviour; both components are fully representative of the application. However, the limitation of running at much lower speeds (in, for example, the linear style rigs) and to a limited distance, cannot be mitigated. Employing a much lower speed could affect braking predictions; some such test rigs are limited to speeds of 1 m/s. 6 Despite some factors being absent during laboratory testing, the results typically found in academic literature are in-line with those found in the real application.5,7 Therefore, although laboratory testing is not a perfect model, it is still highly useful for this type of research and can provide an initial filtering approach for emerging solutions to low adhesion. In the field devices such as s push tribometer are used for measuring rail head friction. 8 However, this type of testing comes with its own set of limitations and associated measurement errors. 9 The tribometer is only measuring friction between the contacting wheel and the rail and this is not representative of a wheel passing down the track. It also has the same problems dealing with the addition of friction enhancing products as a small scale laboratory test.
To ensure confidence in technology under development, the railway industry requires full-scale field tests in representative conditions before proceeding with the implementation of new technology. The current brake test standard suggests three possible methods to treat the rail for assessing the performance of brakes under very low adhesion conditions (friction less than 0.05): 10 liquid soap solution, wet Kraft paper tape, and colza (rapeseed) oil. 11 For low adhesion (friction between 0.05 and 0.1) water sprays, possibly containing varying concentrations of detergents are recommended. The standard that specifies the minimum criteria for system acceptance/type approval of new wheel slide protection (WSP) systems only specifies the application of soapy water as a low adhesion simulant, although a range of ‘real world’ lubricants are suggested to be used for producing test data for a hardware-in-the-loop simulator. 11
For assessing mitigation methods that involve application of material to the wheel/rail interface, it is important that the conditions that result in low adhesion are representative of real-world low adhesion conditions. Field brake tests are also typically very expensive and time consuming to arrange and carry out. There is a need for a simpler, cheaper approach that can be used for filtering of solutions prior to more representative testing. The aim of this work was to develop an easy to implement methodology that produces a realistic low adhesion simulation using a vehicle fitted with highly sensitive measuring devices.
Methodology
Test site
A lower-cost track test requires that the minimum of equipment be used. A small test loop at the Quinton Rail Technology Centre (QRTC) at Long Marston in the UK was identified for the trials. Access to a Class 117 DMU was arranged (see Figure 1(b) and Table 1 for full details), which was adapted to provide sufficient data capture. For these tests only one car of the DMU was used, as such it will be referred to as ‘the vehicle’ to prevent misunderstandings. The track at QRTC is a 2.4 km loop with a 300 m straight where the vehicle can get up to a maximum speed of 25 mph. The track on the straight is representative of that seen in the UK mainline (see Figure 1(a)). A loop is preferable as a problem with linear track is the need to move the train backwards over the low adhesion layer in between tests. Looping around the track, as opposed to reversing the vehicle, was the best methodology in order to not disrupt the leaf layers once created. One drawback to this is that the whole testing process was very time consuming. Laying down the low adhesion layer and the testing that followed this meant that on average 10 vehicle braking ‘loops’ or ‘passes’ were achieved in a day.
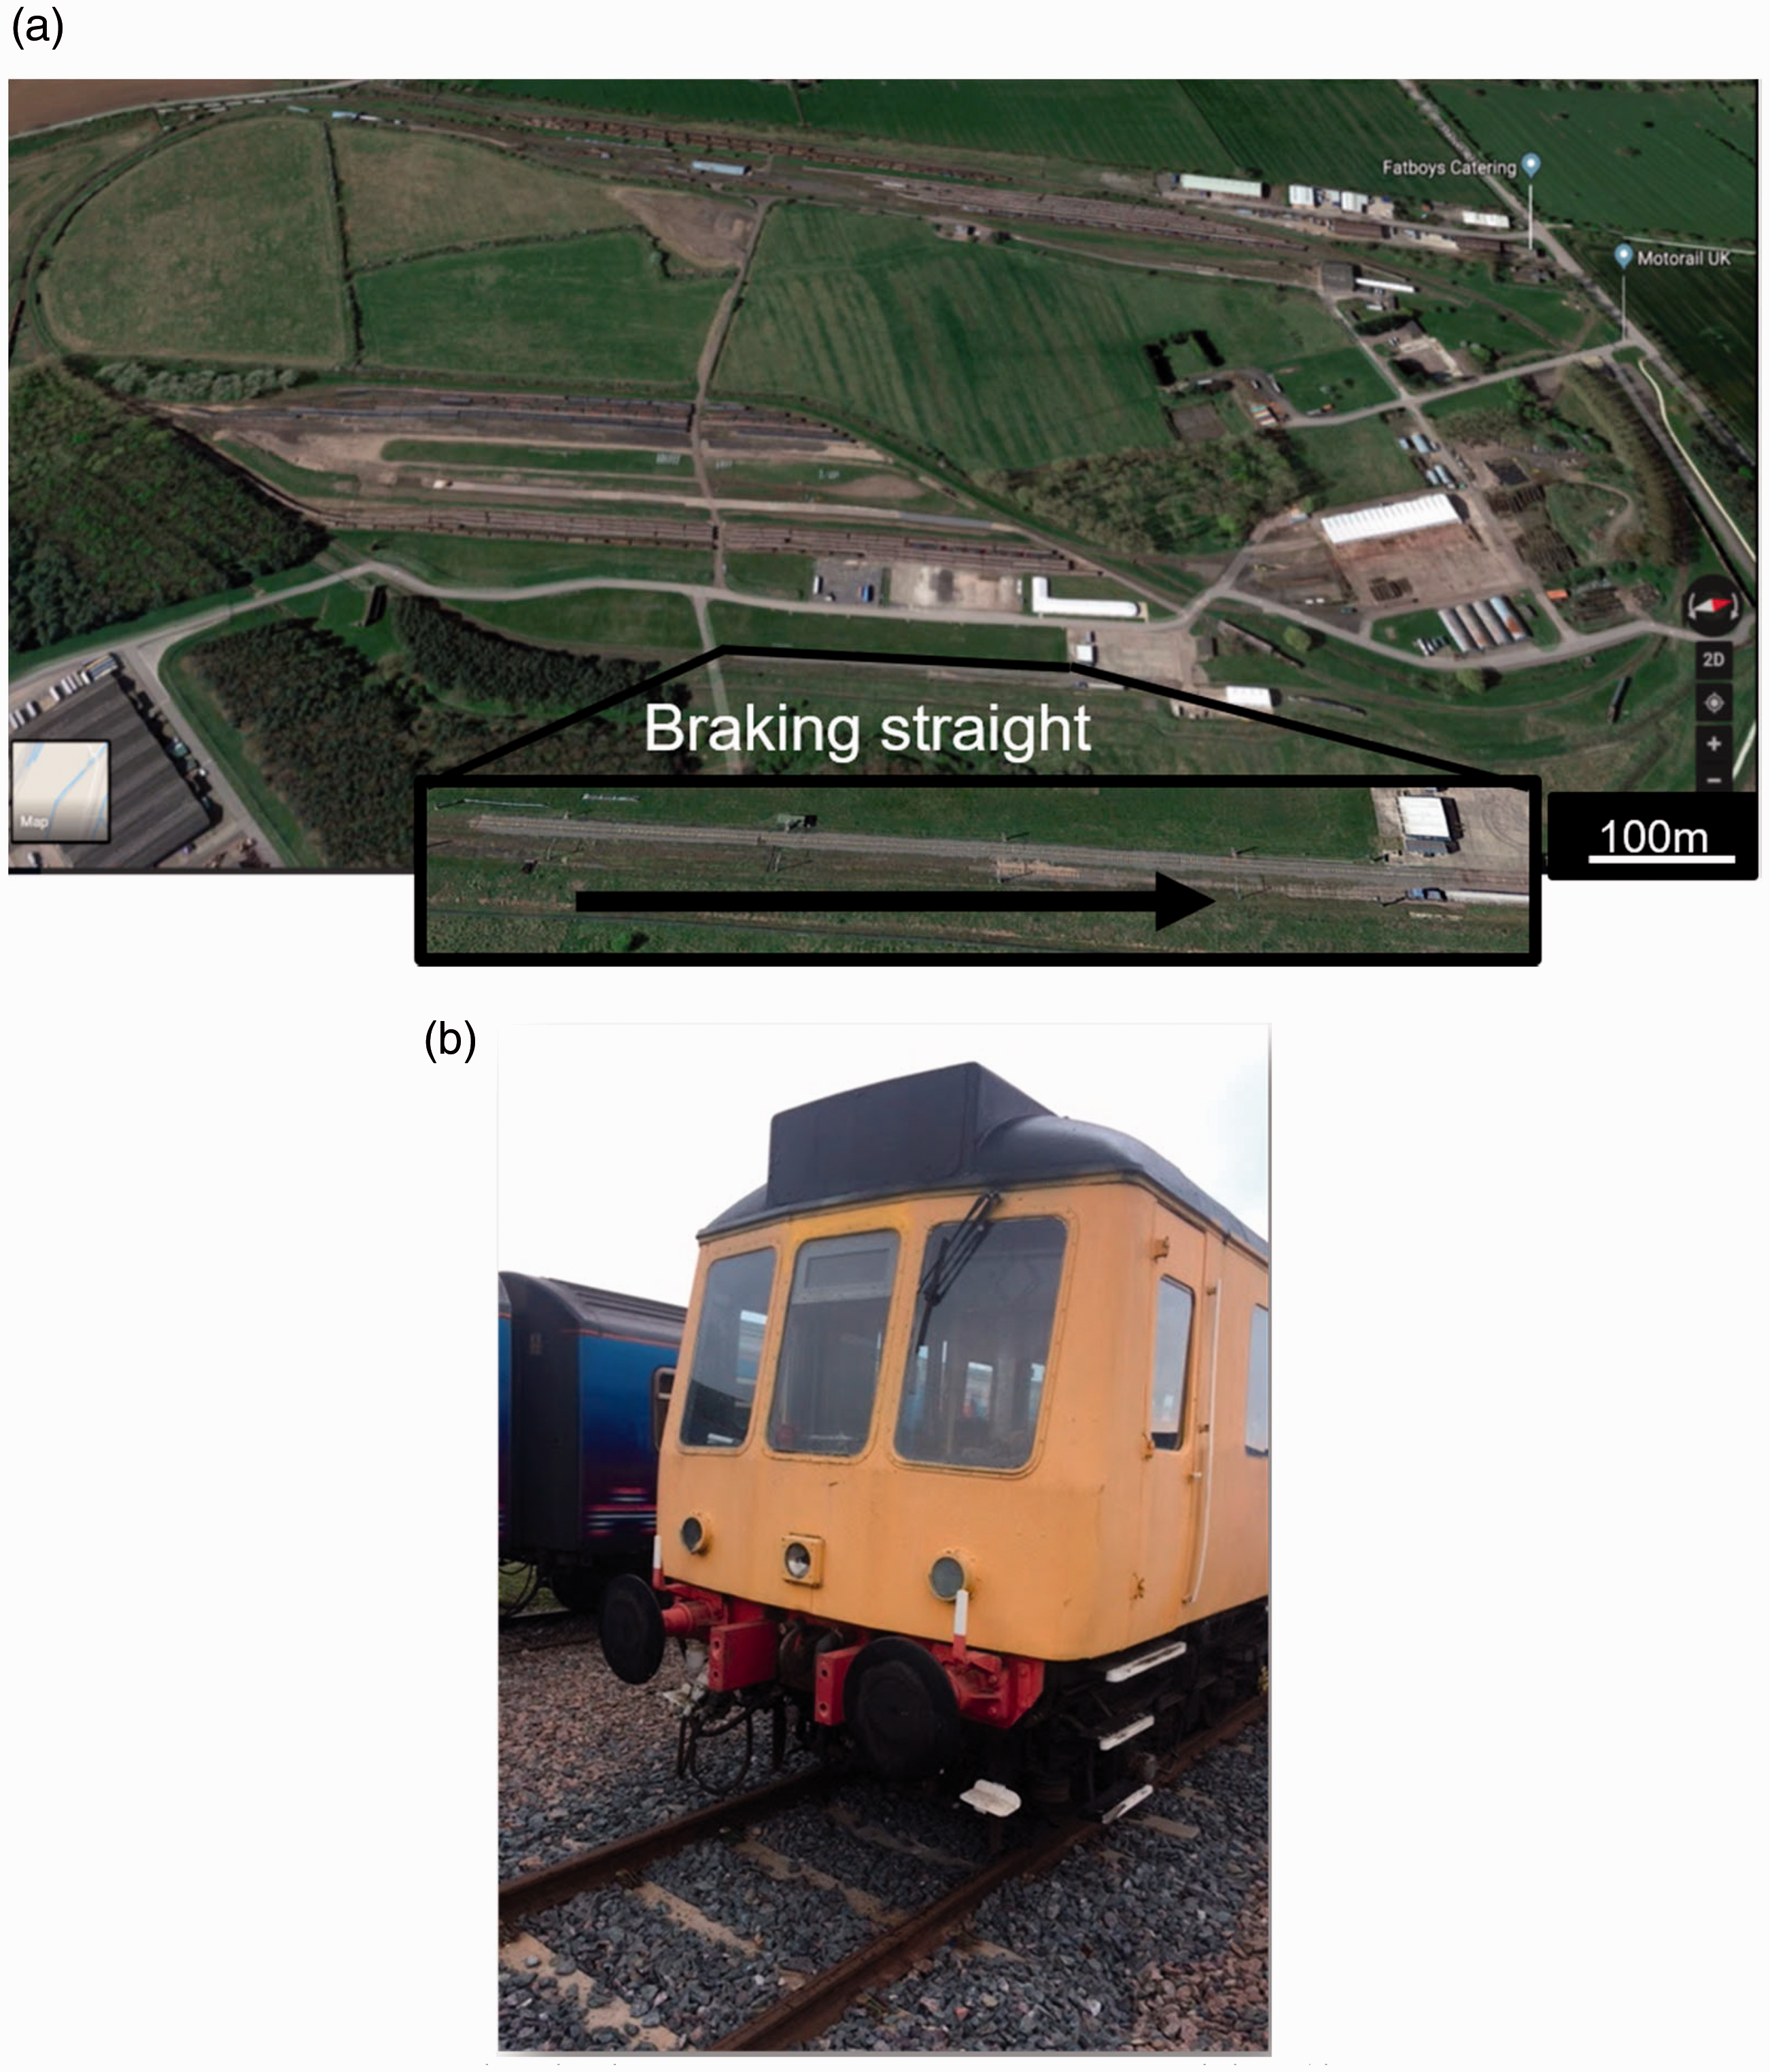
(a) Satellite view of the Quinton Rail Technology Centre at Long Marston in Warwickshire (the braking zone is superimposed at a larger magnification) and (b) the Class 117 DMU used for testing.
Class 117 DMU details.
Trackside measurements
The trackside measurements that were taken were stopping distances (as a back-up written record), and photographic evidence of railhead condition. Initially, a push tribometer was also brought to the test site, however it was not found to give accurate readings when combined with the low adhesion simulants. This was expected as the values for wet and dry rail values (as measured by a push tribometer in the field) were very similar, this is in direction opposition with most reported values from laboratory tests.8,12,13 This suggested that push tribometers are not suitable for this field trial. Literature reports that recorded values of ‘0.42 and 0.55 for dry conditions’ were only slightly different as those recorded from wet rail with values ‘from 0.39 to 0.44 for wet conditions’. Larger reductions were only noted with friction reducing compounds (including flange lubricants). 8 This appears to have changed recently with the release of the OnTrak tribometer. 9
Onboard train measurements
On-board measurements of stopping time, location, and velocity were recorded using a VBOX 10 Hz high accuracy GPS system with a roof-mounted aerial to ensure the maximum number of satellites was used. 14 Videos of wheel behaviour were also taken with a GoPro camera, mounted close to the wheel on the DMU, and used for review after the tests to check brake activation and wheel slide. The location of the brake lever was recorded electronically to determine when braking was demanded, though there was a variable, indeterminate delay before the system changed the pressure at the brake blocks.
Test procedure
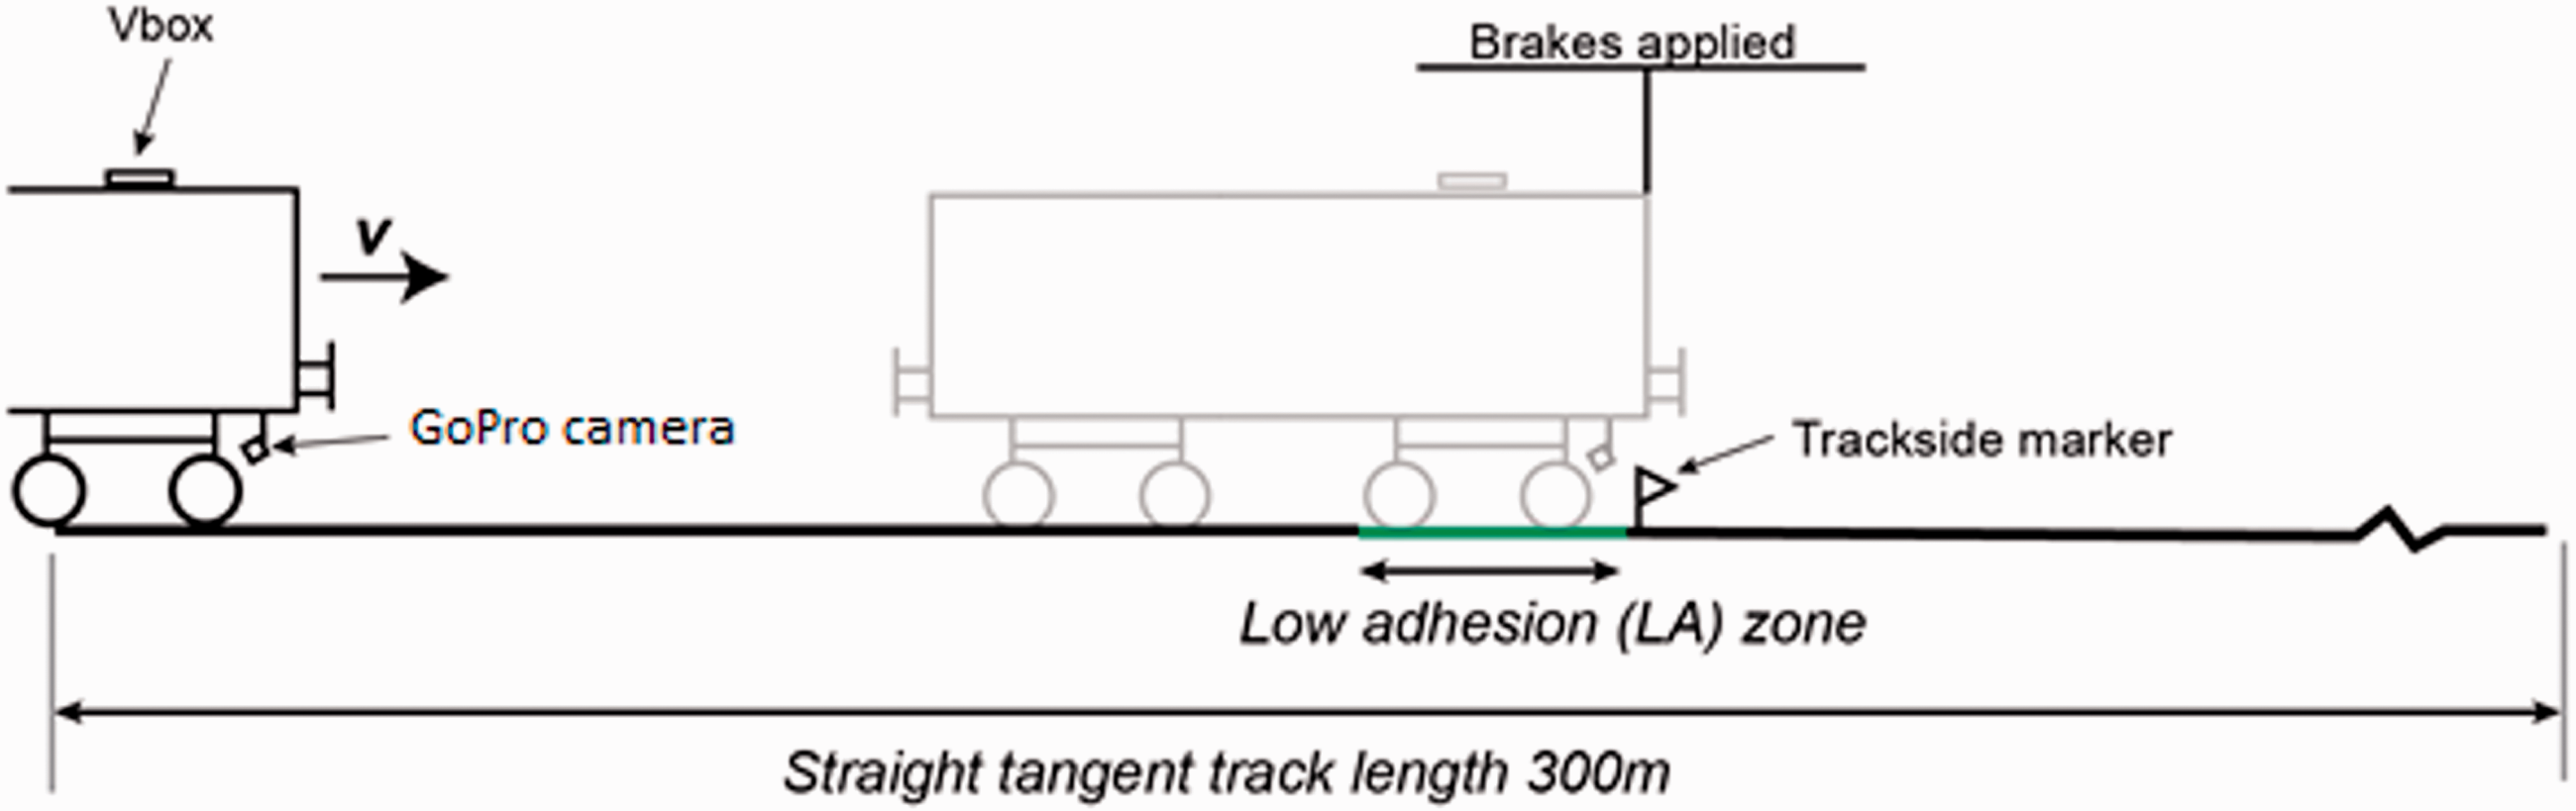
Initially, the track was conditioned to ensure it was representative of normal rail. This conditioning consisted of 5 passes of the vehicle around the track. Leaf layers were created using representative leaves gathered from a sycamore-rich location in Yorkshire. Leaves were affixed to the rail in the designated low adhesion zone using adhesive tape that was kept away from the running band to ensure that only leaf material was present in the contact area. A length of 3 metres of low adhesion simulant was used for the tests. Similar methods have been successfully used to create a leaf layer previously.15,16 Five rolling vehicle passes were used to condition the layer, with no traction or braking. The aim was to find the minimum length that would impact on the vehicle braking performance to enable time to be saved in creating the layers.
Photographs of the railhead were frequently taken to monitor layer formation and railhead condition. To remove railhead contaminants after the tests, a petrol-powered railhead scrubber was used. This device returns the line to a ‘normal’ condition through rotation of a metal brush against the railhead. Normal condition was determined as bare steel, where no leaf contamination was visible on the railhead.
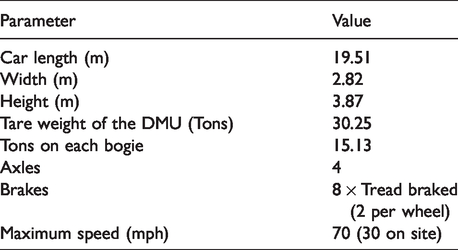
During a brake test, the protocol was as follows: the leaf layer was sprayed with water and video recording on the front wheel was started as the vehicle approached the test area. The driver then accelerated the vehicle to 10 or 25 mph prior to entering the braking zone. The driver then applied the brake at a set position in the low adhesion (LA) zone. The vehicle had no WSP so there was inevitably human error introduced by the driver associated with the initiation and rate of braking, but braking was kept as consistent as possible. A schematic diagram of the test set-up is shown in Figure 2.
A schematic diagram of the braking test with the low adhesion zone highlighted in green.
Data analysis
The velocity-time plots of raw data could be compared once the initial braking point had been determined. The plots were aligned either using the GPS position of the intended braking point, or using the time at which the brake lever was determined to have been moved. Stopping distance was determined by trackside measurement and dividing the initial train speed by the time for the train to stop gave an approximation of the deceleration. As mentioned previously, initial trials with a push tribometer did not give good quality data over the LA simulants tests. Permanent modifications to the DMU were disallowed by the test site who were consulted on possible data capture solutions. This included tapping the brake line to more accurately measure when the brake is released (as opposed to measuring the position of the brake lever, which is known to have a slight delay associated with it). Furthermore, changes to the railhead on site were also disallowed with strict stipulations that the railhead be restored to its original condition after each test day was concluded.
Leaf layer samples were taken from leaf layers created at QRTC in the form of powders/delaminated layers from the railhead. One motivation for doing this was to compare how a ‘created’ leaf layer would differ from a naturally occurring one. Articles in the literature comment on different layers being encountered in the field. One of these layers was named by the article’s authors as the ‘tarnished layer’ which contained ‘much higher contents of calcium, carbon and nitrogen when compared to leaf residue layers and uncontaminated samples’. 17 It was suspected that the layer would not completely match a natural leaf layer as it was not allowed the same amount of time to develop with exposure to the atmosphere (with changes expected from time related processes such as ambient oxidation and the inclusion of species from rainwater). Combining chemical information with photographs of the railhead and deceleration data was settled upon as the best approach to record as much information as possible in the short time window allowed when testing in the field. Additionally, X-ray photoelectron spectroscopy (XPS) is affordable, allows for easy sampling of the rail head and has been used before to investigate the effects of leaf layers. 17 This means that comparisons can be made with other literature works.
Figure 3 shows the layer conditioning and post-test appearance. Samples were also taken from the mainline network on an infrequently used track near Barnsley, UK, which has heavy tree cover and often suffers from low adhesion issues. They were prepared for analysis by implanting the powders into indium foil. Indium foil is soft and is often used in XPS spectroscopy to ‘trap’ loose material for analysis. In order to avoid differential charging during the analysis, which can happen if different areas of the sample have different conductivities, the samples were electrically isolated during analysis by mounting the indium foil over a paper label stuck to the sample bar. The spectra were calibrated using the peak for Fe+3 cations at octahedral sites. The binding energy for the spin-orbit splitting peaks was found in the literature to be (for Fe 2p3/2) 711.0. 18 The analyses were carried out using a Kratos Supra instrument with a monochromated aluminium source, and two analysis points per sample. The area analysed was 700 µm by 300 µm. Initially, survey scans were collected between 1200 to 0 eV binding energy, at 160 eV pass energy, 1 eV intervals, and 300 seconds/sweep with two sweeps being collected. A number of high-resolution spectra were then collected from each element identified in the survey scans. The high-resolution spectra were collected at 20 eV pass energy and 0.1 eV intervals for each analysis point over an appropriate energy range, and one or two 300 second sweeps - two sweeps were used for the lower sensitivity elements or those with the larger energy ranges. The data collected was calibrated in intensity using a transmission function characteristic of the instrument (determined using software from NPL) to make the values instrument independent. The data can then be quantified using theoretical Schofield relative sensitivity factors.
Leaf layer generation after (a) 0 passes, (b) 2 passes (c) 5 passes and (d) post-test appearance.
Results
DMU deceleration data
The results from the 41 braking tests from 10 mph (26 dry and 15 with a leaf layer) are shown in Figure 4. The 41 braking tests from 25 mph (23 dry and 18 with a leaf layer) are shown in Figure 5. Deceleration ratings were used over different time intervals to allow for effective comparison between the 10 mph dataset and the 25 mph dataset. A benchmark deceleration rating for the Class 117 was sought to indicate how the vehicle would usually perform. This is made somewhat more complicated as the vehicle in this instance is solely made up of the first ‘unit’, as opposed to the three units usually seen with this DMU. Information in the literature was used to get a good estimated value for this based upon other tread braked and similar vehicles.19–21 The deceleration value settled upon for this specific DMU’s normal brake performance was 1.3 m/s2. This has been added to the deceleration figures as a grey bar across each graph. This helps to show when sliding has likely occurred.
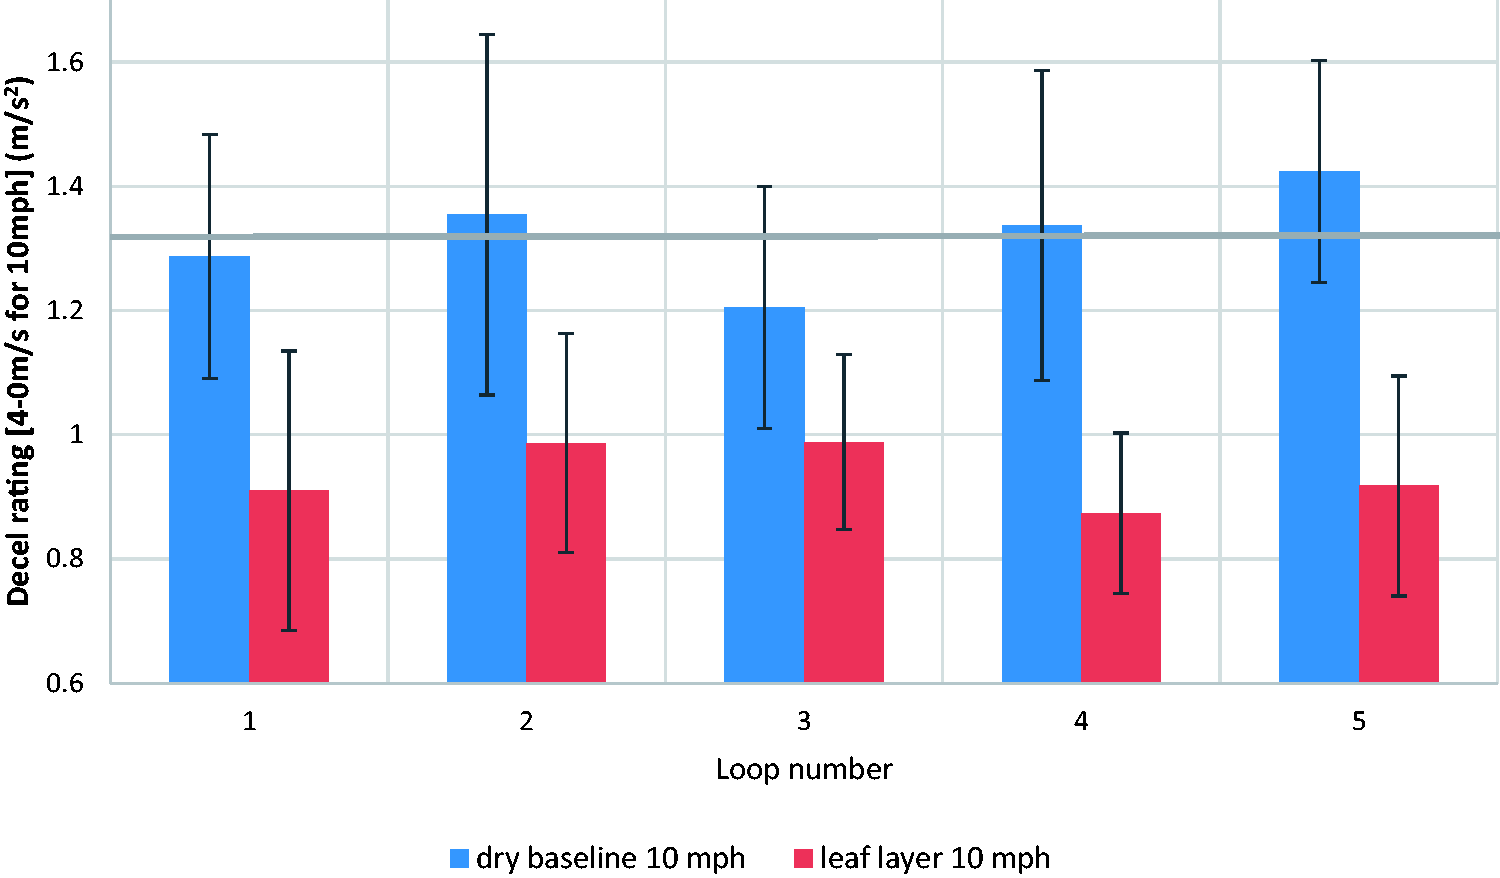
DMU braked from 10 mph: deceleration by condition. The grey line indicates estimated deceleration ratings of the Class 117 DMU (as one carriage).
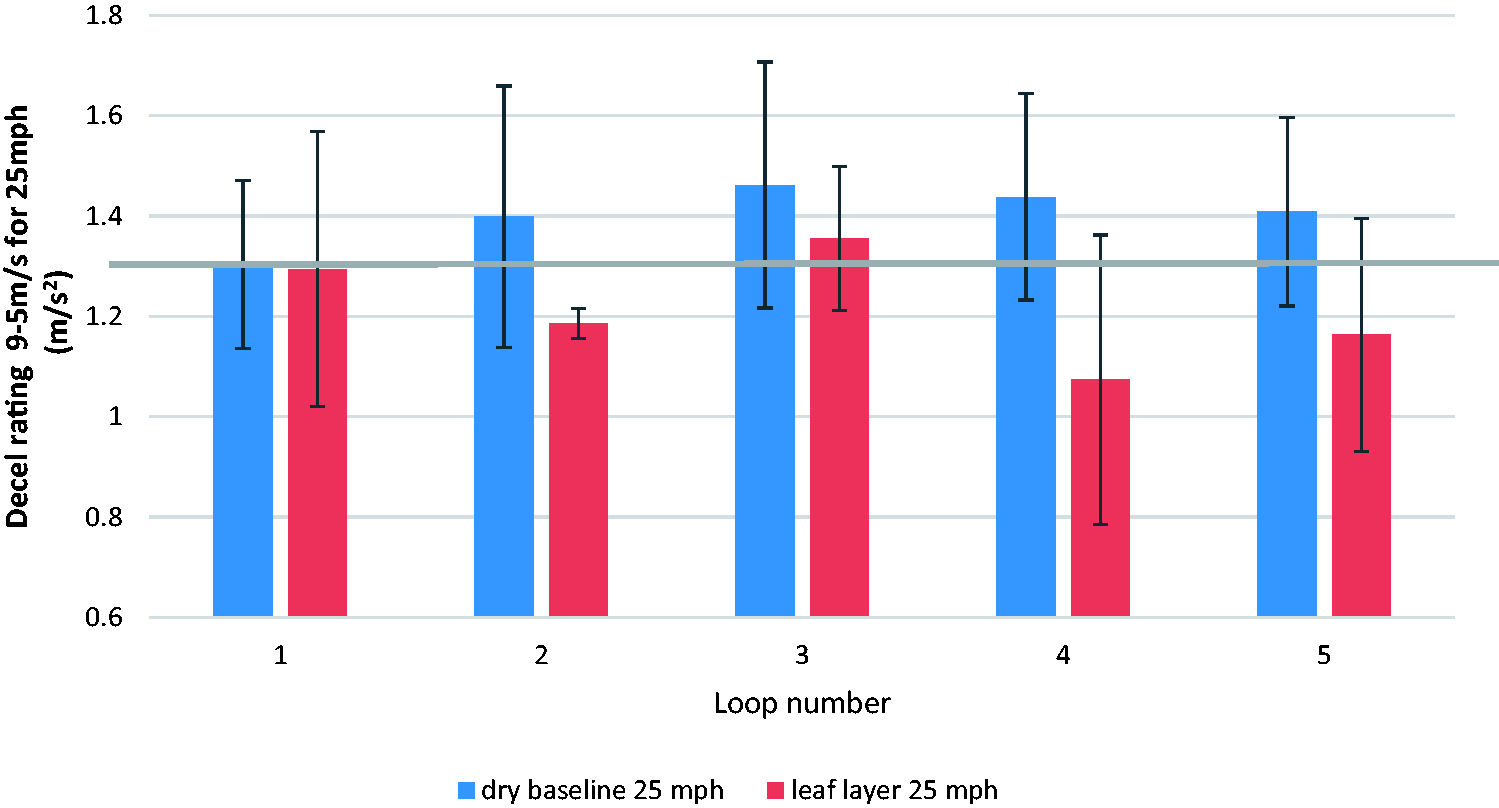
DMU braked from 25 mph: deceleration by condition. The grey line indicates estimated deceleration ratings of the Class 117 DMU (as one carriage).
When the vehicle brakes from 10 mph (Figure 4) leaf layers were shown to act effectively as LA simulants when compared with dry rail. The 4th and 5th loops show deceleration rates that are markedly different from those of dry rail. Deceleration data was used to give rough estimates of friction coefficients, using a methodology reported by RSSB.19,22 These estimates of friction coefficients confirm that friction values are at least the values calculated below, if not greater values. Although the relationship is not exact, a braking rate of 0.3 m/s2 can only be achieved if the value of µ is at least 0.03. The value of µ would need to be at least 0.12 to achieve an emergency braking rate of 1.2 m/s2.
19
When the vehicle braked from 25 mph (Figure 5) the low adhesion simulant showed varying effects on train deceleration. The average deceleration for the leaf layer tests is lower for every loop, but due to a large range in results, the deceleration rate of the vehicle is not sufficiently altered from the baseline value to confirm low adhesion conditions had been created at the wheel/rail interface (at 25 mph). Deceleration data was used to estimate friction coefficients for 25 mph as well. The average µ for dry rail at 25mph (using the data from all 5 loops) would be at least: µ = 0.143 ± 0.022 (experimental deviation). The leaf layer would be at least µ = 0.124 ± 0.020. This confirms that the methodology for testing at 10 mph is robust, whereas the 25 mph testing methodology would need alterations if further work was pursued.
Figure 6 shows the velocity history of runs on dry rail and leaf layers one set of the 10 mph tests. It can be seen that the average time taken for the vehicle to stop (reach a velocity of 0) on leaf layers is increased on average by 4 seconds, when compared with the dry rail. Also, note that the slope of the leaf layer plots do not increase significantly at the end, indicating that low adhesion continues throughout braking.
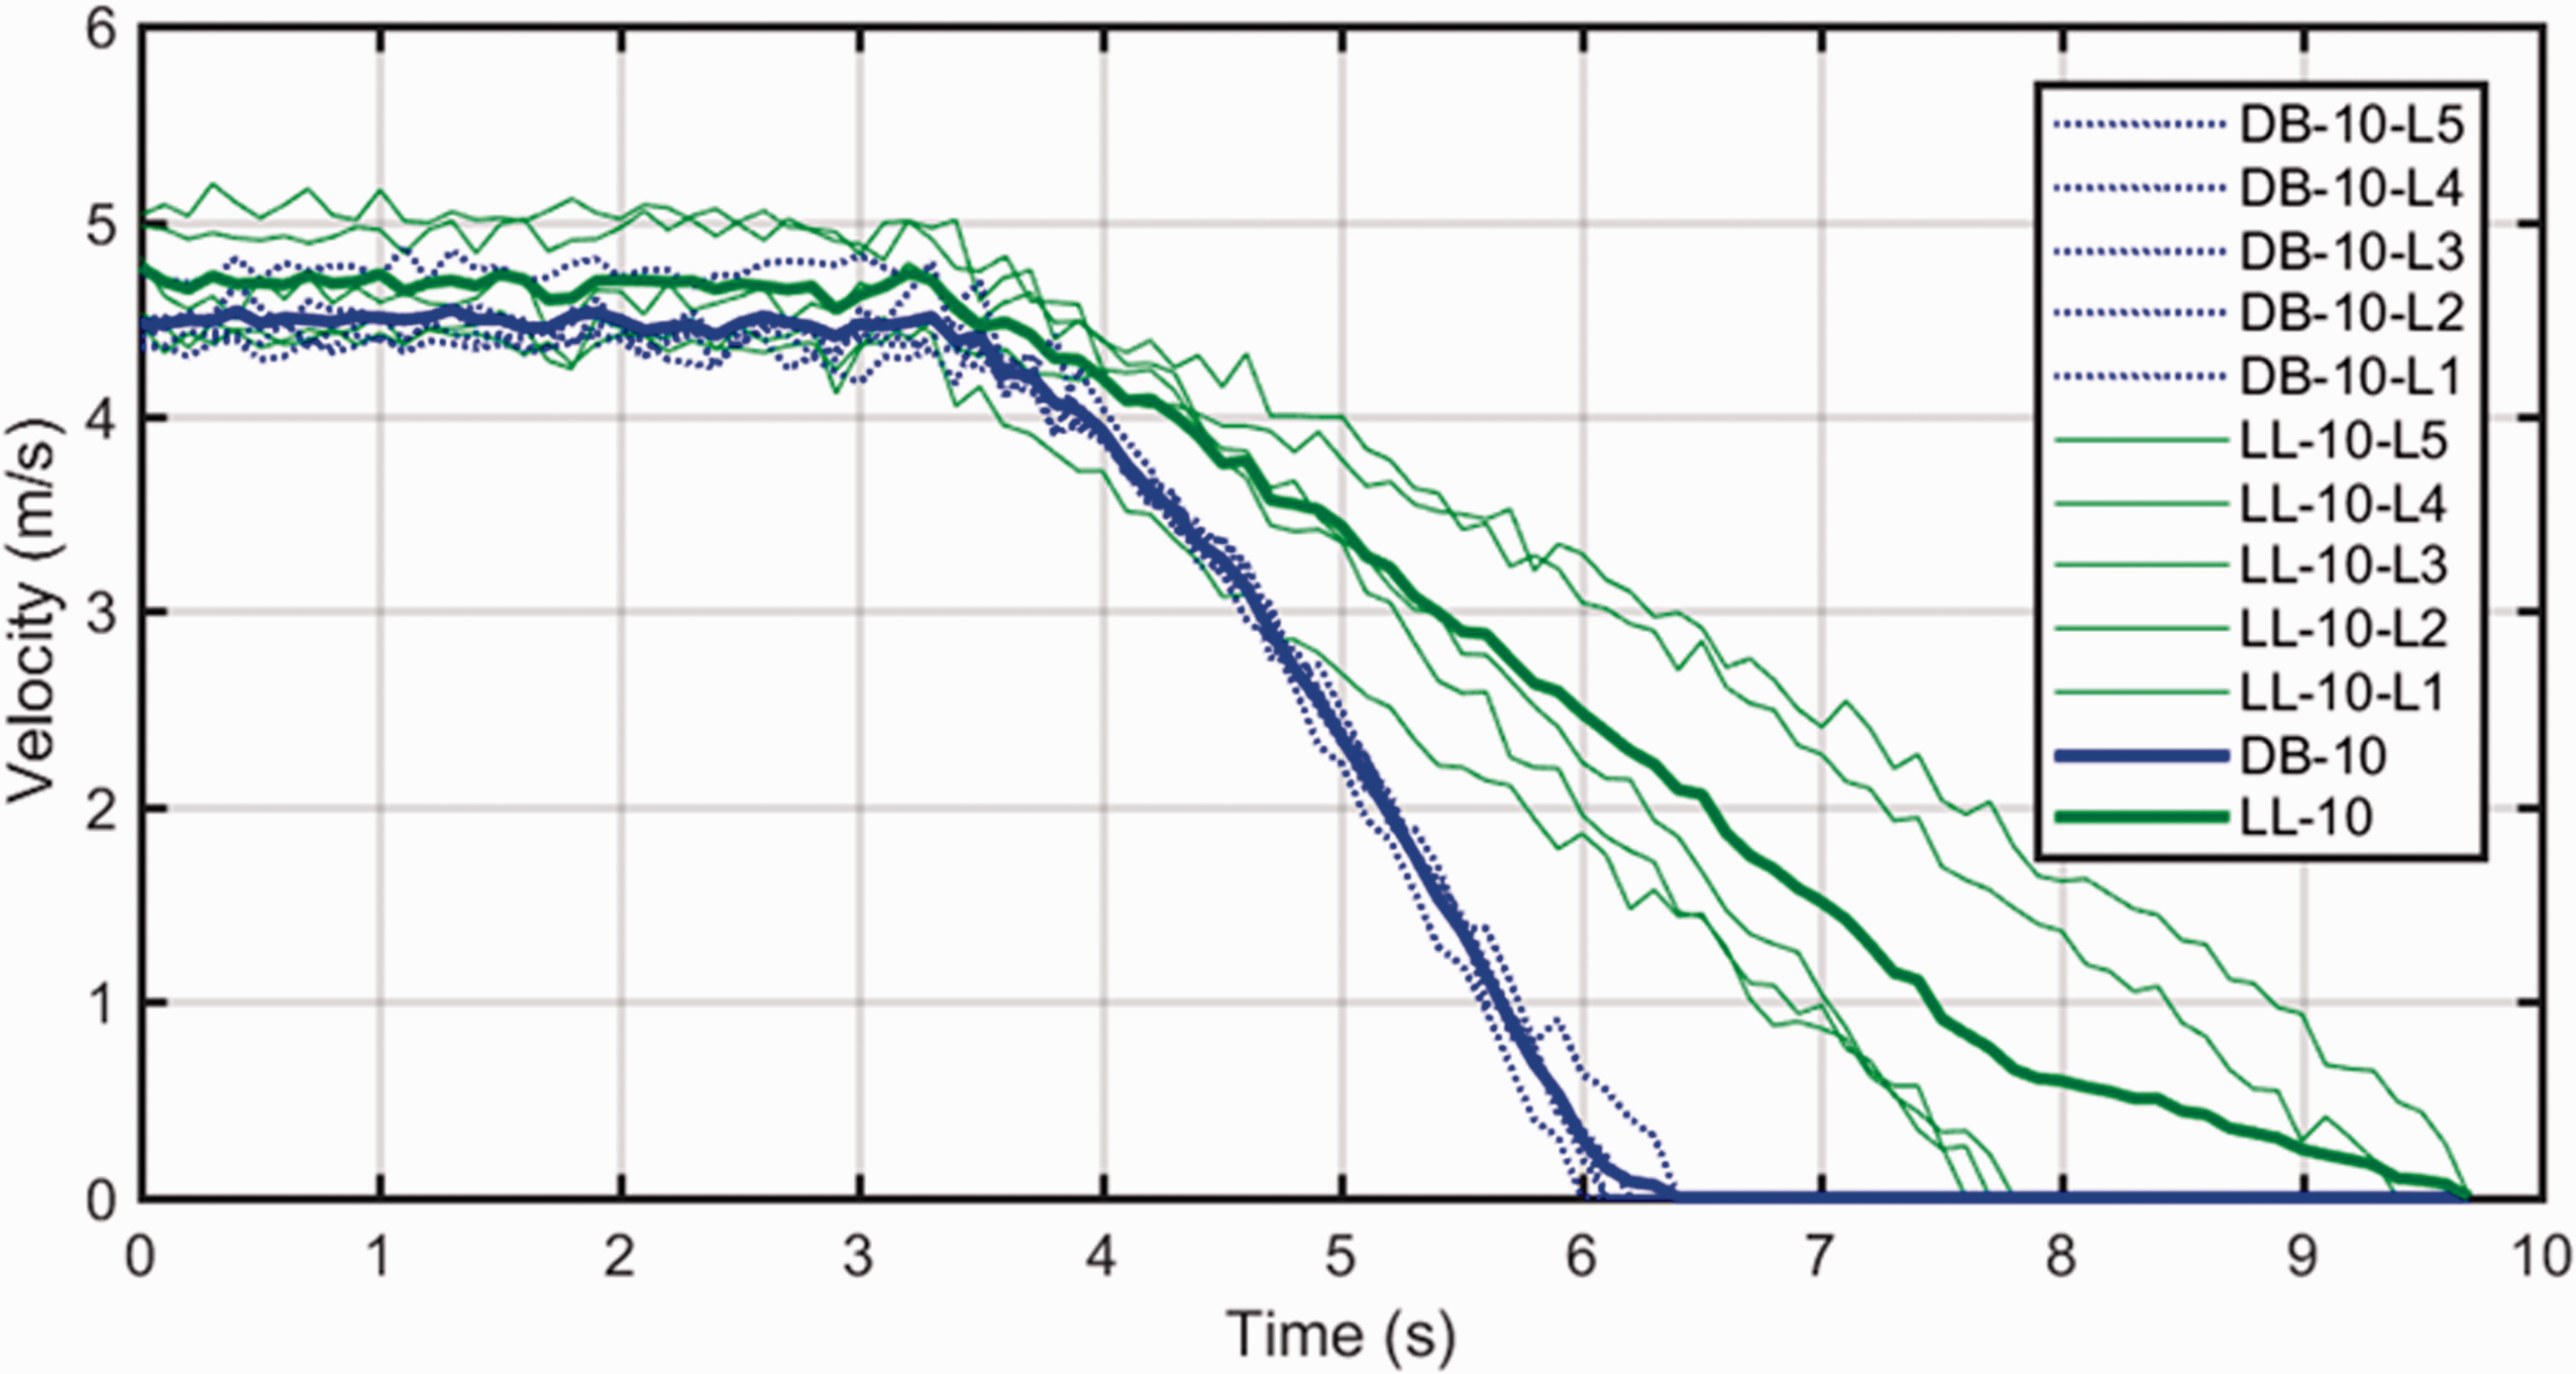
Velocity of the vehicle braking from 10 mph, with average values (shown with a thicker line) for the dry baseline in blue (DB-10) and leaf layer (LL-10).
Figure 7 shows the velocity/time plots for test conducted at 25 mph. When compared with Figure 6 it becomes clear that at 25 mph the vehicle’s braking performance is not as affected by the leaf layer in a significant manner. There is a noticeable difference when looking at Figure 7, the gradients of all the green curves is different from the gradients of the black curves, with almost no overlap between the two types of test, although the difference in the traces are less prominent than in Figure 6.
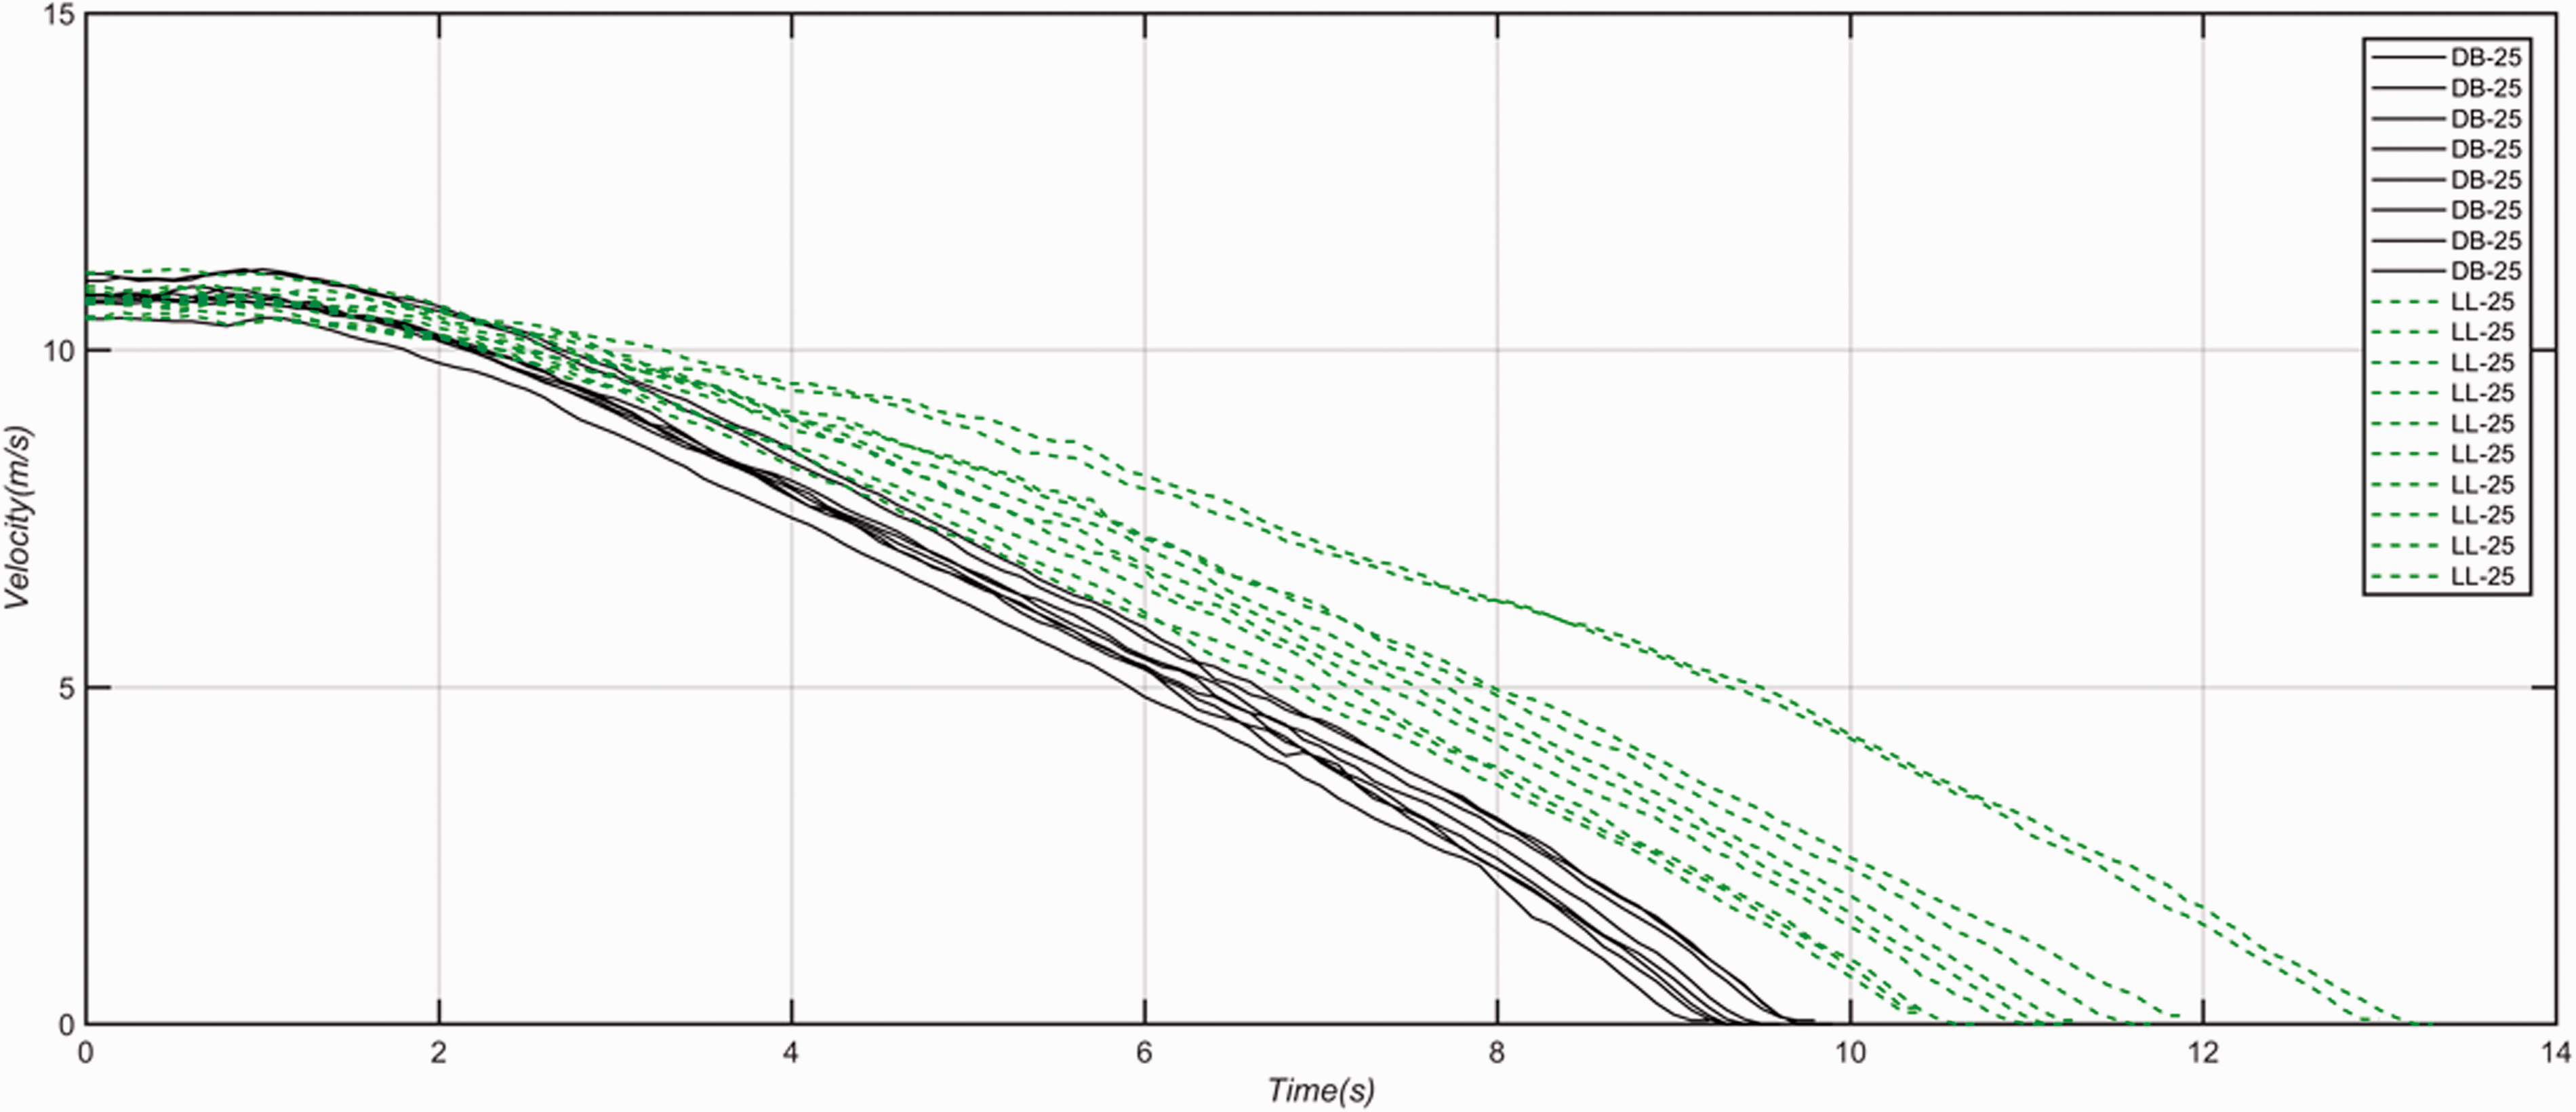
Velocity of the vehicle braking from 25 mph, DB stands for dry baseline and LL stands for leaf layer.
Chemical analysis of leaf layer
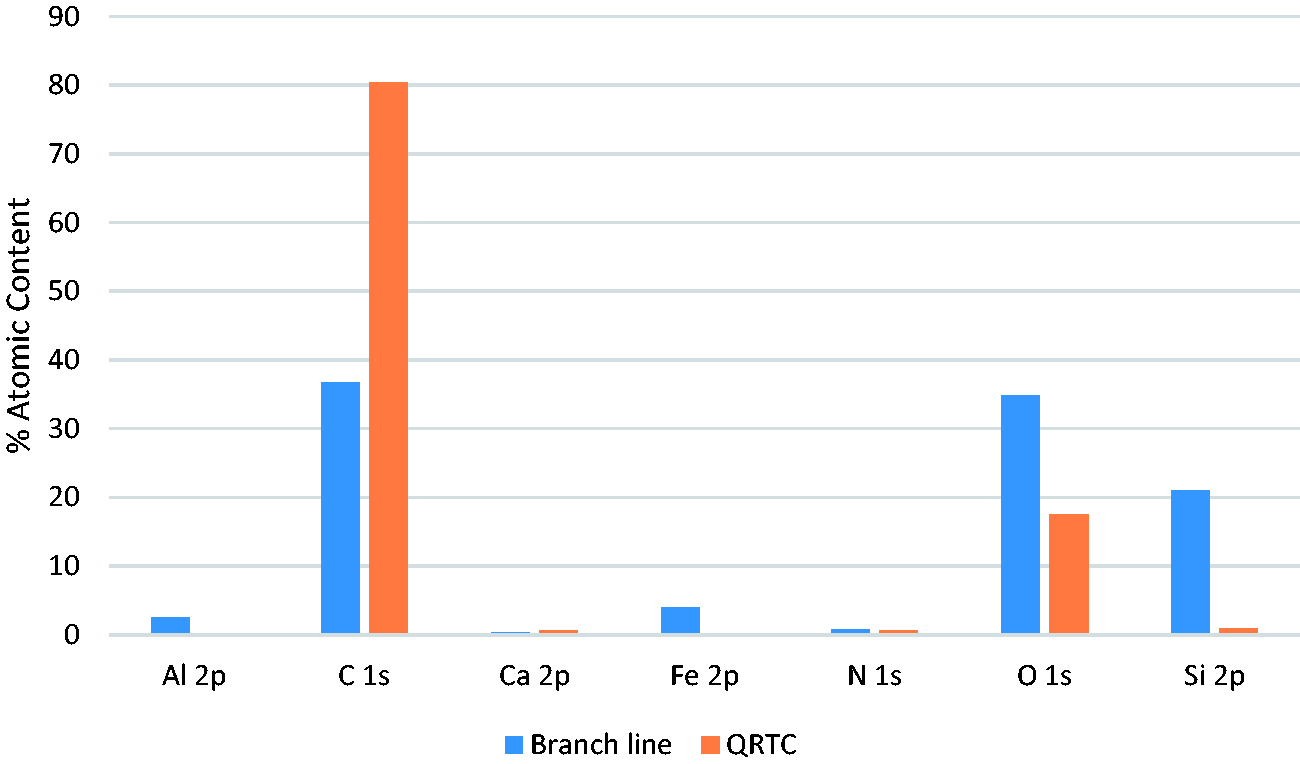
XPS data from leaf layers collected from testing at QRTC and also collected from a leaf contaminated branch line rail, near Barnsley UK, were taken for analysis, Figure 8. The aim of this was to confirm that the layer created was sufficient similar to leaf layers generated in the real application. This does appear to be the case, as the key components (O, C, Fe are noted in both samples, although in different atomic% content. Previous reports in the literature helped to inform the data analysis reported here. It has been found that certain layers contain much higher contents of calcium, carbon and nitrogen than do ‘leaf residue layers’. The authors note that these species are generated from the leaf material after they have chemically reacted with the bulk material. 17 The dataset obtained from testing at QRTC does seem to be in agreement with this trend. The data set from the branch line appears to agree with literature values, where the carbon content was reported to be 48%. The branch line sample here has a carbon atomic percent content of 36. 17 The authors also note amounts of nitrogen and calcium being present on the outermost surface, as is the case here. This confirms a chemically similar layer has been created that effectively simulates leaves.
XPS data from naturally formed vs created leaf layers.
Key differences are noted between the two spectra. For further insight, the high-resolution data for both carbon and oxygen components were examined, these are shown in Figure 9. These high-resolution scans allow a very detailed look at particular elements, in this case C and O. These peaks were used to assess the similarity of the created leaf layer with leaf layers encountered on mainline track. It can be seen that with the sample taken from mainline rail, there is a pronounced shoulder at a higher eV (electron volt) value (peak labelled 2 in the table) within the main carbon peak. This shoulder at a higher eV value is indicative of more oxygenated carbon compounds. This suggests oxidation has taken place within the film. At least two different oxygen species are clearly present in the sample from the branch line, the binding energies are in agreement with those known for metal oxides and hydroxides.
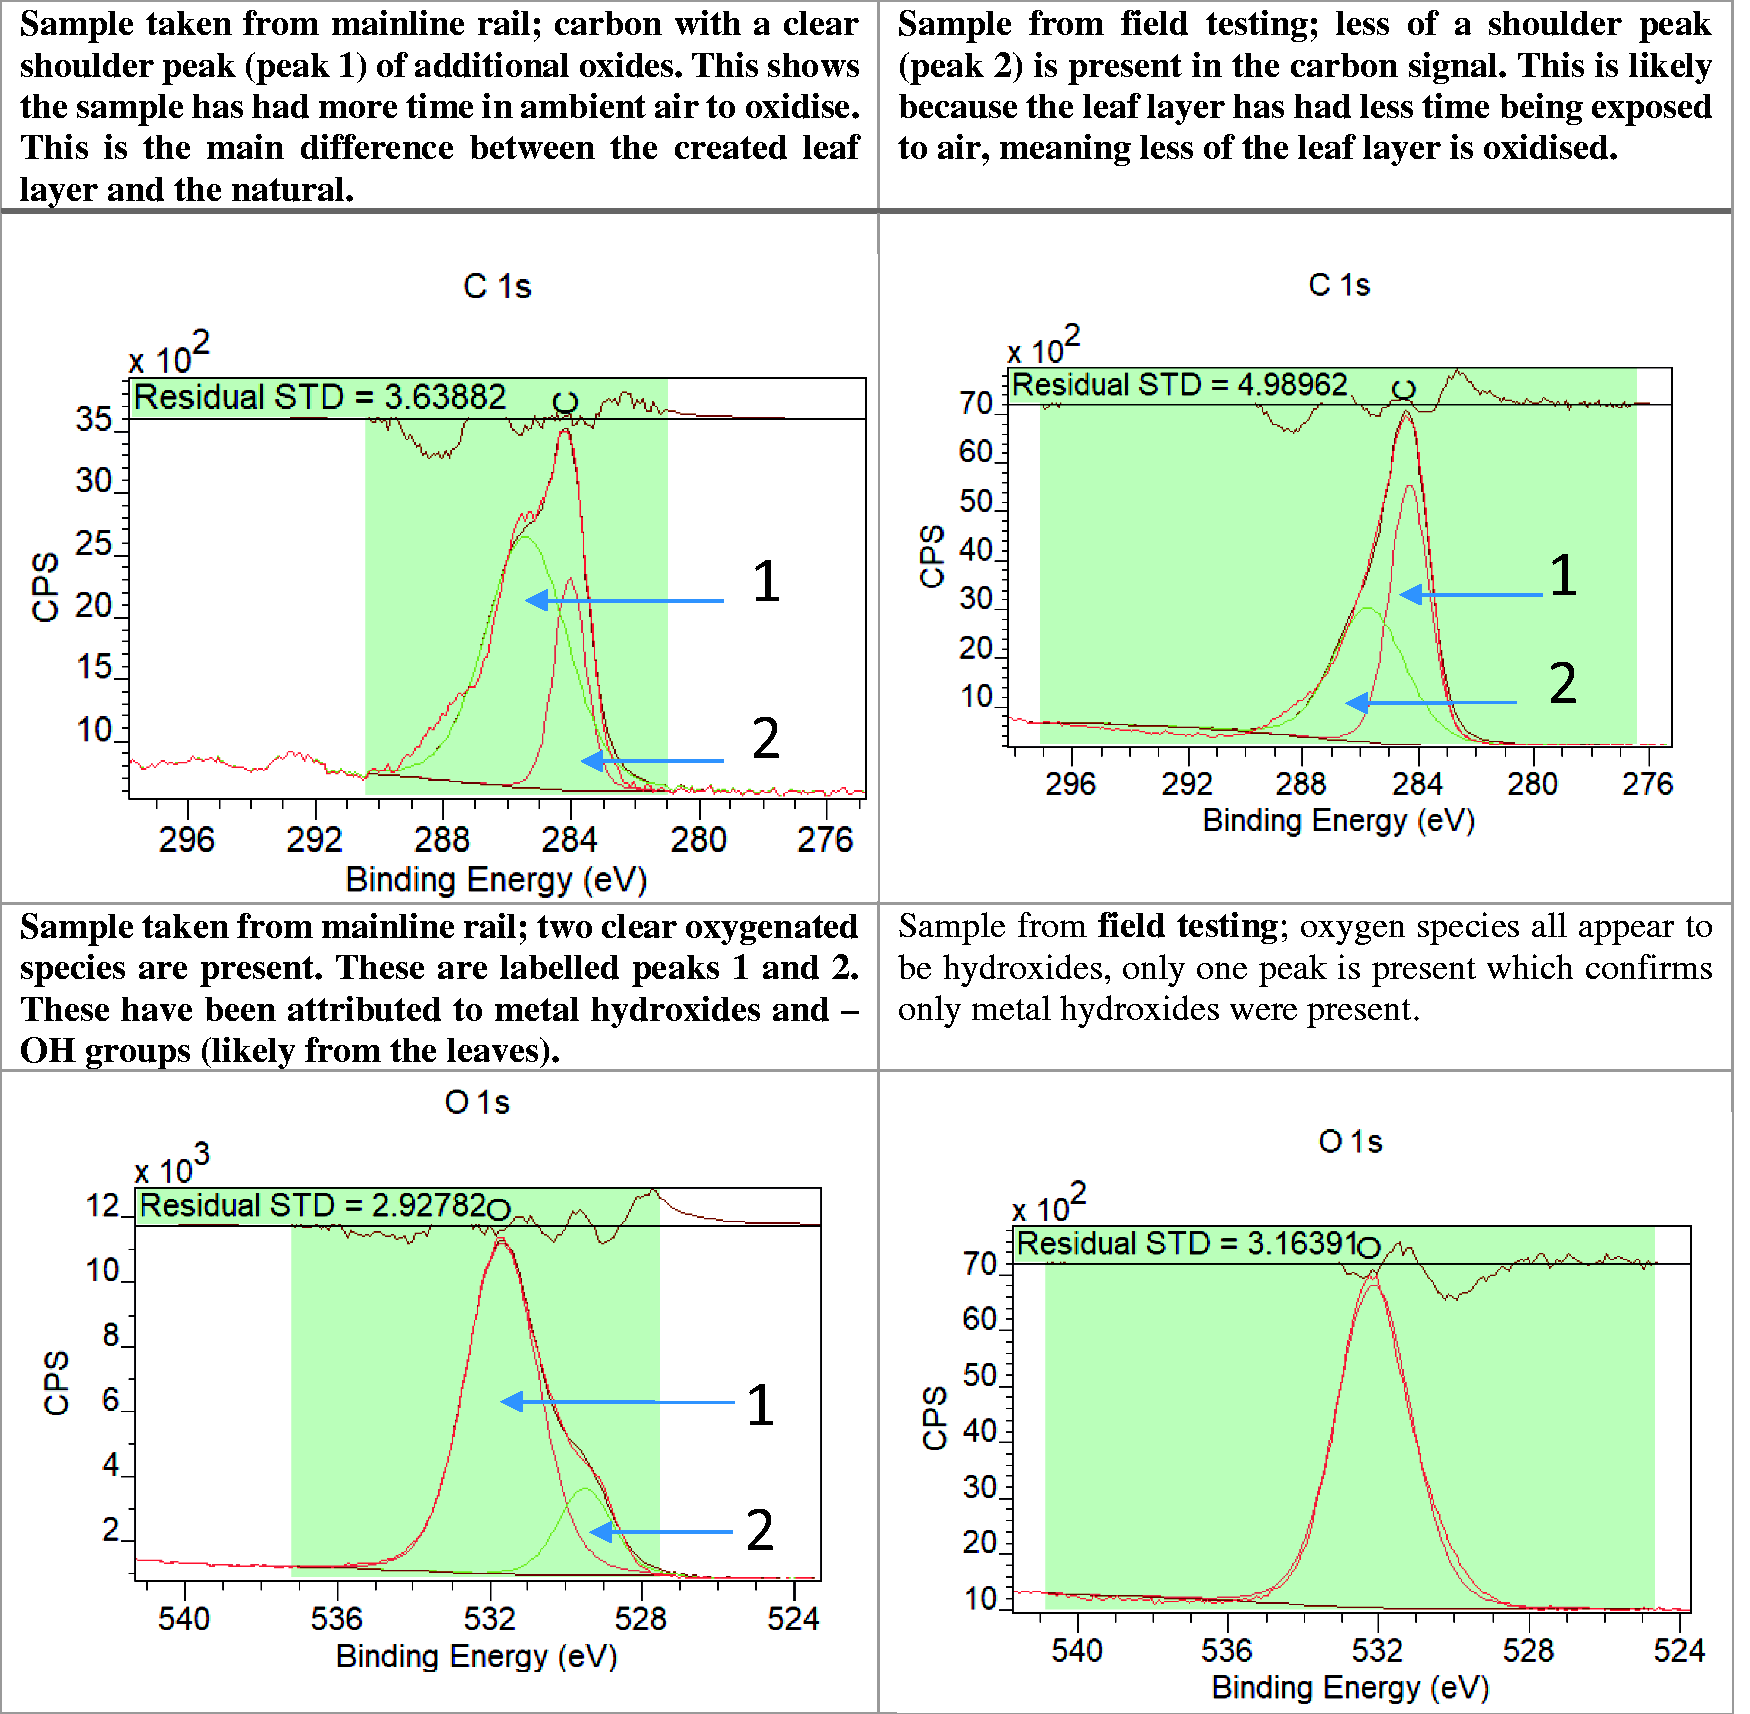
High-res C and O peaks from the branch line and ‘created' leaf layers at QRTC.
Whereas, the sample created at QRTC shows the reverse pattern in the carbon signal, with less oxidised carbon species present and what appears to be only a single oxygen species. The oxygen species appears to belong to hydroxides (these could be both metal hydroxides and organic groups) containing -OH species.
The main differences between the two are that the leaf layer created by hand had larger amounts of carbon and less amounts of oxygen in the sample. This is to be expected as the leaf layer has not been exposed to natural conditions (UV/heat/oxygen) for extended periods. The sample taken from UK train was from an infrequently used track, this allows it time to oxidize and lose carbon as carbon dioxide gas. Also, it is noted that the %atomic concentration of Fe is higher in the naturally found leaf layer, again this is to be expected as the layer has had a long time at the wheel/rail interface where enhanced iron incorporation into the leaf layer is expected.
Leaf layer transfer down the railhead
Leaf layers were created and then transferred (by action of the vehicle braking) leaving a distinct ‘black layer’ as far as 10 m down the railhead from the area of original application of the leaves (see Figure 10). A similar black layer is often associated with low adhesion in descriptions given by rail workers. 12 It has been described as a ‘Teflon-like leaf layer’ due to its colour, low shear strength, and difficulty to remove. The layer produced on the railhead matches the colouration, friction reducing properties, and tenacious nature, requiring scrubbing to fully remove. The transfer along the railhead is encouraging as it indicates that a 3 m ‘artificial’ leaf layer creates a longer length of low adhesion zone as observed in Figure 10. Transfer of leaf layer was noticed in all tests typically at 9 m or 10 m down the rail from the initial leaf layer.
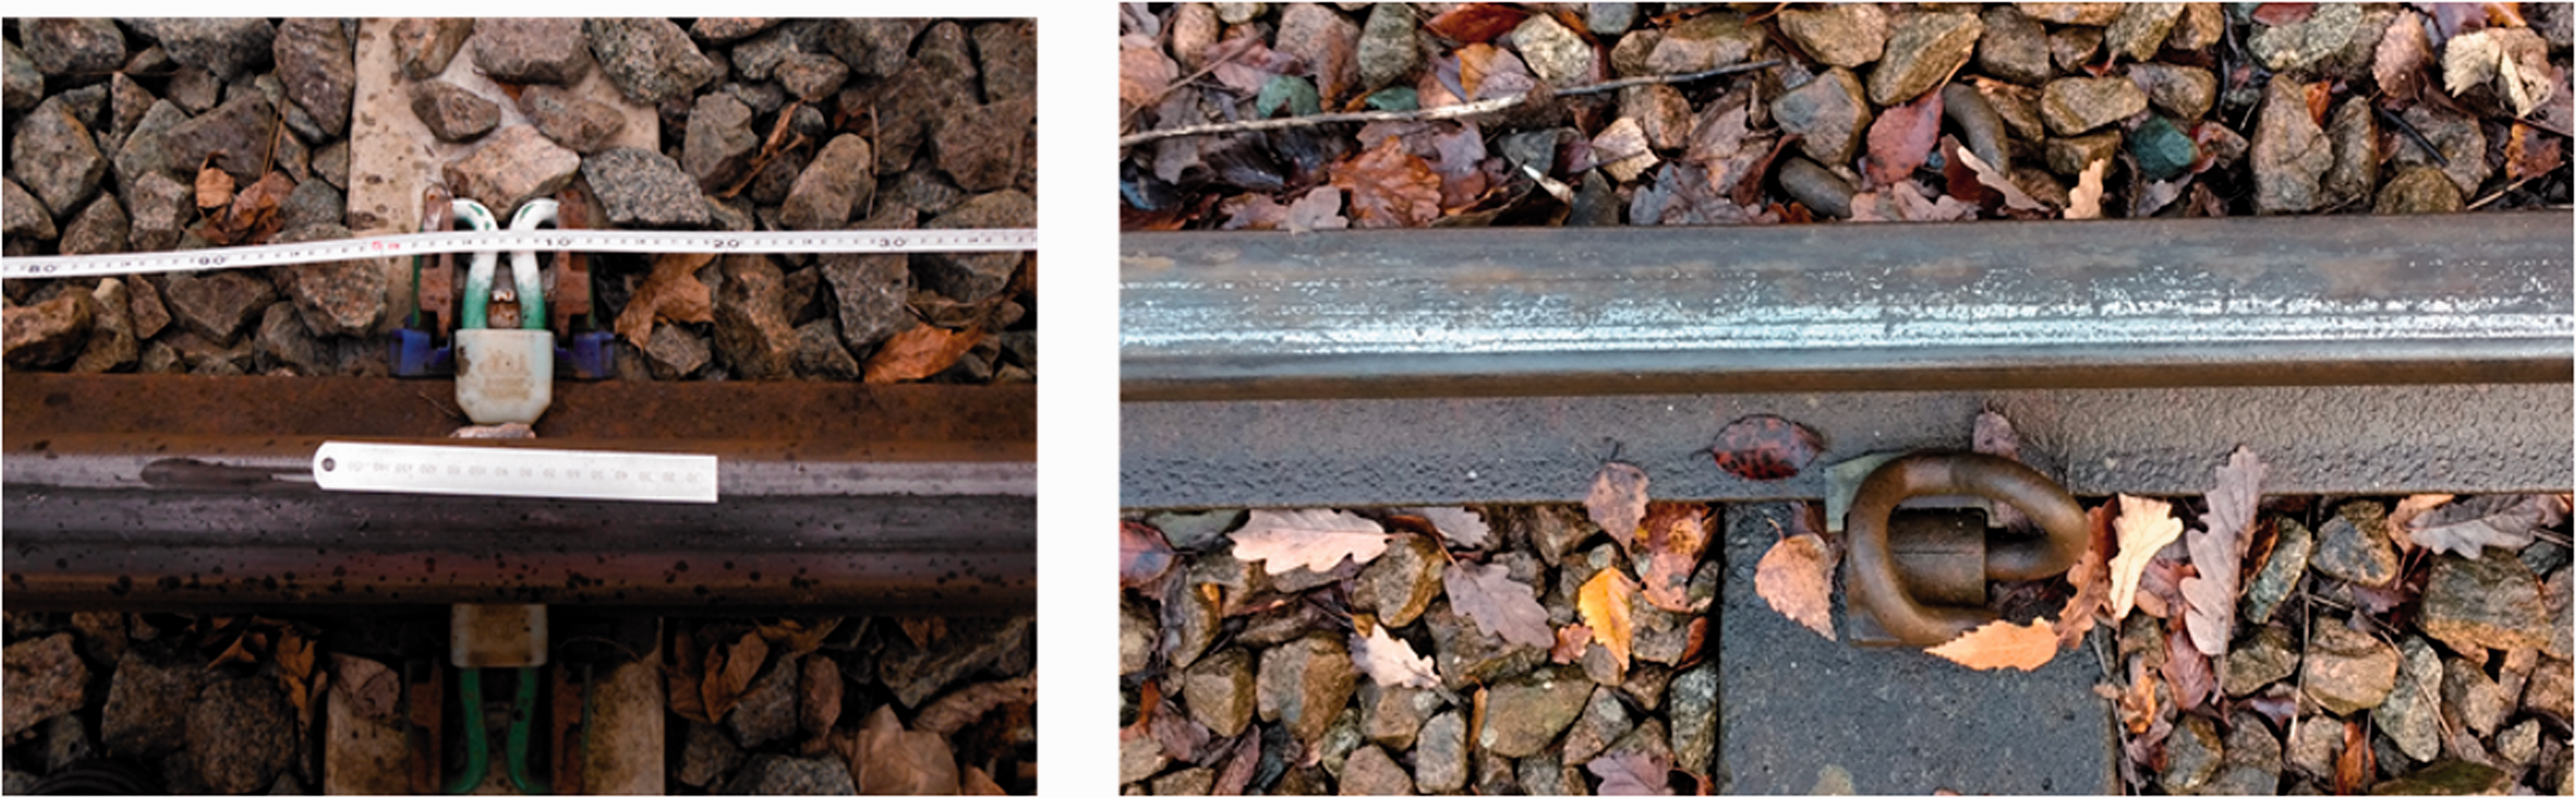
Leaf layer transfer down the railhead (left), leaf layer as encountered in the field (right).
Discussion
The results presented above indicate that, using leaves, the test methodology is able to provide consistent and reproducible low adhesion when braking from 10 mph. These results were obtained using a relatively cheap test methodology within the timeframe allowed for testing. A key finding is that the characteristic appearance of the leaf layer that produced low adhesion is similar to those of the leaf layers seen on the network. This provides confidence that techniques that improve braking performance in these tests will also perform well on the network. The following subsections provide more details.
The results form testing at 25 mph did not appear to effectively reduce braking performance. This could be due to the speed at which the vehicle encounters the low adhesion layer and the time it has to effectively brake on the layer. It could also be the case that if more ‘loops’ of the track were included in the higher speed tests (increasing from 5 to perhaps 10) further transfer of the black layer that was seen on the railhead could have changed this trend.
Created leaf-layers as low adhesion simulants
Figure 4 show that the leaf layer formation method proposed in this paper, coupled with brake tests at 10 mph, provides an effective method to simulate low adhesion. The deceleration values seen for test runs 4 and 5 give the biggest change outside of experimental deviation between the leaf layer and dry rail. This may be due to a physical change such as the leaf layer being spread further down the rail, or the leaf layer chemically changing during the previous test runs to produce more effective low adhesion conditions.
As well as these results, video recording of the front wheels on the left side of the vehicle showed that the wheel rapidly began to slide. The mechanism for this tribological effect is still to be fully established. Laboratory values studies show that the coefficient of friction of leaf layers can be between 0.01 and 0.04. 12 A study into the characteristics of leaf layer contamination was undertaken on a full-scale wheel-on-rail test rig. It was established that the shear strength of the leaf layer was inversely proportional to the moisture level. The thickness of the layer ranged between 10–100 µm. 23 From this, it was concluded that the metal surface asperities of the wheel and rail will not be in contact in the presence of a leaf layer. 12 Although film thickness data could not be included in this work, this gives useful context on the results presented.
From examining the XPS data, it is clear there is a difference between the films formed in the QRTC trials when compared with the sample taken from mainline rail. The key differences are:
A 43% atomic decrease in the amount of carbon in the film taken from the mainline A 3% increase in Fe content in the film taken from the mainline A 17% increase in O content in the film taken from the mainline An increase in silicate (likely from sand) content in the film taken from the mainline
Furthermore, the species in which Fe is present is different when comparing the two films. The small amount of Fe present in the simulated leaf layer appears at 710.75 eV, this indicates it is present as Fe2O3, haematite. Whereas, in the leaf layer taken from the mainline sample, the Fe is detected in larger quantities at 711.33 eV. This binding energy is indicative of Iron(III) oxide-hydroxide. 24 The presence of this compound has been noted before in leaf films on the railway and research in the material science field suggests creation of Fe(O)OH species can be caused by dehydration and deprotonation, depending on the reaction conditions. Production of this species has been noted as being dependant on a relatively poor oxygen environment (which the leaf layer may provide, by protection from ambient environment) and a long reaction time.
This sheds light on the friction reducing nature of the two films. It would indicate ‘black layer’ is formed in a step-wise, time dependant manner:
The first stage appears to be the creation of a film that allows incorporation of iron from the rail head into the organic matrix created from the crushed leaves. This gives a reduction in friction, as seen in the deceleration data detailed herein. It is proposed that there is an interim stage after this that happens on mainline rail. At this stage, the high pressures and temperatures caused by train passage allow for the release of Fe ions from the railhead into the film. These go on to catalyse reactions resulting in the tribochemistry seen in the sample taken from the mainline. Finally, additional reactions take place to create a full ‘black layer’ (as represented in the mainline rail XPS sample) which contains different oxides of iron, more oxygen and less carbon.
The deceleration data at 25 mph does not show such a marked amount of effect on vehicle deceleration values as at 10 mph. It is proposed that at this speed in the field trials, the contact time between the wheel/rail (and leaf) interface is not of a long enough duration to produce the high temperature and pressures required (at 25 mph the vehicle travels 3 m in only 0.27 seconds). Thus, enough ‘black layer’ does not form and cannot have a noticeable effect on the vehicle’s performance. Further tests should be carried out at 25 mph in future with leaf layers longer than 3 m to assess this.
It has also been shown by other researchers on an MTM that friction curves for soaked brown leaf samples give a significant reduction in friction, particularly in the low speed, boundary regime. 25 These results are in line with those seen here, that lower speed testing shows a more marked reduction in friction. In the same work it was also noted that ‘as the test proceeds a reaction occurs at the steel surface to form a high-viscosity or solid surface film’.
It seems likely that, if the leaf layers had not been removed after the 5th loop of the vehicle, the layer would go on to become more chemically similar to the sample taken from the field. Once this had occurred it could well be the case that the 25-mph testing would have also shown similar deceleration levels. Defensive driving at the higher speed may have affected the deceleration rates, monitoring of the brake application does appear to indicated this is the case. 26 Further research will be undertaken to try to mitigate the impact of defensive driving when examining the data set, the use of the on-board GPS data will facilitate this. 27
Cleaning the line after each 5th loop prevents full formation of a strongly bonded ‘black layer’, however restoring the line to clean state was stipulated by the test site at the end of each test day. This is because the test site uses the track for other vehicles when the brake tests were not being conducted. It is likely that the layer created is akin to the initial formation phase of a full leaf layer. The lack of iron suggests that the leaves have not fully reacted with the railhead, but the majority have been more simply compressed. Leaves exhibit low shear strength which is suspected to be the source of low friction here.
It is also expected that, given time and heat (from train passage or environmental heating) the upper most layer of the rail head would react chemically with the leaves, through a tribochemically catalysed processes. The combination of Fe ions, high pressure and heat will create oxidative conditions at the wheel/rail interface. It is suspected that this oxidation causes the extremely firmly adhered ‘black layer’ observed on the mainline network. This layer is strongly bonded to the rail head and will be far less effective at producing adhesive forces upon a wheel than a standard metal on metal contact would.
Factors associated with field testing
Due to the nature of field testing, some factors are outside of laboratory type, high-level control:
Wheel flats were detected during some of the testing; this is an expected side effect of compromised brake performance on a vehicle without wheel slide protection. However, once a wheel flat had formed, it could not be remedied within the same testing week. The brake applications could not be automated, so relied on the behaviour of individual drivers and their reactions to the braking event. Defensive driving could be seen in some cases: when the driver was aware that leaf layers were deployed, sometimes there was a slower velocity when braking commenced. Enhanced data processing to mitigate these factors is described in Section 4.3 below. As is common with field testing, there were some inevitable changes in weather during testing, which are likely to influence results. The effect of train passage and railhead heating will have influenced the data to a certain degree. This is somewhat difficult to account for, as the leaf layer will act as a natural insulator and alter the thermal activity at the interface. For the leaf layer, thermal effects could be involved in the formation of the ‘black layer’. The wheelsets were not cleaned between runs. The action of the brake block on the running surface appeared effectively to control wheel surface contamination between braking events. The railhead was cleaned with a petrol scrubber to remove strongly adhered leaf derived layers, when required. Conditioning runs would then be used to return the railhead to the ‘dry’ baseline standard.
Data processing
The time at which the vehicle entered the LA zone was known from the GPS data. From the vehicle velocity/time plots, it was clear that the driver had not braked at exactly this time. Data processing using MATLAB was able to account for this to a certain extent, using voltage readings to indicate at which point and how severely the driver had deployed the brakes. The GPS and brake lever data had first to be synchronised.
However, the reaction of the brake system to deployment depended on how recently the brakes had been applied (the compressor took some time to restore pressure in the brake system). This delay could also result in reduced contact time between the vehicle wheels and the leaf layer. This is in addition to the factors that may affect 10 mph testing, such as defensive driving and weather fluctuations/wheel flats. Figure 6 shows that it took about 3 seconds for a significant drop in speed to occur. For future work, to avoid these uncertainties, it is proposed that deceleration is calculated from a speed at which it is certain that the brakes have been applied, e.g. from 9 mph for tests of braking from 10 mph.
Conclusions
Data from field testing confirms that a novel, cost effective methodology has been developed for assessing train-braking performance using a representative low adhesion simulation. The method is aimed primarily at testing the impact on braking on products added to the wheel/rail interface. The following conclusions can be drawn from the work:
The ‘dry rail’ data set can be used as a baseline for comparison with the LA simulants Representative LA layers can be successfully created using leaves Effective and consistent low adhesion was produced when braking at 10 mph Further testing and methodology changes are needed at 25 mph to produce consistent low adhesion Optical inspection of the leaf layer confirmed formation of a ‘black layer’ Chemical analysis of the leaves confirm they contain species relevant to ‘black layer’ and low adhesion Mechanistic insight into full ‘black layer’ formation has been gained, with an intermediate stage in the formation of the layer being proposed.
Footnotes
Declaration of Conflicting Interests
The author(s) declared no potential conflicts of interest with respect to the research, authorship, and/or publication of this article.
Funding
The author(s) disclosed receipt of the following financial support for the research, authorship, and/or publication of this article: The authors would like to acknowledge the funding provided for the work by RSSB.