
Abstract
In the present work, it is studied how the wire electrical discharge turning factors influence the surface integrity and subsequent fatigue life of Inconel 718. Discharge current, pule on time and spindle speed were taken into account as factors while characteristics to be studied are fatigue life, surface roughness, residual stress, and hardness. It was identified that a sample which is machined by discharge current of 5 A, pulse on time of 600 µs and work rotational speed of 250 rpm yields maximum fatigue life about 14,400 cycles. After finding the optimum level, statistical models of responses were also generated to correlate input-output relationship as well to identify which parameters has the greatest impact on performance measures. It was found from the results that fatigue life and residual stress is majorly influenced by pules current; while the surface roughness and hardness are significantly affected by spindle speed and pulse o time, respectively.
Introduction
Nickel based upper alloy has been extensively spreading in rotating parts of jet engine and aircraft manufacturing. 1 As an applicable method, non-conventional machining process such as electrical discharge machining (EDM) can be effectively used for processing of In718.2,3 The process enables to remove material independent of its hardness and strength properties.
Wire electrical discharge turning is known as a recently modification of EDM process that is suitable for processing round bars with complex shape in both of macro and micro sizes. 4 In this process, a rotary unit which is installed on machine table drives a rotary motion in round bars. Then, the wire (as cutting tool) is transmitted within the workpiece through a predefined path which is monitored by CNC unit. 5
The concept of WEDT firstly proposed by Qu et al.6,7 for introducing the setup and analyzing the performance of process in case of material removal rate, surface roughness, and hardness. Further to this study, Haddad and Tehrani8,9 used statistical analysis to evaluate effect of WEDT factors on material removal rate surface roughness and roundness error. Mohammadi et al.10,11 used regression analysis to correlate multiple factors of WEDT factors to material removal rate. They proved that servo voltage is most significant factor influencing MRR. They also applied ultrasonic vibration to the process and proved significant enhancement of MRR. 12 George et al. 13 revealed that by optimizing the process factors micro size round bars Inconel 825 with diameter of 185 µm and length of 4 mm can be accurately produced.
To the basis of authors’ knowledge, studies on surface integrity of machined sample processed by WEDT have not been numerously investigated. As recently published works, Sun et al. 14 introduced a multiple cut strategy in low speed WEDT process to minimize the surface roughness, crack density, and white layer formation as well to increase micro-hardness. George et al. 15 also studied mechanism of surface generation and crater formation in WEDT of Inconel 825.
Nevertheless, there are a few number of works which studied surface integrity aspects of WDET process, fatigue life of Inconel 718 which is produced by WEDT has not been studied yet. As the fatigue life is significantly influenced by surface integrity; in the present study, effect of discharge current, pule time, and spindle speed on surface roughness, micro hardness, and residual stress are firstly studied. Then, the obtained results are subsequently used to justify variation of fatigue life versus aforementioned parameter. Finally, the sample with optimum setting is machined and its fracture surface is discussed.
Experiments
Materials and setup
The material used in this study is Inconel 718 that is treated by solution method. The mechanical properties of wokpiece includes 1503 MPa UTS, 1365 MPa YS, 410 Vickers hardness, and 19.3% elongation at break. The samples were prepared in the size of cylinders with 112 mm length and 12 mm diameter. The prepared samples were then subjected to WEDT to achieve fatigue test samples as shown in Figure 1.
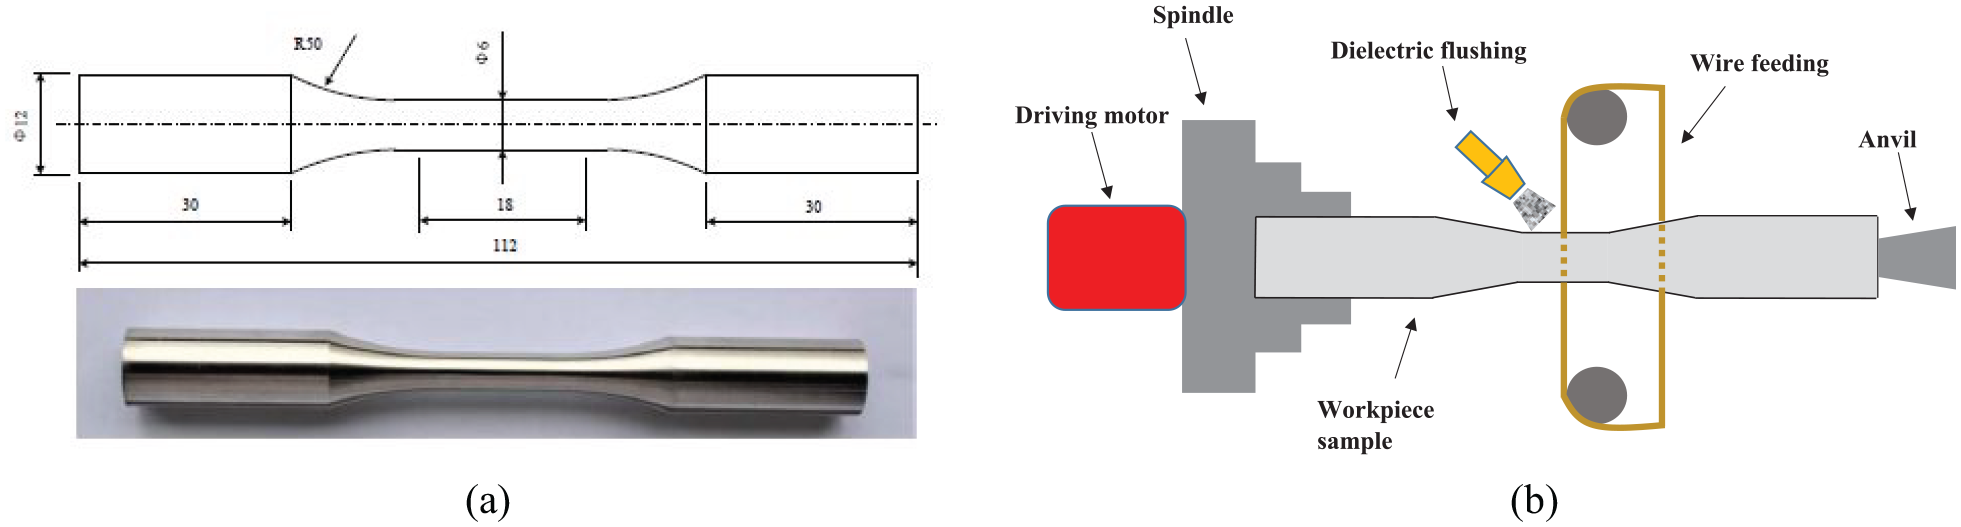
(a) Fatigue sample which is machined by WEDT and (b) schematic diagram of process.
Wire electrical discharge turning tests have been carried out on EKRAM die wire EDM machine modified by rotary attachment. The turning unit includes a DC motor, belt and pulley deriving system, and a chunk. The machining path has been simulated in linked POWERMILL computer numerical control software in according to shape of sample.
Measurement
Surface roughness of machined specimens was measured by means of Mahr surface profilemeter with 0.05 mm cut off. The measurement has been carried out in five random locations in outer surface and the average value was reported.
To analyze and measure the recast layer thickness, the samples were cross sectioned and then subjected to scanning electron microscopy (SEM) analysis using TESCAN microscopic with 5000× magnification.
The samples were polished and then subjected to Vickers micro hardness testing in different depth where the distance between each indentation was 100 µm.
In order to analyze the residual stress, X-ray diffraction analysis were carried out using Stresstech XRD machine using Cr-Kβ tube. Through depth residual stress was measured through removing of 0.1 mm layer from the surface and subsurface layers by means of electro-polishing method.
The machined samples in shape of fatigue test standard (as shown in Figure 1(a)) were subjected to high frequency fatigue testing machine SANTAM with maximum frequency of 300 Hz and maximum load of 50 kN. The machine was regulated to produce sinusoidal load with the maximum stress, stress ratio, and frequency of 1380 MPa, 0.1, and 90 Hz, respectively. The number of cycles was recorded as fatigue life when the specimen fractured.
Methods
The experimental method in the present study is majorly focused on finding effect of pulse current (5, 10, and 15 A), pulse on time (600, 800, and 1000 µs), and spindle speed (50, 150, and 250 rpm) on fatigue life and surface integrity analysis. The reasons for selection of defined ranges can be found as follows:
The defined range for finding effect of discharge current is from 5 to 15 A with increment of 5 A. The value less than 5 A causes very long machining time. Also, the value higher than 15 A results in very rough surface and it causes drastic reduction of fatigue life that cannot be analyzed through systematic design of experiments.
The selected range for analyzing effect of pulse on time is from 600 to 1000 µs with increment of 200 µs. Value less than 600 µs long machining time results in very long machining time that is costly for production. On the other hand, the value further than 1000 µs results in excessive heat input and very poor surface integrity that makes the fatigue life machined sample non-comparative with the samples machined in the range of 600 to 1000 µs.
The defined range of spindle speed is from 50 to 250 rpm with increment of 50 rpm. When the spindle speed is less than 50 rpm, dimensional deviation as result of overcut occurs in the samples. On the other hand, when the spindle speed is further than 250 rpm, as result of high turbulent, flushing efficiency is restricted that influence the MRR and surface integrity.
In order to conduct the experiments, parameters such as pulse off time, open arc voltage, and servo feed voltage were kept constant at 100 µs, 100 V, and 40 V, respectively.
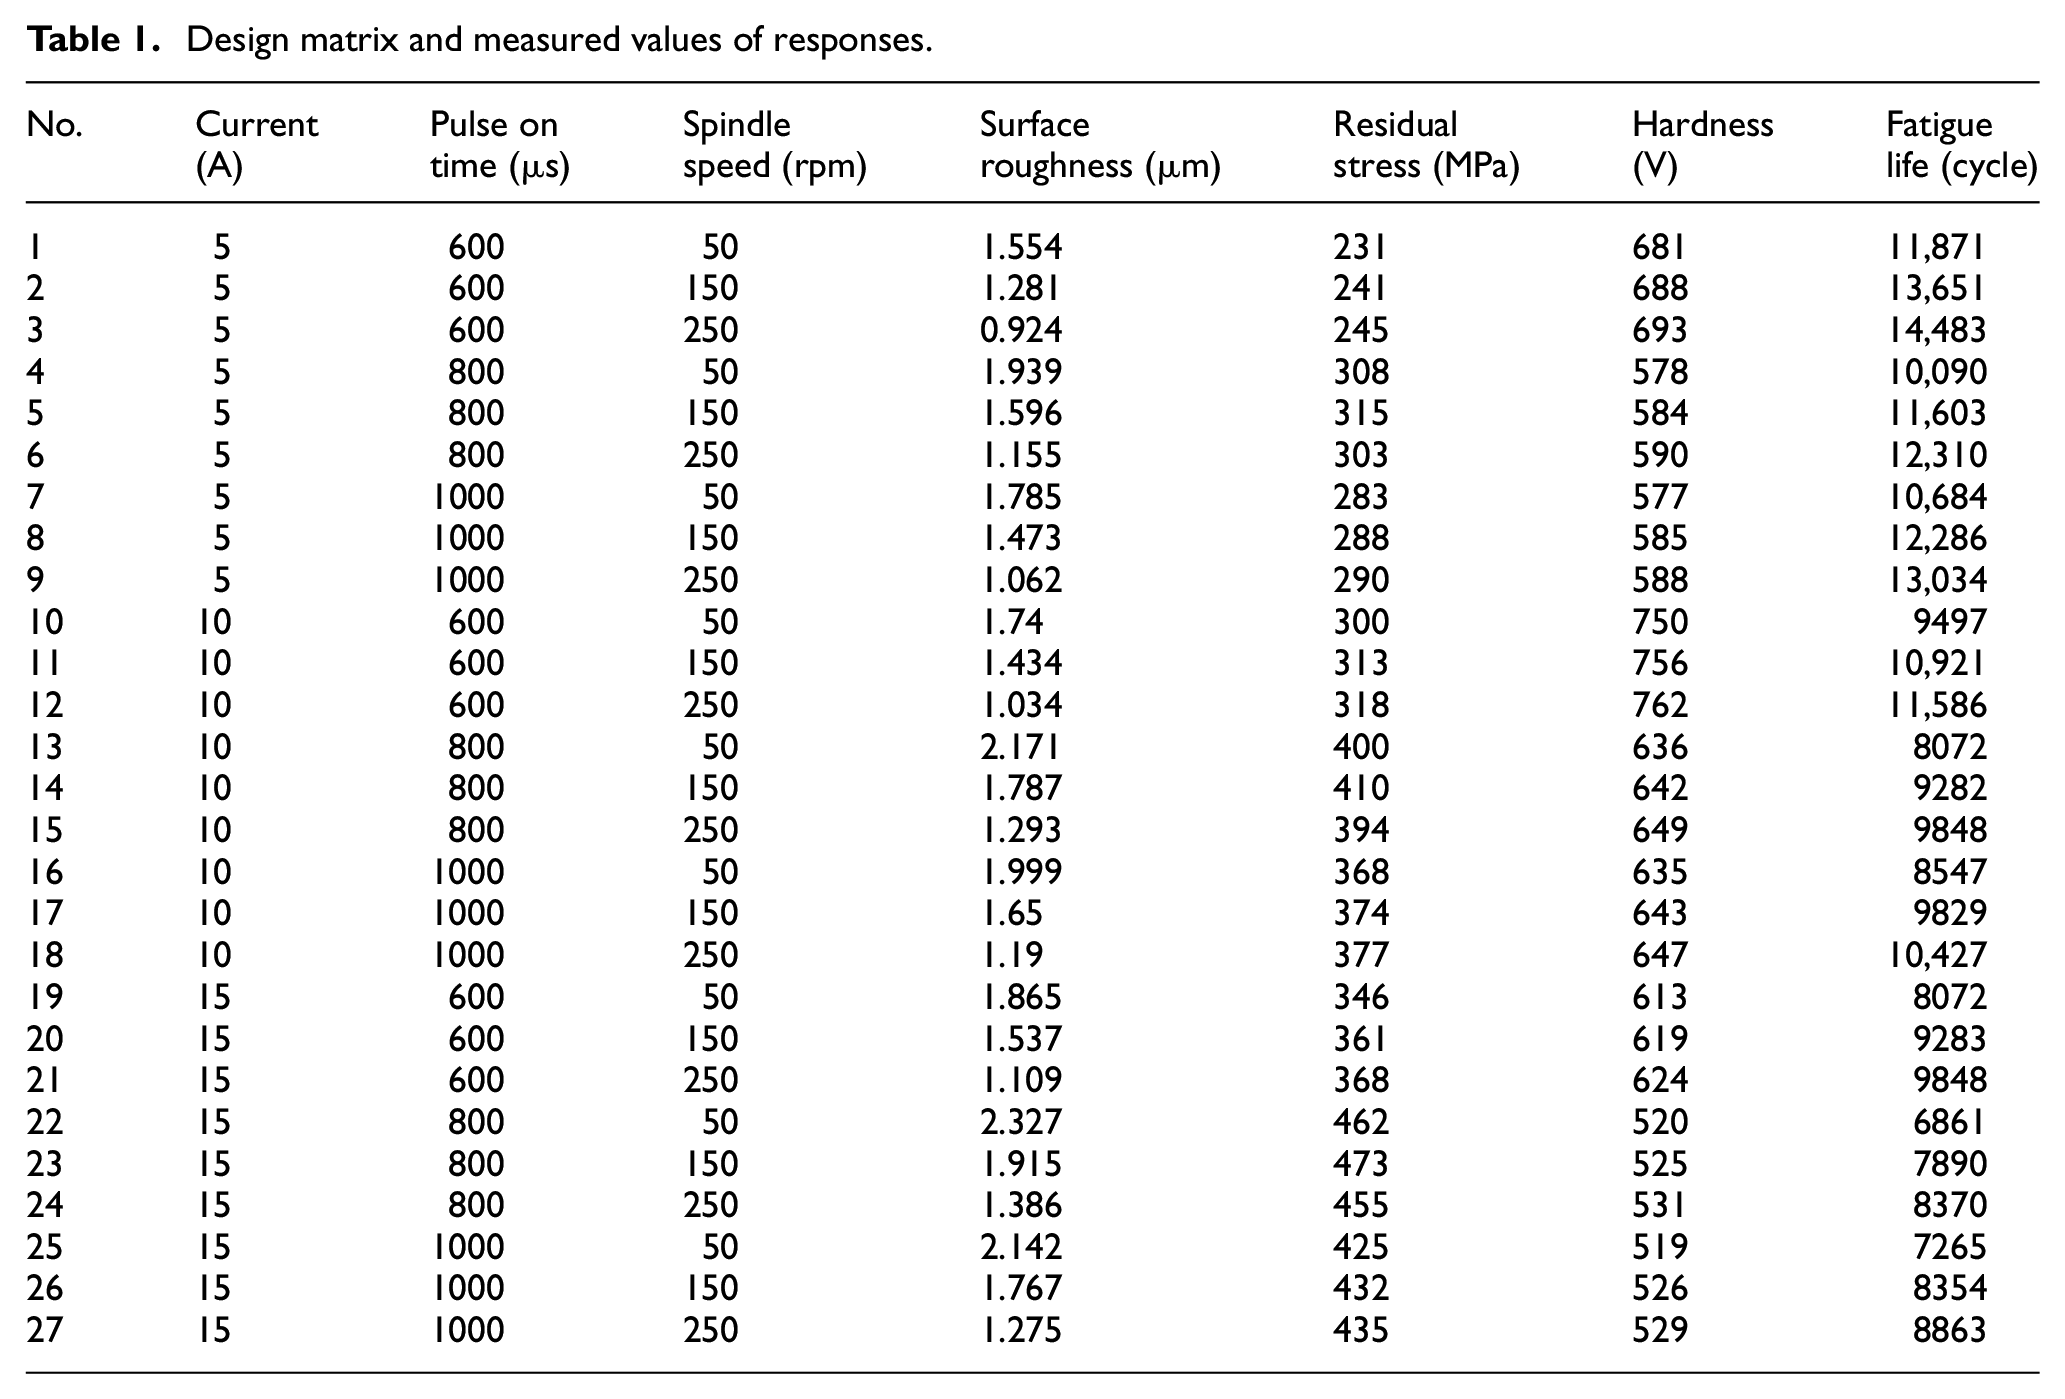
In order to study the parametric influence, and develop a model for incorporating effect of process factors on surface integrity and fatigue life, number of 27 (i.e. 33) experiments based on full factorial design were carried out. Table 1 illustrates experimental design matrix and measured values of surface roughness, residual stress, hardness, and fatigue cycles.
Design matrix and measured values of responses.
Results and discussion
Effect of pulse current
Figure 2(a) represents effect of discharge current on fatigue life. It is seen from the figure that as the discharge current increases, the low cycle fatigue life of sample is drastically reduced. As, the fatigue life is majorly influenced by surface integrity aspects; to understand effect of pulse current on fatigue life; its effect on surface integrity aspects that is surface roughness, residual stress, and hardness are carefully studied.
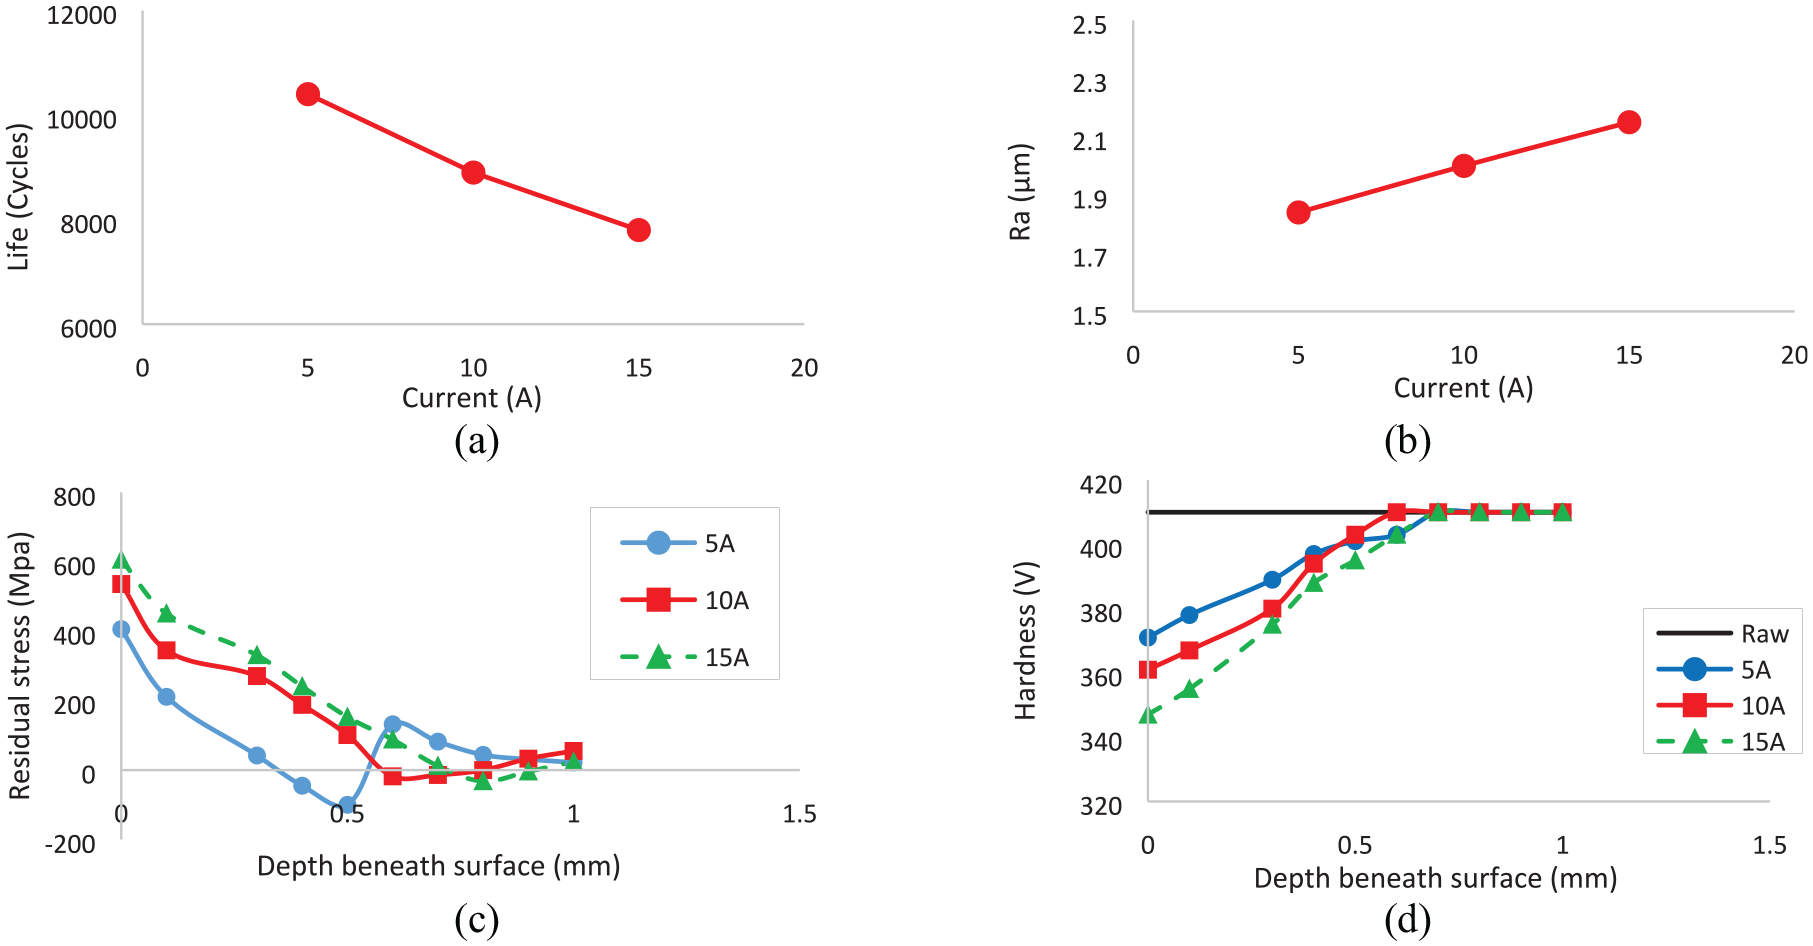
Effect of discharge current on: (a) fatigue life cycle, (b) surface roughness, (c) residual stress distribution, and (d) hardness.
Figure 2(b) illustrates influence of pulse current on surface roughness. It is clear from the figure that the surface roughness increases by increase of current. Increasing the current may lead to inducing more thermal power to the surface. Subsequently, the formed craters are deeper and have greater opening radii.16,17 In order to support this claim, the 2D graph of discharge crater under different values of discharge current were observed and presented in Figure 3(a). It is seen from the figure that as discharge current increases, both the radius and depth of discharge crater are increased. According to the research carried out by Ming et al., 18 arithmetic surface roughness in WEDM process can be obtained by:
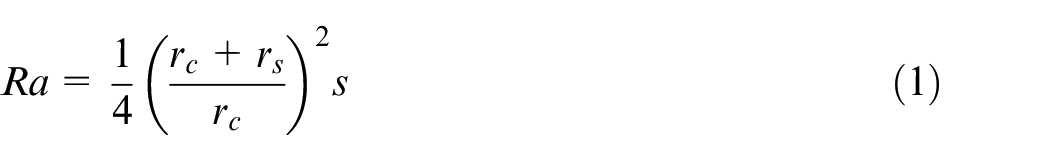
where rc is radius of crater and s is its depth. it can be inferred from the equation that increase of discharge crater directly influence formation of rougher surface. Nevertheless, further value of pulse current results in larger diameter of crater opening, the effect of crater depth in more dominant. Thus, the surface roughness increases by increase of discharge current. Similar results have been reported by Jadidi et al. 19 and Bagherian et al. 20 in electrical discharge turning process.
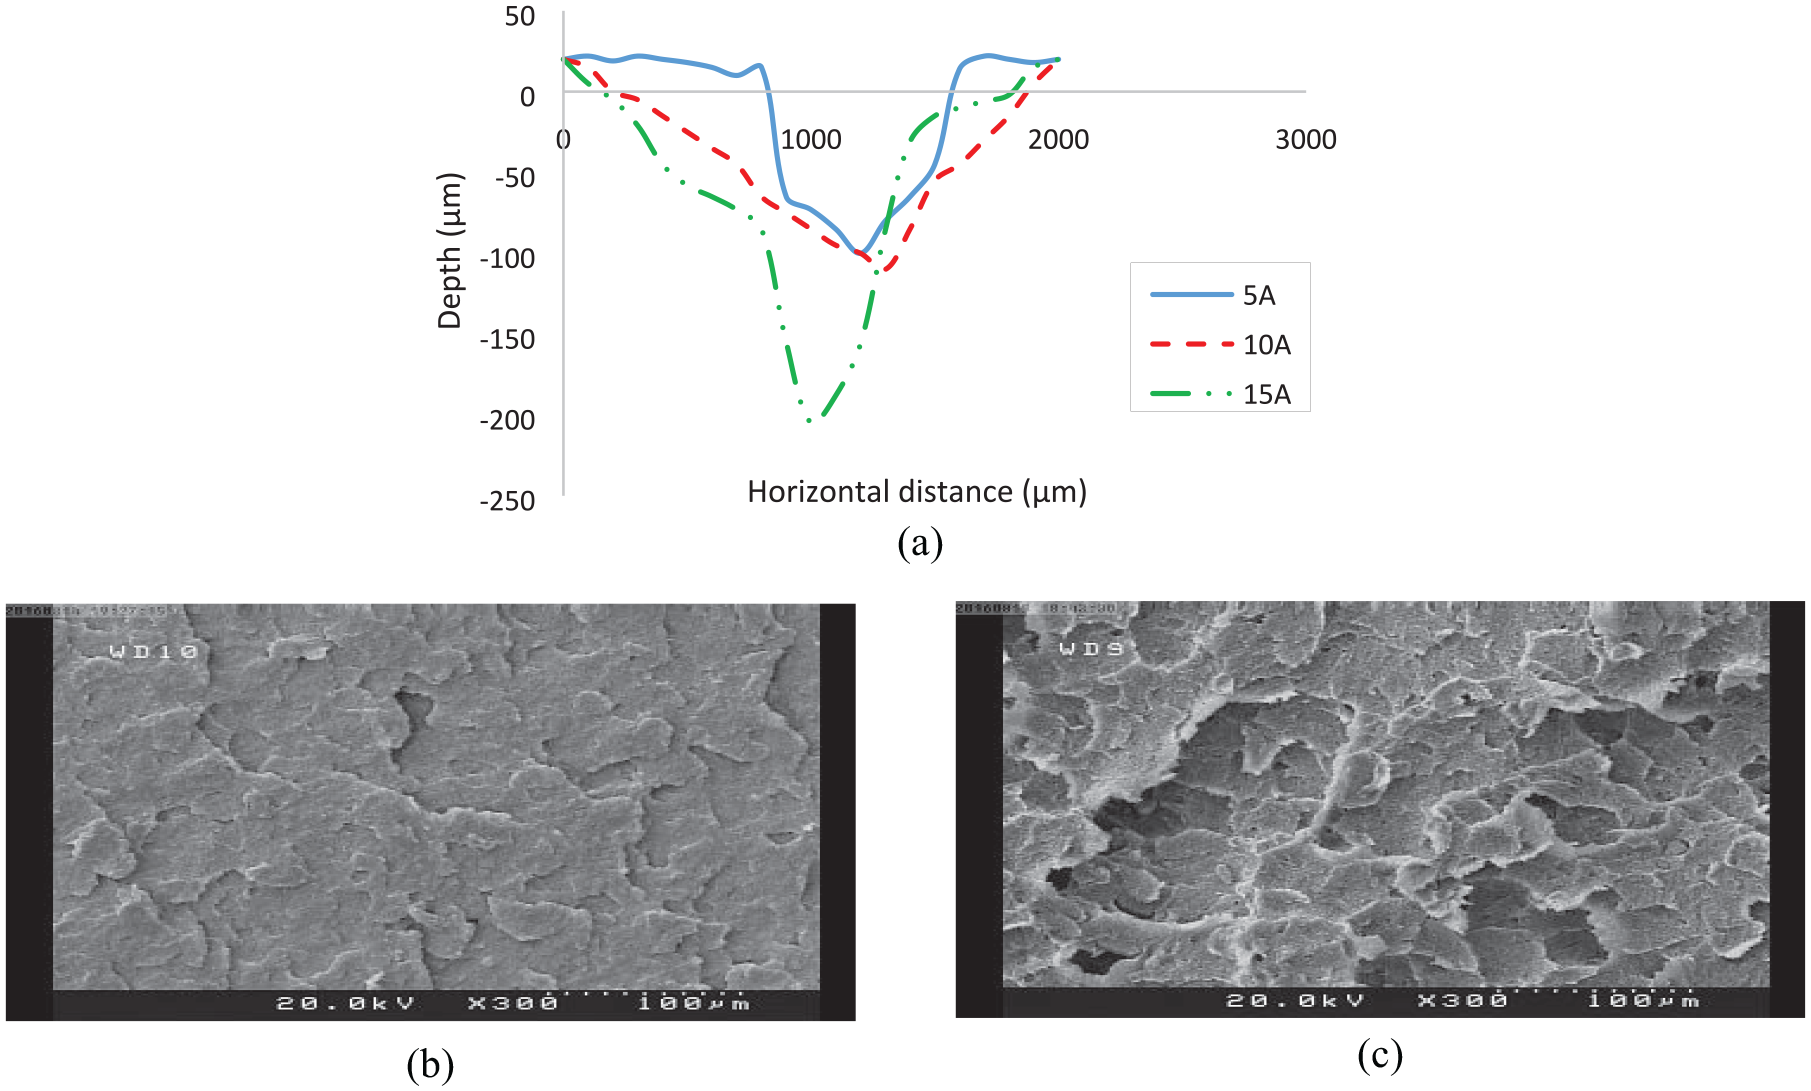
(a) Comparison of discharge crater profiles under different values pulse current, (b) SEM image of machined sample at 5 A discharge current, and (c) SEM image of machined sample at 15 A discharge current.
Another factor that should be taken into account in analyzing the fatigue life is variation of through depth residual stress. Figure 2(c) demonstrates distribution of residual stress under different vales of discharge current. As discharge current increases, the amount of tensile residual stress in surface and subsurface layers is increased. Also, it is seen that the value of compressive residual stress in the layers beneath the surface is decreased by increase of discharge current. The thermal energy is directly increases by increasing the current. It is reported in many literatures that the thermal load is one of main source of tensile residual stress in manufacturing processes such as conventional cutting, 21 and thermal based unconventional processes 22 etc. Thus increase of discharge current causes the distribution of residual stress tend to be more positive values. This increase in value of tensile residual stress leads to acceleration of fatigue crack propagation and reduces the life time.
On the other hand, it is clear from the Figure 2(c) that increase of discharge current results in distribution of tensile residual stress in further depth. The more thermal energy causes by high discharge current increases the size of recast layer and heat affected zone where they are source of tensile residual stress. Therefore, the crack propagation which is generally initiated from the surface can be quickly propagated through regions with tensile residual stress. Thus, the fatigue life is decreased drastically by increase of discharge current. Effect of discharge current on residual stress distribution of EDMed surface has been studied by Azhiri et al. 23 They also proved that increase of discharge current results in further value of tensile residual stress which spreads in deeper layers.
Figure 2(d) represents hardness distribution of the machined specimens under different values of discharge current. It is seen that increase of discharge current leads to reduction of magnitude of the hardness as well it causes increase of the depth of softened area. Figure 3(b) and (c) demonstrates SEM image of machined surface. It is seen as result of consecutive melting and solidification, porous structure is generated in sample’s surface. It is clear that the condition would be worsen as result of increase in discharge current. Formation of porous and layered structure as result of high thermal energy results in porous and soft structure. Subsequently, the hardness is drastically reduced.
Accordingly, coarser surface, further thermal residual stress, and low hardness caused reduction of fatigue life by increase of discharge current.
Effect of pulse duration
Figure 4(a) demonstrates effect of pulse on time on low cycle fatigue life of machined samples. It is seen that increase of pulse on time from 600 to 800 µs results in reduction of fatigue life up to 19%; however, by further increase of pulse on time and reaching to 1000 µs, the fatigue life is enhanced about 6.7%. In order to seek the reasons for such behavior, it is necessary to understand how the pulse duration influences variation of surface roughness, residual stress values and micro-hardness distribution.
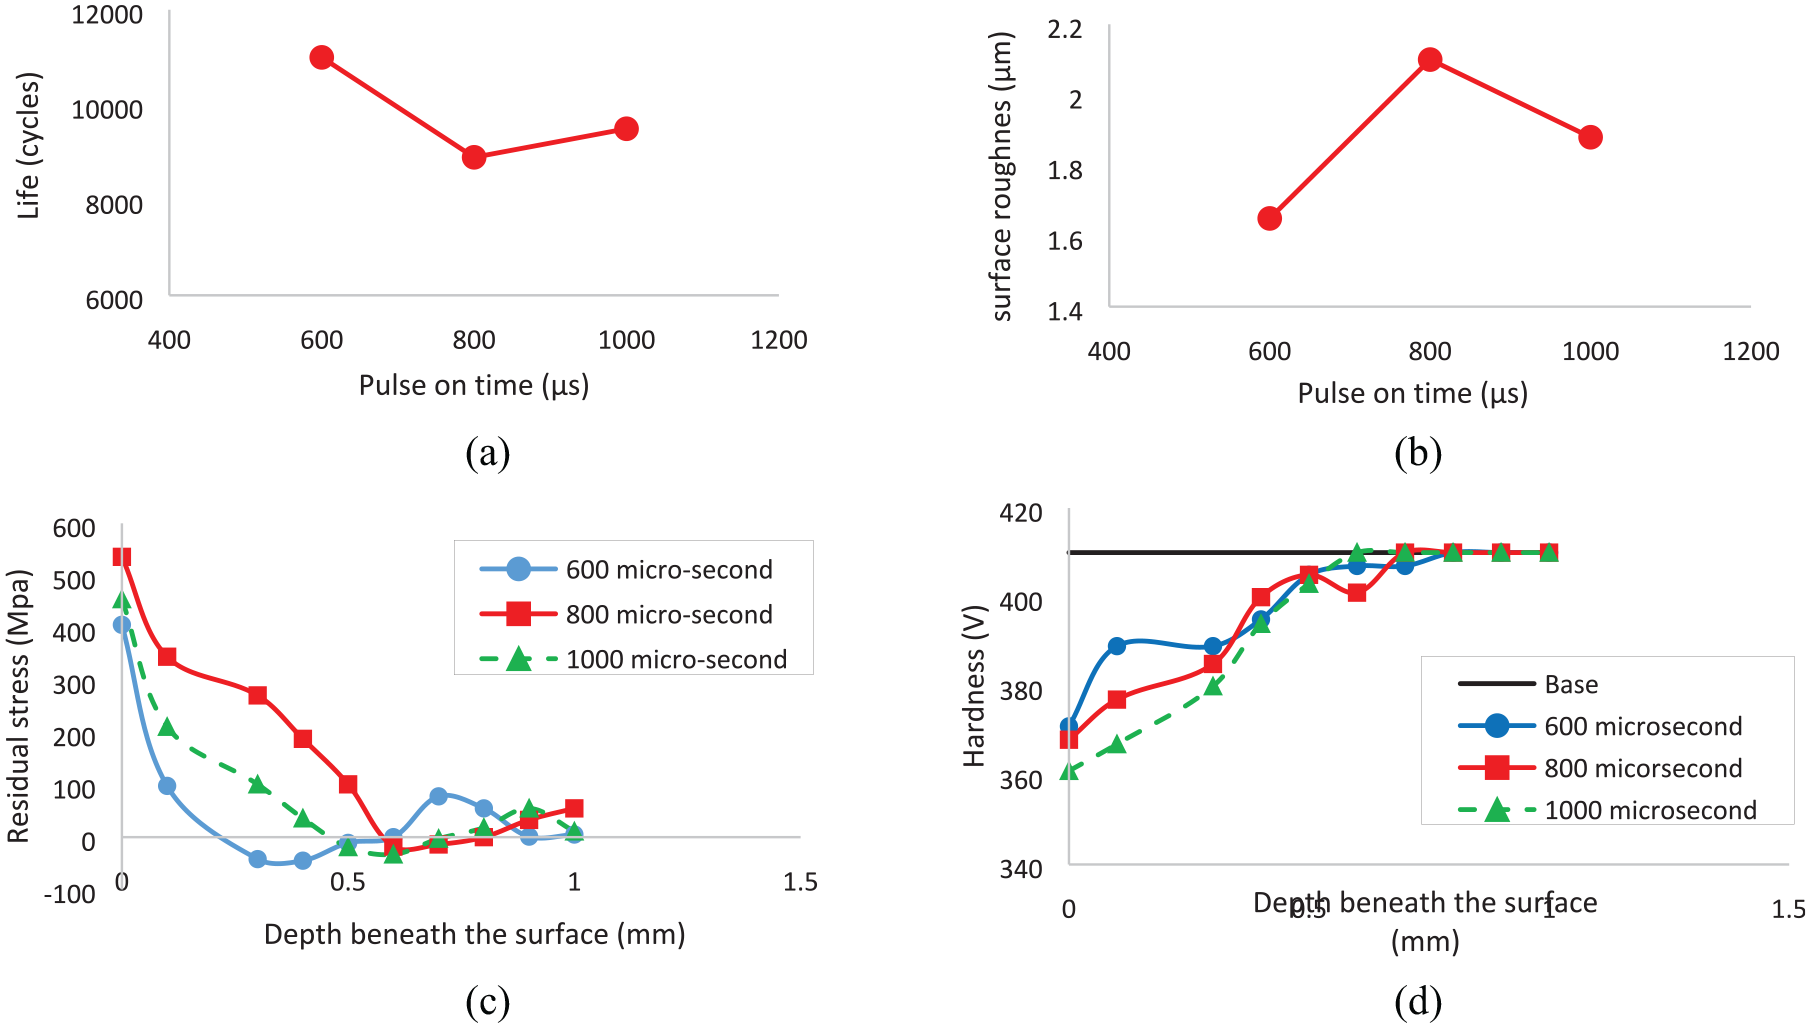
Effect of pulse time on: (a) fatigue life cycle, (b) surface roughness, (c) residual stress distribution, and (d) hardness.
Figure 4(b) reveals the effect of pulse duration in surface roughness. It is inferred that surface roughness is firstly increased about 31% by increasing the pulse duration from 600 to 800 µs. As the pulse duration goes further than 800 µs and reaches to 1000 µs, the surface roughness decreases about 10%. It can be inferred that the surface roughness of sample at 1000 µs is 10% further than that of 600 µs. The behavior of variation of surface roughness by pule on time can be studied through formation of discharge crater. Further thermal load as result of more pulse time results in melting and evaporation of more material in discharge crater. This condition results in formation of deep cavities in the surface that increases surface roughness. When the pulse time exceeds 800 µs and reaches 1000 µs, the plasma channel is expanded due to accumulation of high energy ions. In such condition, the barreling form of plasma channel leads to formation of craters with shallow depth and large diameter.24,25 Considering to equation (1), it can be inferred that the surface roughness increases by increase of pulse on time up to 800 µs as result of further crater depth; and then decreases (in pulse on time of 1000 µs) due to reduction of crater depth and increase of opening diameter. In order to support this claim, the 2D profile of discharge crater has been obtained and presented in Figure 5(a). It is seen from the figure that at pulse on time of 800 µs, the depth and opening diameter of discharge crater are respectively 165 and 1073 µm. The values greater than those formed by 600 µs that results in rougher surface. On the other hand, as the pulse on time reaches to 1000 µs, the depth and opening diameter are 134 and 1186 µm, respectively.
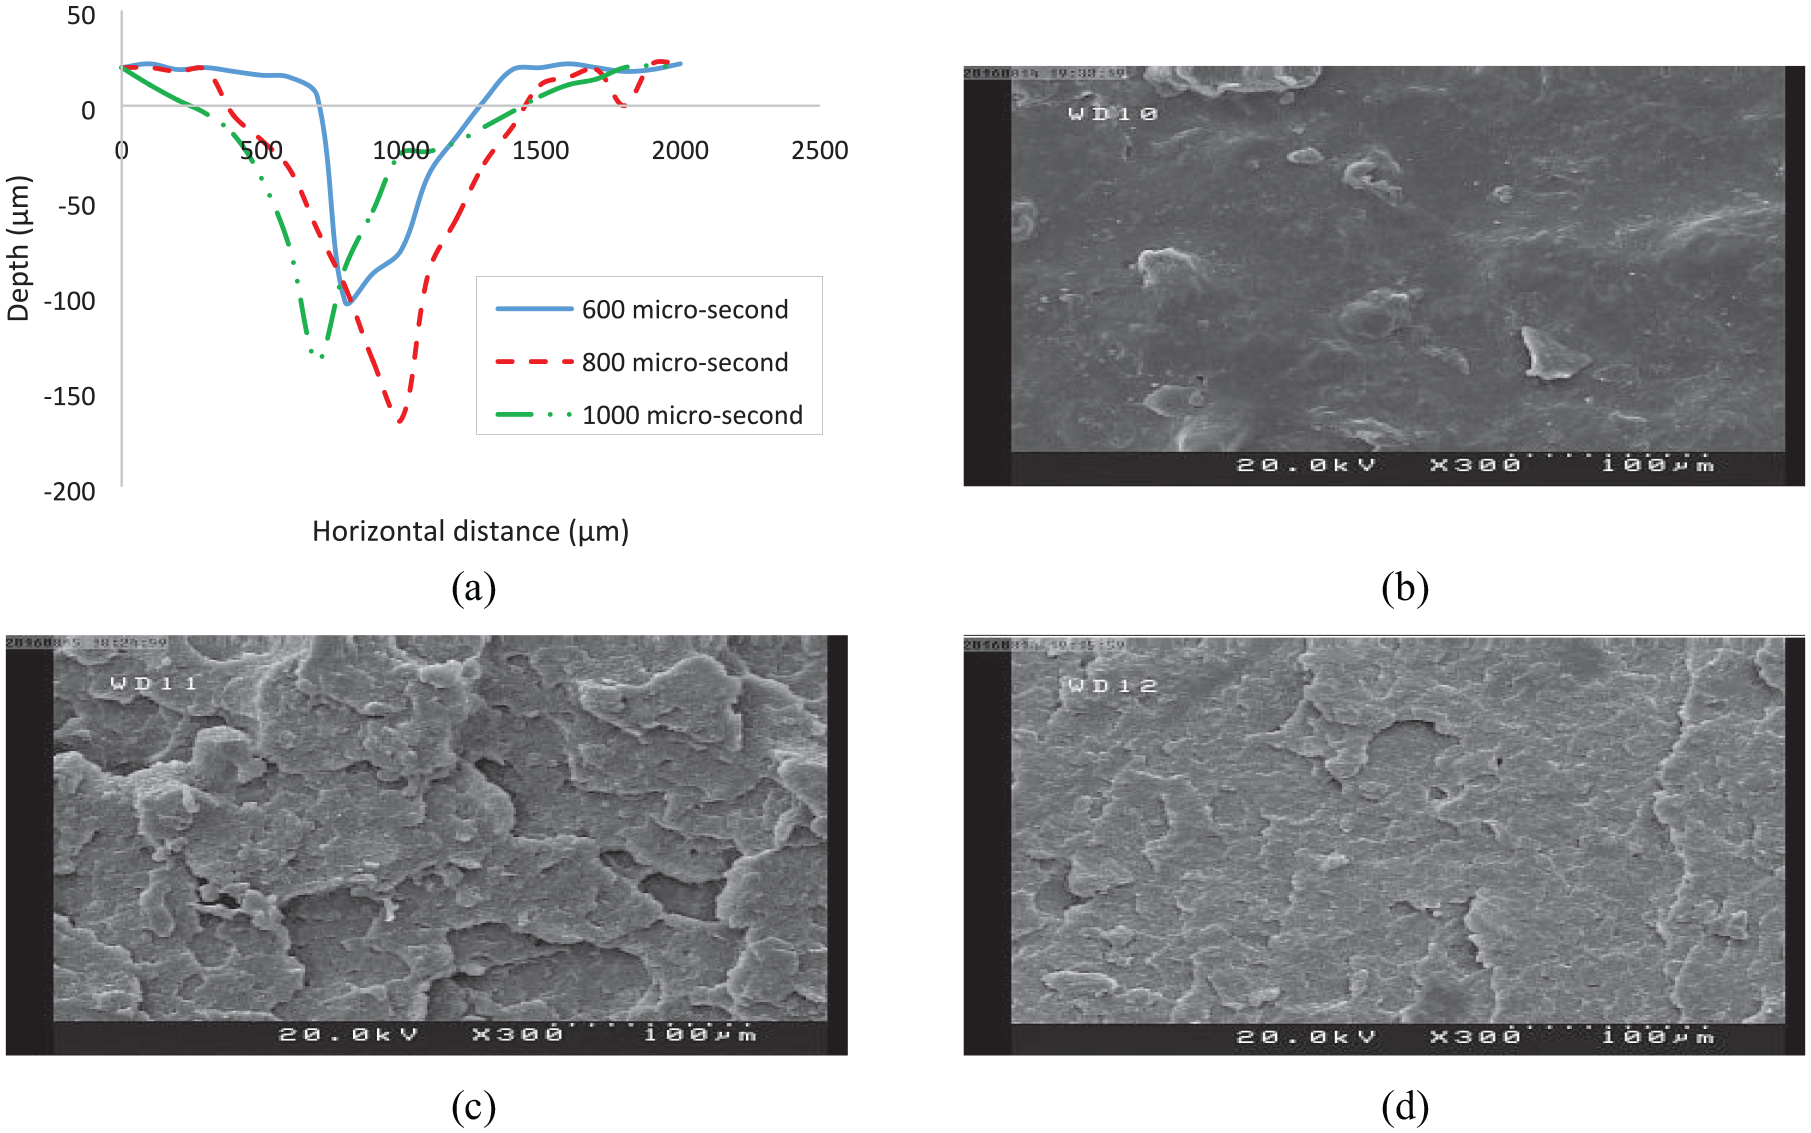
(a) Comparison of discharge crater profiles under different values pulse time, (b) SEM image of machined sample at 600 µs pulse on time, (c) SEM image of machined sample at 800 µs pulse on time, and (d) SEM image of machined sample at 1000 µs pulse on time.
Figure 4(c) shows effect of discharge current on through depth residual stress distribution. It is seen that as the pulse time increases from 600 to 800 µs, the magnitude of tensile residual stress increases due to increase of thermal loads that produces tensile type of residual stress. On the other hand, by increase of pulse on time from 800 to 1000 µs, the tensile residual stress is slightly decreased. Expansion of plasma channel at very high pulse on time results in decrease of energy density which leads to reduction of thermal load. Thus, the residual stress decreases. It is also seen from the figure that increase of pulse on time from 600 to 800 µs results in distribution of tensile residual stress in deeper layers. This condition accelerates crack propagation during fatigue testing. On the other hand, as the pulse on time increases up to 1000 µs, it is seen that the depth where the tensile residual stress expanded is reduced due to less thermal energy density. Thus, the propagation of fatigue crack can be decelerated and fatigue life enhanced.
Figure 4(d) demonstrates effect of pulse on time on through depth hardness distribution of the machined specimens. By increasing the pulse duration, hardness values are reduced as result of excessive thermal load. The present behavior can be attributed to two facts. One is due to formation of porous structure as a result of subsequent melting and solidification. In such condition the surface hardness is significantly decreased. The second is as result of material softening. It is well accepted that excessive heat input may lead to grain coarsening and reduction of material strength against penetration of mechanical load. Subsequently, the surface hardness decreases.
Figure 5(b) to (d) shows SEM image of machined surface under different values of pulse on time. For the samples prepared by 600 µs pulse duration (Figure 5(b)), the surface is completely smooth and amount of layered structure is limited. Excessive layered structure and cracks are formed in the surface of the sample machined by 800 µs pulse duration (Figure 5(c)) that results in formation of porous structure and increase in crack density that deteriorates hardness. Also, the sample which machined by 1000 µs contains smoother structure compared to that WED turned by 800 µs. According to what is shown by comparing Figure 5(c) and (d), it can be inferred that the degree of porosity and crack density in the surface of the sample decreases by increase of pulse time from 800 to 1000 µs. It corresponds to improvement of fatigue life of sample when the current reaches from 800 to 1000 µs.
It is also evident from the Figure 4(d) that the depth of softened layers increases by increase of pulse on time from 600 to 800 µs. In other word, due to more thermal energy, the heat affected zone is spreading in deeper layers and results in increase of the depth of softened zone. However, by increase of pulse on time to 1000 µs, due to reduction of energy density, the depth of heat affected zone is decreased that restricts softened area.
According to aforementioned explanation the fatigue life of the sample machined at 800 µs is less than those manufactured at 600 and 1000 µs due to rougher surface finish, further value of tensile residual stress and less hardness.
Effect of spindle speed
Effect of workpiece rotational speed on fatigue life has been presented in Figure 6(a). According to the figure, it is seen that the fatigue life of the machined sample increases by increase of work rotational speed. In order to analyze the results, surface quality, residual stress distribution, and hardness of the machined specimens are analyzed as follows:
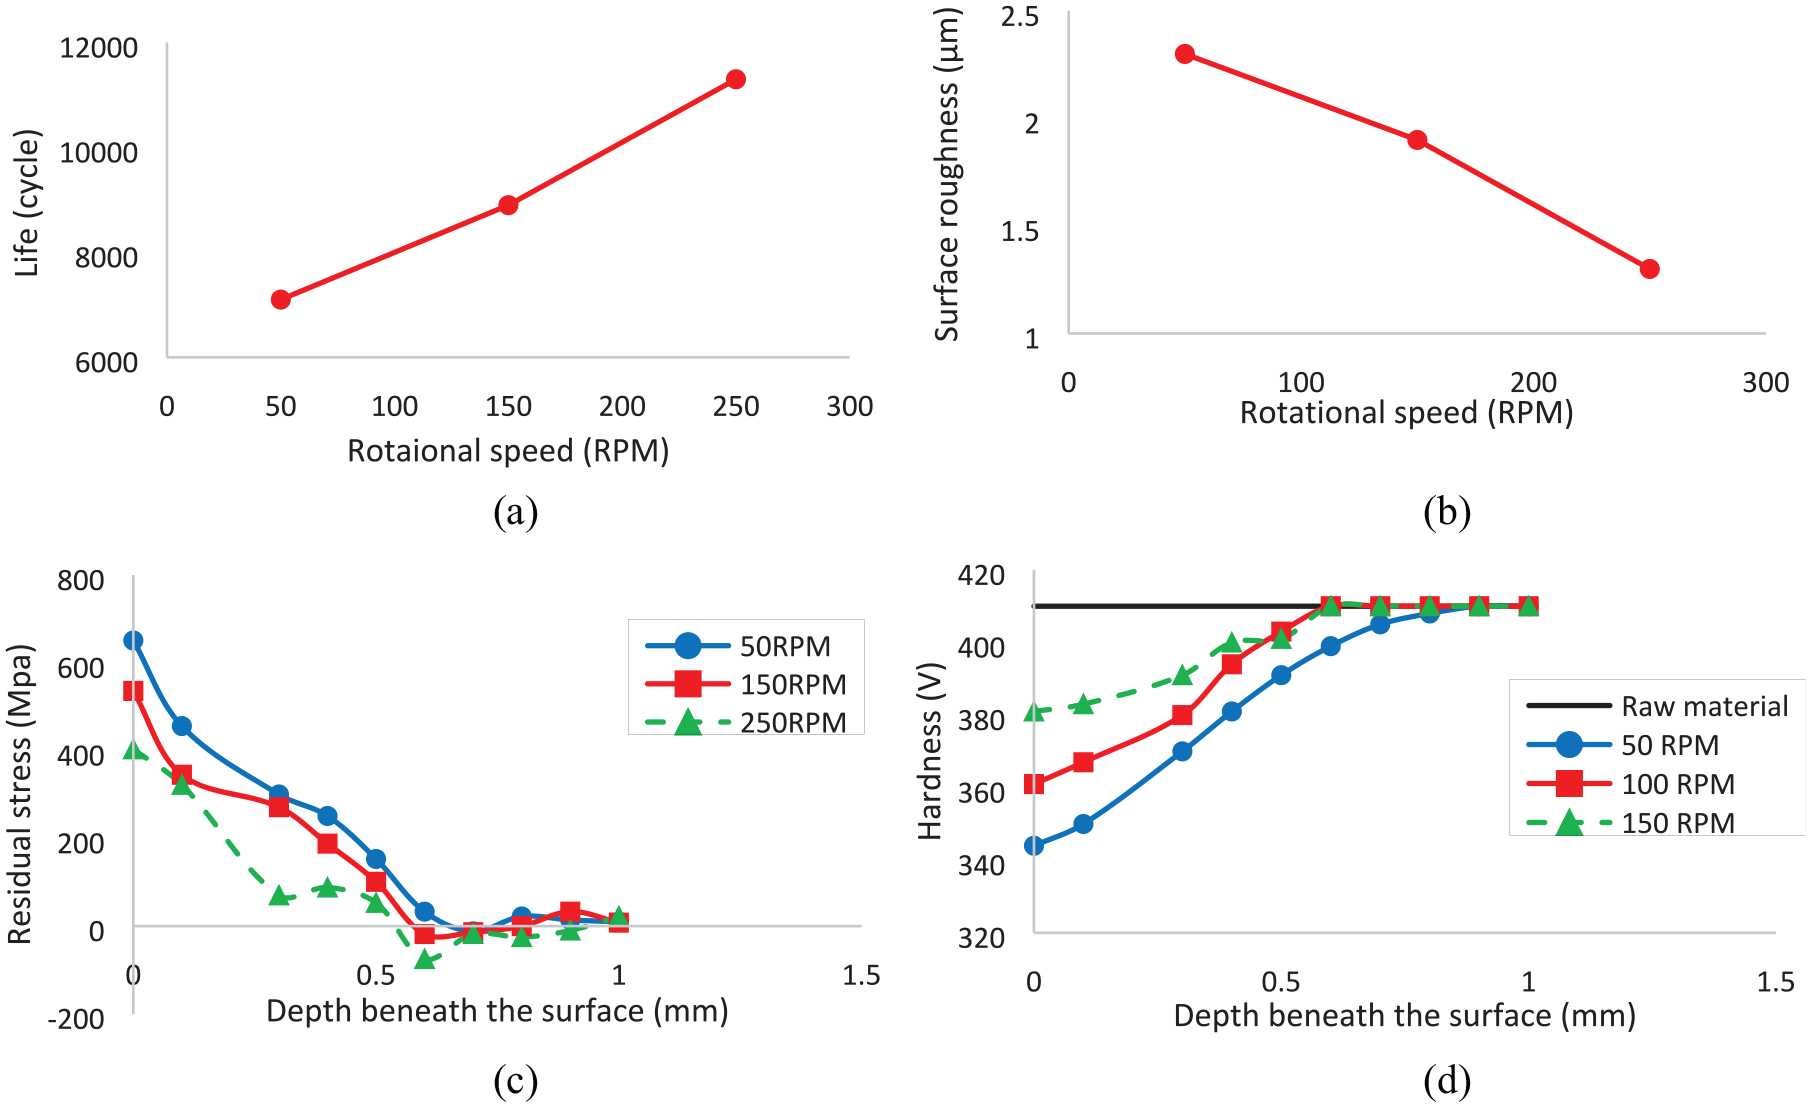
Effect of spindle speed on: (a) fatigue life cycle, (b) surface roughness, (c) residual stress distribution, and (d) hardness.
Figure 6(b) illustrates effect of work rotational speed on surface roughness of machined samples. According to the figure, the surface roughness decreases by increase of spindle speed. This effect can be attributed to a factor namely the circumferential rate of induced energy. In thermal cutting processes which material removal is based on the rotation of workpiece (such WEDT), the circumferential rate of induced energy refers to amount of energy which is applied to a specific point. It can be calculated by dividing the energy to circumferential speed of workpiece, that is spindle speed. As result of increasing the spindle speed, the circumferential rate of induced energy is decreased and leads to inducing less thermal load to the surface.19,20 The less amount of thermal energy leads to shallower discharge craters which reduces the surface roughness. In order to support this claim, the 2D profile of formed craters for different values of discharge current were obtained and presented in Figure 7(a). For the sample machined by 50 rpm spindle speed, it is seen that the depth and opening of discharge crater are 155 and 973 µm, respectively. As the spindle speed increases to 150 and 250 rpm, the depth of discharge crater reaches to 134 and 78 µm, respectively. As result of this increase, the opening diameter of formed crater reaches to 1151 and 1700 µm for spindle speed of 150 and 250 rpm, respectively. As the size of discharge crater mainly determines the surface roughness, from what presented in equation (1), it can be inferred that how increase of spindle speed contributes to reduction of the surface roughness.
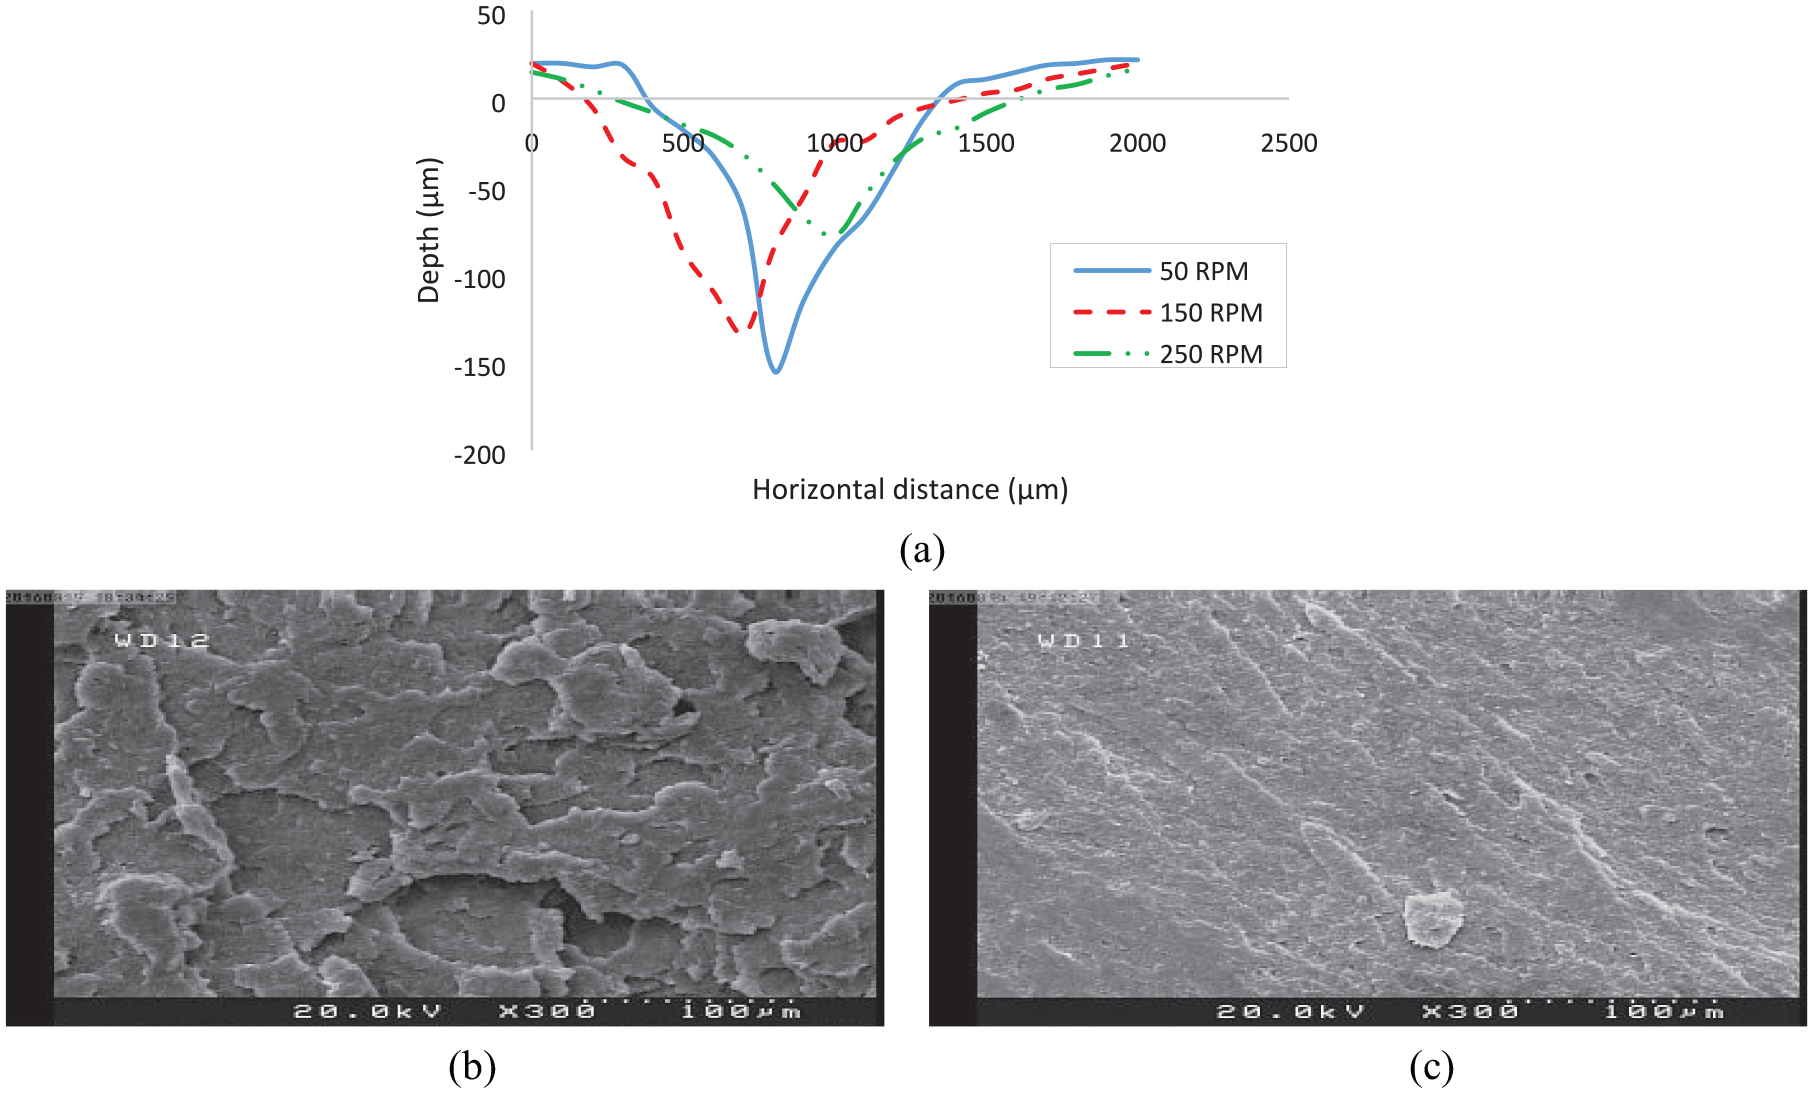
(a) Comparison of discharge crater profiles under different values spindle speed, (b) SEM image of machined sample at 50 rpm spindle speed, and (c) SEM image of machined sample at 250 rpm spindle speed.
According to the Figure 6(c), it is seen that by increase of rotational speed from 50 to 250 rpm the magnitude of tensile residual stress deceases. According to what discussed above, the increase of rotational speed causes increase of cooling rate; in such condition the thermal load which causes tensile residual stress is restricted and yield its reduction. It is also seen from Figure 6(c) that the depth where the tensile residual stress is spread reduces. As a result of reduction of point energy (caused by further rotational speed) the depth of thermal affected zone which includes large value of tensile residual stress is restricted. Thus, increase of rotational speed of the workpiece results in reduction of point energy and subsequent decease in value of tensile residual stress and its influential depth.
Figure 6(d) depicts variation of through depth hardness versus rotational speed. As a result of further speed, circumferential rate of induced thermal energy is subsequently reduced. This causes prevention of softening of material due to thermal load.
Figure 7(b) and (c) show the microscopic image of machined surface including recast layers, cracks and porosities. It is seen that the volume of layered structure is decreased by increasing the spindle speed. As mentioned above, the circumferential energy rate decreases by increasing the speed. Subsequently damaging behavior of discharges are restricted as the spindle peed increased. Comparing Figure 7(b) shows that sample machined by 50 rpm has completely rough surface with a lot of cracks and layered structure. This condition results in formation of porous structure of machined sample that reduces hardness and subsequent fatigue life. On the other hand, sample that is machined by spindle speed of 250 rpm (Figure 7(c)) consists of smooth surface with limited crack density and nucleation center. The porosity level as result of reduction recast layer is decreased that yields further hardness.
Additionally, by increase of work rotational speed, due to reduction of point energy the depth of hat affected zone is decreased. Therefore, the softened zone due to thermal energy is restricted and hardness reduction is spread in shallower depth.
It can be concluded that selection of 250 rpm work rotational speed results in finer surface finish with lower crack density, less tensile residual stress in shallower depth, higher hardness as well shallower heat affected zone. The integration of these reasons causes maximizing of fatigue life at rotational speed of 250 rpm.
Analyzing the fracture surface of optimum sample
According to the discussed results in previous sections, it can be inferred that selection of 5 A discharge current, 600 µs pulse on time and 250 rpm rotational speed can be introduced as an optimum parameter setting that maximizes the fatigue life. Thus, an experiment with abovementioned optimum parameter setting was carried out and subjected to fatigue life. It is found from the results that the number of cycles until failure for optimum sample is 14,400. The fracture surface of the sample has been shown in Figure 8. It is seen from the surface (Figure 8(a)) that the crack source is in periphery of the sample. The shear lip is dominant mechanism of crack initiation that begins from surface of the samples. However, number of locations where fatigue crack is initiated is low. This is due to the fact that at optimum processing condition the surface roughness is low that reduces the locations for stress intensity.
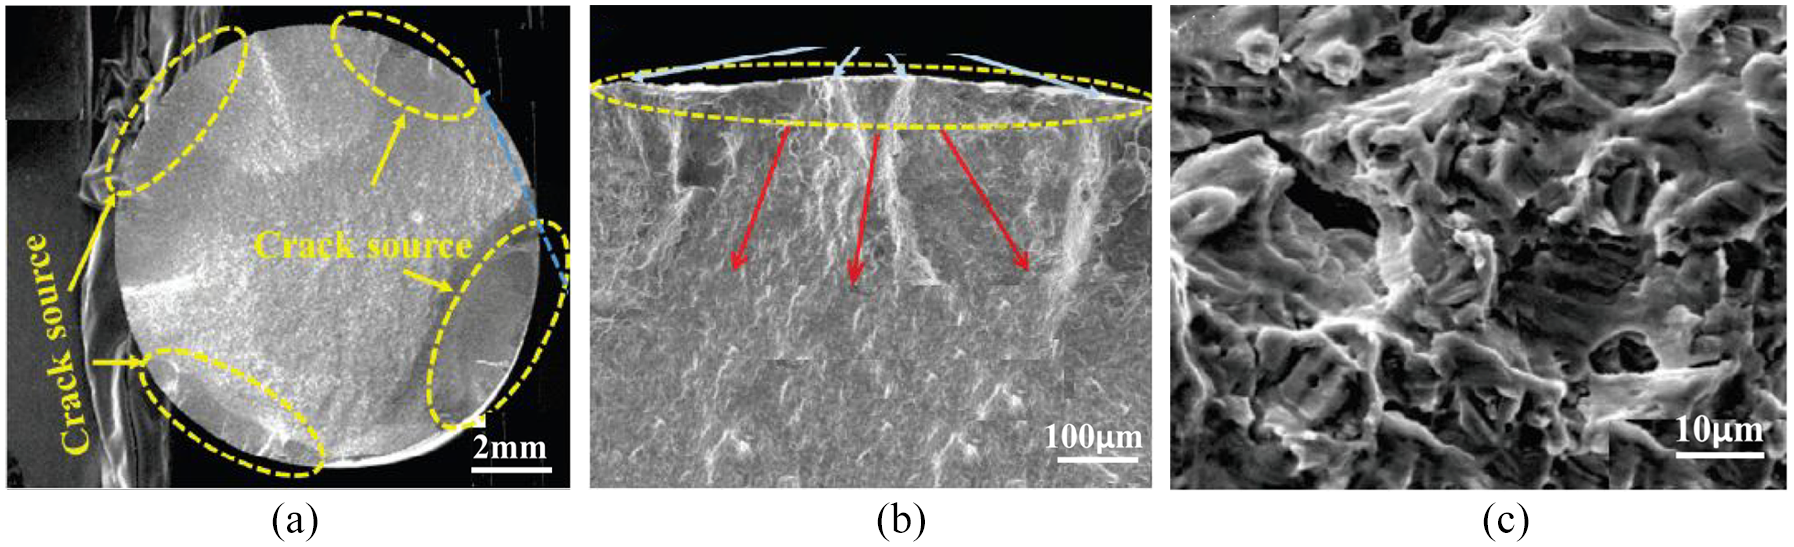
Microscopic image fracture cross section of optimum sample: (a) crack nucleation, (b) direction of propagation, and (c) transient zone.
From the Figure 8(b), it is seen that the fracture propagation is restricted in subsurface layers as the residual stress changes from tensile to compressive in near surface layers. On the other hand, at optimum processing condition, the value of tensile residual stress is significantly reduced that results in restriction of crack propagation. Figure 8(c) demonstrates the striations of fatigue surface at optimum level. It is seen from the figure that the striation spacing is relatively high that implies fatigue crack propagation is far from the surface for optimum sample. According to experimental measurement, it was found that the striation spacing for optimum sample is 2.245 µm and crack propagation for 300 µm distance from initiation site was about 0.431 µm/cycle.
Development of models including input-output relationship
Statistical model based on the data provided through experiments are powerful tool to understand influence of process factors on performance measures. 26 the method is widely used for manufacturing processes modeling specifically in conventional and non-conventional machining processes where multiple inputs and outputs are incorporated to navigate the efficiency of process. 27 In order to develop a model for understanding input-output relationship, regression models of responses including linear, quadratic, and interaction terms have been developed in MINITAB statistical package. The mathematical models of surface roughness, residual stress, hardness, and fatigue cycles can be found in equations (2)–(5) as follows:
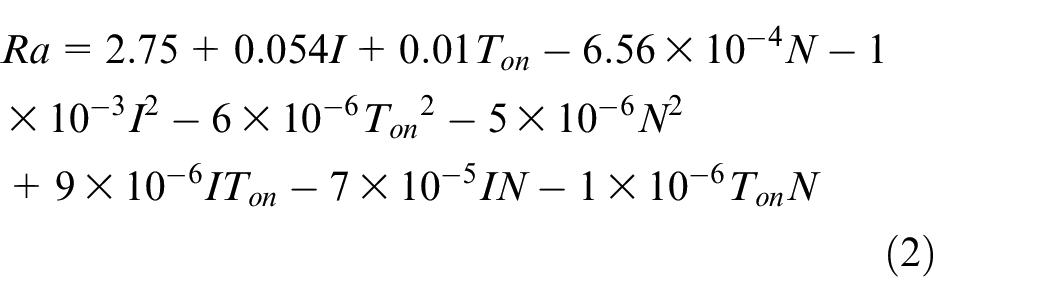
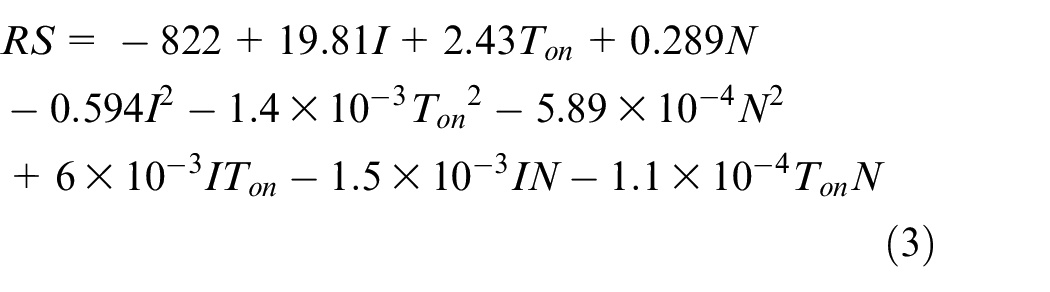
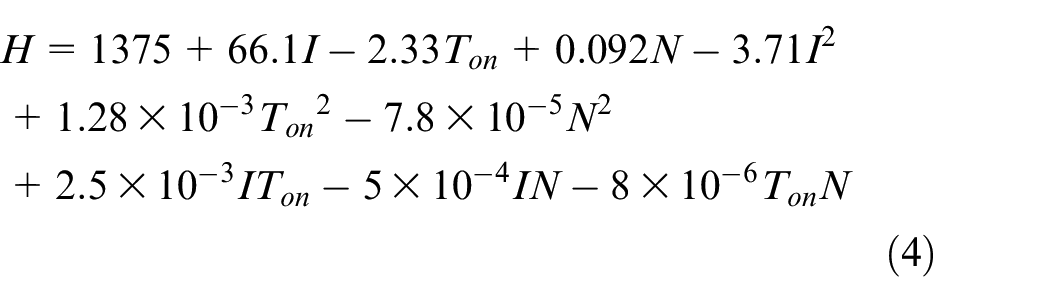
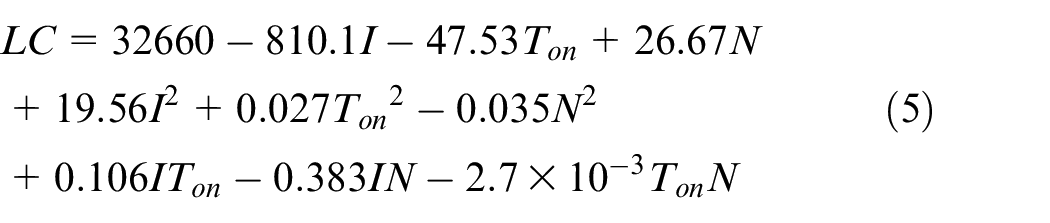
where Ra, RS, H, and LC are surface roughness, residual stress, hardness, and life cycle, respectively. Also, I, Ton, and N are denoted as pulse current, pulse on time and spindle speed, respectively.
In order to check the adequacy of developed models, analysis of variances have been implemented and the results were presented in Table 2. The ANOVA tables include percentage of contribution, Prob > F as well the R2 values which imply importance of each factor and significance of the model.
Results of analysis of variances for each response.
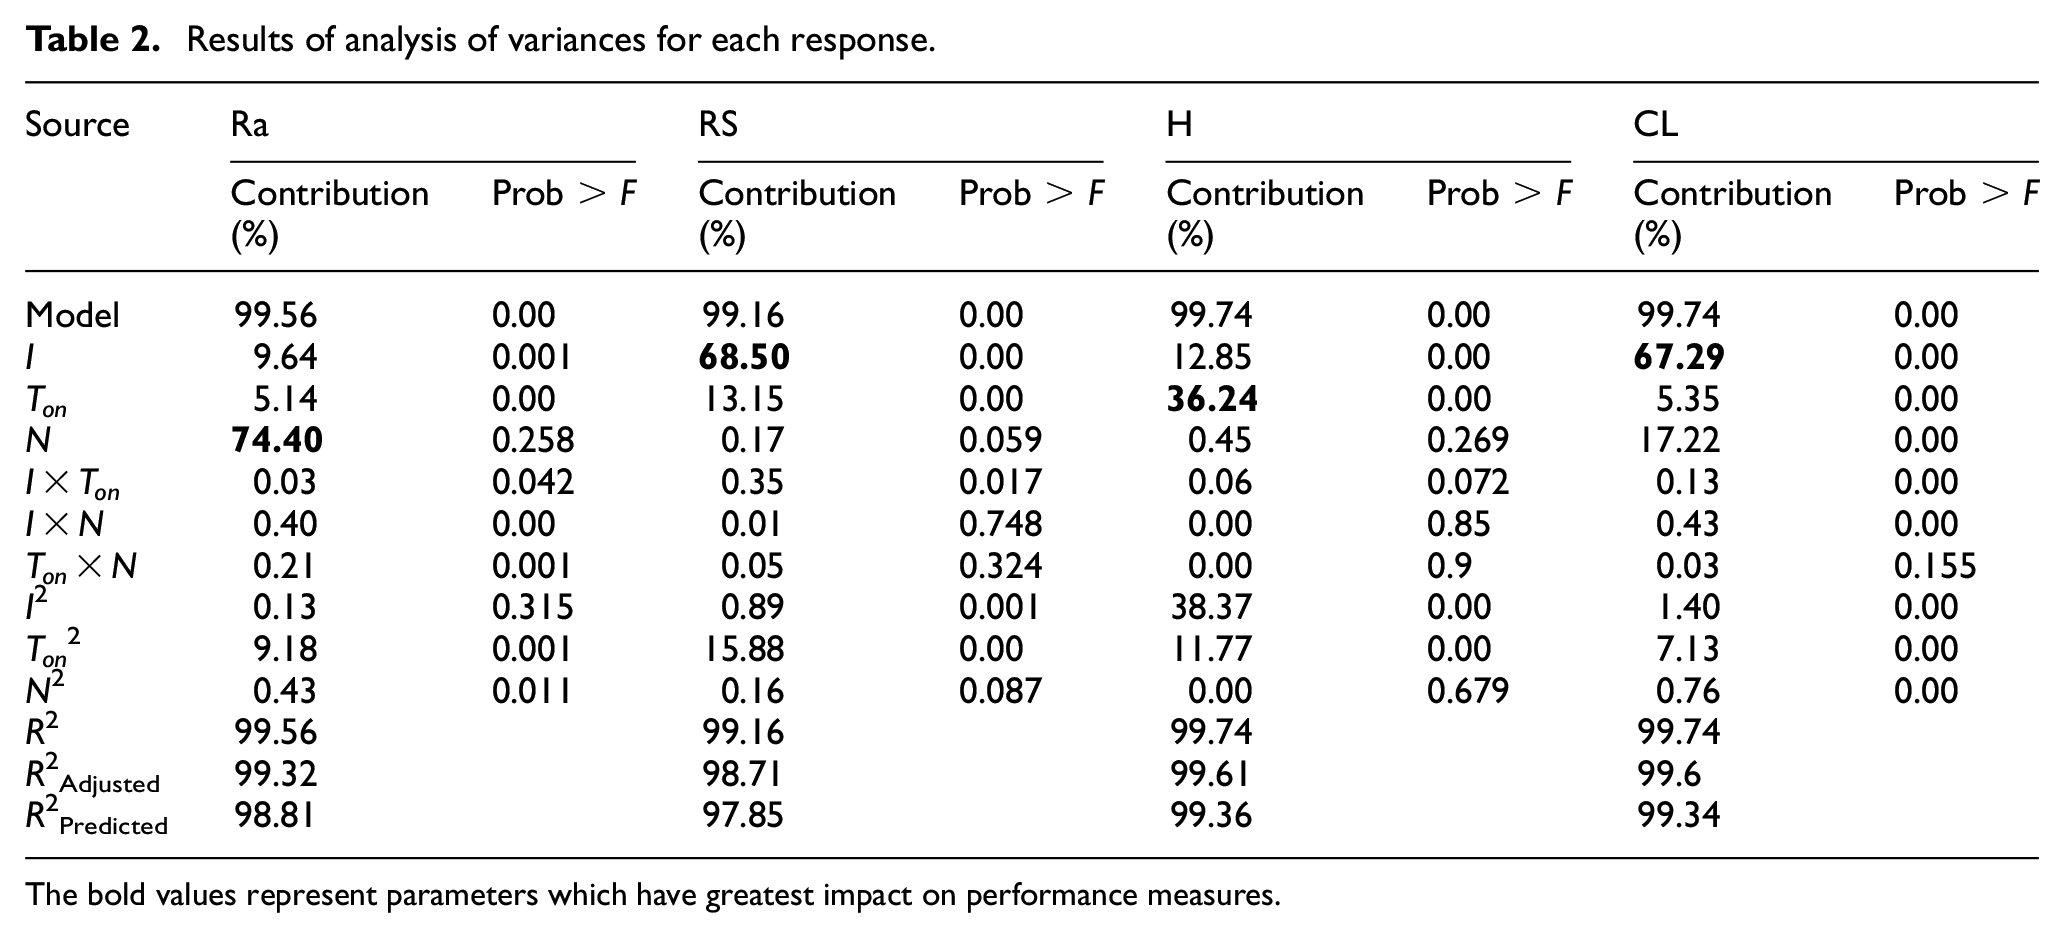
The bold values represent parameters which have greatest impact on performance measures.
According to the results of Table 2, it is seen that the values of Prob > F for all the responses are equal to 0.00. it implies that the model term is significant. Only 5% chance exists that the model terms occur due to noise. It can be also seen that for all of the developed models, the values of R2, R2Adjusted, and R2Predicted are in close agreement and approaches to 100%. It implies that the developed model are qualified enough to navigate design space.
It is also seen from the contribution column that the significance order of process factors on each response are quite different. For surface roughness, it is seen that the most influential parameter is spindle speed followed by discharge current and pulse on time. pulse current and pulse on time have greatest effect on residual stress where the spindle speed is completely insignificant. It is seen that the hardness is significantly influence by pulse on time and pulse current while the spindle speed is non effective parameter. Accordingly, the life cycle is majorly influenced by pulse current followed by spindle speed and pulse on time.
Conclusion
Wire electrical discharge turning as a hybrid non-conventional machining was used for processing of Inconel 718. Series of fatigue specimens were machined and effect of process factors on fatigue life were studied through analyzing surface integrity factors. Summary of results can be presented as follows:
Results indicated that increase of pulse current from 5 to 15 A results in reduction of fatigue life up to 25%. The reduction of fatigue life is due to increase of surface roughness up to 17% and surface tensile residual stress of 50%.
As a result of increase of pule on time from 600 to 800 µs, the fatigue life firstly decreases about 19%; but, by further increase of pulse on time and reaching to 1000 µs, the fatigue life increases about 6.7%. The reduction of fatigue life is due to increase of surface roughness and tensile residual stress about 27% and 32%, respectively. Also, fatigue life enhancement is due to reduction of surface roughness and tensile residual stress up to 10.4% and 15%, respectively.
Increase of workpiece rotational speed from 50 to 250 rpm leads to increase of fatigue life up to 59%. It can be attributed to reduction of surface roughness and tensile residual stress about 43% and 38%, respectively.
From the ANOVA results it is found that the surface roughness majorly influenced by spindle speed (by contribution of 74%) and residual stress influenced by discharge current (by contribution of 69.5%). Also, the pulse time has non-dominant effect on these parameters. These trend can be visible on fatigue life where contribution of pulse current is 67% and spindle speed is 17%.
As the pulse current and spindle speed followed by pulse on time were identified as most influential parameters, selection of them at their optimum level (i.e. 5 A, 250 rpm, and 600 µs) results in significant improvement compared to fatigue life of the samples which are fabricated with purpose of high production rate. According to the Table 1, it is seen that the fatigue life of the sample for test #3 is 14,483 that is more than two times of the test #22 that is 6861. The test #3 with 111% improvement in fatigue life is designated for achieving better surface integrity and fatigue life, while the test #22 was fabricated for maximum material removal rate. It can be inferred that it is not possible to achieve.
Footnotes
Declaration of conflicting interests
The author(s) declared no potential conflicts of interest with respect to the research, authorship, and/or publication of this article.
Funding
The author(s) received no financial support for the research, authorship, and/or publication of this article.