
Abstract
Energy conservation is one of the most important aspects of electrical discharge machining process in which the material removal is by means of spark erosion. Metal removal in wire electrical discharge turning is a complex erosion mechanism which involves melting, vaporization and rapid cooling of molten material. In this work, the significance of discharge energy on the performance of wire electrical discharge turning process, namely, material removal rate, surface finish, thickness of recast layer and surface crack, is analyzed. New model to estimate material removal rate and surface finish in wire electrical discharge turning process have been proposed. Erosion energy and kinetic energy imparted by electrons and average physio-thermal properties of work material are utilized for the modeling. Proposed models are validated by conducting experiments on AISI 4340 steel material. The results obtained from the model are well in agreement with the experimental values. The influence of discharge energy on surface crack and recast layer thickness is analyzed using scanning electron microscope micrographs and energy-dispersive x-ray spectroscopy analysis. Surface crack is observed at higher discharge energy. The thickness of recast layer increases with the increase in discharge energy. Three-dimensional surface topography reveals the turbulent nature of machining process resulted from transient erosion phenomena of wire electrical discharge turning process. Higher material removal rates of the order of about 0.06 g/min with consistent average roughness in the range of 4.5–5.5 µm at the expense of 1.6–2.6 J of discharge energy are achieved in this work. The proposed models can be utilized for machining of difficult to machine material by effective utilization of energy that leads to energy conservation in wire electrical discharge turning process.
Keywords
Introduction
Metal erosion in electrical discharge machining (EDM) occurs by means of rapid, repetitive spark discharges from a pulsating direct current power supply with dielectric flow between the workpiece and the tool electrode. Among the configurations of EDM, wire electrical discharge machining (WEDM) is widely used nonconventional machining process, which is used for manufacturing of complex two-dimensional (2D) and three-dimensional (3D) shapes with electrically conductive workpiece using wire electrode.1,2 Turning with WEDM (wire electrical discharge turning (WEDT)) and wire electrical discharge grinding (WEDG) are the two important configurations of WEDM process which employs an additional rotary axis to conventional WEDM process. The characteristics of these two process variants are the relative motion between the electrodes (tool and workpiece) and the feed. In WEDT and WEDG, the erosion mechanism is same as that of the WEDM process; the difference is that in WEDT, the workpiece is fed horizontally, whereas in WEDG, the workpiece is fed in the longitudinal direction. 3 The geometric accuracy of the machined workpiece is affected by wire deflection and direction of feed. For an axial feed motion (as in WEDG), the workpiece is prone to deflect more due to its gravity compared to that of longitudinal feed as in WEDT process. Similar to WEDG, WEDT makes it possible to generate precise cylindrical forms, micro pins, micro shafts and any axisymmetric form on conductive materials, regardless of their hardness. In EDM, material removal rate (MRR) and surface finish are largely dependent on the amount of discharge energy available in the gap. Higher the energy content of each spark, more violent will be the material removal resulting in a rough surface.4–6 It is to be noted that the energy required for processing a unit of volume of material will be same despite the type of process applied. However, conservation of energy comes to consideration in dealing with energy loss accounted to process. Among the total discharge energy available in the gap, only a fraction of energy is utilized for material removal from the workpiece, a portion of energy is transmitted to tool electrode and the remaining is lost in gap. 3
Researchers have attempted to study the influence of process parameters7–9 and discharge energy on MRR and surface roughness during EDM process. The authors studied the influence of discharge energy on MRR and metal removal efficiency of different materials and stated MRR is dependent on discharge energy whereas metal removal efficiency is dependent on material’s property.4,10–13 Also, the metal removal efficiency of micro-EDM is higher compared to that of macro EDM due to higher power density at the workpiece in micro-EDM. 14 Crookall 15 proposed a theoretical hypothesis for pulse energy and stated that average power decreases due to increase in relative frequencies of inactive pulses due to short- and open-circuit conditions. Thus, it can be inferred that energy conservation in spark machining can be attained or sustained by selection of work material and appropriate process parameters. The effect of pulse energy on roughness of machined component has been observed and represented that the roughness increases with increasing pulse energy.1,5,11 The efficiency of EDM is also dependent on distribution of discharge energy in the gap. Researchers have contributed in studying the effect of discharge energy on the performance of WEDM process. Watanabe et al. 16 categorized the secondary group of pulses that contribute for MRR, and Han et al. 17 studied the influence of pulse duration on MRR. The authors proposed a theoretical hypothesis for energy distribution diagram and specific discharge energy to identify the limitations of WEDM process.18,19 The transient instability of WEDM process is studied using real-time instantaneous energy monitoring methodology to prevent wire from rupture for improving performance and efficiency of WEDM process.20,21 Researchers proposed theoretical hypothesis for pulse energy and experimentally studied metal removal efficiency of different materials in both EDM and WEDM processes. Also, the discharge energy is utilized as the monitoring tool for improving the performance of WEDM process. However, the work done in analyzing the effect of discharge energy on MRR and surface finish during EDM and WEDM processes is corroborated with only limited experimental results.
Modeling of MRR and surface roughness in EDM and WEDM processes has been reported by many researchers. Attempts have been made to predict MRR using simulated crater dimension assuming different types of heat source during EDM process.22–25 The authors proposed theoretical models to predict MRR by varying process parameters26–29 and using dimensional analysis. 30 Lal et al. 31 proposed a model to predict surface roughness using signal-to-noise ratio. However, the model based on process parameters cannot be applied for all machine settings and conditions, due to range of each parameters and also interaction between parameters. Yeo et al. 32 made a comparison of various models to predict MRR for the same set of experiments. However, these models have overpredicted the results compared to the experimental values due to simplifying assumptions such as uniform distribution of heat flux, constant spark radius, 100% metal removal efficiency, neglecting the effect of vaporization and other losses. Several researchers have attempted to develop model for MRR during WEDM process. The authors proposed models to predict MRR using pulse duration, 9 using various optimization techniques, namely, signal-to-noise ratio, nondominated sorting genetic algorithm and response surface methodology.5,33–36 The literature reveals the modeling of MRR using regression equation and employing various optimization techniques to obtain optimum process parameter combination for achieving higher MRR and with constrained surface roughness during WEDM process. With reference to certain controversies seen in the above literature survey, this work aims at modeling the MRR using energy as input parameter in WEDT process.
Limited work is been published in studying the effect of WEDT process parameters on MRR. Micro pins of 5 µm diameter were machined using WEDG process, which can be used as a tool in micro-EDM for the manufacture of miniature products. 37 A mathematical model38,39 and regression models40,41 were proposed to predict relationships between MRR and surface roughness during WEDT process. Janardhan and Samuel 42 proposed a pulse discriminating algorithm to identify open-circuit, normal, arc and short-circuit pulses in WEDT process and compared it with results obtained from WEDM process. The literature survey on WEDT process reveals that few attempts have been made to predict MRR and surface roughness. However, the literature lacks the modeling of MRR and surface roughness using discharge energy as input parameter.
This article focuses on modeling the machining characteristics (such as MRR and surface roughness) of WEDT process. Model is developed using discharge energy available in the gap and average physio-thermal properties of the workpiece material. Experiments were conducted by varying process parameters such as pulse-off time, servo feed and spindle rotation. Experimentally measured MRR and surface roughness are compared with the values predicted by the proposed model. The influence of discharge energy on MRR and surface integrity is also analyzed. The complex spark erosion mechanism of WEDT process is studied using 3D topography of surface before and after machining. The details of the models, experimental details and the results obtained are discussed in the following sections.
Influence of discharge energy on machining characteristics
Analysis of MRR
Metal removal from electrodes occurs due to melting and vaporization of electrodes by transfer of kinetic energy (KE) into thermal energy. The heat generated by electrons and positive ions exceeds the melting and boiling points of the anode and marginally cathode material, which results in the formation of a crater in the anode. In this article, our concern is to develop an energy-driven model, to predict the MRR on the workpiece. Therefore, the volume of crater formed is assumed to be dependent on the KE of electrons and the latent heats of workpiece material which is schematically represented in Figure 1. The following assumptions are utilized for developing a model to predict MRR:
Discharge energy available in the gap is used to accelerate the electrons, and the effect of positive ions and positrons is neglected.
The KE of electrons is assumed to be transformed into thermal energy (heat) into the workpiece.
Collision free plasma channel is assumed; otherwise, the electrons will lose their KE by colliding with neutral atoms and creates positive ions.
As the electrons hit the surface, local melting and vaporization of workpiece material take place.
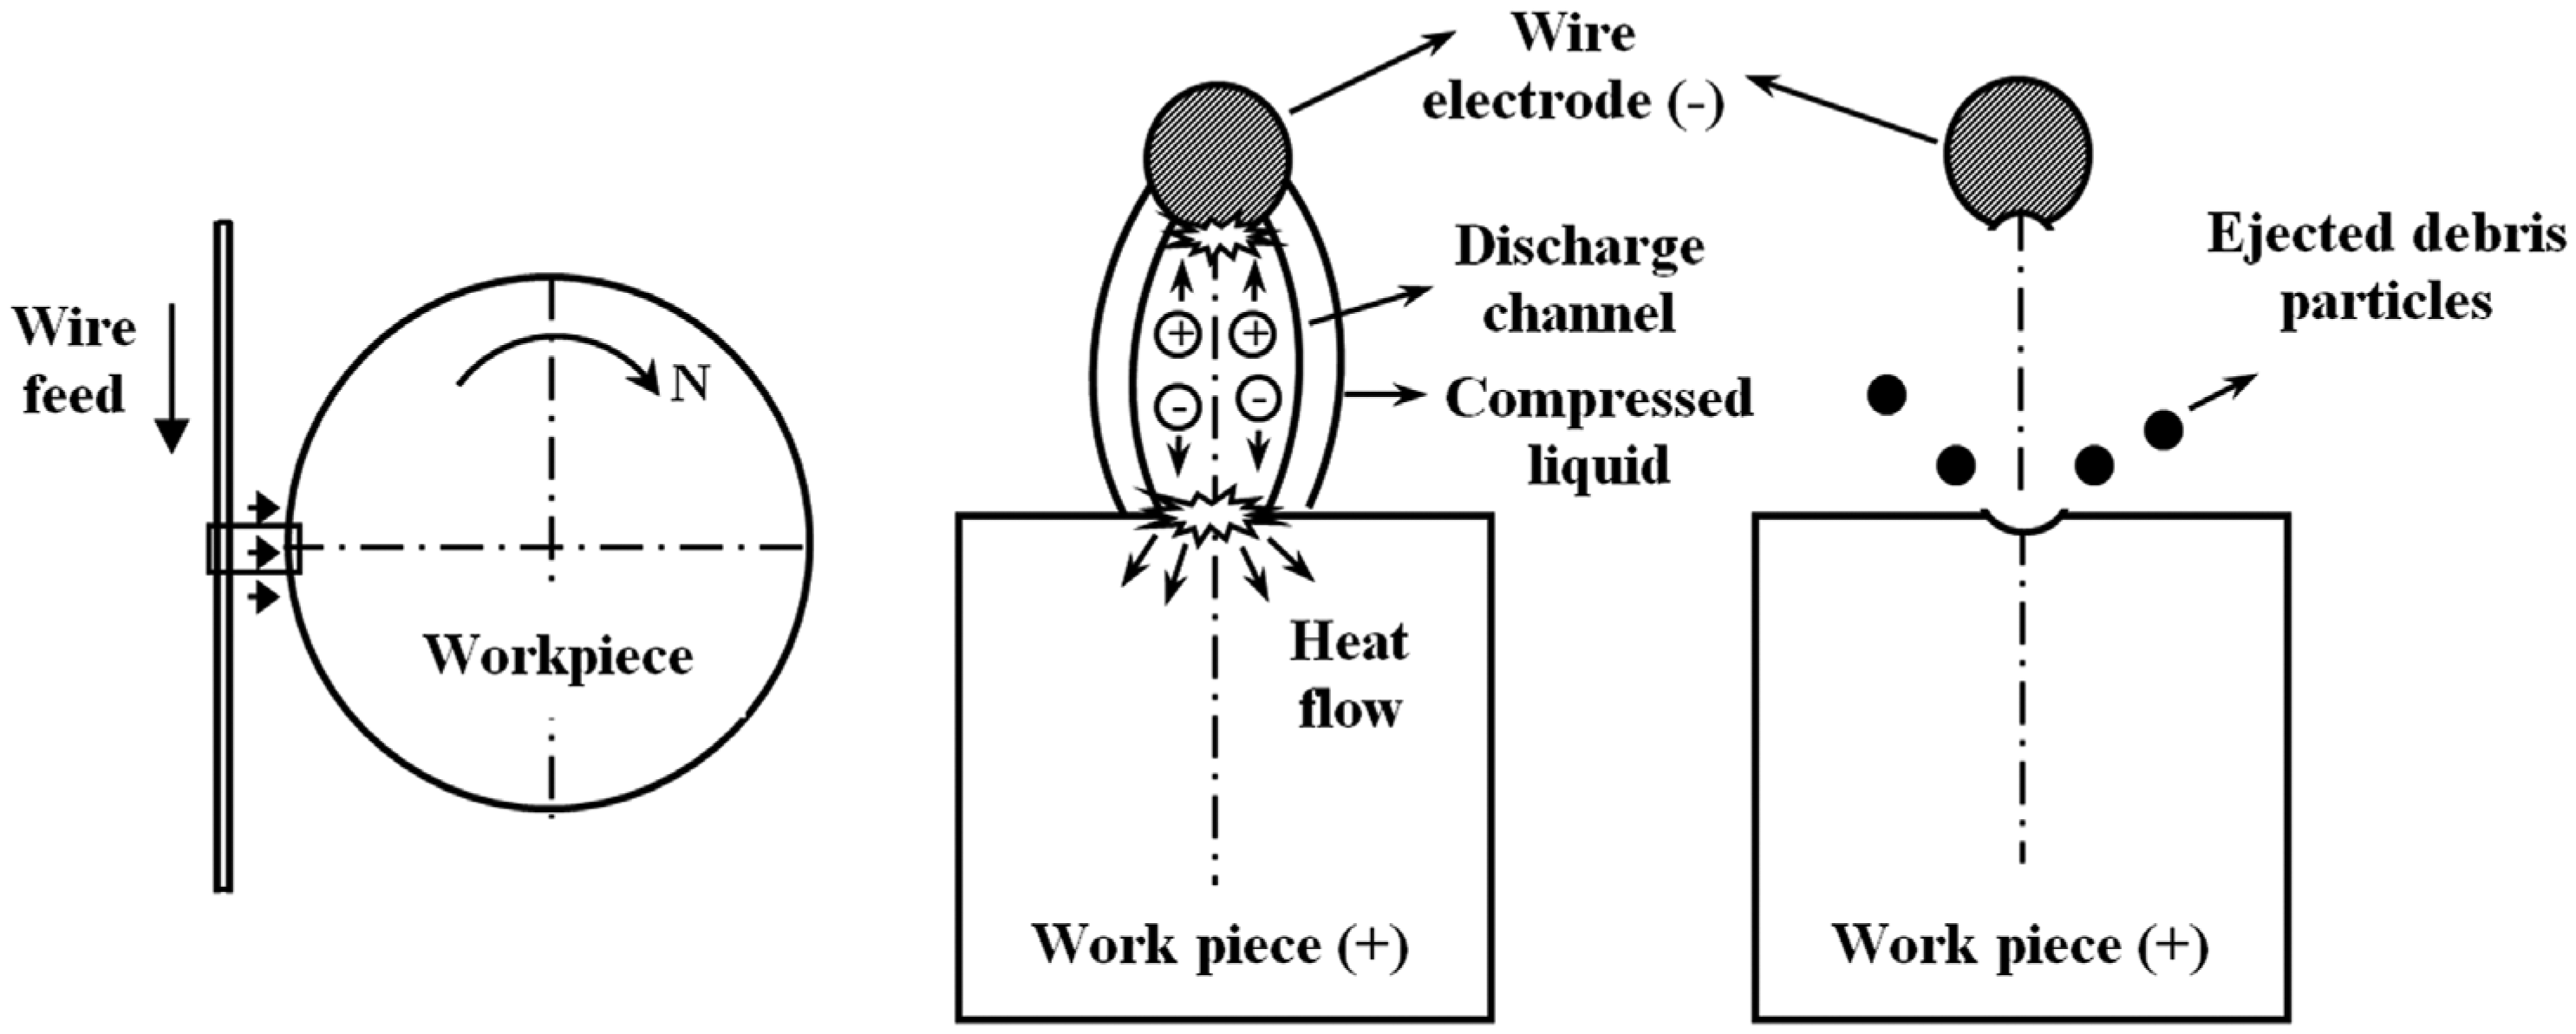
Schematic illustration of sparking in WEDT process. 23
KE of the electrons with total mass Me affecting the workpiece surface with velocity Ce is given by the expression
Total mass (Me) of the electron can be found from the Einstein’s mass–energy equivalence

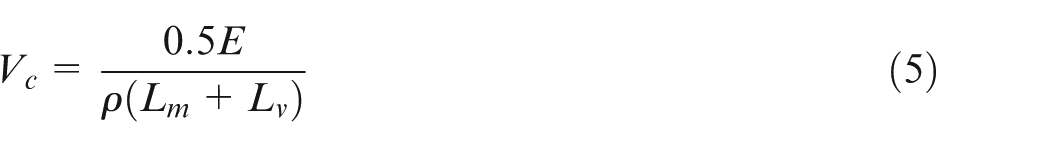
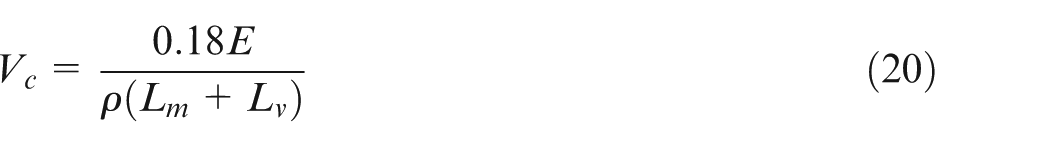
As the discharge energy (E) varies, mass of the electrons inside the discharge column will vary. During pulse-on time, as the discharge begins, the electrons acquire KE as a result of supplied energy and are made to impinge on the workpiece causing superheating and melting of the workpiece. A plasma channel surrounded by vapor bubble is formed between the electrodes (tool and workpiece) and grows during the pulse-on time. As the discharge proceeds, more electrons are generated causing melting and vaporization of electrodes (tool and workpiece) and dielectric that aids in increasing the pressure inside the vapor bubble. At the end of pulse-on time, as the discharge ceases, the vapor bubble explodes or bursts abruptly causing the superheated molten liquid on the surface of the workpiece to expel into the dielectric. Therefore, the volume of material eroded is dependent on the latent heats (both melting and vaporization) and density of the material. Volume of crater (Vc) formed by all electrons is given by the expression
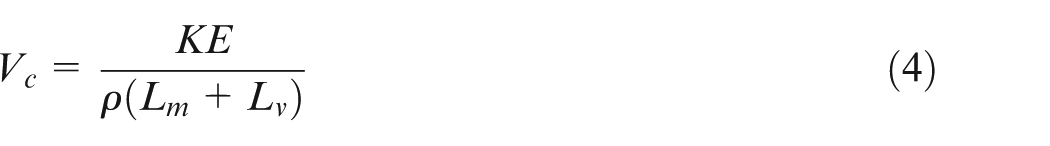
where ρ is the density (ratio of mass per unit volume), Lm is the latent heat of melting (amount of energy required to melt unit mass of solid into liquid) and Lv is latent heat of vaporization (amount of energy required to vaporize unit mass of liquid into vapor) of the workpiece material.
By combining equations (1) and (3) in equation (4), we obtain
In this model, the discharge energy is obtained using voltage and current pulse trains acquired for time duration of 1 s using digital storage oscilloscope. Discharge energy for single pulse is given by the equation
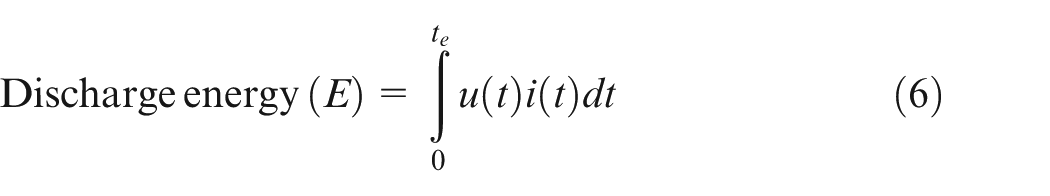
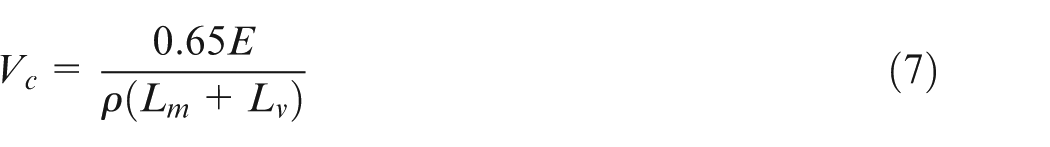
where u(t) is discharge voltage and i(t) is discharge current. The discharge energy for single pulse is obtained from total discharge energy divided by the number of pulses. The explosion of vapor bubble may remove only a portion of molten material from the vicinity of the crater which is flushed away by dielectric. Major portion of molten material is resolidified to form white layers adjoining the crater that leads to energy deprivation and also formation of partially filled crater. Therefore, a factor “λ” is included for energy degradation in equation (5). The resolidified material becomes softened due to melting and superheating at the time of sparking. The energy degradation can be observed from variation in hardness of the workpiece in the machined zone. It is observed that the micro-hardness of substrate region of workpiece softens by 30% compared to bulk hardness of the work material.6,40,43 Therefore, the energy degradation factor “λ” is taken as 1.3. By including this factor “λ” in equation (5), the volume of material removed for single crater can be given as
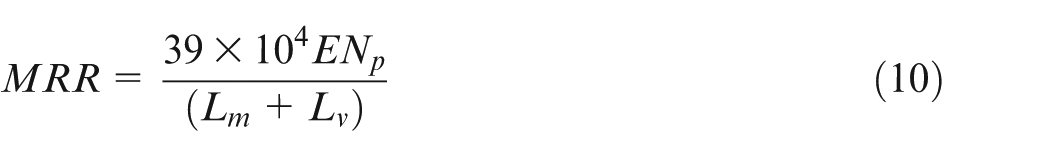
The volume of material removed per second (m3/s) can be expressed by relating the product of volume of crater per pulse and pulse frequency as given in equation (8)
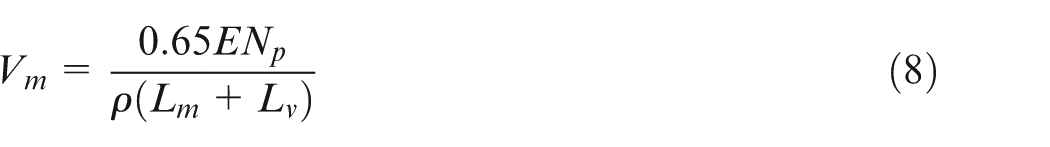
where Np is the number of pulse per second. A separate algorithm is developed using MATLAB to count the number of pulses occurred for a given time. A threshold value is set to distinguish between different types of pulses, namely, normal, arc, short-circuit and open voltage pulses. The discharge energy developed in the gap per second is the product of discharge energy per single pulse and number of pulses per second. The volume of material removed (g/min) can be expressed as

By substituting equation (8) in equation (9), we obtain
WEDT is a transient stochastic process, which involves numerous factors for material removal. By precisely knowing the amount of energy required to erode a given material, energy can be conserved during WEDT process. In order to know the actual energy required to erode a given material, it is necessary to correlate erosion energy and MRR. The energy required to erode a given crater is the product of volume of material removed for single crater and its respective enthalpies

where Hv is enthalpy of vaporization 11 and is given as
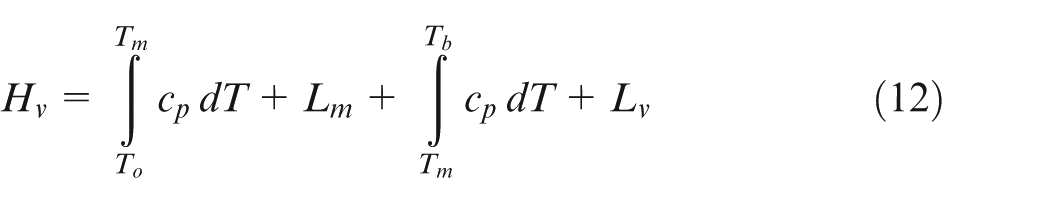
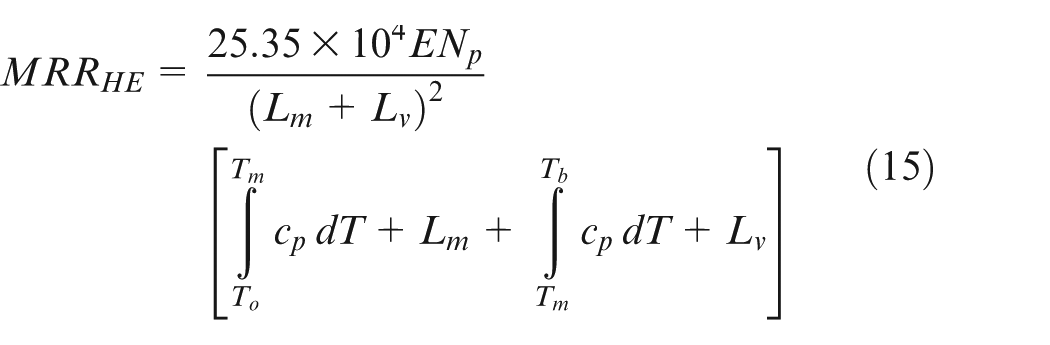
where cp is specific heat capacity (575 J/kg °C), To is ambient temperature (20 °C), Tm is temperature at melting point (1535 °C), Tb is temperature at boiling point (2886 °C) and Lm is latent heat of melting (247 kJ/kg), and in this work, the boiling temperature of steel (2886 °C) and stainless steel (3000 °C) are closer; hence, the latent heat of vaporization of stainless steel (Lv: 6500 kJ/kg) is used 44 By substituting equations (7) and (12) in equation (11), we obtain
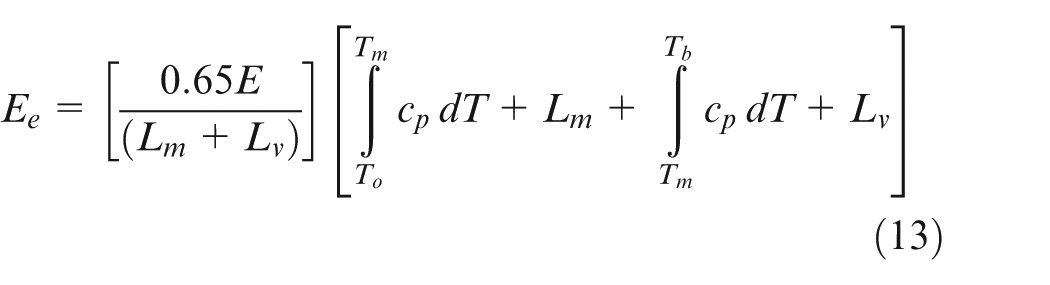
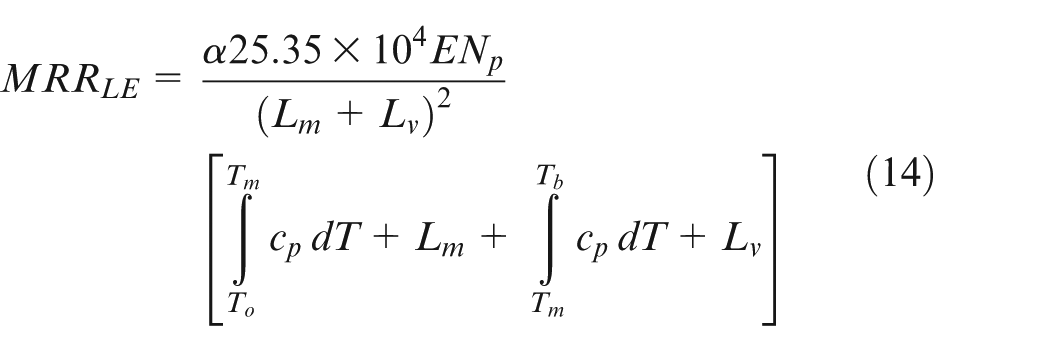
Therefore, the amount of energy required to remove the given material can be obtained by replacing discharge energy in equation (10) by erosion energy estimated using equation (13). In EDM process, the amount of material removed is also dependent on the nature of pulse. Among the pulses, short-circuit and open voltage pulses are considered to be inactive pulses which cause machining instability and do not contribute for material removal. The normal and arc pulses are mainly responsible for the material removal from the workpiece and tool electrode, 45 and the incidence of arc pulse leads to energy drop in the machining gap. Preliminary experimentation revealed that by varying pulse-off time, servo feed and spindle rotation, the discharge energy in the machining gap is obtained in the range of 1–4 J. Irrespective of the pulse-off time and spindle rotation, higher discharge energy (>2.7 J) is obtained when the servo feed is maintained at 0.5 mm/min and lower discharge energy (<2.7 J) when the servo feed is varied between 3.2 and 8.2 mm/min. The discharge energy in the machining gap reduces due to the occurrence of significant number of arc pulse in comparison with total number of pulse for a given time. A higher discharge energy (>2.7 J) is observed due to the negligible number of arc pulse in comparison with total number of pulses for a given time. Therefore, 2.7 J of discharge energy is considered as the dividing factor for lower and higher discharge energies. The incidence of arc pulse in the machining gap is also responsible for material removal from the workpiece. 45 The preliminary experimentation reveals that the incidence of arc pulse is significant at lower discharge energy (<2.7 J). In this work, the erosion of workpiece is considered, and to predict the erosion of the workpiece, a factor “α” is included to take into account the effect of arc pulses on MRR. Therefore, the factor “α” is included in equation (14) to predict MRR at lower discharge energy, and equation (15) is used to predict MRR at higher discharge energy
Analysis of surface finish
The following are the assumptions used to develop the model for surface finish. Each pulse results in the formation of a crater. All pulses are assumed to be normal pulse. Only a fraction of discharge energy goes into the workpiece and is assumed to be constant during the pulse. The average thermo-physical properties of steel material are assumed to be constant in all three phases: solid, liquid and vapor. The workpiece is homogeneous and isotropic. The shape of the crater is assumed to be hemispherical. In WEDT, each discharge results in the formation of crater. However, the finished workpiece surface is the resultant of series of craters generated from individual discharges with overlap as shown in Figure 2. The maximum height of the profile due to crater overlap 46 is “h2.” In this work, a model is developed to predict “h2,” and the key parameters involved are defined in Figure 2. It is observed from Figure 2 that chord length “L” at “h2” is a function of crater overlap. A factor “β” is used to denote the amount of overlap. The chord length at “h2” is represented as a function of overlap factor “β” as

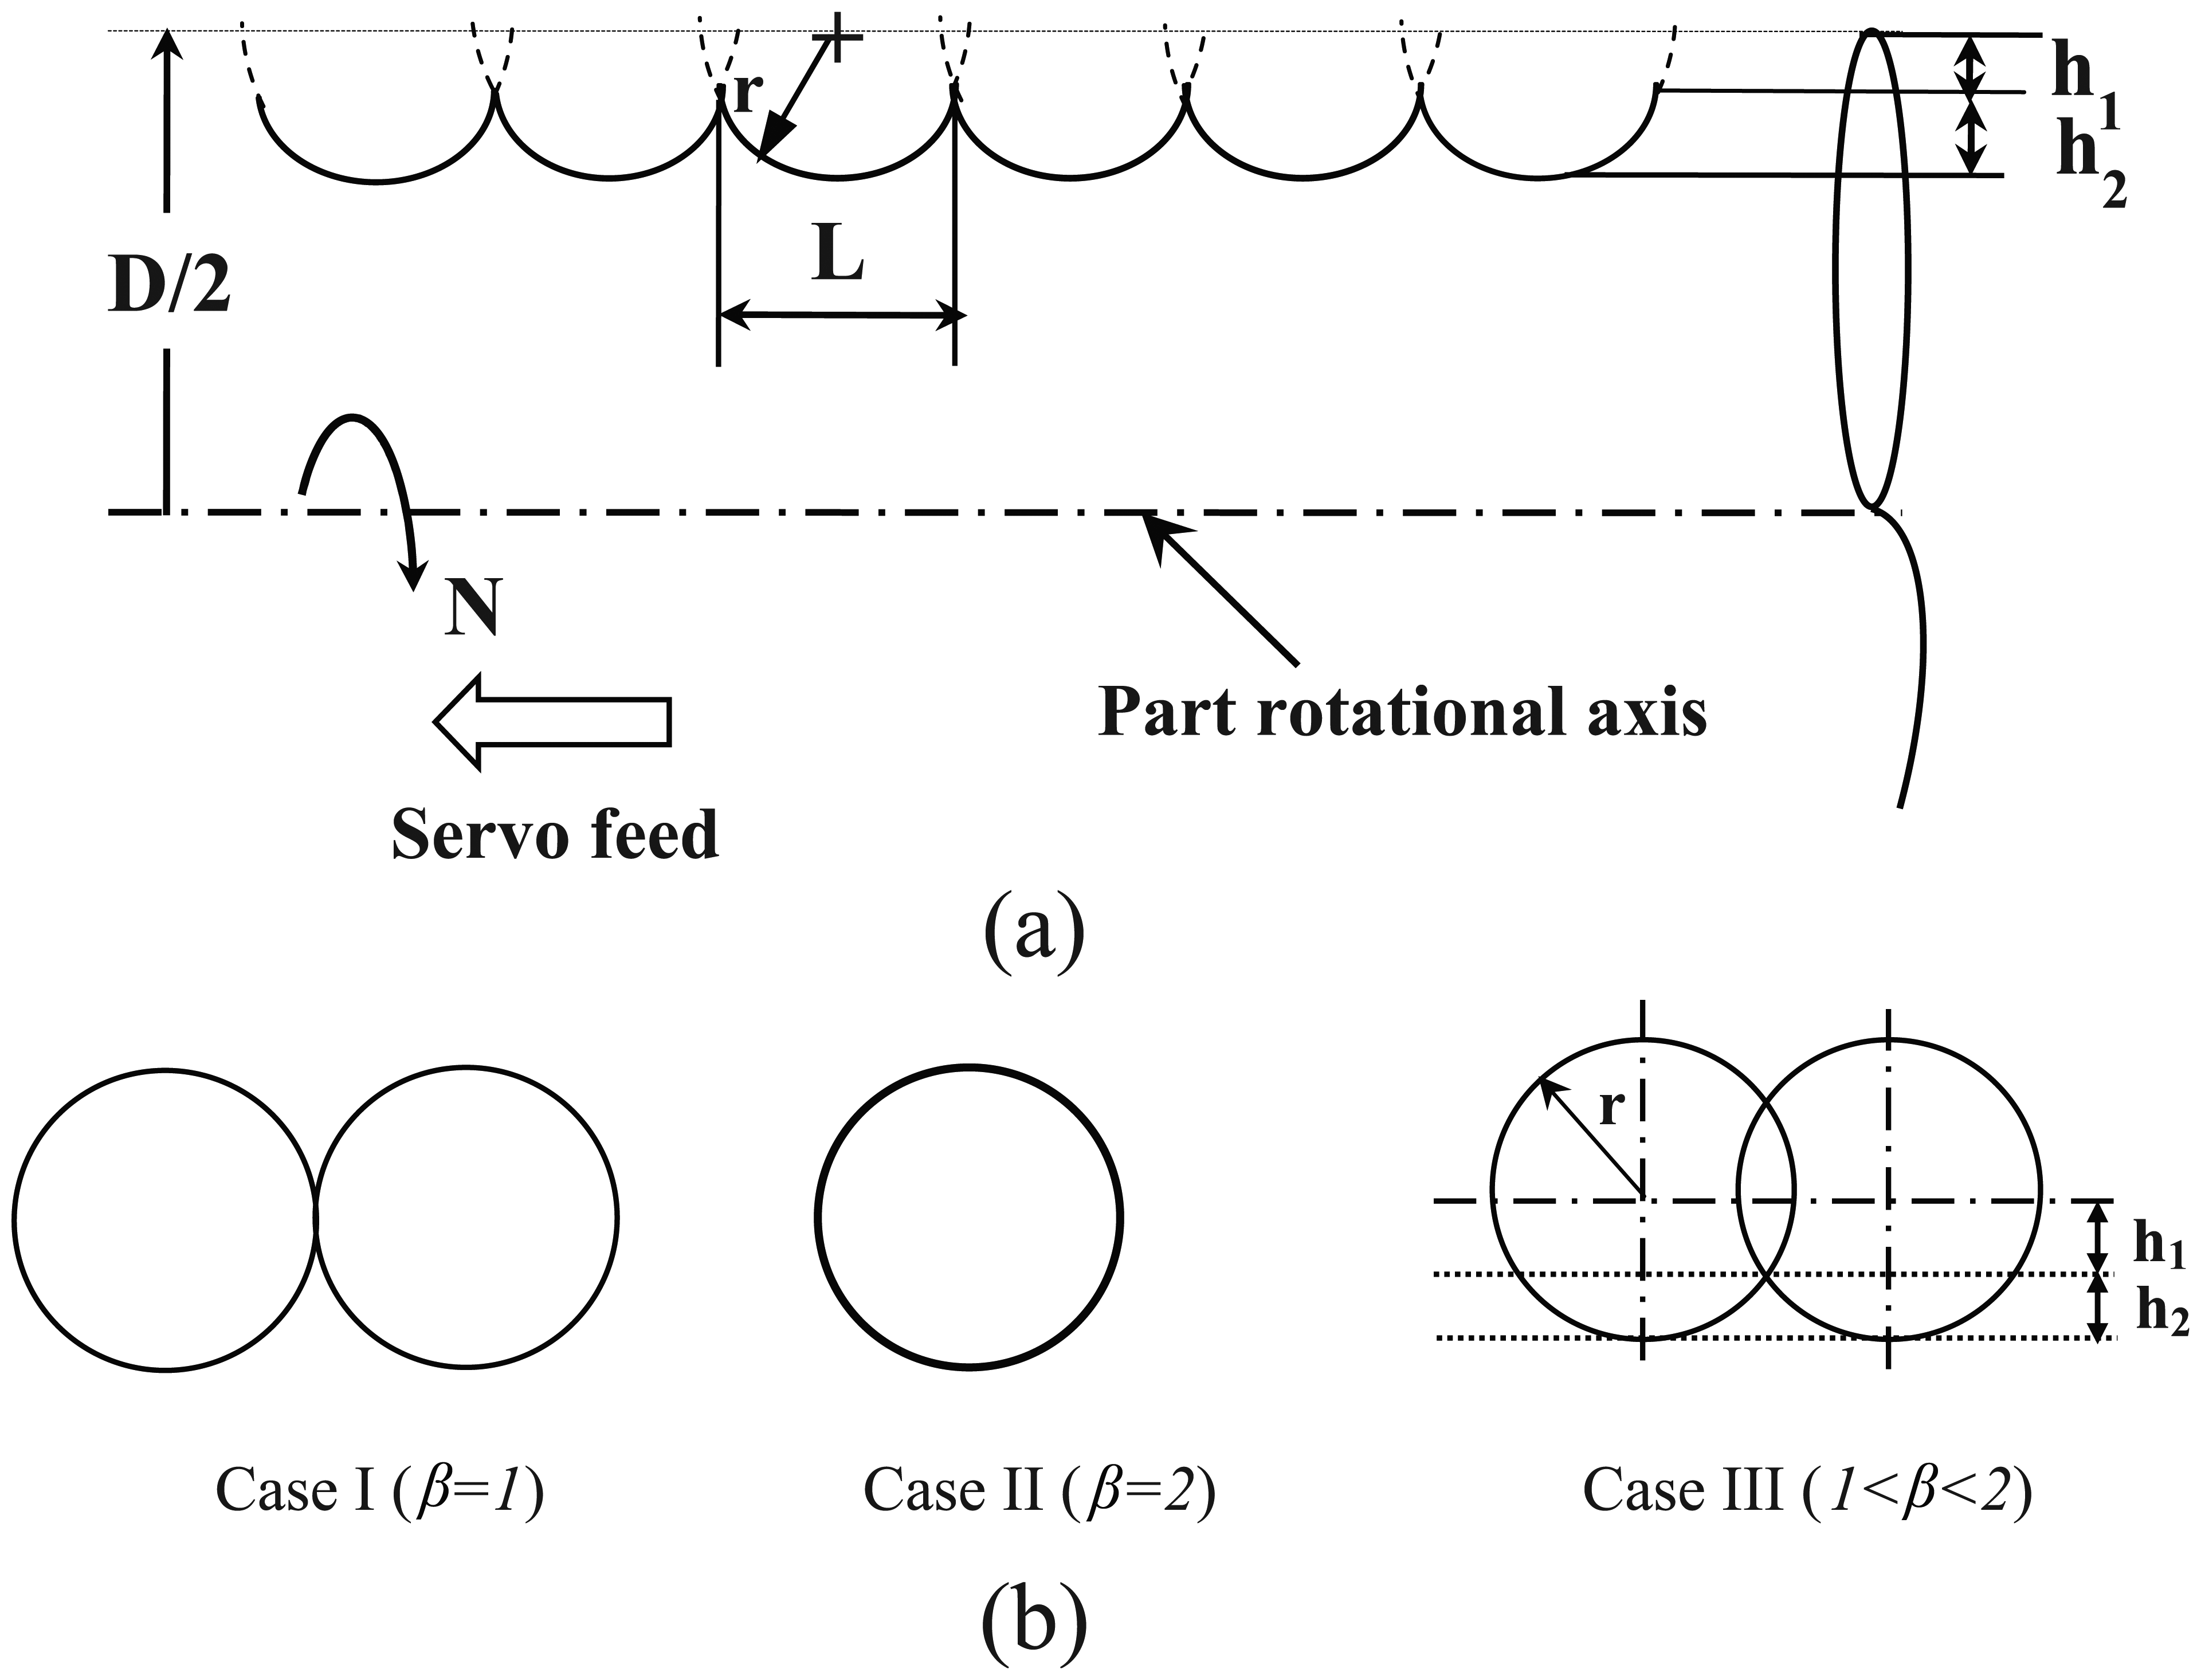
Key parameters used for modeling of WEDT process: (a) cross section of surface generated by WEDT process and (b) three configurations of crater formation on a machined surface.
Geometrically, the chord length at “h2” can be expressed as
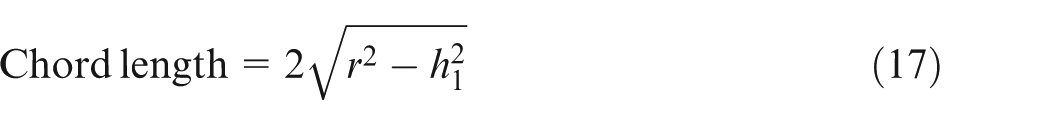
where r is the radius and h1 is the depth. The depth “h1” can be obtained by equating chord length in equations (16) and (17). Therefore
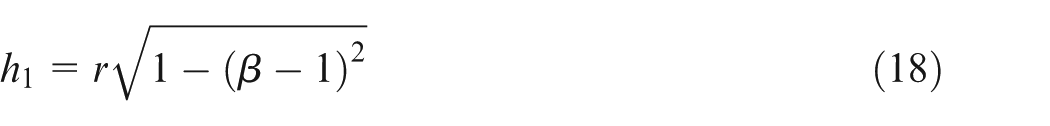
The overlap factor “β” can be calculated by knowing the diameter of crater, number of pulses for a given time, feed rate and spindle rotation. The overlap factor “β” can be expressed as
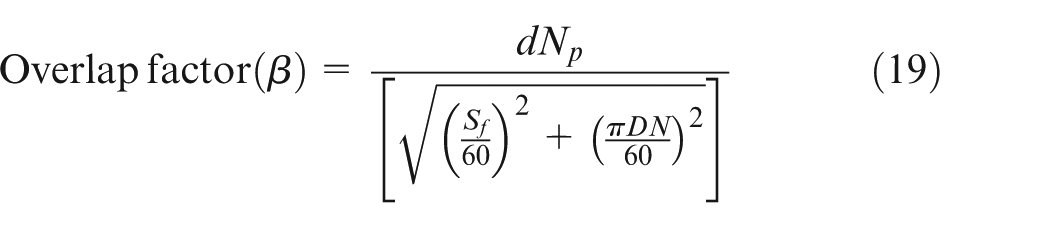
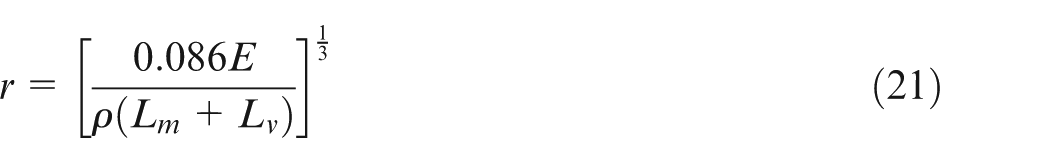
where “d” is the diameter of crater (m), Np is the number of pulses per second, Sf is servo feed (mm/min), D is the diameter of the workpiece (m) and N is the spindle rotation (rev/min). In this work, the overlap factor is taken in the range of 1 < β<2. For β < 1, machining becomes unstable, and for β = 1, no overlap exist (ideal case). When β ⩾ 2, two or more craters generated on the same region lead to machining instability or improper machining as shown in Figure 2(b). The diameter of crater can be predicted by taking the discharge energy of each spark as the input parameter and by including the effect of vaporization. The volume of crater generated for single spark can be calculated from the following equation 47 as
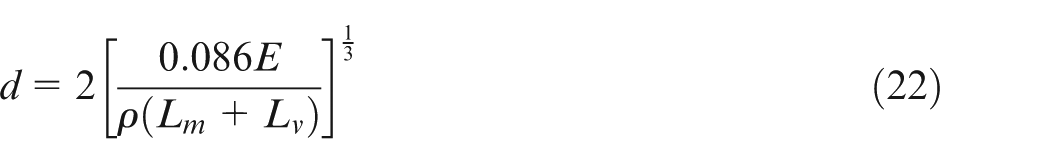
The crater is assumed to be of hemispherical shape. The radius of crater can be expressed as
The diameter of crater is given as
By knowing the depth (h1), the height “h2” can be obtained as

By substituting equation (18) in equation (23), we obtain
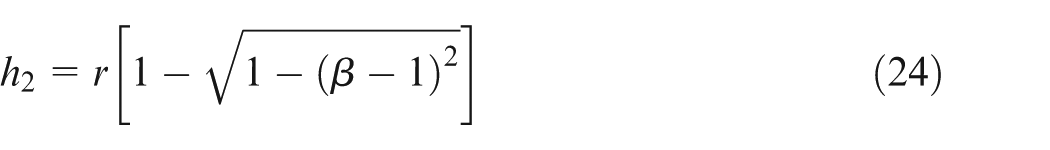
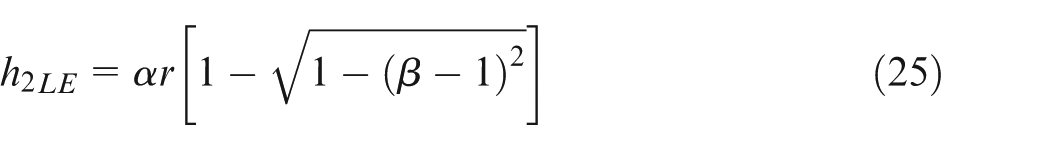
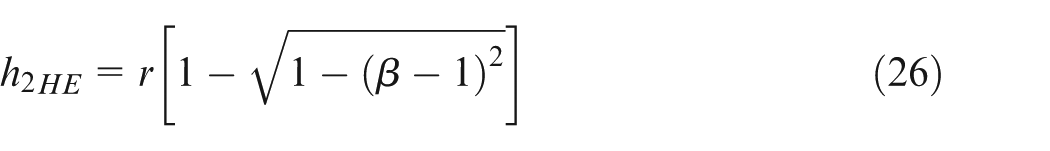
The maximum height of the profile (h2) for a given energy can be obtained from the above equation. However, the stochastic nature of WEDT process results in a random effect of discrete spark, arcing and so on, which generates a rough surface. The incidence of arc pulse in the machining gap leads to more material removal 45 from the surface, which results in generating a rough surface. Therefore, the factor “α” which reflects the influence of arc pulse on roughness is included, and the maximum height of the profile can be predicted using equation (25) for lower discharge energy and equation (26) for higher discharge energy. Therefore
For periodic profile, the arithmetic average roughness is given as 48
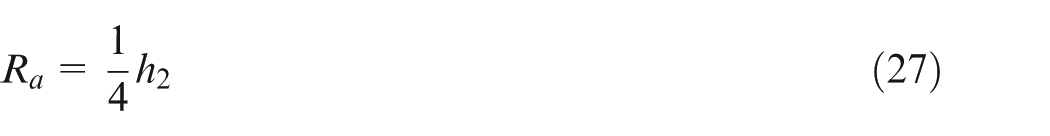
Therefore, for lower and higher discharge energies, arithmetic average roughness (Ra) can be expressed as in equations (28) and (29), respectively
Using equations (28) and (29), the surface finish can be predicted for a given discharge energy.
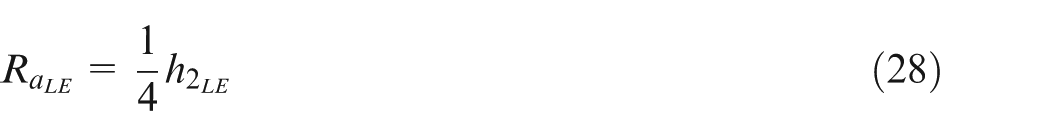
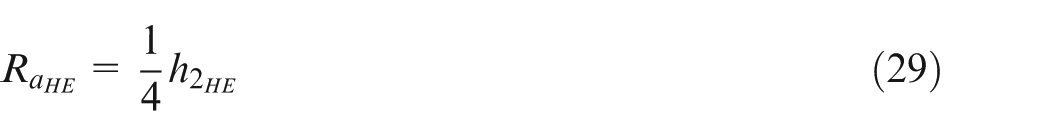
Experimental setup
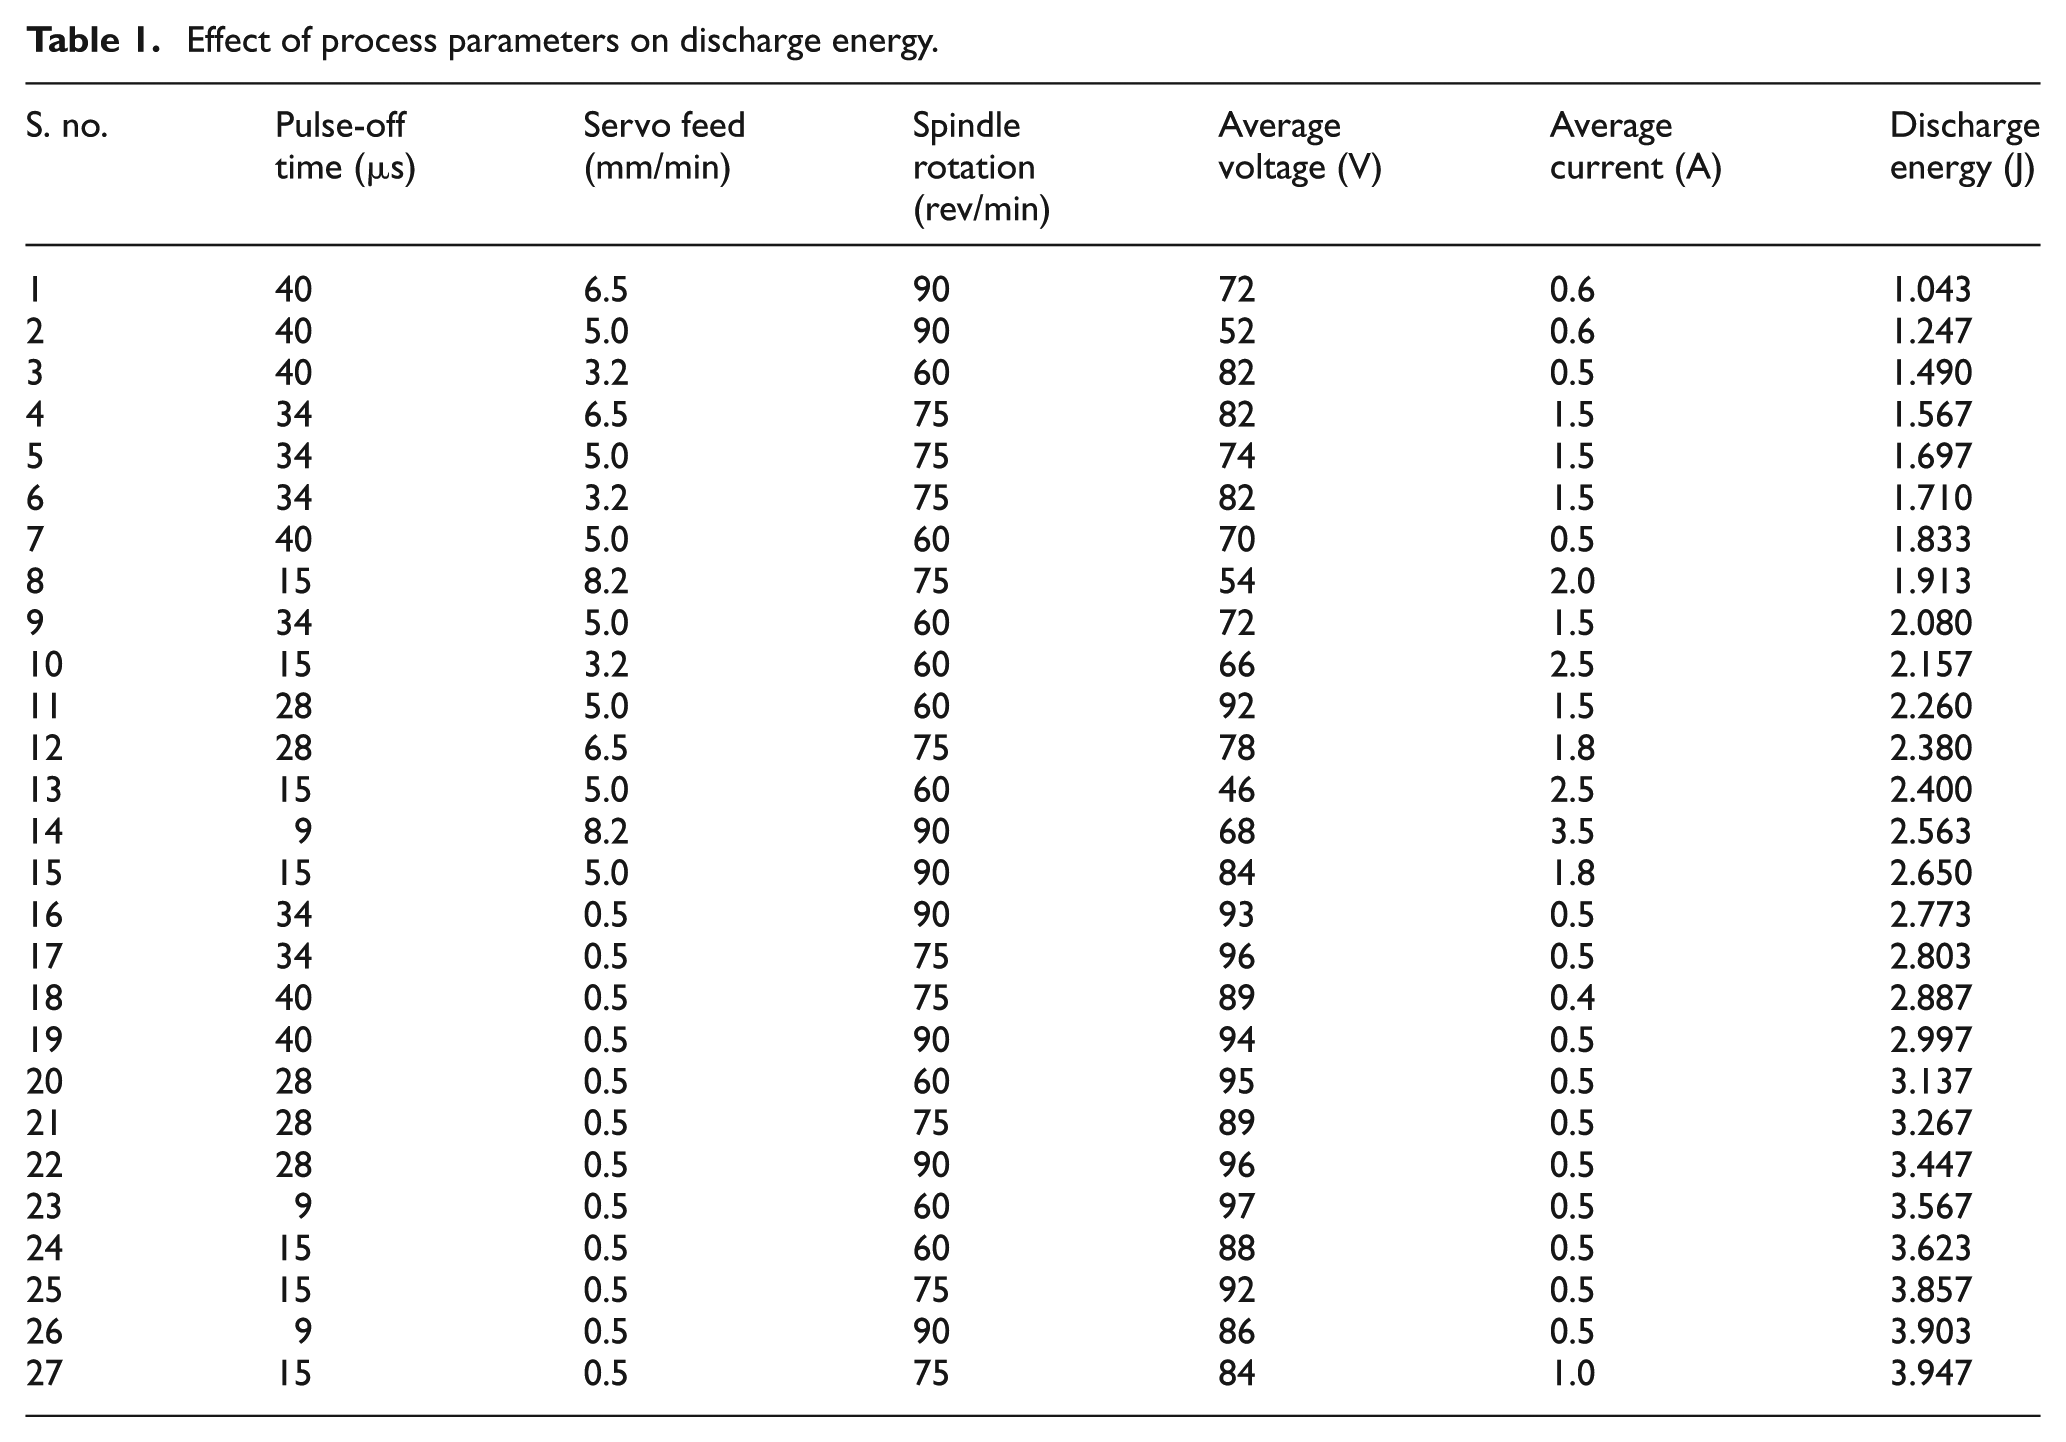
The proposed models are validated by conducting experiments on Electronica ECOCUT machine with four (X, Y, U, V) controllable axes with RC-type pulse generator circuit. Brass wire with 0.25 mm diameter was used as the tool electrode, AISI 4340 steel as the workpiece material and deionized water with conductivity value of 200 µS (technology manual ECOCUT machine) as the dielectric medium. The rotary motion to the workpiece is given using an external rotary setup developed by Janardhan and Samuel. 42 The experimental setup used for conducting experiments is given in Figure 3. Among the various WEDM process parameters, very few attempts has been made to study the influence of pulse-off time and servo feed on machining characteristics of WEDT process. In this work, the process parameters such as pulse-off time, servo feed and spindle rotation were taken as the input parameters. Also, due to machine constraints, it is not possible to control peak voltage and peak current. Pulse-off time can be varied from 9 to 42 µs, servo feed from 0.5 to 11.5 mm/min and spindle rotation from 3 to 98 rev/min. The parameters were selected based on the preliminary experiments conducted in WEDM process. It is observed from the preliminary experiments that for all pulse-off time and spindle rotation at 0.5 mm/min of servo feed, the MRR is very low, and discharge energy is observed to be high. By increasing the servo feed from 3.2 to 8.2 mm/min, MRR increased and energy drops. Above 8.2 mm/min of servo feed and 40 µs pulse-off time, the machining is inconsistent. Therefore, the process parameters were selected as pulse-off time is varied at 9, 15, 28, 34 and 40 µs, servo feed at 0.5, 3.2, 5.0, 6.5 and 8.2 mm/min and spindle rotation at 60, 75 and 90 rev/min. Spark gap, wire feed and depth of cut were maintained constant at 40 µm (technology manual ECOCUT machine), 3 m/min and 0.1 mm, respectively. For each parameter combination, three sets of experiments were conducted, and the average value of three measurements is taken for analysis, which is given in Tables 1 and 2. Process parameters are varied, and their output is obtained as voltage and current pulse train data, which are acquired using digital storage oscilloscope for time duration of 1 s. During experimentation, only spark or normal pulse and arc pulse are observed in the machining gap. Open voltage and short-circuit pulse are not observed. Spark pulse or normal pulse is the pulse which exists with a time lag, and the pulse that exists without time lag is the arc pulse. The typical voltage pulse train acquired using the experimental setup is shown in Figure 4. Discharge energy is calculated from the area under the product of voltage and current pulse train using equation (6) and is given in Tables 1 and 2. The variation in product of voltage and current pulse train for spark pulse (higher discharge energy) and arc pulse (lower discharge energy) is shown in Figure 4. The MRR (i.e. the mass of the material removed per unit time) is calculated using equation (30). The mass of the component before and after machining is measured using AFCOSET ER-200A electronic weighing balance of 0.1 mg accuracy. The surface roughness is measured using Marsurf-XR20. For all experiments, three measurements were taken at different locations, and their average is given in Table 2
where mi is the initial mass of the workpiece (g), mf is the final mass of the workpiece (g), Sf is the servo feed (mm/min) and l is the length of machining (m).
Experimental setup of WEDT process and pulse train data acquisition system: (a) schematic representation of WEDT process and (b) close view of rotary setup.
Effect of process parameters on discharge energy.
Influence of discharge energy on machining characteristics.
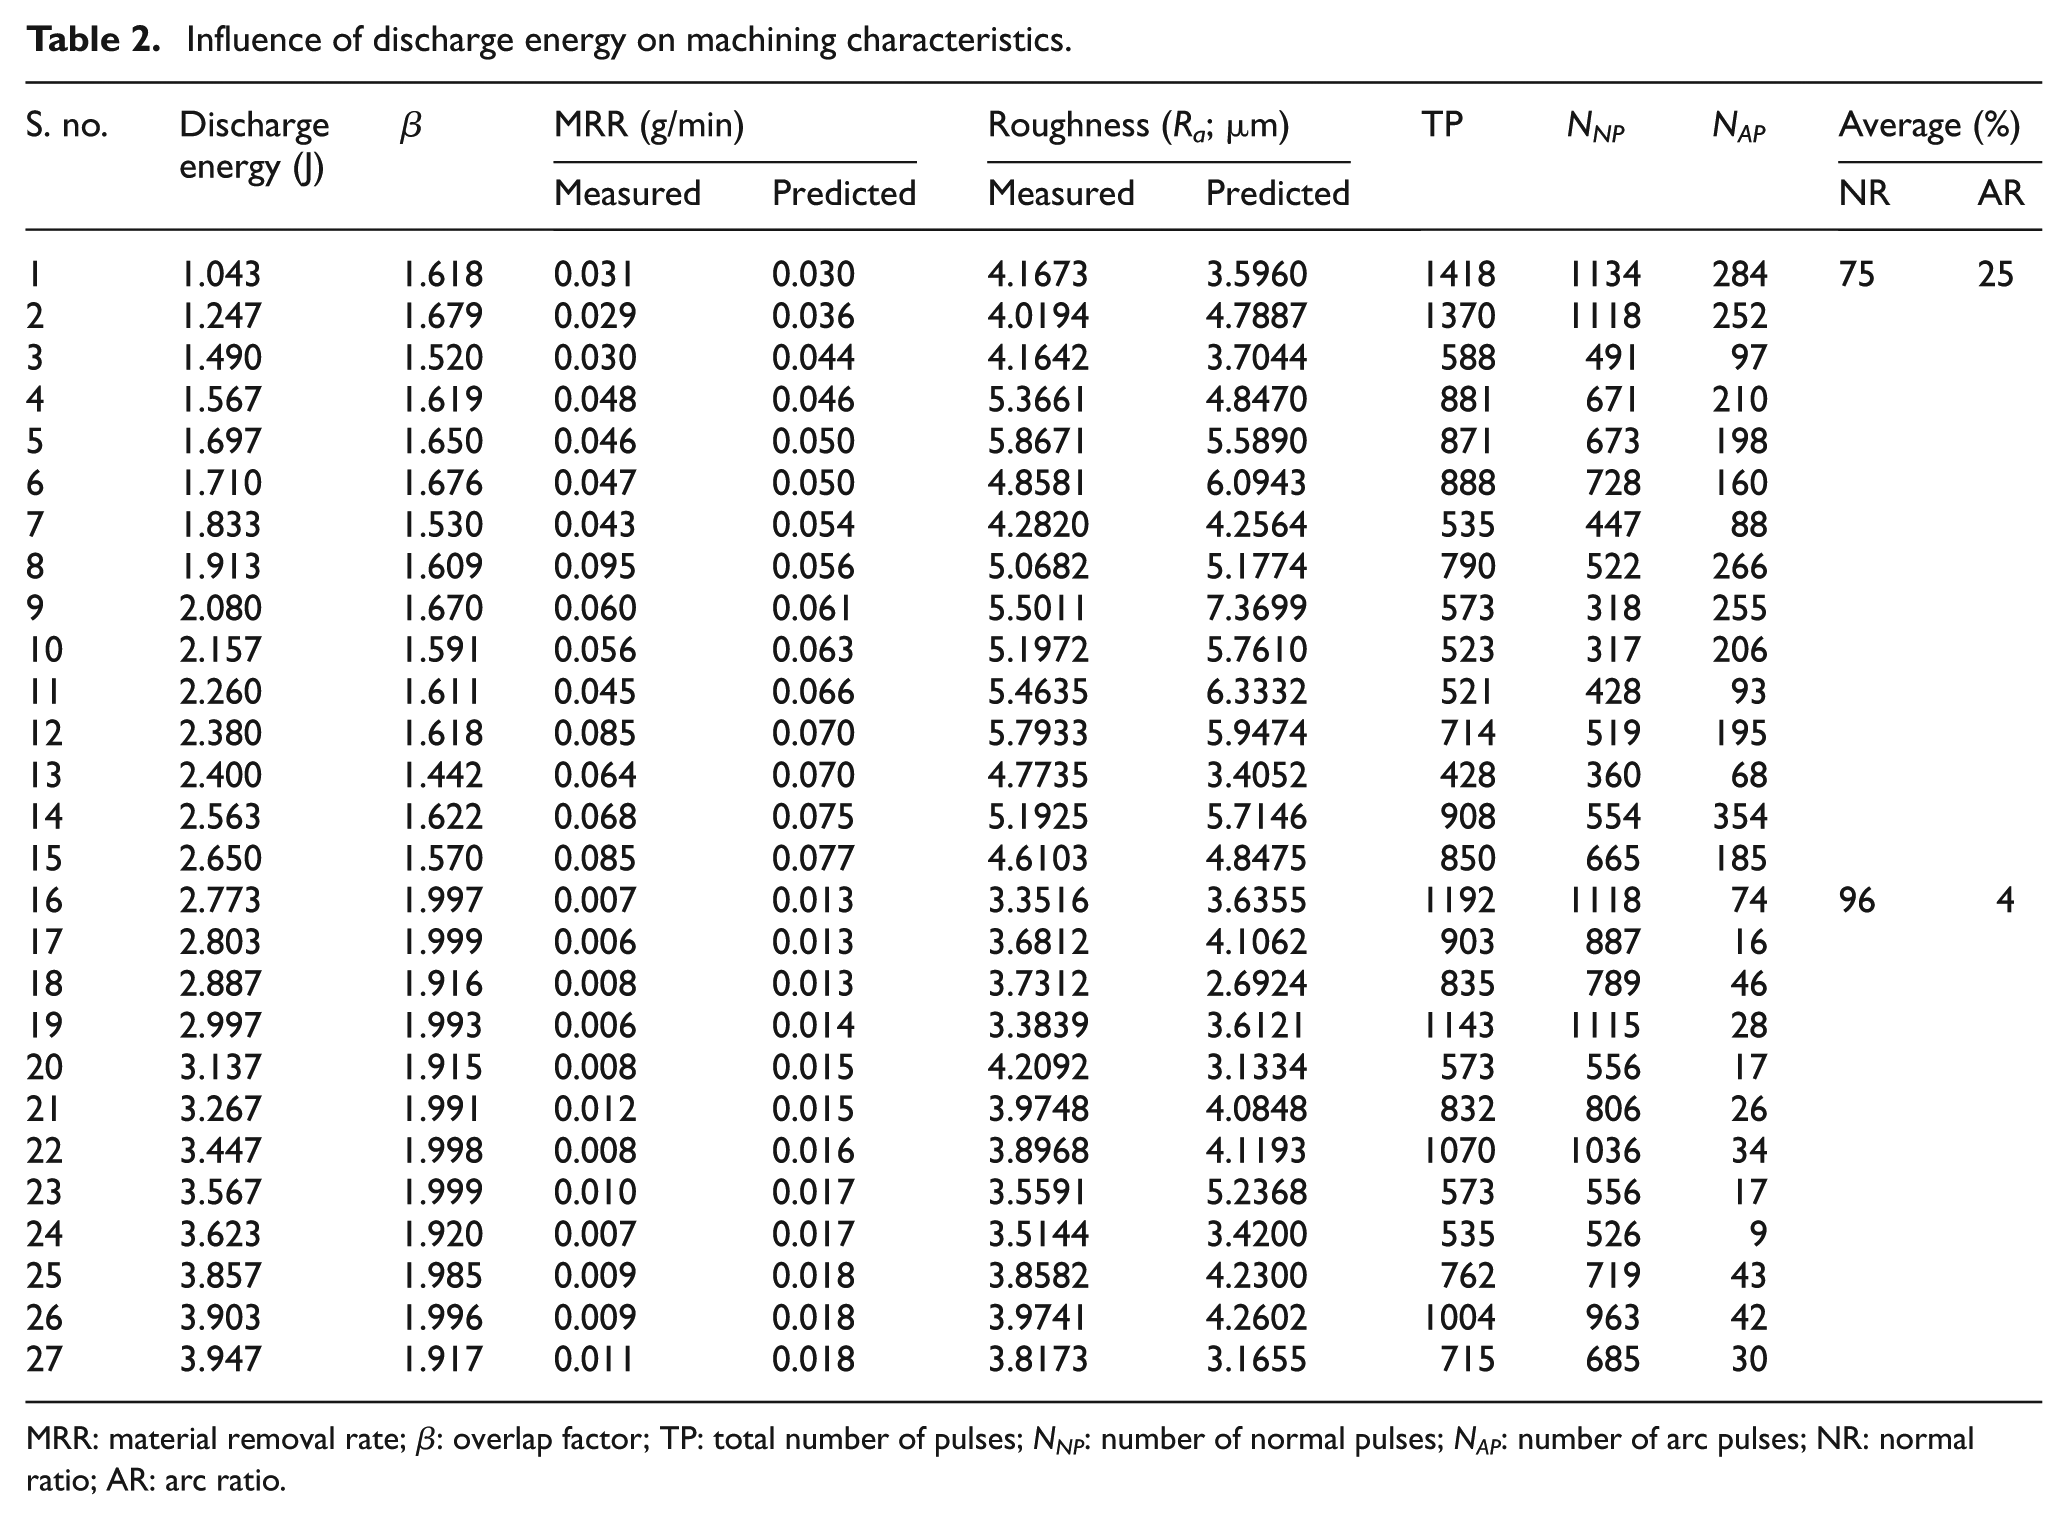
MRR: material removal rate; β: overlap factor; TP: total number of pulses; NNP: number of normal pulses; NAP: number of arc pulses; NR: normal ratio; AR: arc ratio.
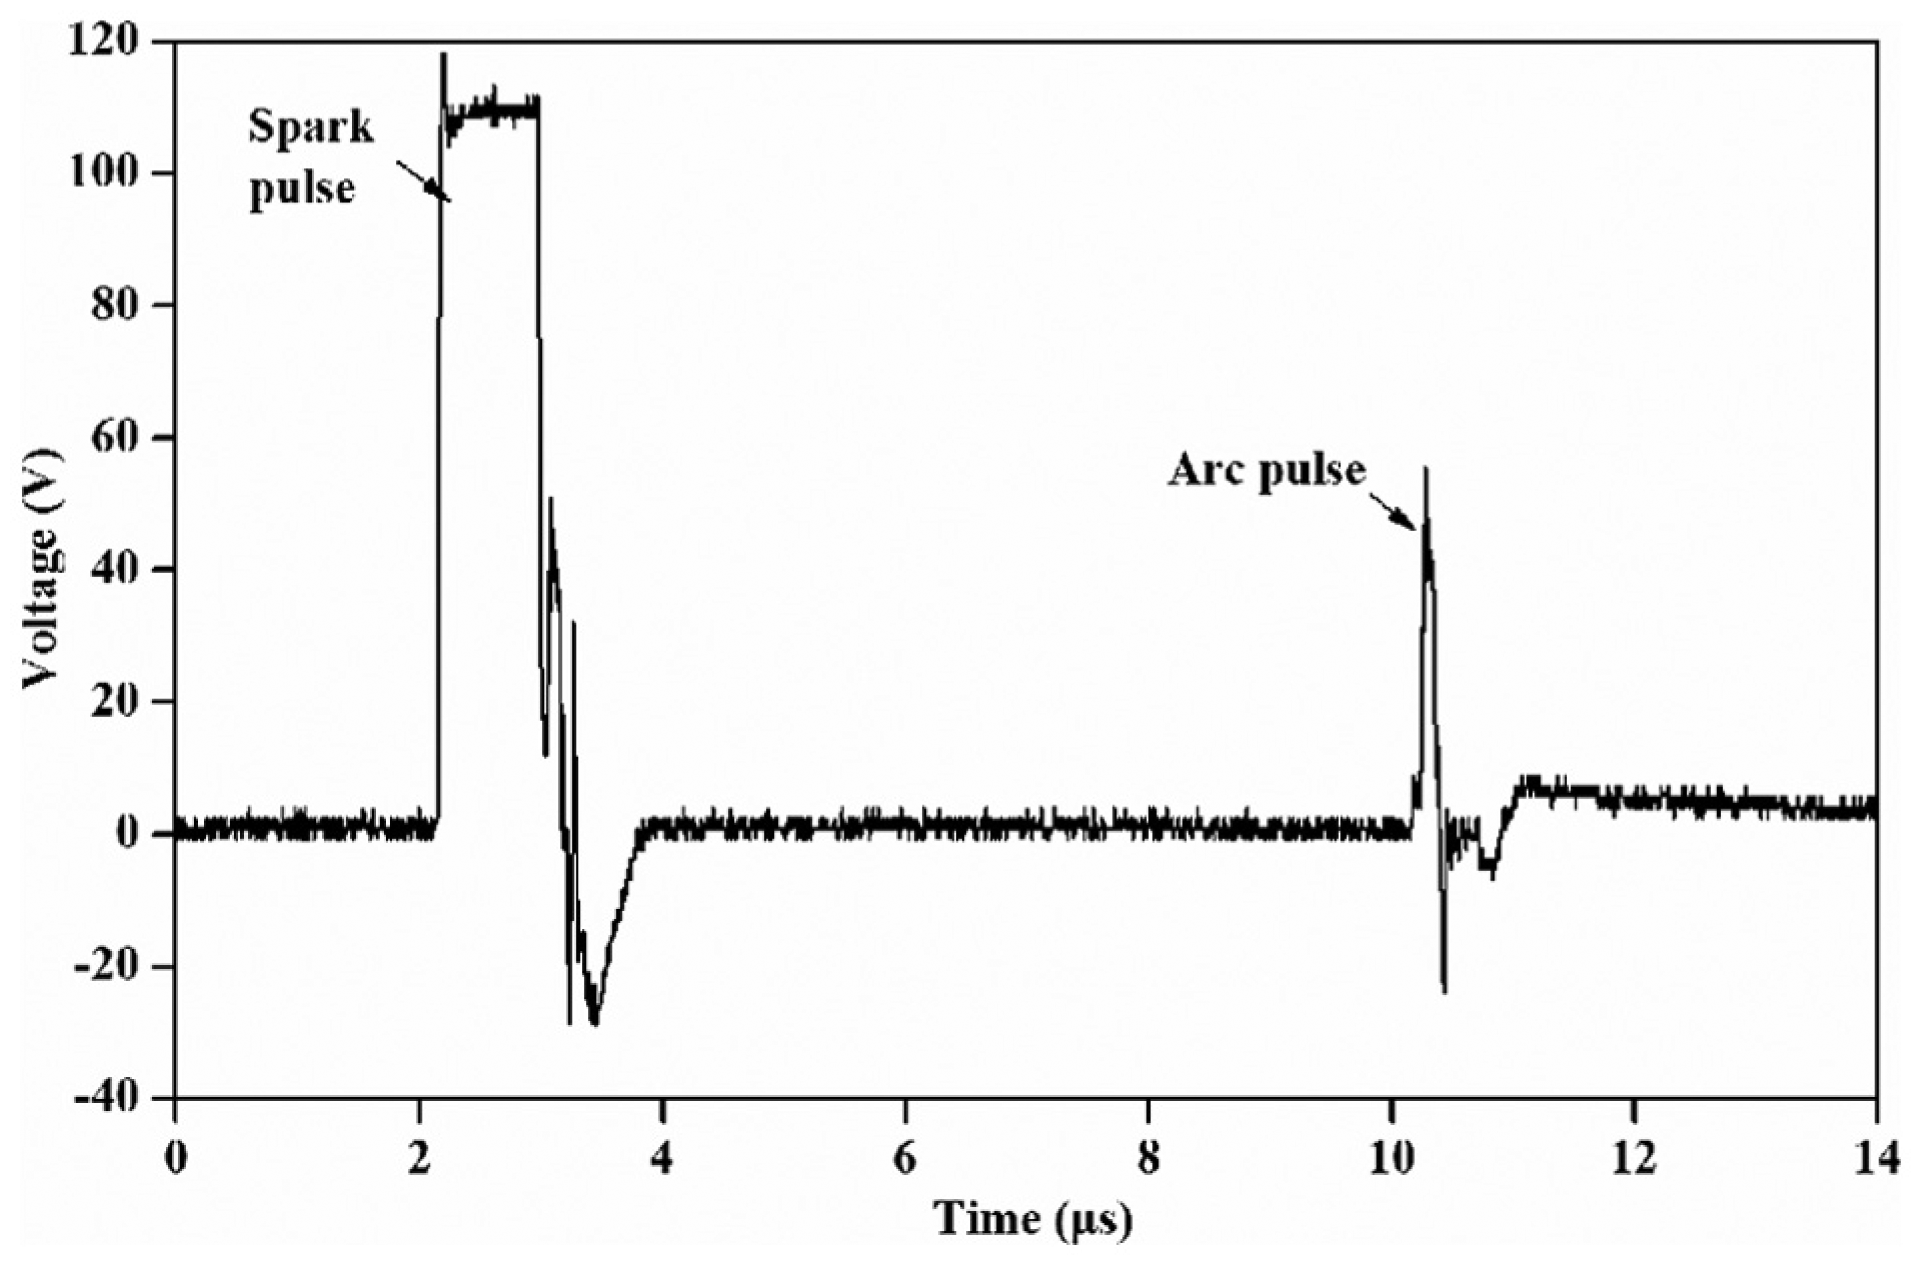
Typical voltage pulse train showing normal and arc pulses.
Results and discussion
In this work, the discharge energy is varied from lower order to higher order, and their influence on MRR and surface integrity is analyzed. Detailed discussion is presented in this section.
Effect of discharge energy on MRR
MRR is calculated using equation (30) which is given in Table 2, and the influence of discharge energy on MRR is shown in Figure 5. It is observed that MRR increases up to 2.7 J of discharge energy. Beyond 2.7 J of discharge energy, MRR is invariant and maintained around 0.008 g/min. From Table 2, it is observed that at lower discharge energy (up to 2.7 J), the magnitude of the discharge current is high, and the applied erosive power increases resulted in increased MRR. At lower discharge energy (below 2.7 J), more sparks occur and increase the arc discharges. Increase in the arc discharge affects the insulating state in the gap and increases wire vibration. The explosive force from plasma, the electrostatic force, the electromagnetic force and the flushing force acting on the wire become random, which increase the wire vibration. The increased wire vibration randomly removes the material from the workpiece surface at random and results in increased MRR.20,49 The increase in wire vibration can be observed from the high-speed image of spark captured using FASTCAM high-speed camera with 70- to 300-mm zoom lens recorded at the frame rate of 13,000 frames/s. From Figure 6(a), it is observed that at lower discharge energy of 1.913 J, wire vibrates, and the spark occurs randomly and removes more amount of material from the surface. The spilling of debris particles can be seen in Figure 6(a) which supplements more amount of material removed from the surface. Figure 6(b) shows the high-speed image of spark captured at discharge energy of 3.267 J, which reveals that less amount of material is removed from the workpiece, and there is no vibration observed at the sparking region. For all pulse-off time and spindle rotation, when the servo feed is maintained at 0.5 mm/min, the discharge energy varied between 2.7 and 4 J. Energy per spark is higher compared to that of the spark occurred at lower discharge energy (1–2.7 J). The high energy pulse vaporize small amount of material on the initial discharge. From Table 2, it is observed that the magnitude of discharge current is around 0.5 A for higher discharge energy. Low current magnitudes only remove a small amount of metal initially, but a large percentage is heated to the melting stage and gets redeposited back on the surface. As the discharge continues, more amount of heat is transferred into the material, which results in melting of more material. As the discharge ends, possibly the dielectric is unable to clear away this molten material which resolidifies back onto the surface as the recast layer.50,51 At higher discharge energy, the MRR is invariant (around 0.008 g/min), which may be due to the consequence of low servo feed (0.5 mm/min) that restricted MRR. Figure 7 shows the scanning electron microscope (SEM) images of components machined at different energies. From the SEM micrograph, it is observed that more amount of material is removed at lower discharge energy (1.567 J) as shown in Figure 7(a), and at higher discharge energy (3.137 J), more amount of material is melted and redeposited back onto the machined surface, as shown in Figure 7(b), which supports the variation in MRR at different discharge energies.
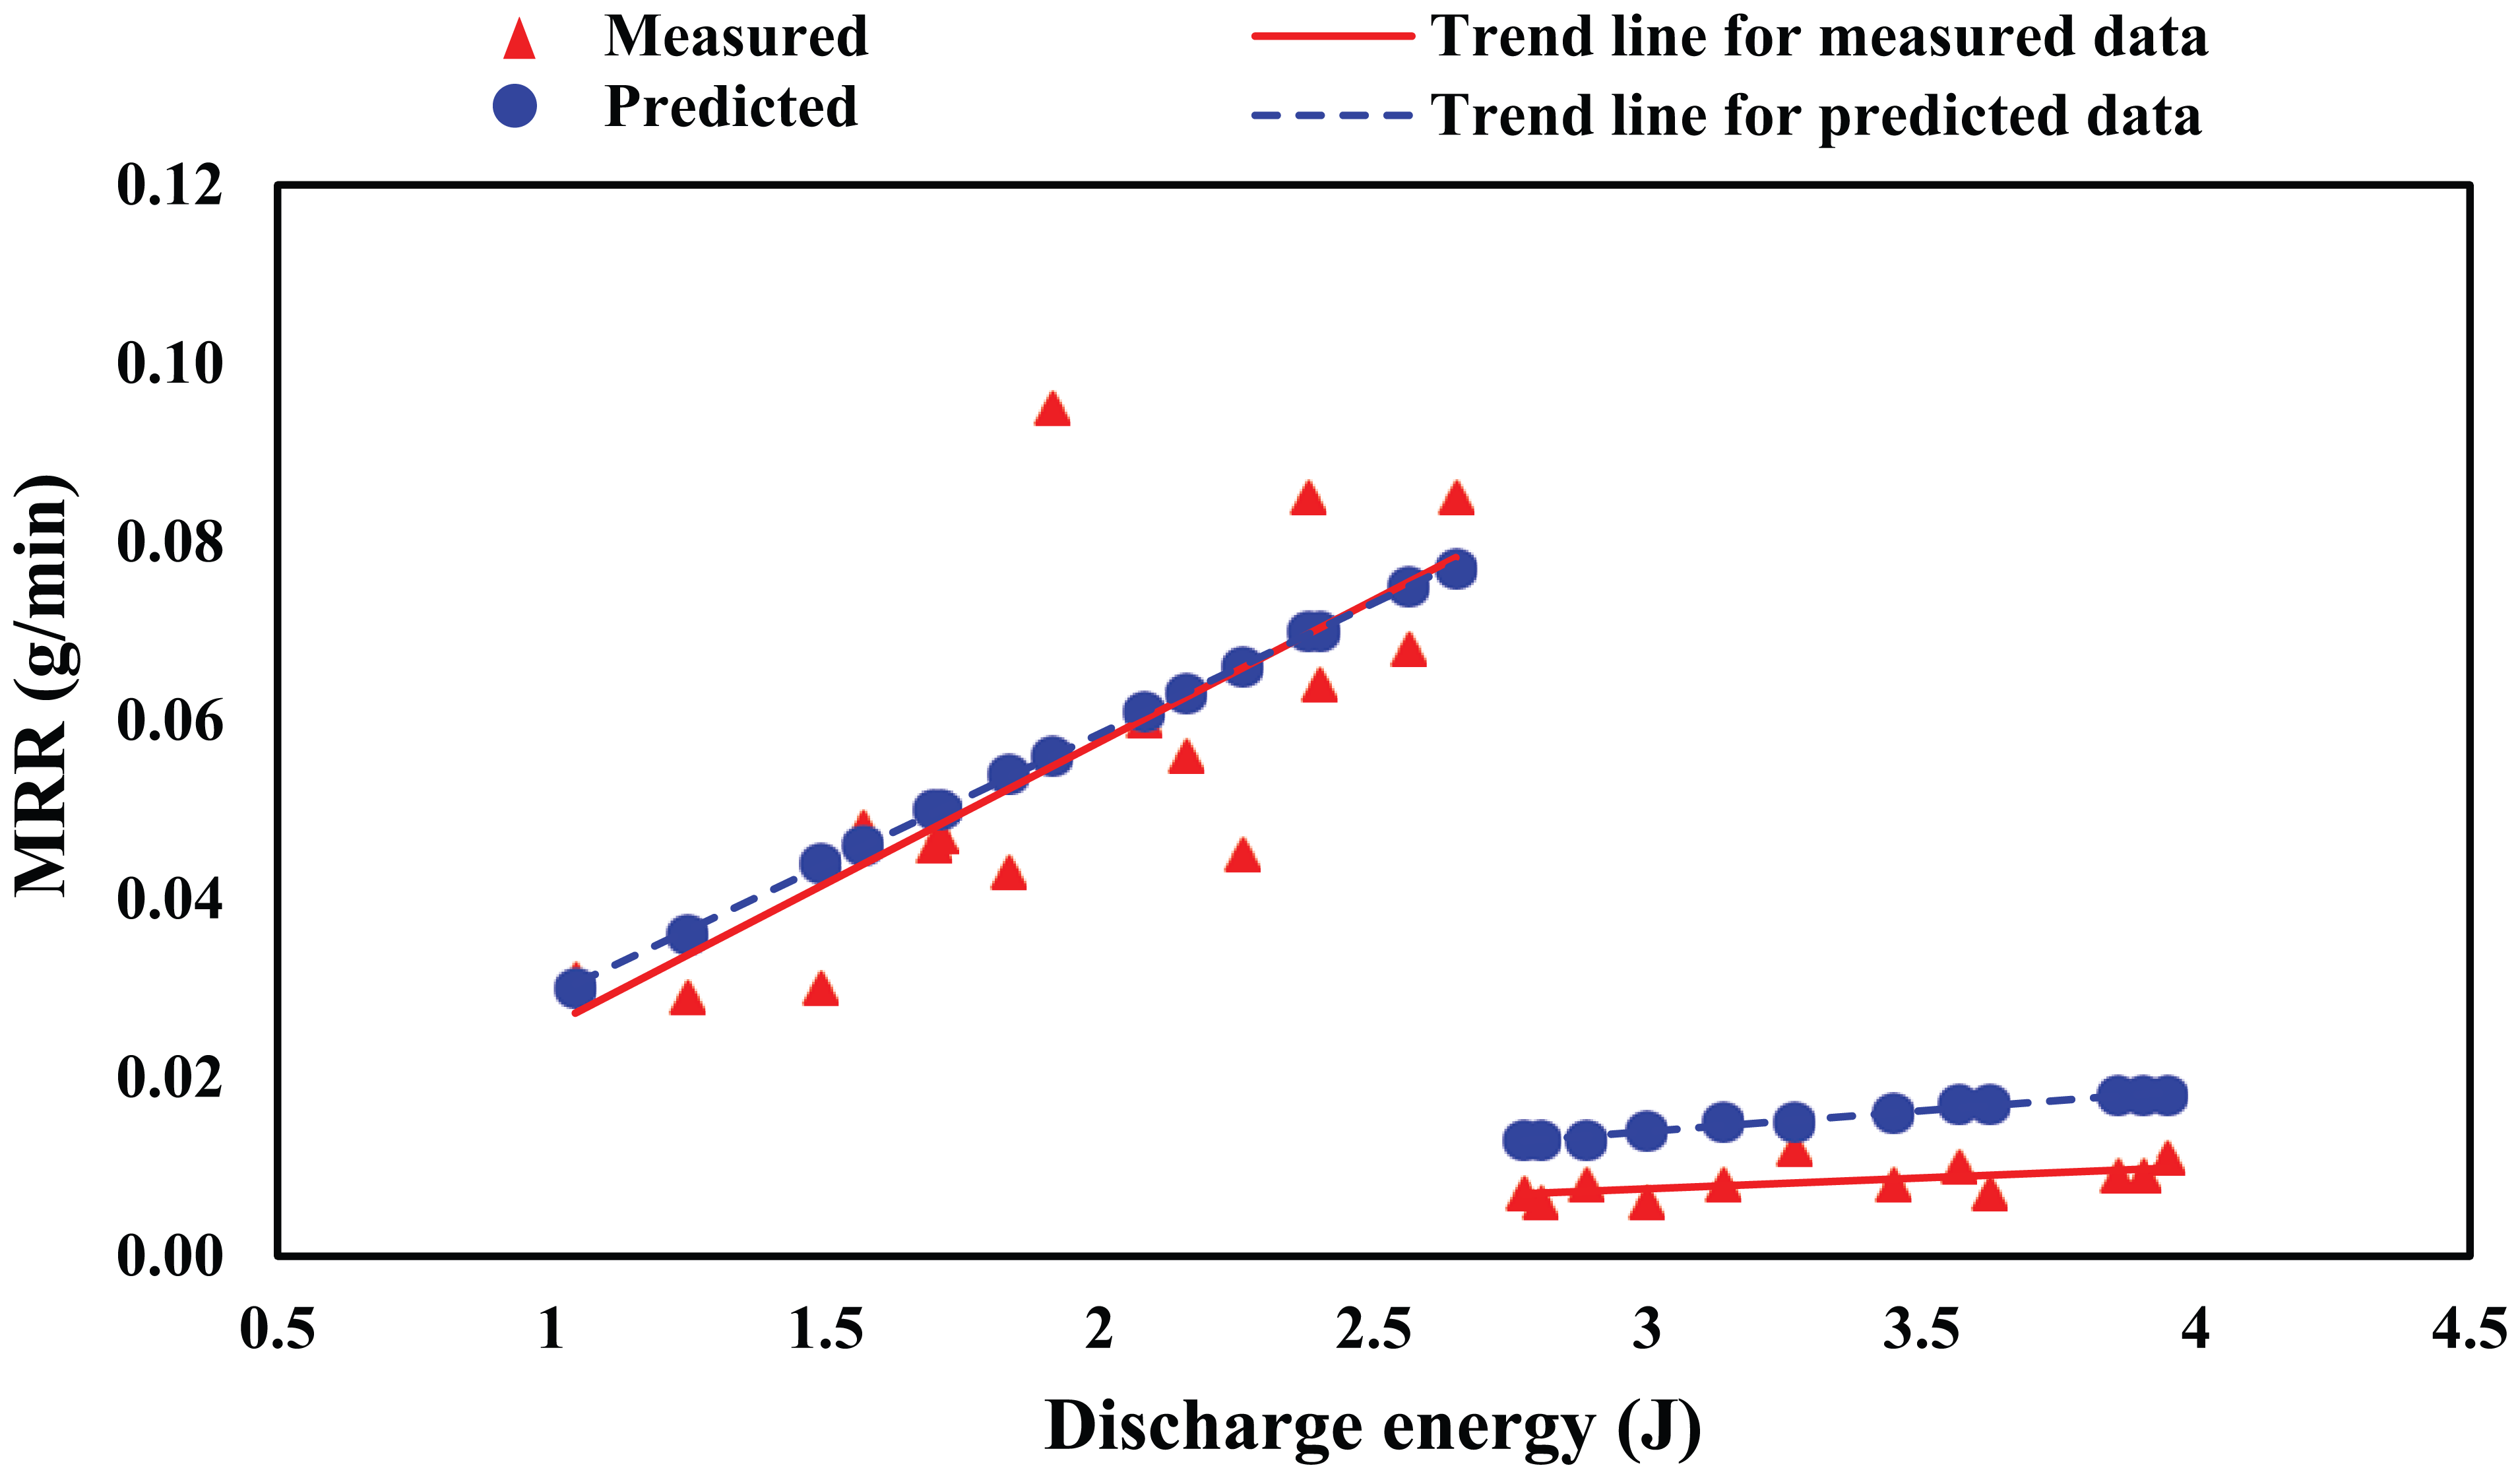
Effect of discharge energy on MRR.
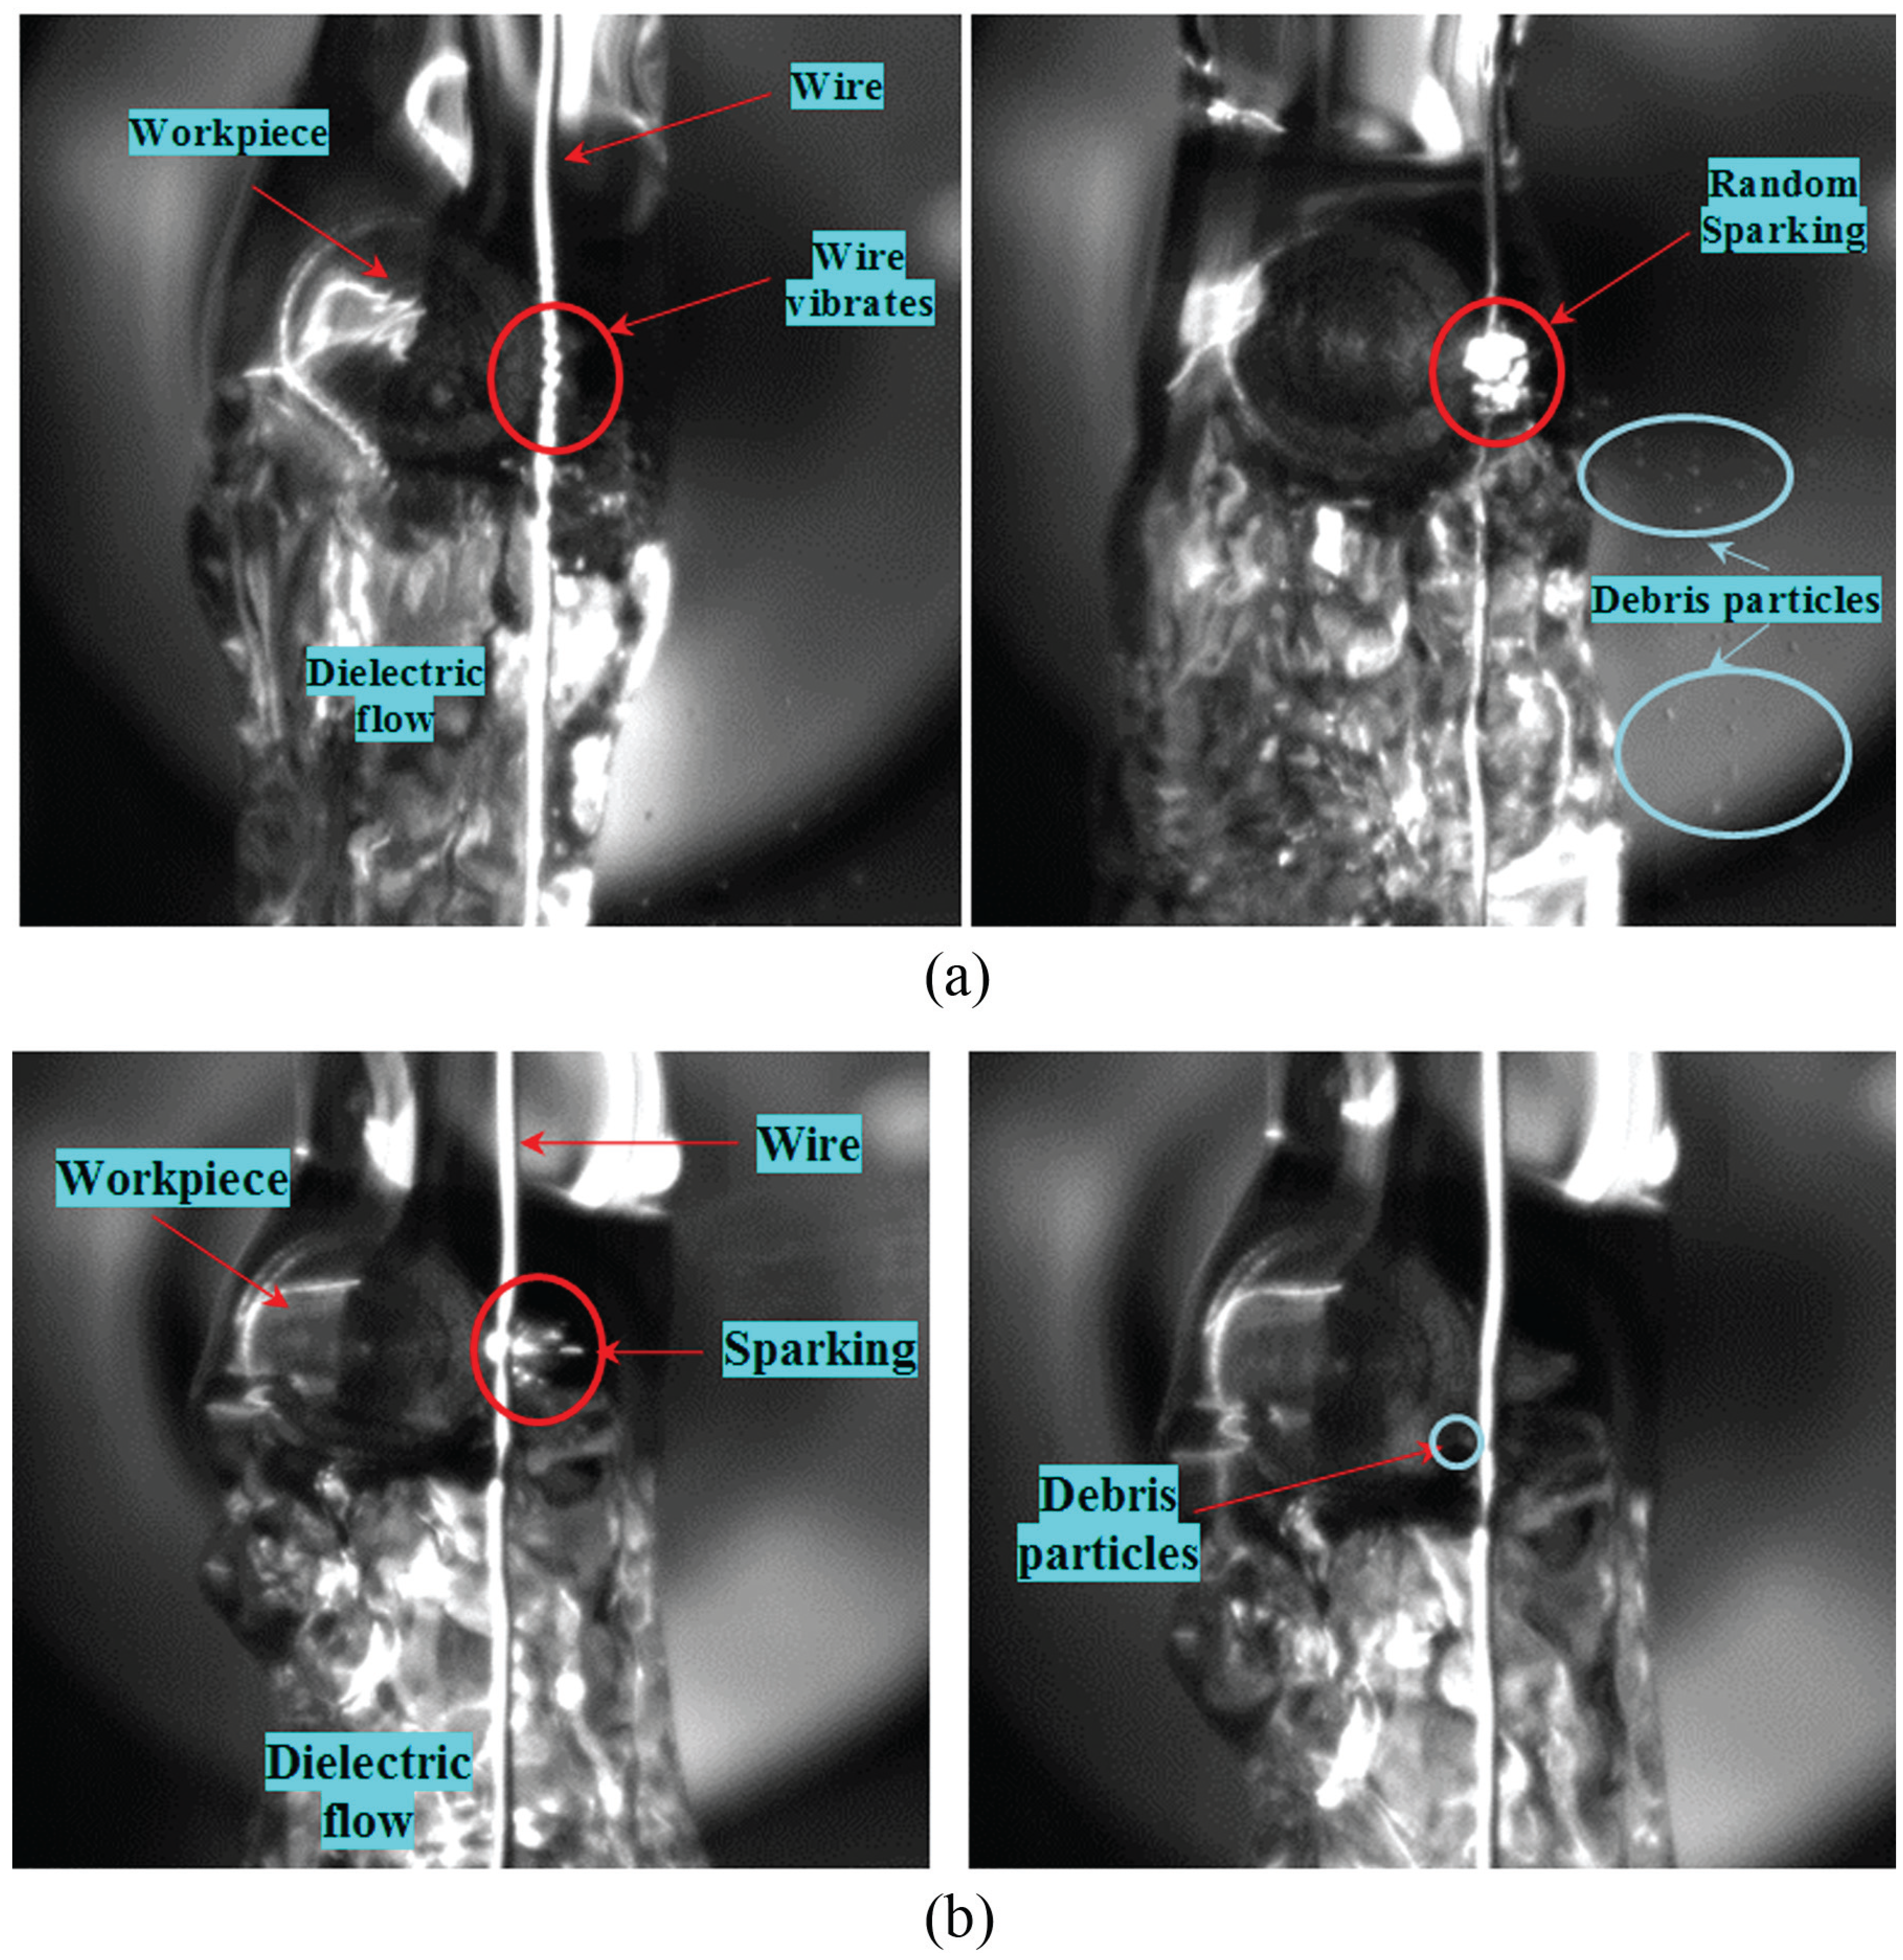
High-speed images of spark at different discharge energies: (a) at lower discharge energy (1.913 J) and (b) at higher discharge energy (3.267 J).
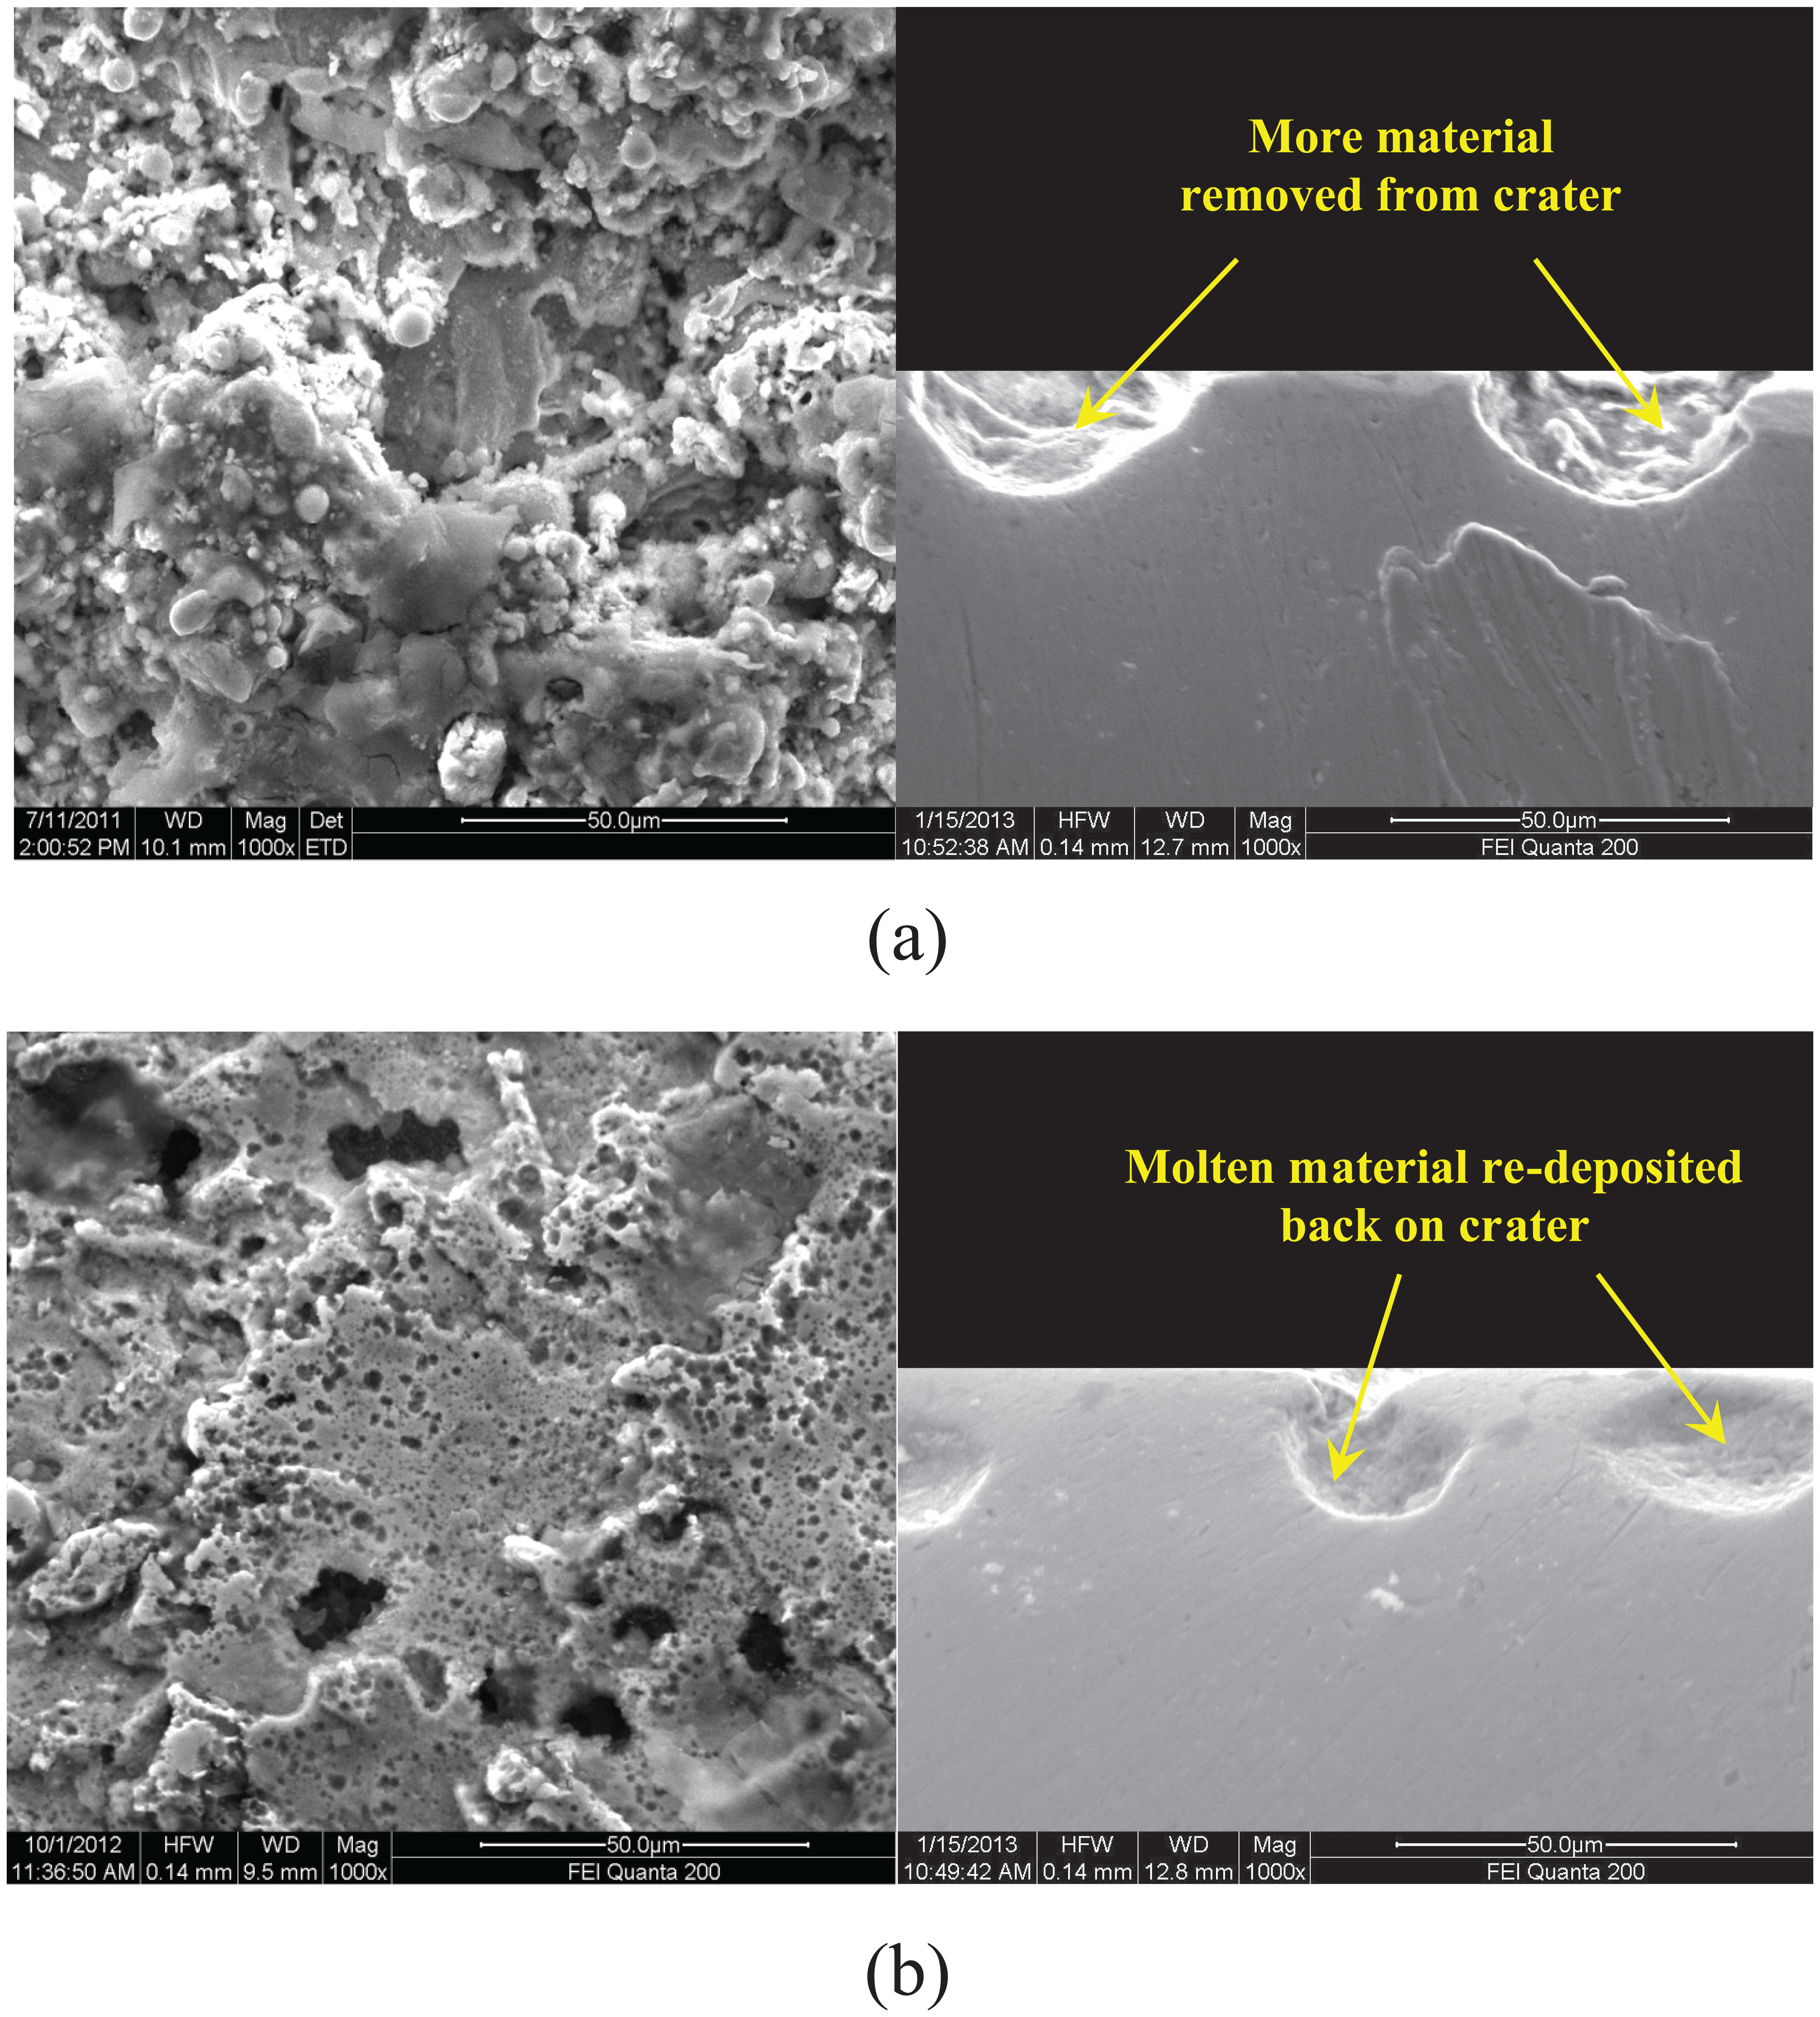
SEM micrograph of machined surface at different discharge energies: (a) at lower discharge energy (1.567 J) and (b) at higher discharge energy (3.137 J).
Validation of the proposed model for MRR
The theoretical model developed to predict the MRR is validated from experimental results, taking samples whose energy varies from lower order to higher order as shown in Figure 5. The measured and predicted MRRs are given in Table 2. It is observed from Table 2 that the MRRs predicted by the model have similar trend with experimental results. From Table 2, it is observed that the experimental measured MRR is high at lower discharge energy (below 2.7 J) compared to that of higher discharge energy (above 2.7 J). For all pulse-off time and spindle rotation, lower discharge energy (below 2.7 J) is observed when the servo feed is varied between 3.2 and 8.2 mm/min, and higher discharge energy is observed at servo feed of 0.5 mm/min. When the servo feed is varied between 3.2 and 8.2 mm/min, the effective spark gap reduces by 6–16 times compared to that of 0.5 mm/min of servo feed. The snap shot of WEDM machine screen showing the machine speed for different servo feeds is shown in Figure 8. It is observed from Table 2 that the total number of pulses at higher discharge energy is in the range of 535–1192, whereas for lower discharge energy, it is 428–1418. Although the total number of pulses seems to be similar for both higher and lower discharge energies, the reduction in the machining gap (6–16 times) at lower discharge energy leads to increased pulse density in the gap compared to that of higher discharge energy. The increased pulse density on wire front results in insufficient deionization time and space, which leads to arcing in the gap.18,52 This can be observed from the voltage pulse train acquired for time duration of 100 ms at different discharge energies (Figure 9). The arc pulse is observed after the occurrence of train of normal pulse. It is also observed that at discharge energy below 2.7 J, the average normal ratio (ratio of number of normal pulse to total number of pulses) is 75%, whereas the average arc ratio (ratio of number of arc pulse to total number of pulse) is 25%. At higher discharge energy (above 2.7 J), the average normal ratio is 96%, whereas the average arc ratio is 4%. This increased arc ratio at lower discharge energy is attributed to increased MRR. The contribution of normal pulse is small, whereas major portion of material is removed from the workpiece because of arc pulse. 45 As stated in section “Analysis of MRR,” the factor “α” is considered to account the effect of arc pulse for predicting MRR at lower discharge energy. From Table 2, it is observed experimentally that at higher discharge energy (above 2.7 J), the average arc ratio is 4%, whereas at lower discharge energy (below 2.7 J), it is 25%; that is, when the discharge energy is varied from higher order to lower order, the incidence of average number of arc pulse increases from 4% to 25% (increases by 6.25 times). Therefore, to predict MRR at lower discharge energy, factor “α” is taken as 6.25 and is included in equation (14). For higher discharge energy (above 2.7 J), equation (15) is used, and the results are presented in Table 2. MRR predicted by the model overpredicts compared to that of experimental values at higher discharge energy. At higher discharge energy, the effect of arc pulse is 4% which is negligible (dominant sparking), and the dominant effect of normal pulse removes less amount of material from the surface. This resulted in variation between the measured and predicted MRR at higher discharge energy.
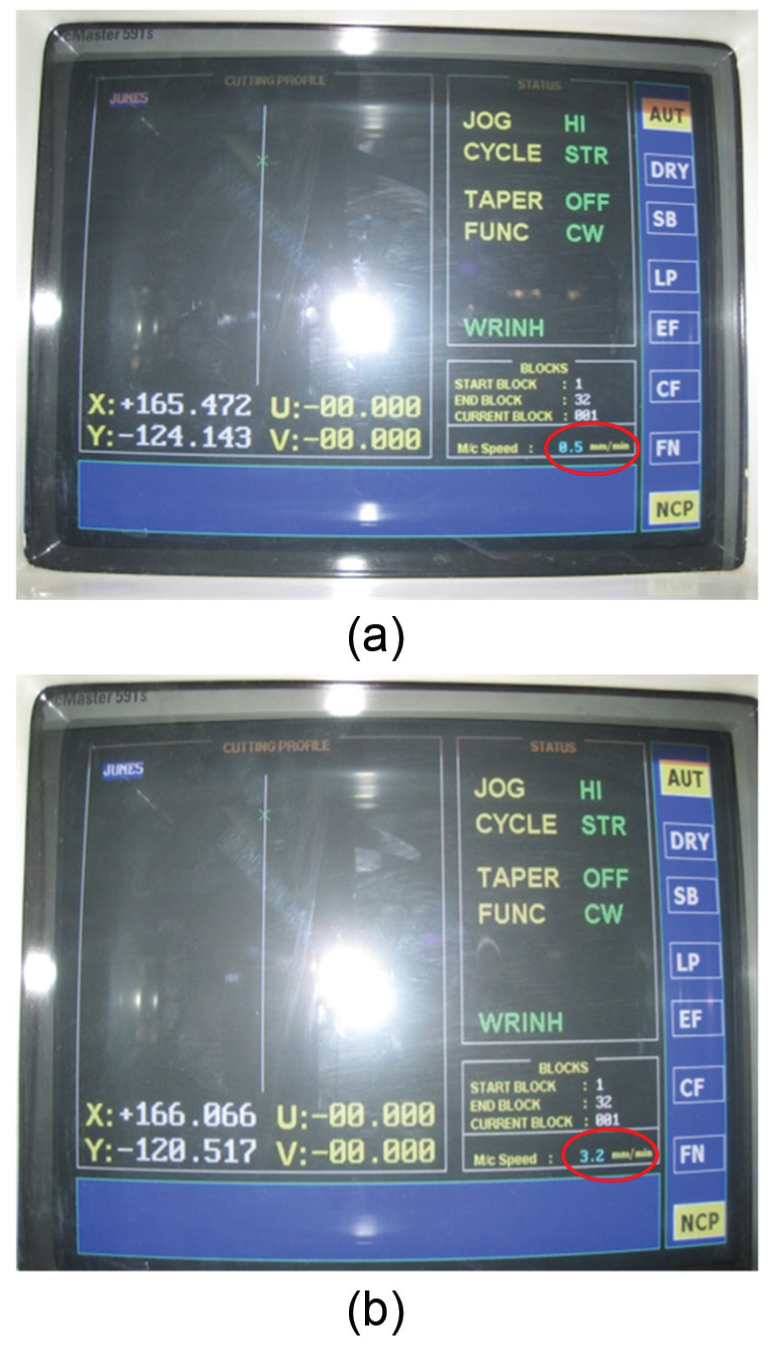
Snap shots of machine screen showing different servo feeds: (a) servo feed of 0.5 mm/min and (b) servo feed of 3.2 mm/min.
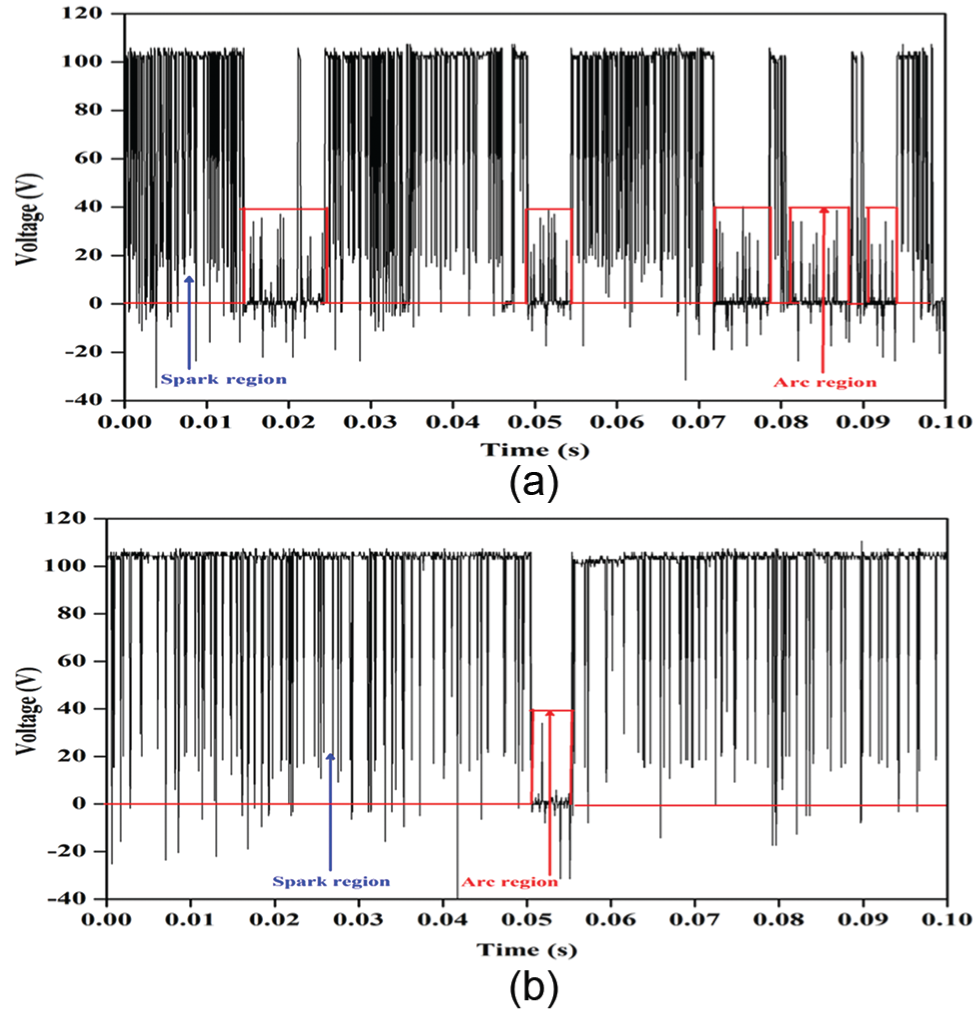
Voltage pulse train acquired at different discharge energies: (a) at lower discharge energy (1.567 J) and (b) at higher discharge energy (3.137 J).
Significance of discharge energy on surface integrity
Effect of discharge energy on surface finish
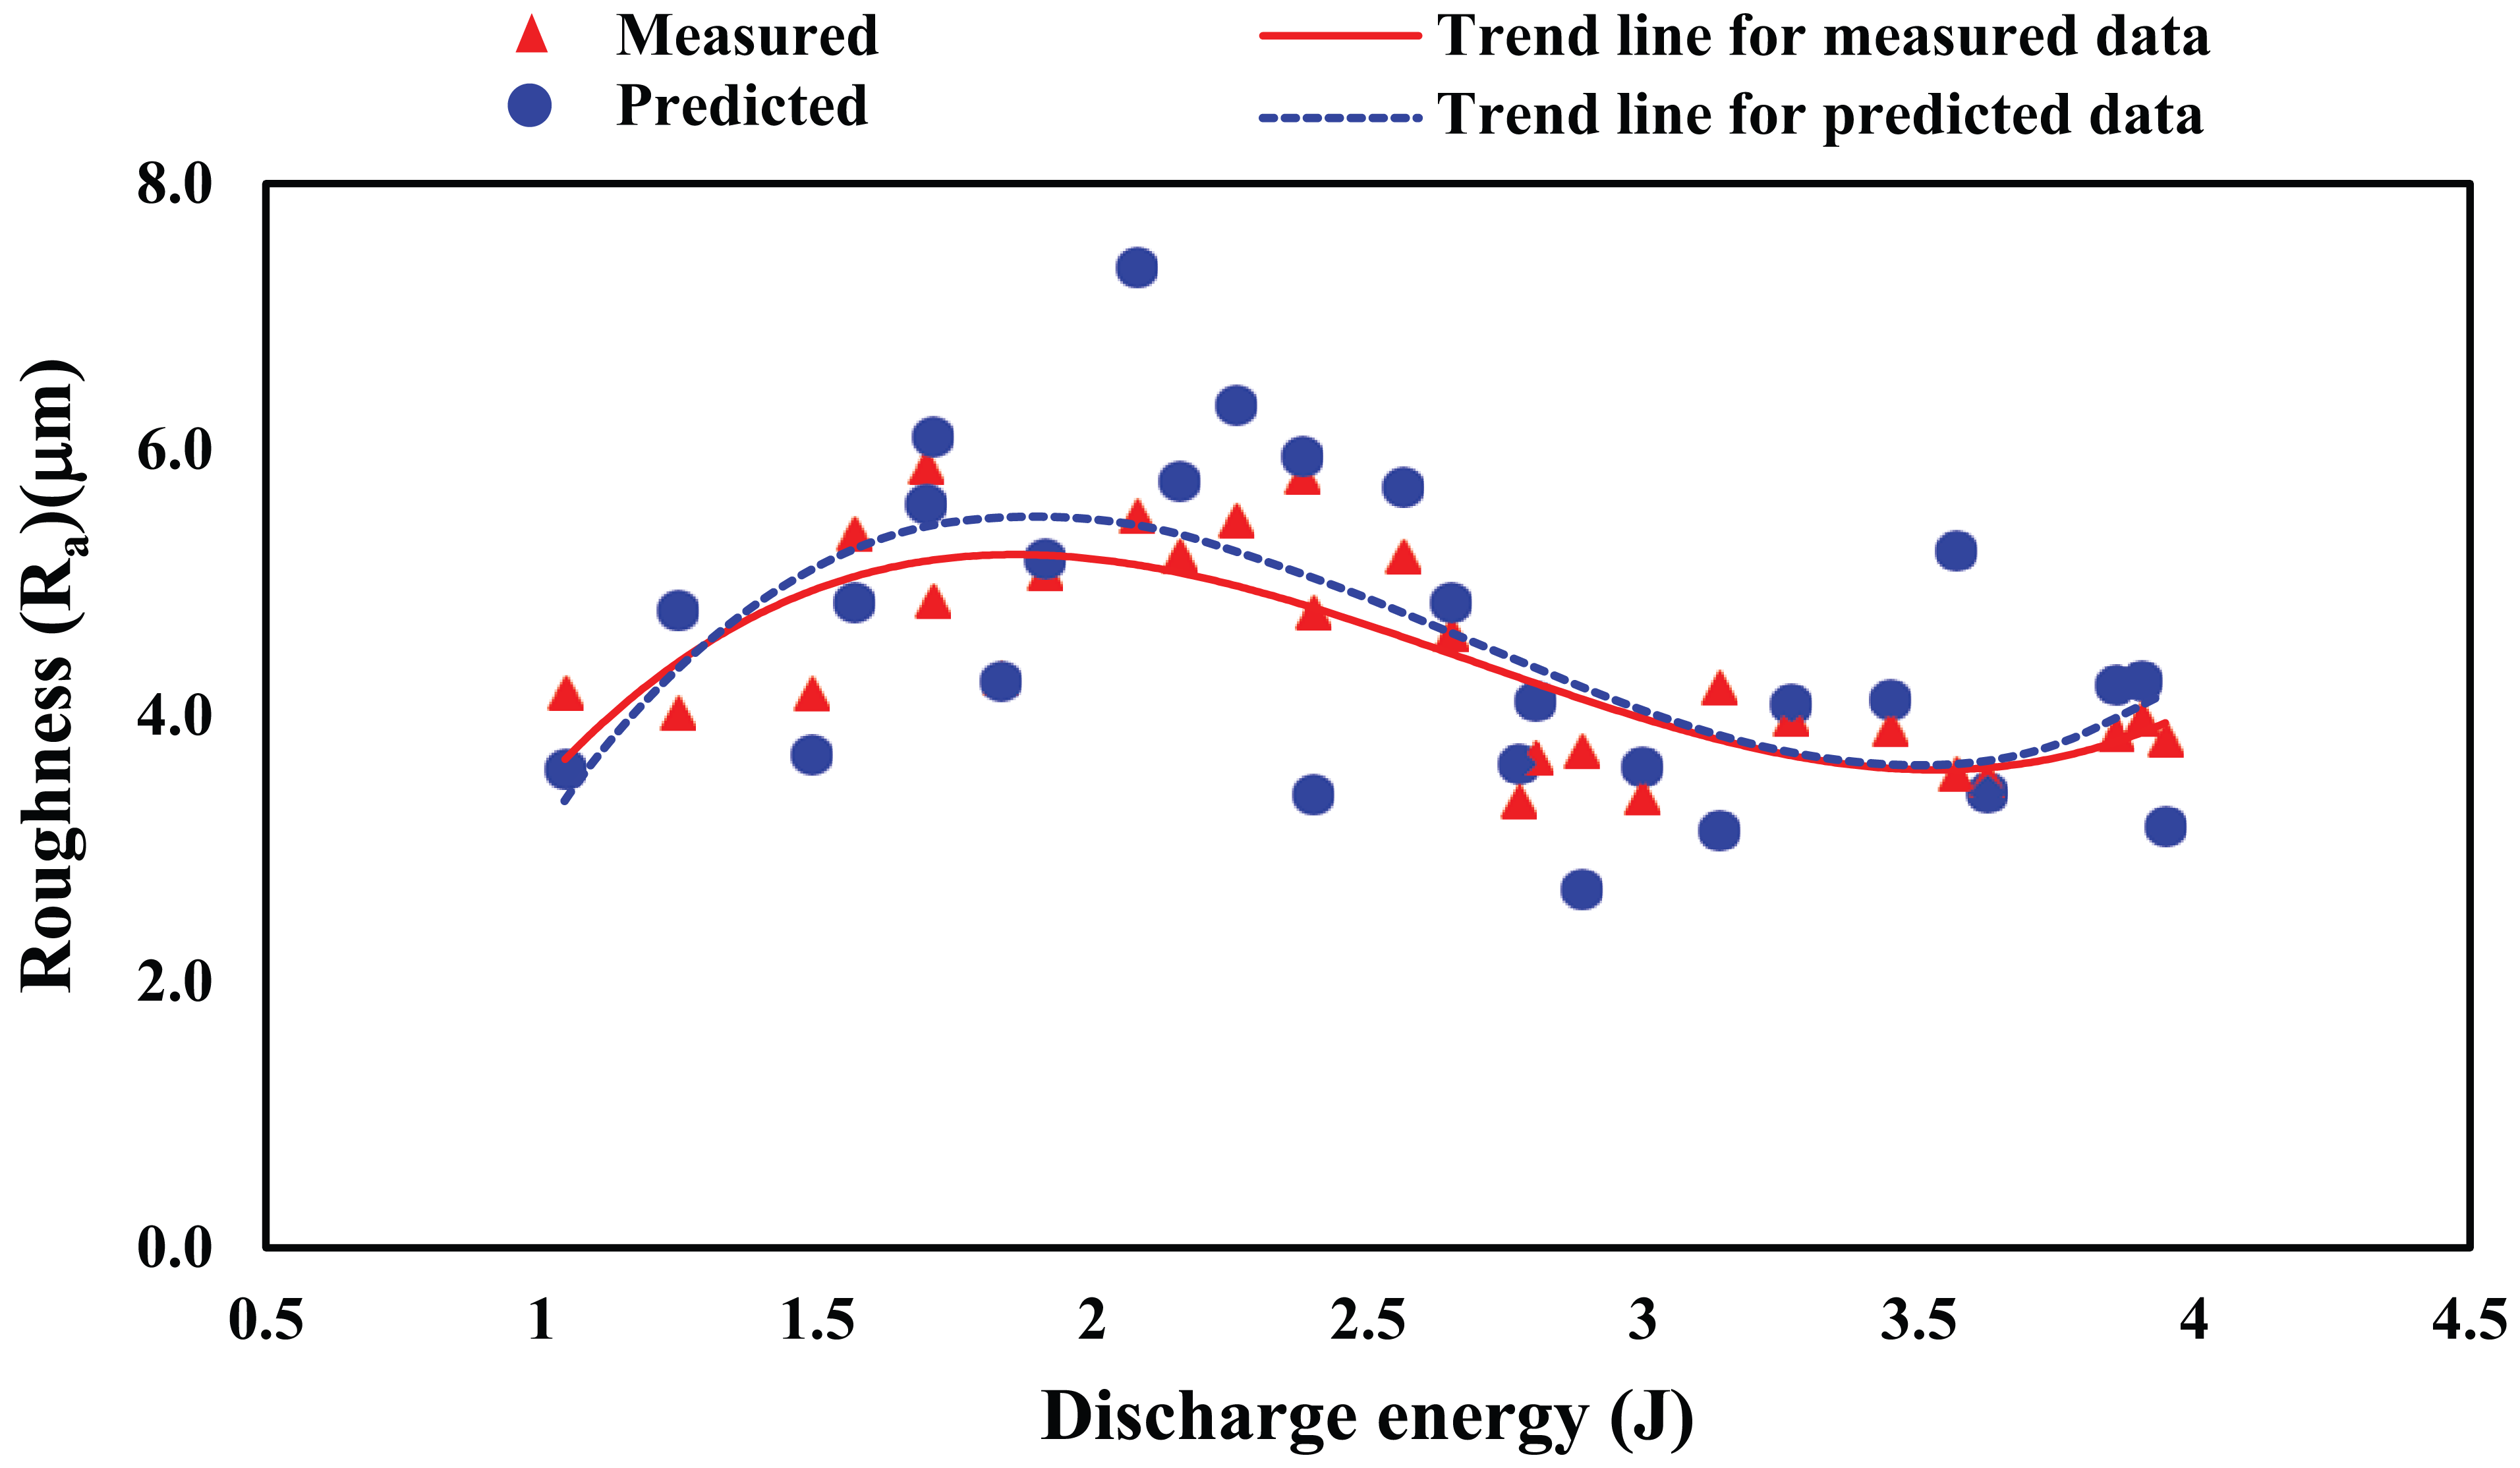
The distinct variation in roughness with discharge energy is shown in Figure 10. It is observed that roughness increases initially and is invariant at higher discharge energy. At lower discharge energy of up to 2.7 J, the roughness varied from 4 to 5.5 µm. At higher discharge energy (above 2.7 J), the roughness is maintained around 4 µm. The 3D topography of unmachined surface before machining is shown in Figure 11. The 3D topography is measured using Bruker ContourGT taken at magnification of 10.49×, scanning length of 100 µm, measured area of 582 µm × 437 µm. The influence of discharge energy on surface finish of the machined component can be observed from component machined at lower discharge energy of 1.567 J (Figure 12(a)) and higher discharge energy of 3.137 J (Figure 12(b)). From Figure 12(a), it can be seen that machining is not uniform, and more amount of material is removed from the surface. Due to the incidence of arc pulse, the wire vibrates and results in the removal of more materials from the surface at random locations. The removal of material at random locations leads to the formation of discrete crater (as shown in Figure 12(a)). Also, due to arcing, more amount of material is removed from the surface and the unexpelled materials resolidify back onto the surface which can be seen as resolidified patch in Figure 12(a). Figure 12(b) reveals less amount of material removed from the surface, and it is possible to identify the individual craters. At 1–1.5 J of discharge energy, the heat developed by each spark is low and that the material is heated to its melting point, which leads to the formation of shallow crater, thereby resulting in a smooth surface. As the discharge energy is increased between 1.5 and 2.7 J, the energy content of each spark increases, which melts and vaporizes more amount of material leading to arcing. The dielectric is unable to flush away all the molten material that results in random and discrete spark (as shown in Figure 12(a)), thereby generating a rough surface.1,4 A higher discharge energy (above 2.7 J) is associated with low current magnitudes (around 0.5 A) as given in Table 2, which melts large amount of material and gets resolidified back onto the surface resulting in a smooth surface (can be observed from SEM micrograph of components shown in Figure 7). The incidence of arc pulse generated a rough surface at lower discharge energy compared to that of higher discharge energy which can be observed from the variation in maximum peak-to-valley height (Rt) of the 2D surface profile shown in Figure 12(a). At higher discharge energy, the molten material resolidifies back onto the machined surface that leads to reduced maximum peak-to-valley height (Rt) as shown in Figure 11(b).
Effect of discharge energy on surface roughness.
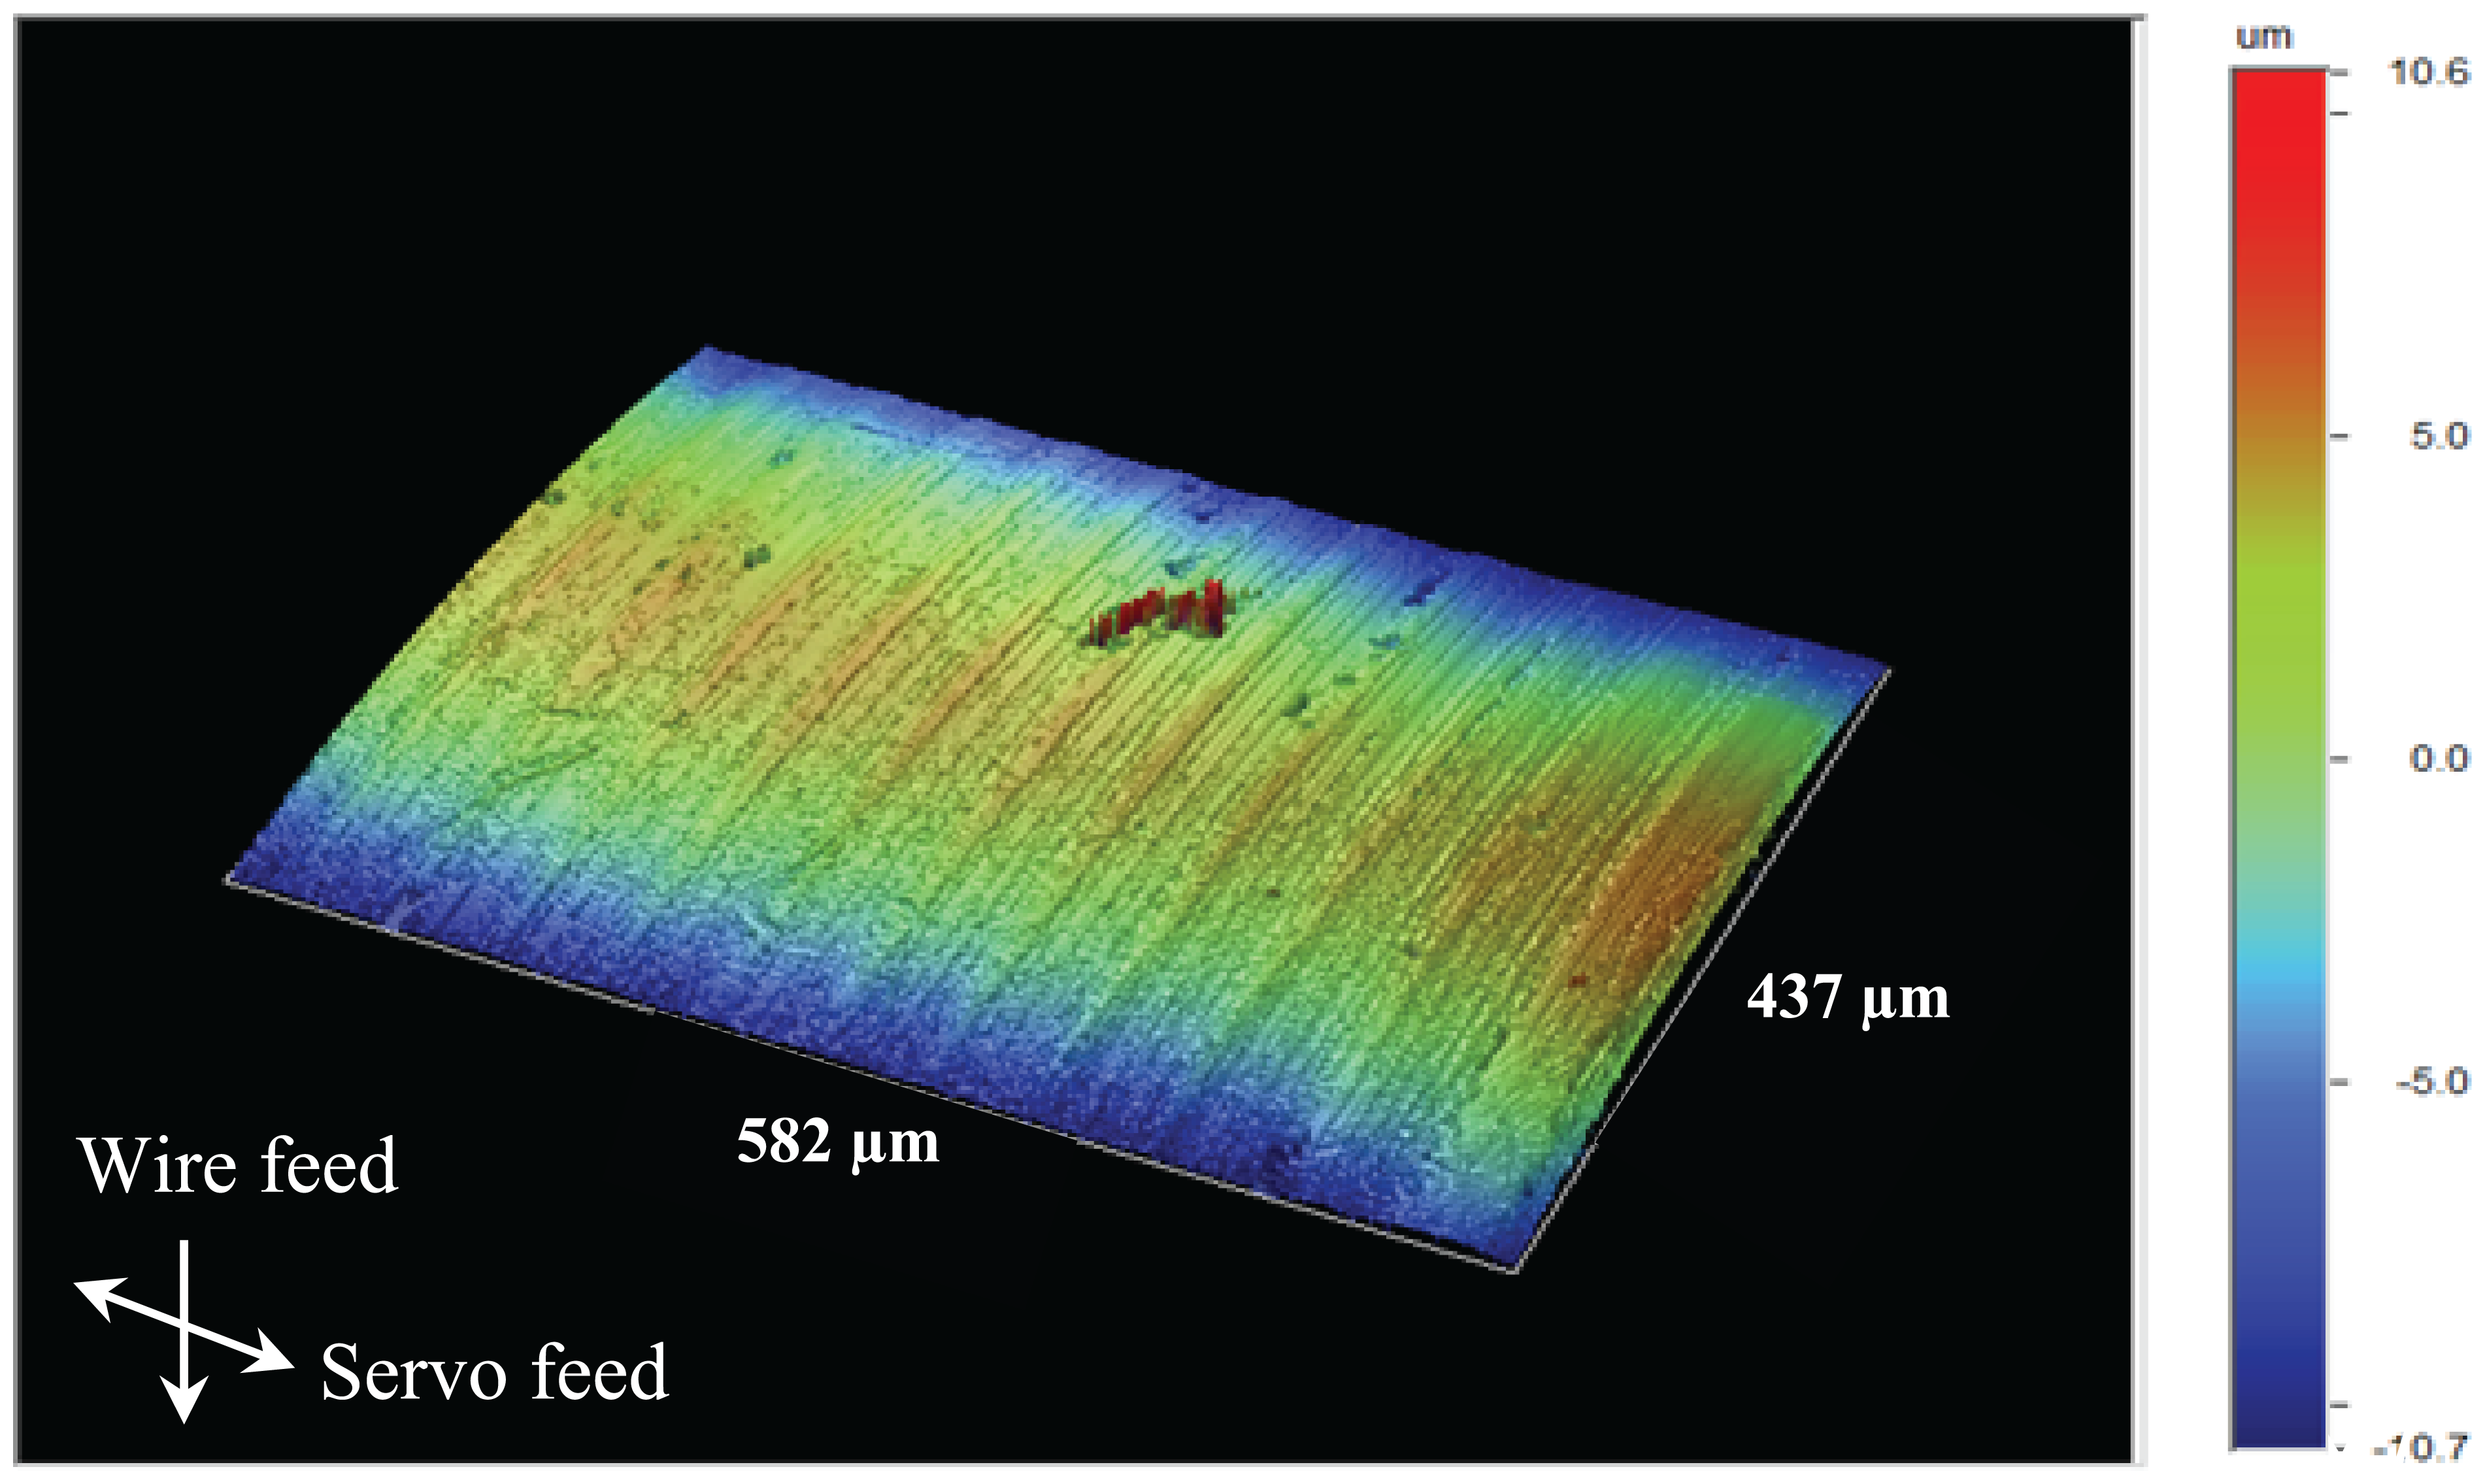
3D surface topography of surface before machining.
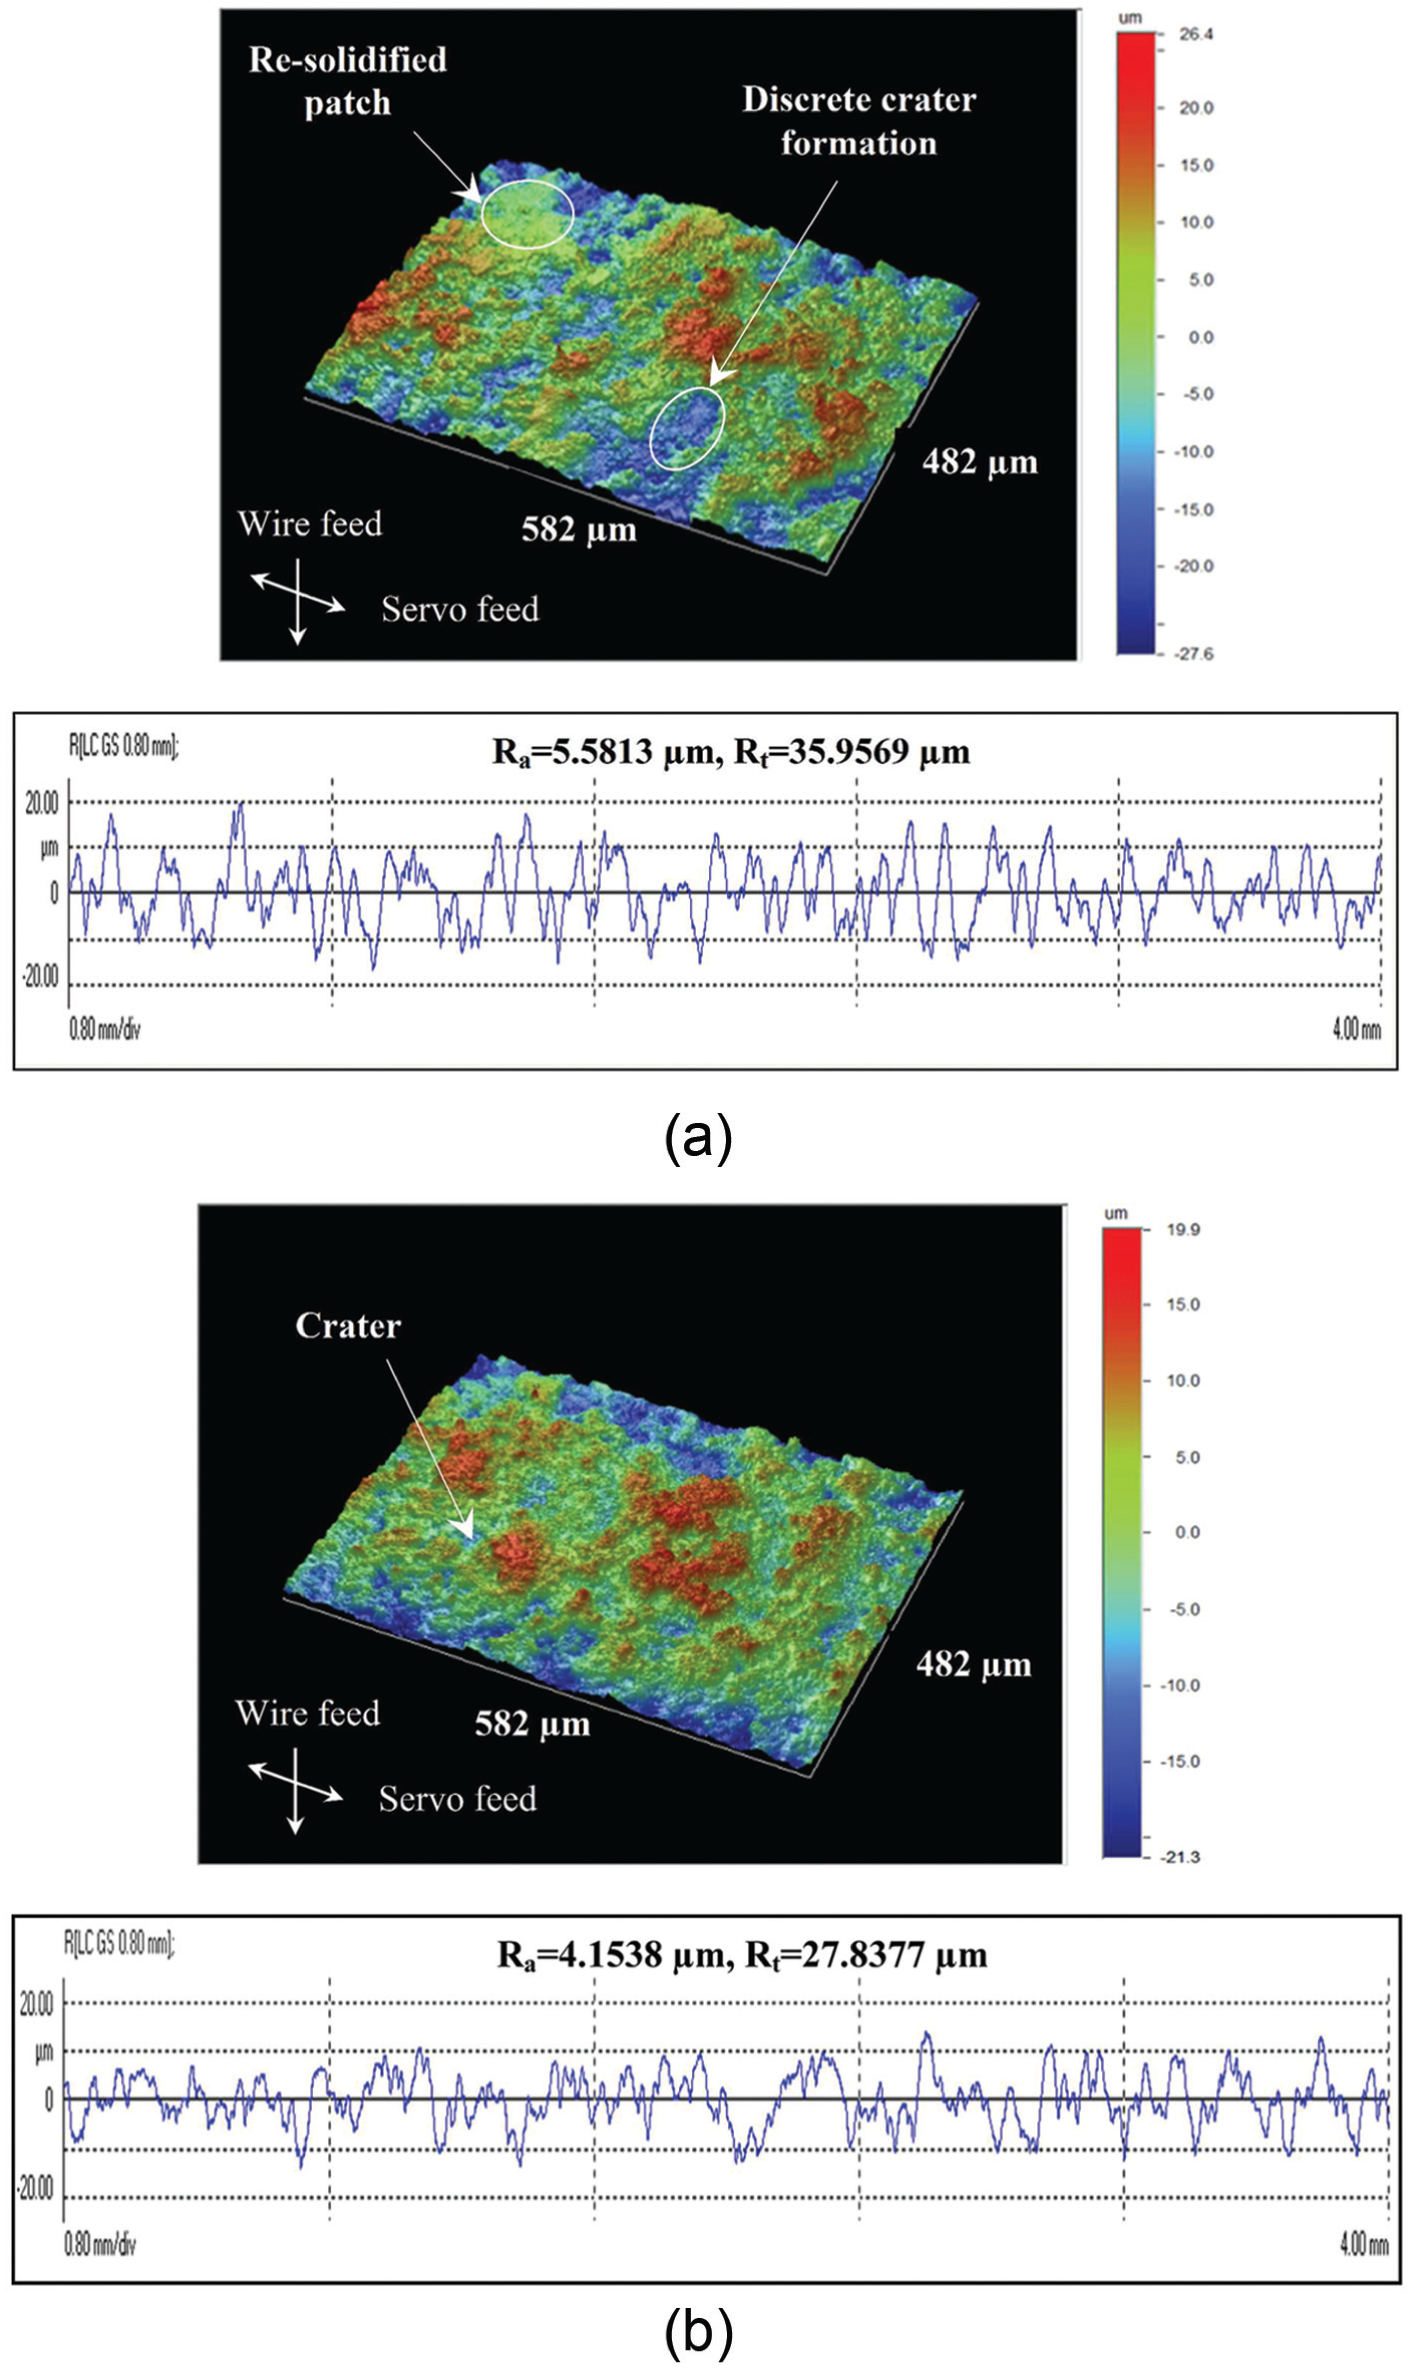
3D surface topography and 2D profile of surface after machining: (a) at lower discharge energy (1.567 J) and (b) at higher discharge energy (3.137 J).
Validation of the proposed model for surface roughness
The influence of discharge energy on surface finish is analyzed by varying energy from lower order to higher order which is given in Table 2 and Figure 10. The surface roughness is calculated using equation (28) for lower discharge energy (below 2.7 J) and using equation (29) for higher discharge energy (above 2.7 J). At lower discharge energy (below 2.7 J), the average effect of arcing is 25%, whereas at higher discharge energy, it is negligible. The effect of arcing results in energy drop with the increase in surface roughness. This increased arcing (25%) at lower discharge energy will result in a more rough surface. Therefore, the factor “α” is taken as 6.25, and the roughness at lower discharge energy is calculated using equation (28) and is shown in Figure 10. From Figure 10, it is observed that at lower discharge energy (below 2.7 J) and higher discharge energy (above 2.7 J), the predicted surface roughness is having a similar trend with the measured values. At lower discharge energy (above 2.7 J), the energy is effectively utilized in removing the material from the surface, whereas at higher discharge energy, most of the material is melted and gets resolidified back onto the surface which resulted in a smooth surface.
Effect of discharge energy on recast layer thickness
During discharge, as the discharge begins, high temperature is developed which results in the formation of molten pool at the vicinity of spark. As the discharge ceases, these molten materials are expelled violently and resolidifies onto the adjacent region of the machined surface due to rapid cooling. This resolidified material so-called white layer is neither ejected nor removed by the flushing action of the dielectric.53–55 The thickness of white layer is dependent on the discharge energy in gap. The white layer for different discharge energies is analyzed through SEM micrograph (Figure 13). It is observed that as the discharge energy increases, the thickness of the white layer increases.5,6,50 From Figure 12, it is seen that the white layer appears to be uniform and totally distinguishable from the parent material. At lower discharge energy, the energy is effectively utilized in removing the material 44 that resulted in reduced thickness of the white layer. At higher discharge energy, as the discharge is established, large amount of heat penetrates into the interior of material with temperature of the surface at spark locality reaching its melting point that generates more molten material. At the end of discharge, this molten material resolidifies back onto the surface and ultimately results in the formation of thicker white layer.6,11,56 It is observed that the white layer appears to be more porous at higher discharge energy (3.857 J) compared to that at lower discharge energy (2.080 J).
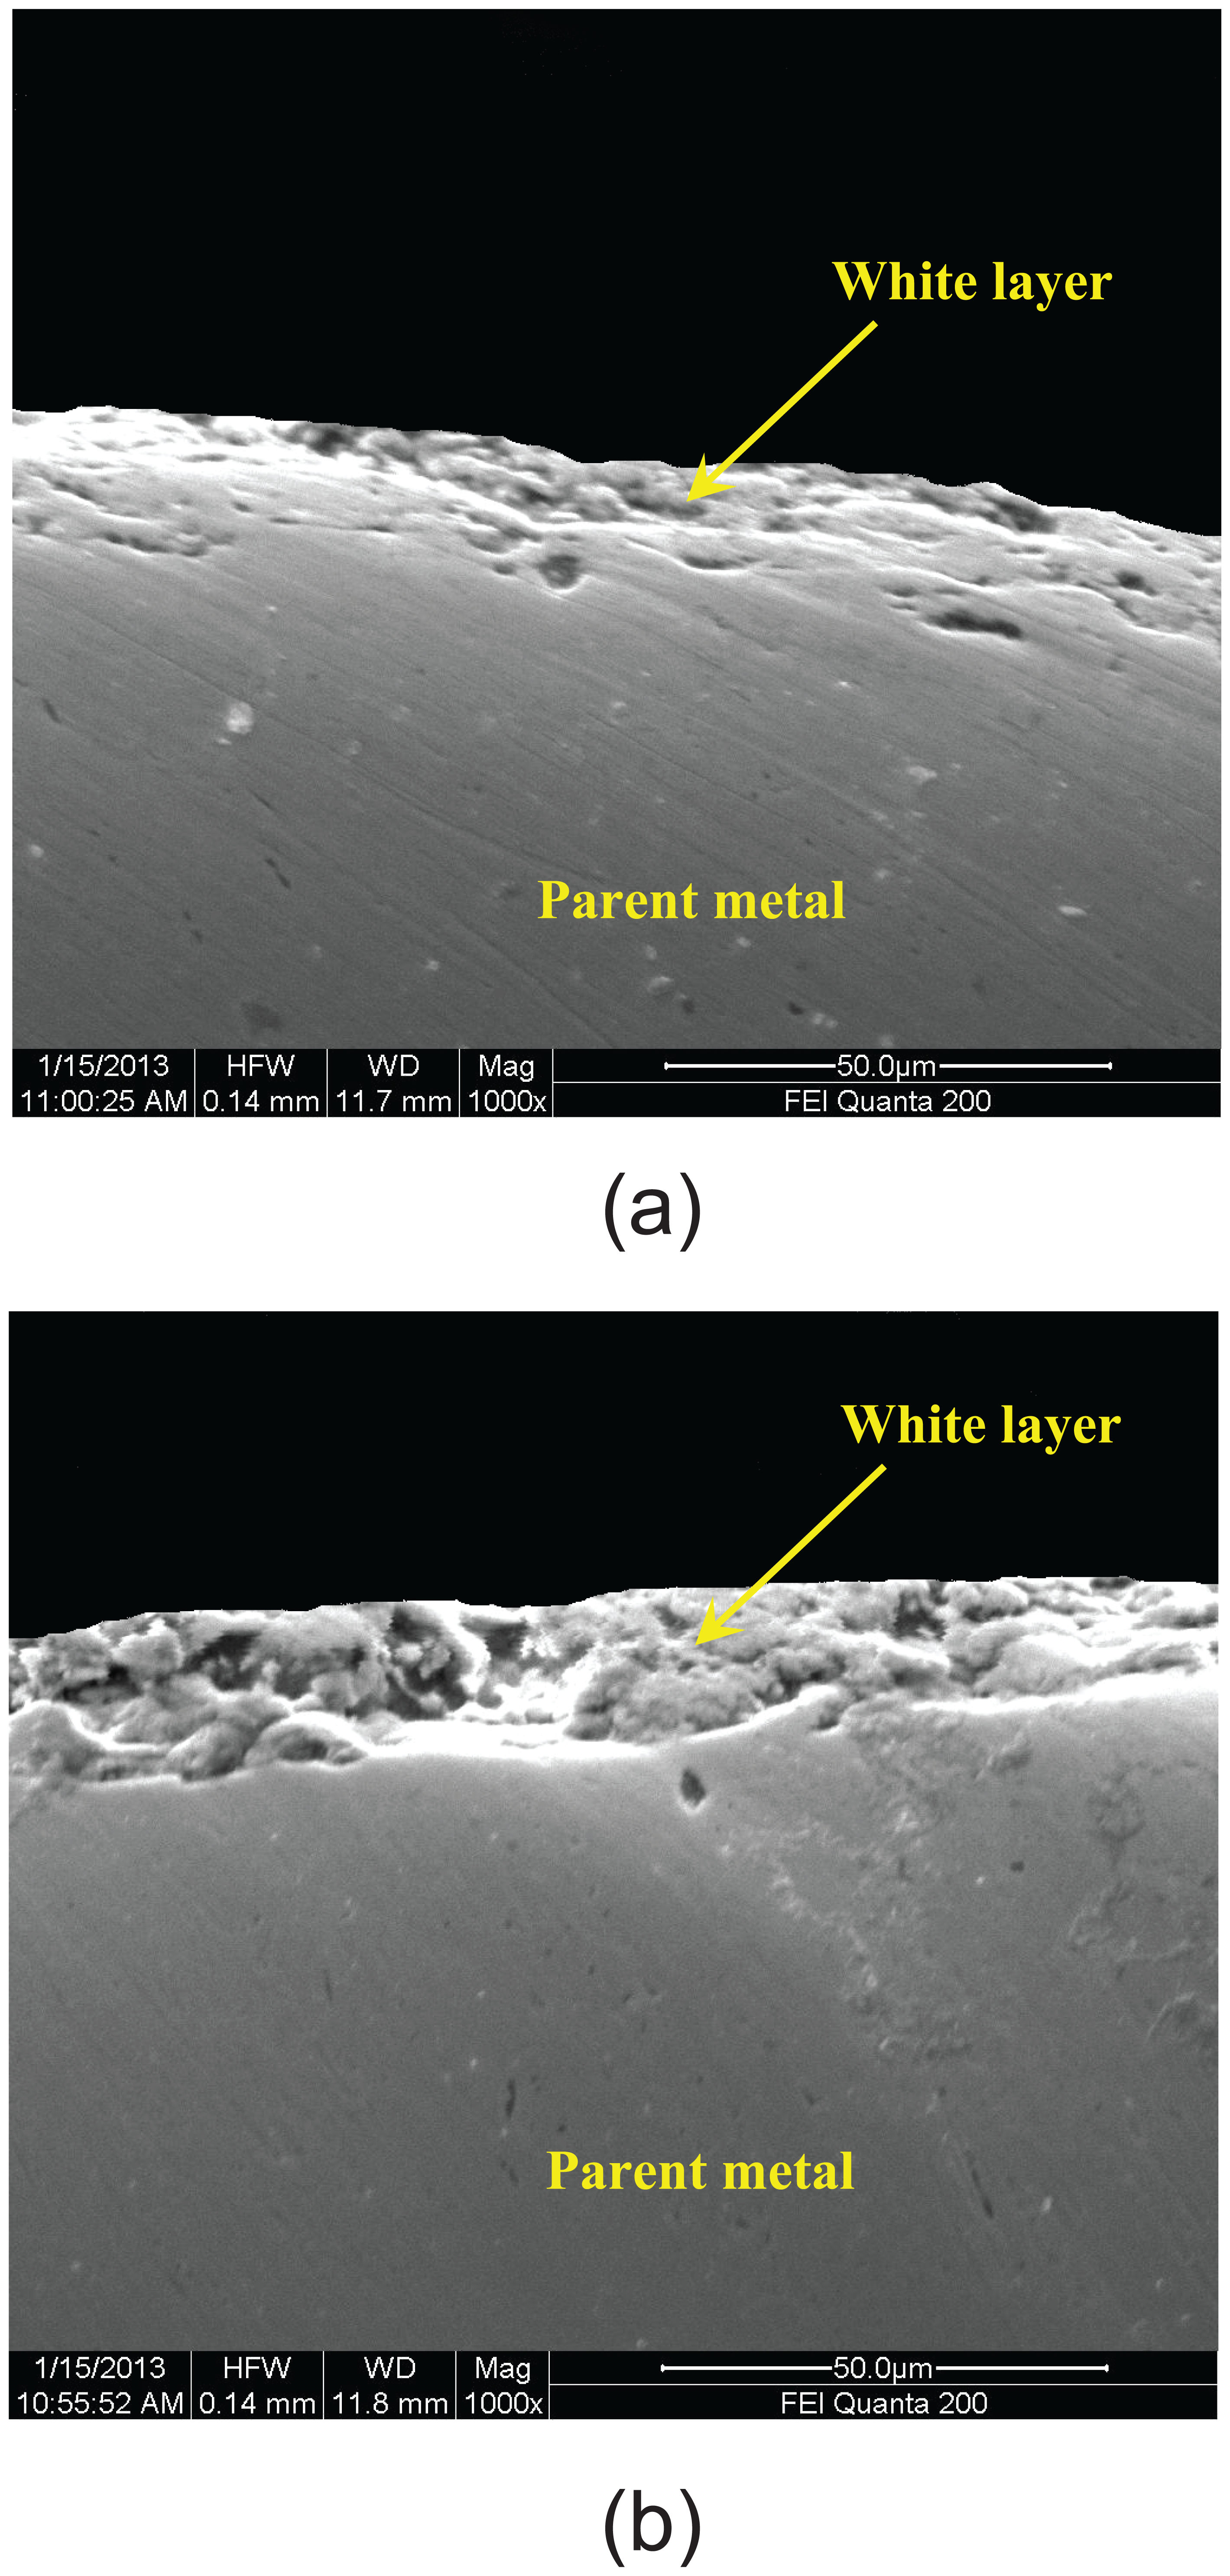
SEM micrograph of recast layer thickness at different discharge energies: (a) at lower discharge energy (2.080 J) and (b) at higher discharge energy (3.857 J).
Effect of discharge energy on surface crack
In general, EDM surfaces are very complex in nature. The distinctive morphology of a surface which undergoes EDM machining is due to the enormous amount of heat generated by the discharge, which causes melting and vaporization of the material, followed by rapid cooling. In this work, surface texture produced by WEDT is analyzed for micro-cracks and pockmarks formed by entrapped gases escaping from the resolidified material. Figure 14 shows the SEM micrograph of surfaces machined at different energies showing micro-cracks (C) and pockmarks (H). Micro-crack (C) is seen on the surface machined at higher discharge energy and is not observed on the components machined at discharge energy below 2.5 J. The cracks are often found in and around the crater of the machined surface (Figure 14(a) and (b)). Pockmarks (H) are the regions of gases expelled at the end of the discharge. Also, these regions around the crater are subjected to severe residual stresses and hence are more prone to cracking. 57 The crack formation is also associated with sudden cooling of the molten material. During discharge, a molten pool is formed at the surface of the workpiece, and pyrolysis of the dielectric takes place resulting in diffusion of carbon in the material. This carbon gets dissolved into the molten material which resolidifies on rapid cooling by dielectric. 54 During resolidification, the carbon-contained molten material contracts more than the unaffected parent material, and when the stress in the surface exceeds the ultimate tensile strength, cracks are formed11,50,57
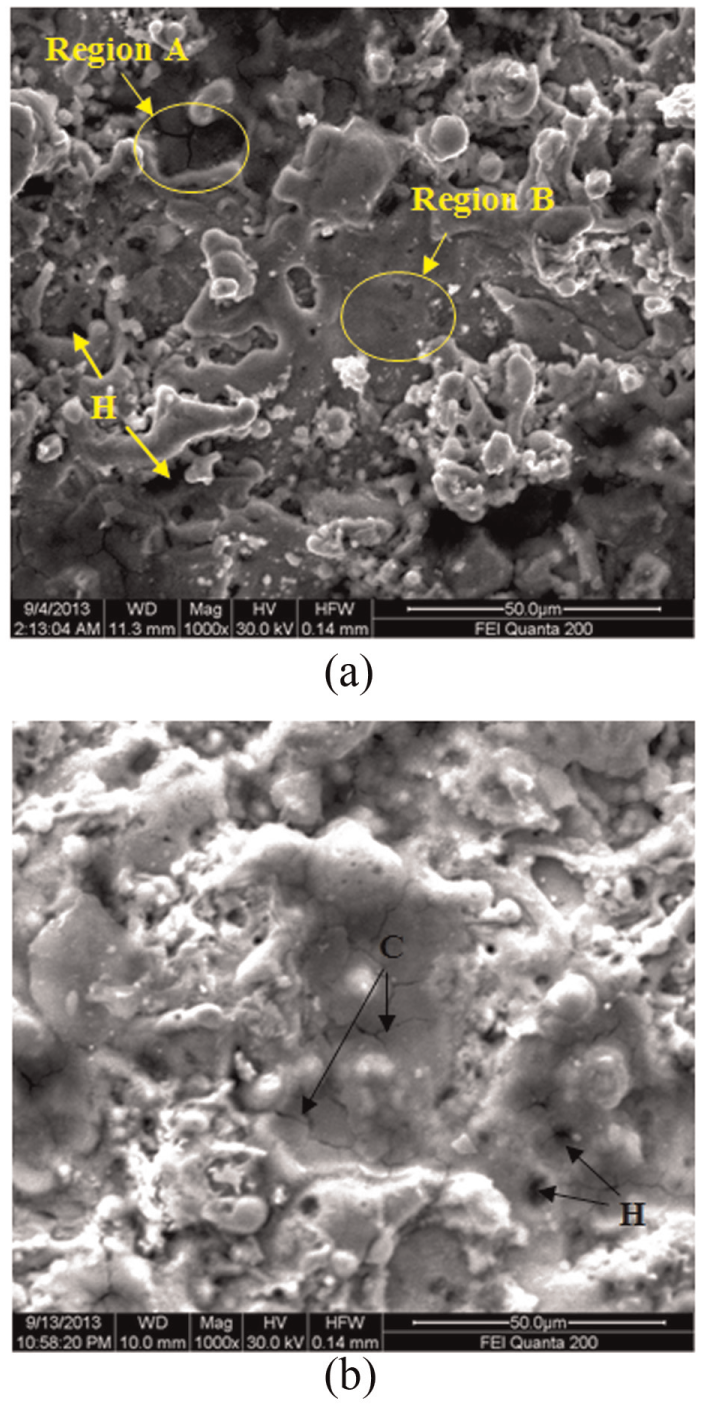
SEM micrograph showing micro-cracks (C) and pockmarks (H) for different discharge energies: (a) at discharge energy of 2.563 J and (b) at discharge energy of 3.567 J.
The increased carbon content in the molten material makes it more brittle and leads to crack formation while resolidifying. To verify the increase in carbon content on the resolidified material, area EDA is taken at region A (cracked region) and region B (noncracked region) on the same surface as shown in Figure 14(a). The EDA profile and the corresponding elemental composition are shown in Figure 15. Three measurements were taken at both regions (regions A and B), and their average values are shown in Figure 15. It is observed from the table that the carbon (C) and oxygen (O) content are higher whereas reduction in iron (Fe) content at region A (cracked region) compared to that of region B (noncracked region). This may be due to the formation of iron carbide (FeC), which is more brittle and is prone to cracking of the surface.1,10,50
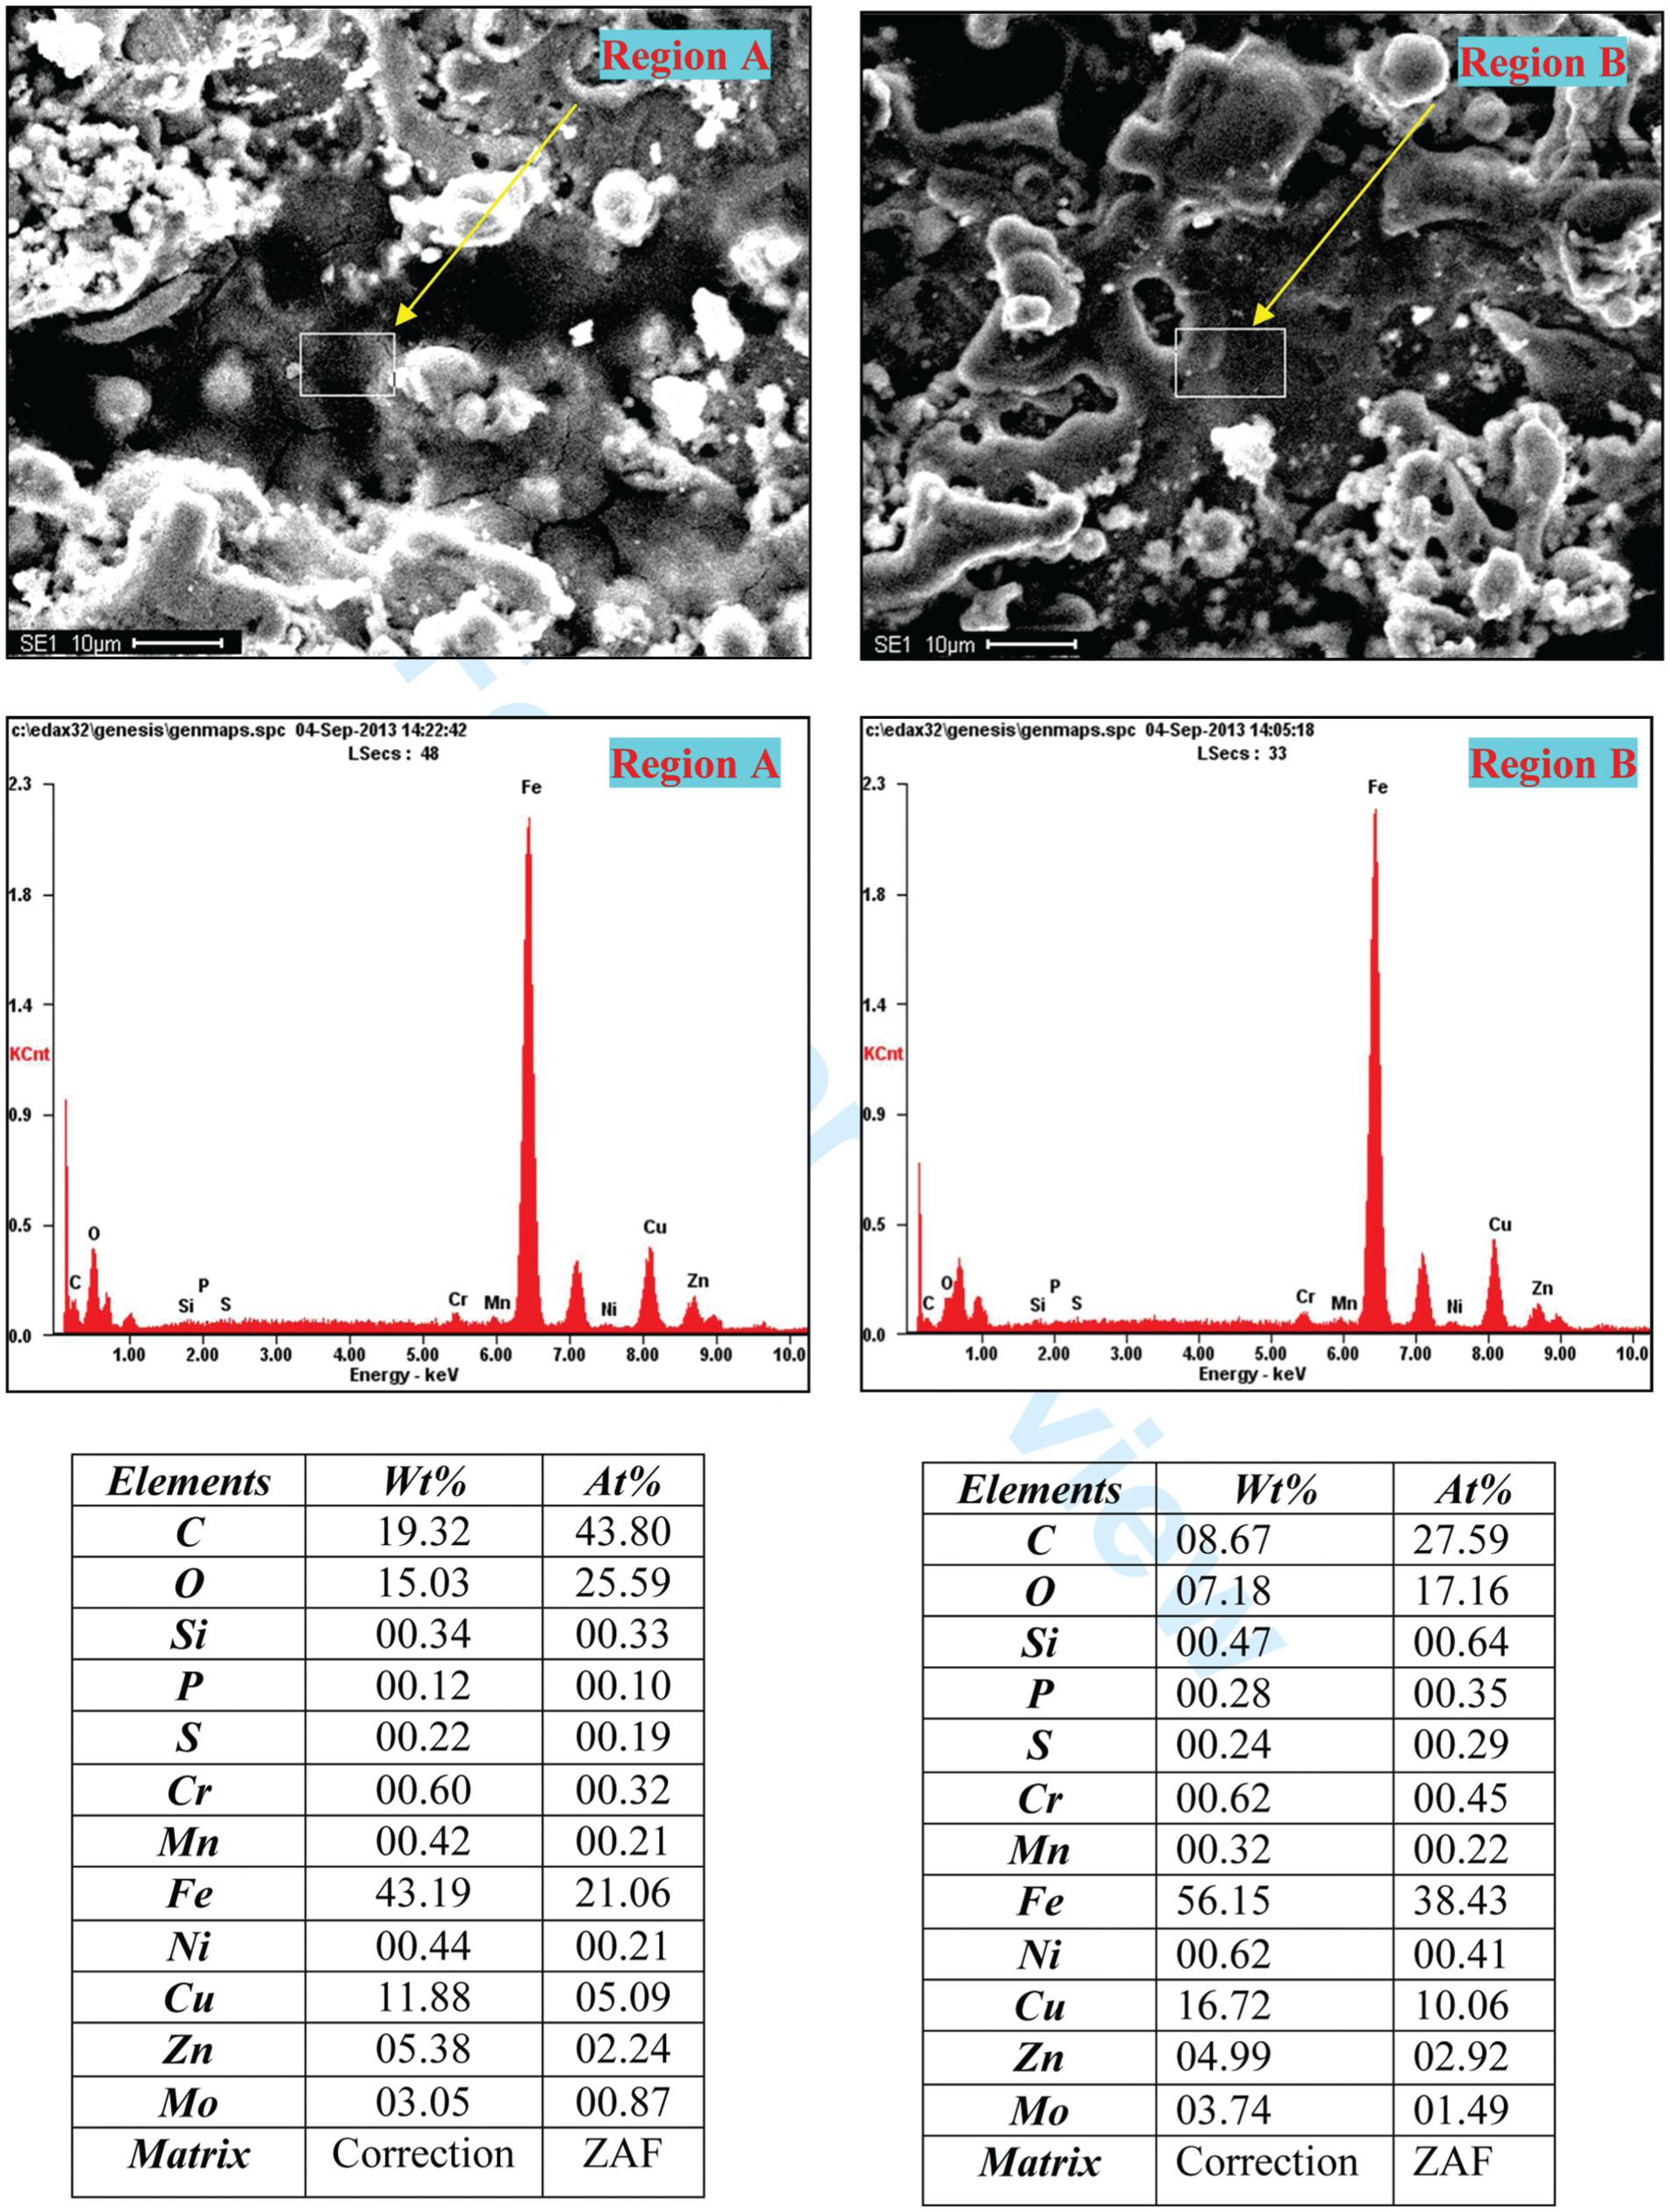
EDA profiles of components machined at discharge energy of 2.563 J.
Conclusion
A model to predict MRR and surface finish using average physio-thermal properties of work material is proposed. The influence of discharge energy on MRR, surface roughness, recast layer thickness and surface crack is also analyzed. The following are the important conclusions arrived from this work:
A new model is proposed to predict MRR using discharge energy. It is found that the predicted MRR values are closer to the experimental results at lower discharge energy (below 2.7 J). At higher discharge energy (above 2.7 J), the values are marginally higher. This is due to the significant effect of arcing at lower discharge energy and the dominant effect of sparking at higher discharge energies.
A model to predict the surface finish using discharge energy is developed in this work. It is observed that the surface finish model provides good estimate of surface roughness value.
In this work, the influence of discharge energy on MRR is also analyzed. It is observed that MRR increases with the increase in discharge energy of up to 2.7 J due to arcing that leads to wire vibration. Increased wire vibration removes the material from the workpiece surface at random locations that results in increased MRR. At discharge energy of above 2.7 J, MRR decreases due to reduced magnitude of discharge current.
A detailed analysis on the influence of discharge energy on surface finish is also analyzed. It is observed that at lower discharge energy, roughness increases with the increase in discharge energy due to the formation of discrete crater that resulted in a rough surface. At higher discharge energy, the current magnitude is low, and the heat generated is utilized to melt large amount of material. The molten material gets resolidified back onto the surface resulting in a smooth surface.
The thickness of the recast layer increases with the increase in discharge energy, and micro-cracks are observed on the surfaces generated at higher discharge energy. Crack formation is associated with the formation of iron carbide, which is more brittle and is prone to cracking.
Using the proposed models, it is possible to predict MRR and surface finish prior to conduct of actual experiments. By knowing the effect of arcing, closer prediction of MRR with experimental values can be achieved. Also, for a given energy, it is possible to predict the quality of surface to be generated prior to conduct of experiments. The proposed models can be used for machining any difficult to machine material to achieve higher MRR with better surface finish at the expense of minimum discharge energy that leads to energy conservation in WEDT process.
Footnotes
Appendix 1
Declaration of conflicting interests
The author(s) declared no potential conflicts of interest with respect to the research, authorship, and/or publication of this article.
Funding
The author(s) received no financial support for the research, authorship, and/or publication of this article.