
Abstract
Bonnet polishing has been successfully used for ultra-precision machining of the large-aperture aspheric optics. To accomplish online monitoring of executive condition of the removing function and state of the polishing machine, key technological parameters and processing condition factors need to be acquired in real time and coupled back. A novel data fusion method which combines hardware synchronous signal and correcting algorithm based on the principle of linear extrapolation is proposed in allusion to data acquisition distortion caused by asynchronous sampling frequency and communication delay between different systems. The estimate values are obtained by dynamically correcting original acquired data, and the upper bound of the error is deduced with the speed and the acceleration of the signal. The simulation results showed that the data fusion method can significantly reduce the error of data acquisition. The experimental results confirmed that the data fusion method can be effectively applied to monitor the optics bonnet polishing process online.
Introduction
With the wide application of large-aperture aspheric optics in many high-tech fields (e.g. aerospace, astronomy, and national defense), the requirement for ultra-precision machining and measurement of large-aperture aspheric optics has been increased.1,2 Thus, in order to achieve the required accuracy, the manufacturing process for optics is commonly composed of two stages which are grinding and polishing. Bonnet polishing is a new polishing technology which has been increasingly applied in ultra-precision machining of large-aperture aspheric surface in recent years. 3 Now, the researches on bonnet polishing are mainly concentrated in effect factors of the removing function, tool path planning, precession control, and so on.4–7 The removing function is one of the most important factors which is calculated according to the machining results of the grinding process that is the last process before polishing. The executive condition of the removing function decides the machining results of the polishing process. And two kinds of factors have significant influence on removing function: one is key technological parameters; the other is processing condition factors. In these researches mentioned above, the values of key technological parameters such as inner air pressure of bonnet, rotation speed of the bonnet, and the concentration of polishing solution are supposed to be unchanged in the polishing process. However, it is easy to know that, as to the dynamic error of machine tool, the values of aforementioned technological parameters may fluctuate in a certain range. And it will possibly affect the polishing quality. On the other hand, it is well known that processing condition factors generated in the machining process can be used to represent the state of the machine and the process.8,9 For the above reasons, in order to improve the polishing quality, evaluate the depletion of the equipment, and realize process control, a system for online monitoring the variation in key technological parameters and processing condition factors is necessary. The precondition and the basic demand of the monitoring system are that data acquisition distortion must not be allowed to happen. Data fusion is the main method to meet the precondition and the demand.
The online monitoring system is used to acquire both static and dynamic signals in the polishing process; therefore, errors of data acquisition would come out mainly because of two reasons: one is asynchronous sampling frequency which is mainly because of the different clock sources; the other is communication delay which is mainly because of the priorities of different systems. The data fusion method is used to solve the problems at present. 10 As shown in related reports, the existing researches are mainly focused on synchronous data fusion, of which the premise is that the sampling frequencies of all sensors are the same or integral multiple. 11 But it cannot meet the requirements of data acquisition for monitoring bonnet polishing process online. Besides, there are also studies which pay attention to asynchronous multi-sensors data fusion. Some algorithms are proposed, such as optimal asynchronous data fusion, asynchronous data fusion based on sampling of rational number times, and data fusion based on synchronous hoisting.12–14 However, these algorithms can hardly be applied to engineering because of the large amount of calculation.
In this study, an online monitoring system is first built to acquire and couple back key technological parameters and processing condition factors in bonnet polishing process. Then, in allusion to data acquisition distortion caused by asynchronous sampling frequency and communication delay, a novel data fusion method based on the principle of linear extrapolation is proposed, which combines hardware synchronization signal and correcting algorithm. Moreover, upper bound of the error is deduced. The correctness of the data fusion method was proved by simulations. Finally, experiments were performed to confirm the effectiveness and feasibility of the data fusion method for online monitoring of actual bonnet polishing.
The online monitoring system
Figure 1 shows the structure of the online monitoring system which is composed of sensors, a signal acquisition and data fusion system (SADF), and a personal computer (PC). Data transmission between SADF and PC is realized by Wi-Fi because the door of the bonnet polishing machining tool must be closed in a process.
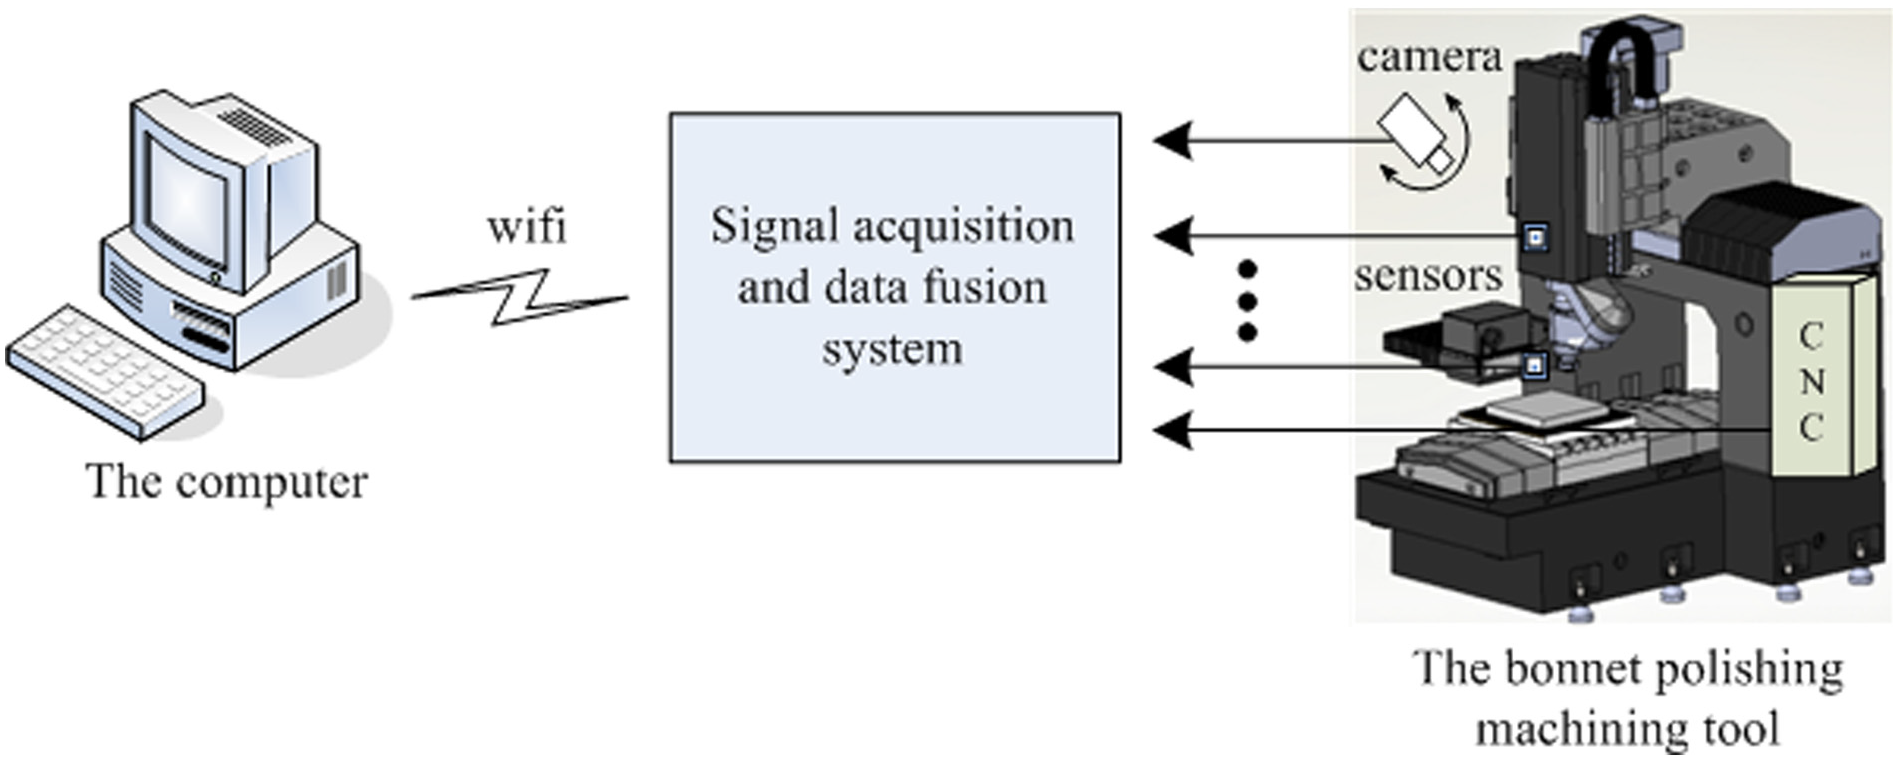
Structure of the monitoring system.
SADF acquires data by two ways which are sensors and the computerized numerical control system (CNC) of bonnet polishing machining tool. The data processed by the data fusion method will then be transferred to PC and displayed on the screen.
Selection of key technological parameters and processing condition factors
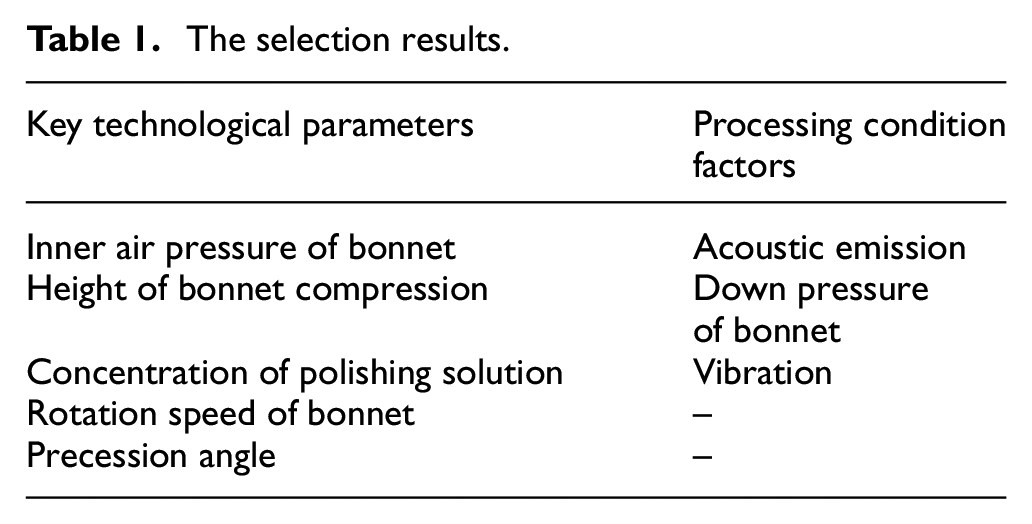
The objects of the online monitoring system are key technological parameters and processing condition factors. In respect to the former, a lot of previous studies have shown that inner air pressure of bonnet, height of bonnet compression, rotation speed of bonnet, and precession angle are the key parameters which have significant effect on polishing quality.4,5,15–17 In addition, considering the wear of the grains in polishing solution, the concentration is also regarded as a key parameter. Concerning the effects of processing condition factors, although there are rarely researches in allusion to bonnet polishing, acoustic emission, down pressure of bonnet, and vibration are supposed to be the most important factors based on the common points of the mold bonnet polishing, optics grinding, and processing technology of optics bonnet polishing.18–22 In conclusion, the key technological parameters and processing condition factors which are selected for the online monitoring system are shown in Table 1. Values of rotation speed of bonnet, height of bonnet compression, and precession angle are obtained from CNC, and the left parameters are obtained by the measurement of sensors.
The selection results.
Design of SADF
As the kernel of the online monitoring system, SADF is used to acquire data from sensors and CNC. Besides, SADF is used to fuse the data and transfer the results to PC. Figure 2 illustrates the frame of SADF, which is composed of power supply module, control module, wireless communication module, multi-sensor signal acquisition module, and CNC system communication module according to the functional characteristics.
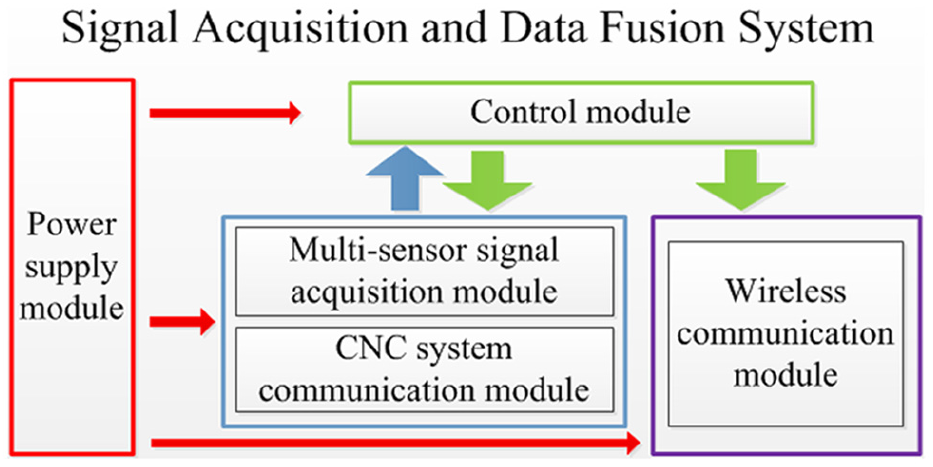
Frame of SADF.
The power supply module is used to supply power to other modules. Control module is used to set up parameters of the multi-sensor signal acquisition module and the CNC system communication module, fuse the data, and control the wireless communication module to transfer the results to PC. Multi-sensor signal acquisition module is used to acquire some of the key technological parameters, that is, inner air pressure of bonnet and concentration of polishing solution, and all of the processing condition factors. The function of CNC system communication module is acquiring the left key technological parameters, that is, rotation speed of bonnet, height of bonnet compression, and precession angle, from CNC.
Data fusion method
In signal acquisition process, it can cause data distortion by two reasons as follows: (1) although the design value of the sampling frequency for each module is same, there are small differences among different modules because every module has its own clock source and (2) the priority of external communication of CNC is lower because of the closed-loop control. Thus, the communication time between the CNC system communication module and CNC may be asynchronous, that is to say, the interval of the sampling time is random.
A data fusion method which combines hardware synchronous signal and correcting algorithm based on the principle of linear extrapolation is proposed to solve the problem. This method avoids large amount of calculation caused by improving algorithm alone and complex circuit design caused by improving hardware alone.
Hardware synchronous signal
A hardware timer is added for the online monitoring system as the hardware synchronous signal. The differences between the sampling time of each test signal and the synchronous signal are then measured respectively by the timer, as shown in Figure 3. T is the sampling period of the control module. tk is the value of the kth sampling time of the control module. Δtk is the difference value between tk and the sampling time of the multi-sensor signal acquisition module or the CNC system communication module which borders on and is in front of tk.
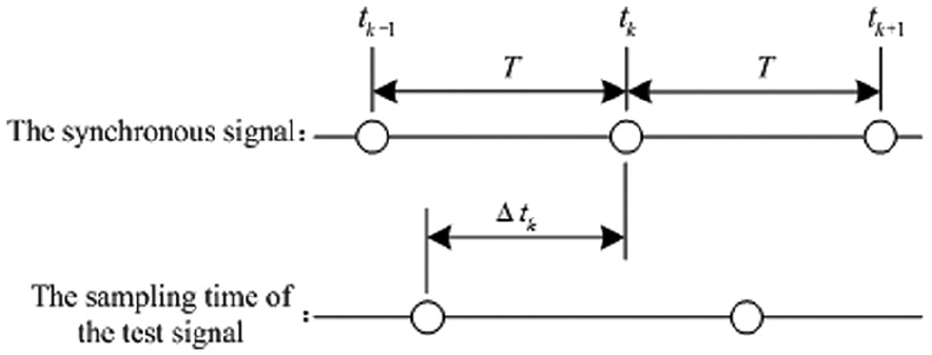
Schematic diagram for sampling time of the monitoring system.
The correcting algorithm
In this study, the correcting algorithm aims at calculating the value, which is named the estimate value, to be used for online monitoring of the process of bonnet polishing with the data acquired by SADF. For explaining the correcting algorithm clearly, make definitions as follows: y(t) is the test signal and y(tk) is the real value of the test signal at tk.
The correcting algorithm for y(t) is described using equation (1)

where
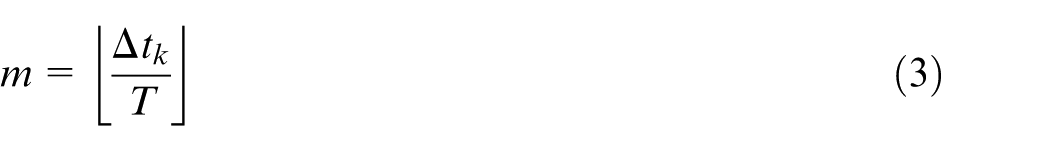
where m is the integer part of Δtk/T and is calculated using equation (3)
Analysis of the error caused by the correcting algorithm
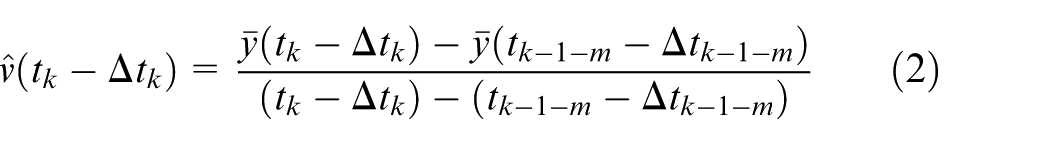
The following equations can be got according to the relationship between the sampling frequency of the test signal and the synchronous signal


where v is the variation speed of the test signal,
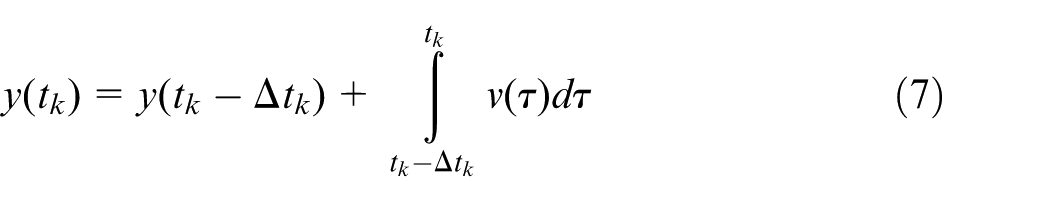
y(t) can be calculated using equation (7)
So the error caused by the correcting algorithm is obtained by equation (8)

where
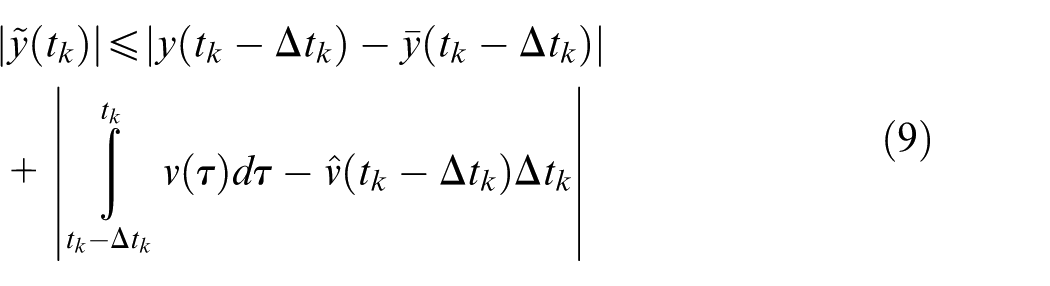
The error caused by measurement uncertainty is presented by δ0. Thus, equation (10) can be got according to equations (4)–(9)
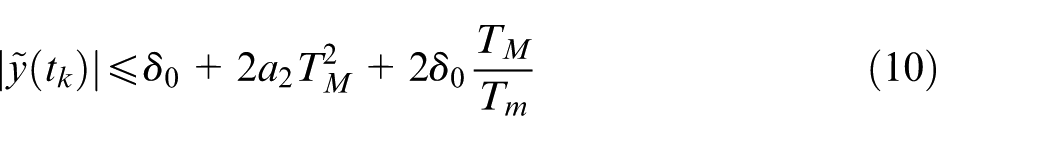
The upper bound of the error is given by equation (10). And there are specific physical significances as follows: (1) the first item of the expression is δ0 caused by measurement uncertainty which includes many factors, such as the measured error of sensors and the instability of the wireless transmission network, and it should be reduced as little as possible, but it cannot be avoided completely; (2) the second item presents the relationship between the error and the variation trend of the signal, and it will be zero in condition of the static or uniform variation signal; and (3) the minimal error can be got in condition of equal interval sampling.
Simulation of the data fusion method
The simulation of the data fusion method was performed using MATLAB in allusion to the two cases which caused data distortion, and the configuration of the computer during the simulation in MATLAB environment was 64 bits. The clock frequency was set as 1 kHz.
The condition of differences existing in different clocks
In simulation process, T was set as 1 ms and was considered to be invariant. There were small differences between T and the sampling period of the other modules which was presented by T1. In this study, two cases had been considered: one was that T1 equal to 1.001 ms, and the other was that T1 equal to 0.999 ms. δ0 was set as 0.001, and the test signal was set as sinusoidal signal with the frequency of 50 Hz, that is to say, y(t) = sin(100πt). Figure 4 shows the variation curve of the differences between T and T1 for the two cases. Figures 5 and 6 show the error caused by the data which had been fused by the method and the error caused by the data which had not been fused for two cases of T1, respectively.
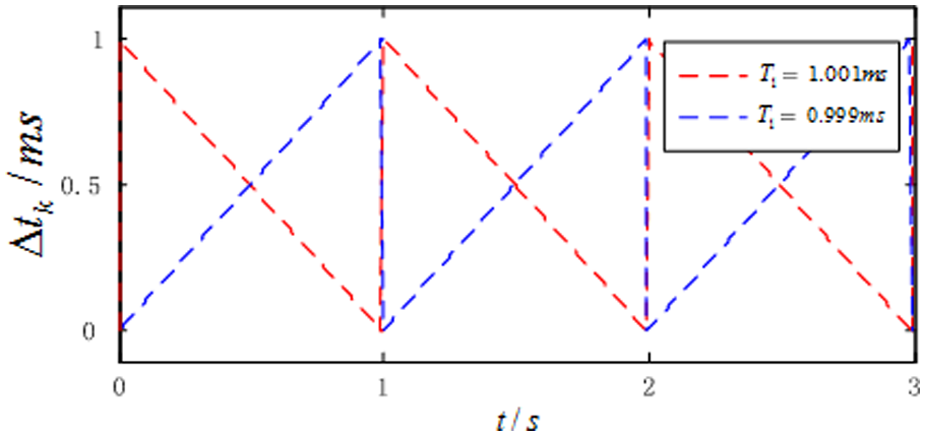
The variation curve of the differences between T and T1.
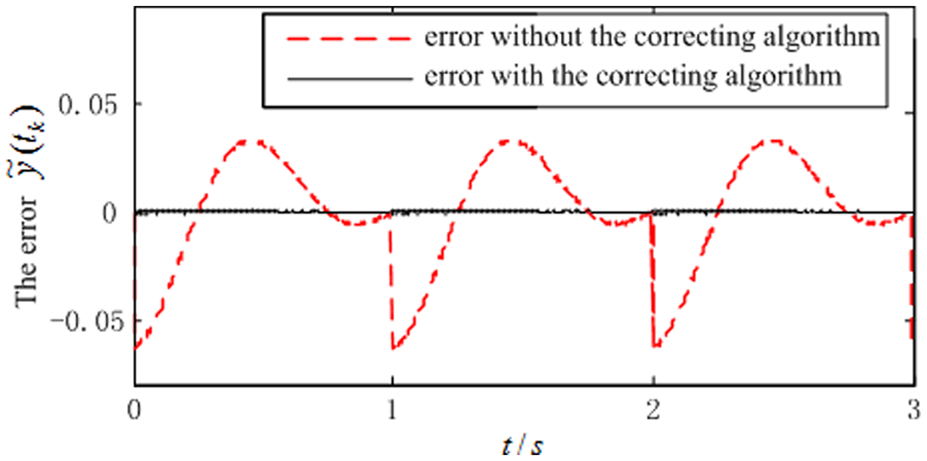
The error curve of the case that T1 equal to 1.001 ms.
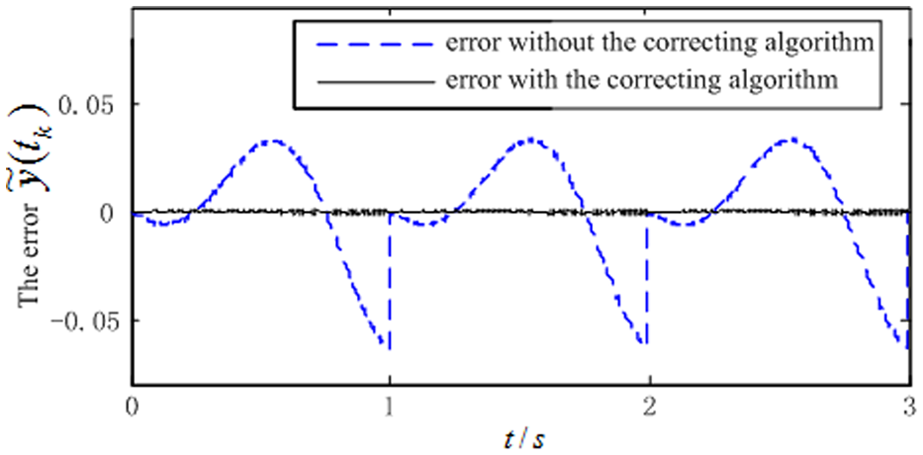
The error curve of the case that T1 equal to 0.999 ms.
Losing data or data coverage was brought out because of the differences, though the differences were small. The mutation of the time differences appeared every 1000 periods, and the maximum error of the output of the online monitoring system appeared too. It can be concluded that the error was significantly reduced after fused by the data fusion method.
The condition of random interval of the measured time
For the simulation of this case, the interval of the measured time was set from 0.8 to 1.2 ms, of which the variation was random. The test signal was set as sinusoidal signal with the frequency of 10 Hz, that is to say, y(t) = sin(20πt). The differences between T and the period of the measured time were random because of the random interval, as shown in Figure 7. Figure 8 shows the error caused by the data which had been fused by the method and the error caused by the data which had not been fused, respectively. It can be concluded that the error was significantly reduced after fused by the data fusion method.
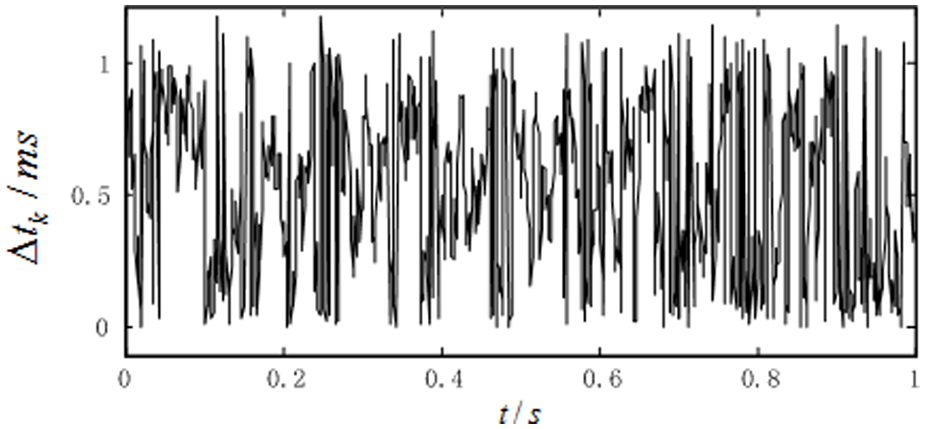
The variation curve of the differences between T and the period of the measured time.
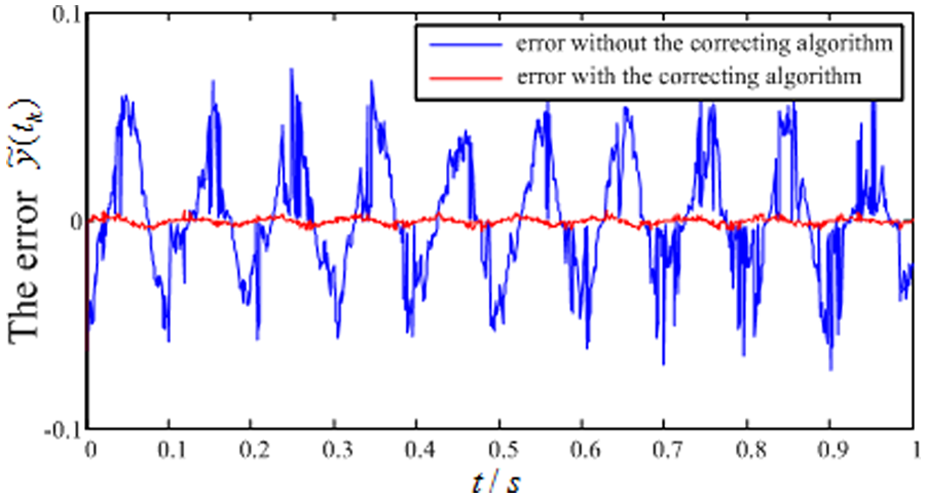
The error curve caused by the random interval.
Experiments
Experiments were performed to verify whether the data fusion method can be used for online monitoring of actual optics bonnet polishing. SADF was developed, of which the control module adopted MicroZed development board whose main control chip was field-programmable gate array (FPGA) made by AVNET company and the other modules were self developed. Wireless transmitting equipment adopted router of which the model was WS326 made by Huawei company. In order to be used easily, all the boards mentioned above, transformer, fan, and power supply interface were assembled in a 25 cm × 21 cm × 12 cm box. Netting twine was through the back of the box and connected with the router. Figure 9 shows the physical map of SADF. Experiments were performed on 2MK460 bonnet polishing machine tool, as shown in Figure 10.
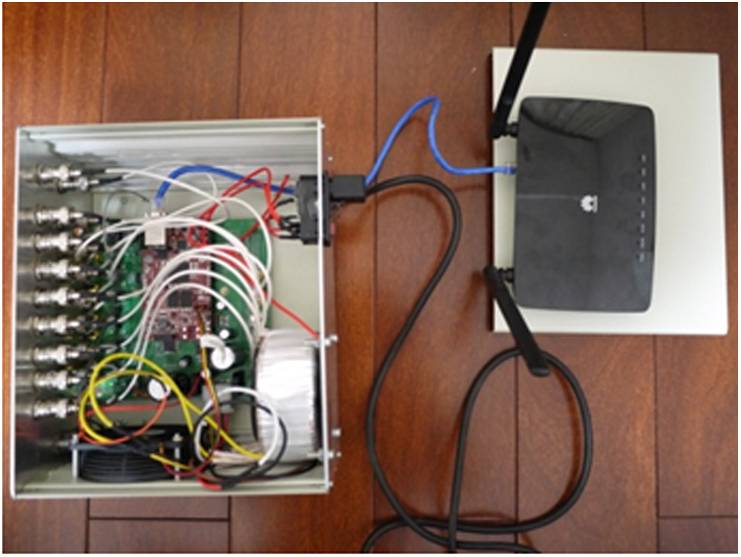
Physical map of SADF.
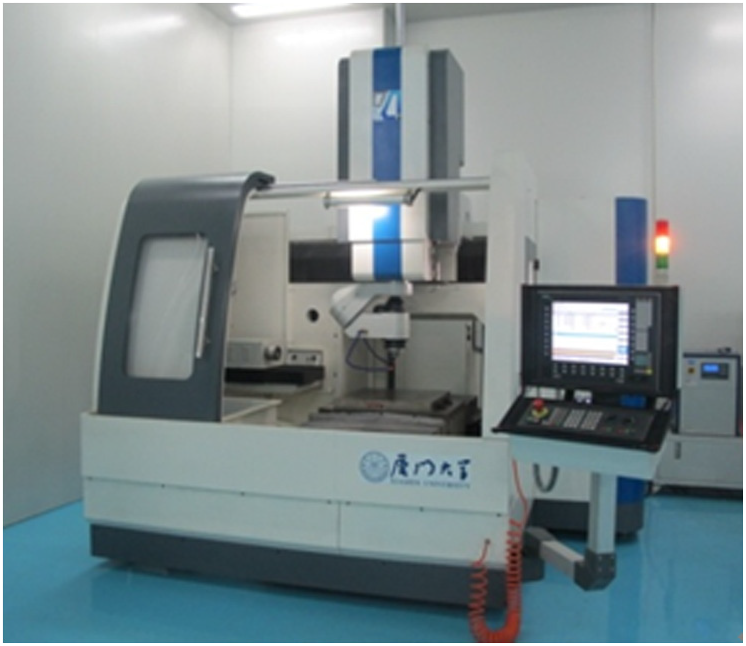
2MK460 bonnet polishing machine tool.
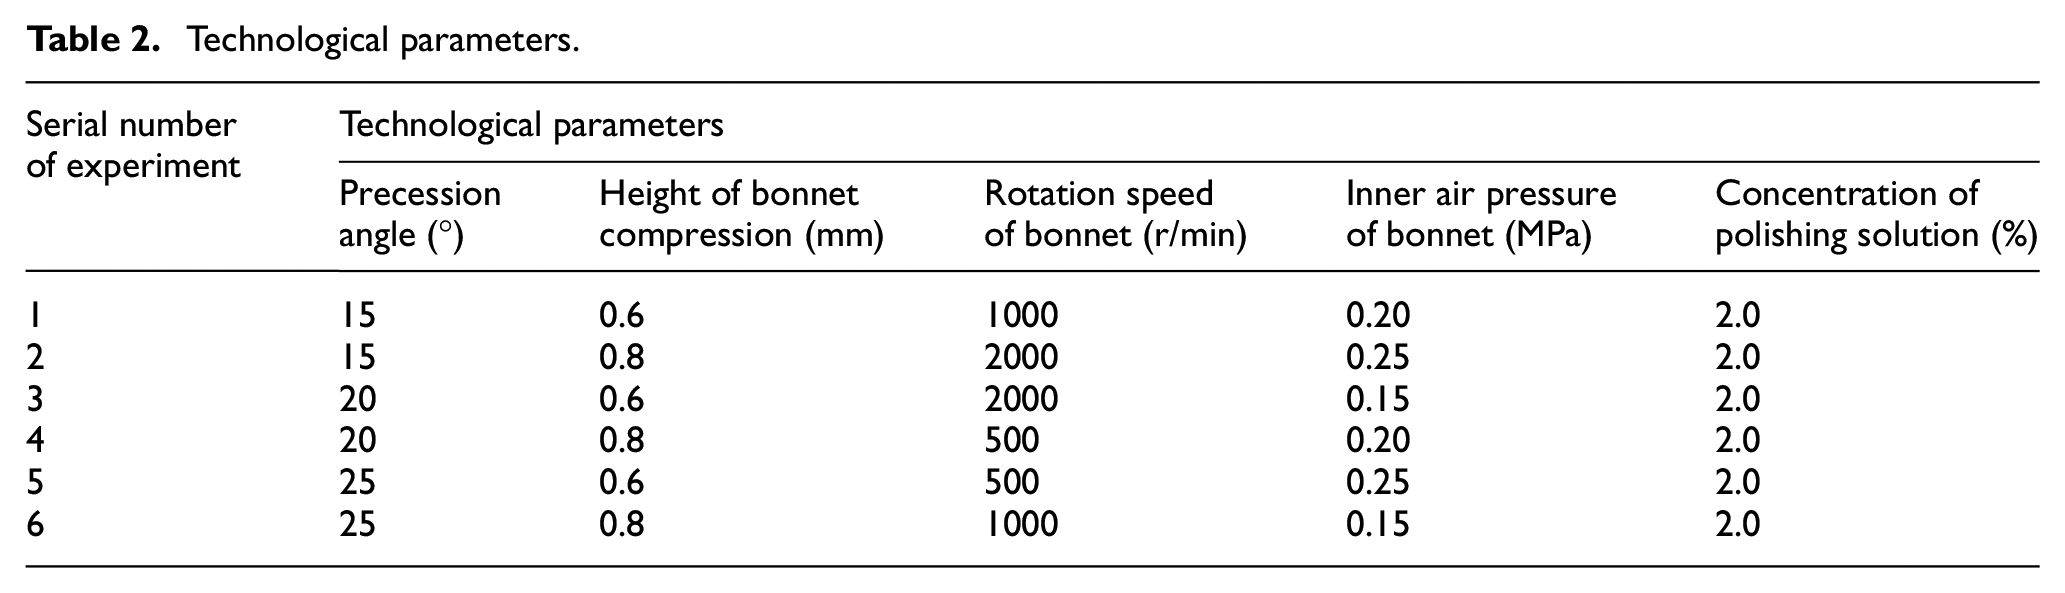
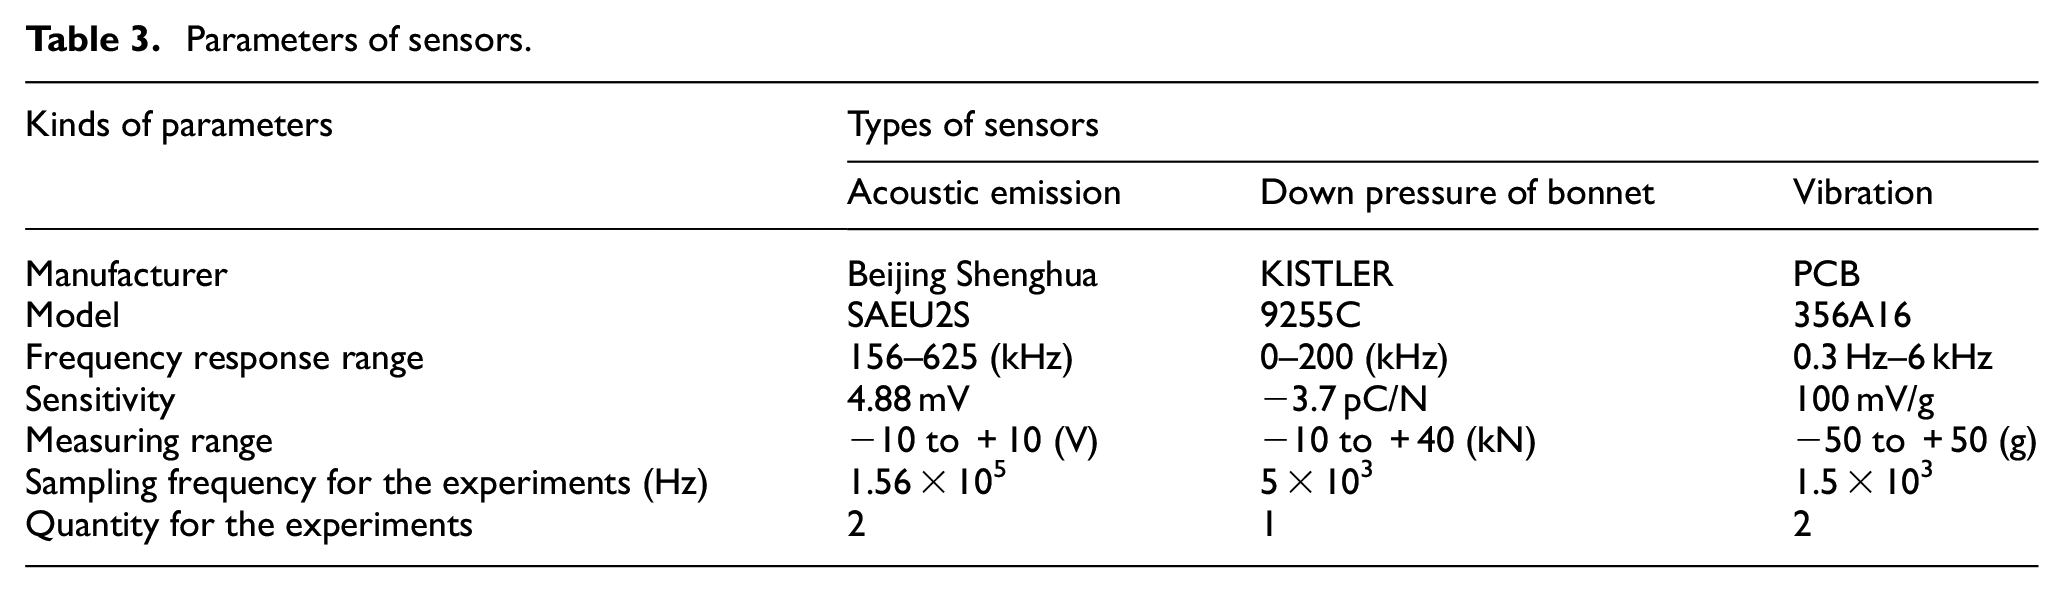
The scheme of the experiments was designed as follows: optics were polished in six groups of different technological parameters as shown in Table 2. In polishing process, the key technological parameters and processing condition factors were acquired in real time. The reference parameters of sensors and the parameters set for the experiments are shown in Table 3. Using the data acquired above, the key characteristic parameters, that is, the maximum removing depth and the size, of the removing function were predicted based on the online monitoring algorithm. This algorithm was built based on high-order polynomial fitting method, of which the input vectors were key technological parameters and processing condition factors, and the output vectors were the key characteristic parameters of the removing function. It is applied to monitor and couple back the executive condition of the removing function in a bonnet polishing process in real time. 23 The results obtained by comparing the predicted values with the measured values were used to evaluate the effectiveness and feasibility of the data fusion method for online monitoring of bonnet polishing. Figure 11 shows the installation methods for all sensors used in the experiments and the panorama.
Technological parameters.
Parameters of sensors.
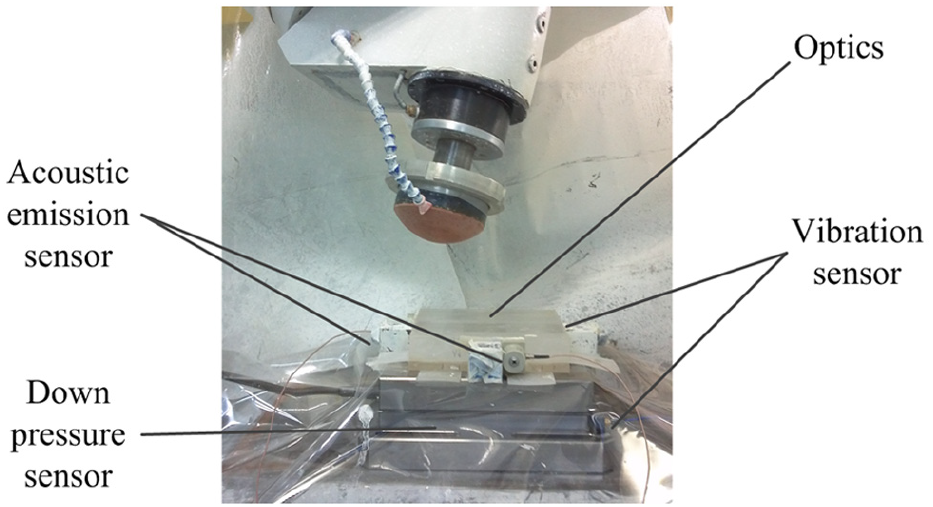
Installation methods of all sensors and experimental panorama.
The maximum removing depth and the size of the removing function were predicted with the online monitoring algorithm and were then compared with the measured values. The compared results are shown in Figure 12, of which (a) represents the maximum removing depth and (b) represents the size.
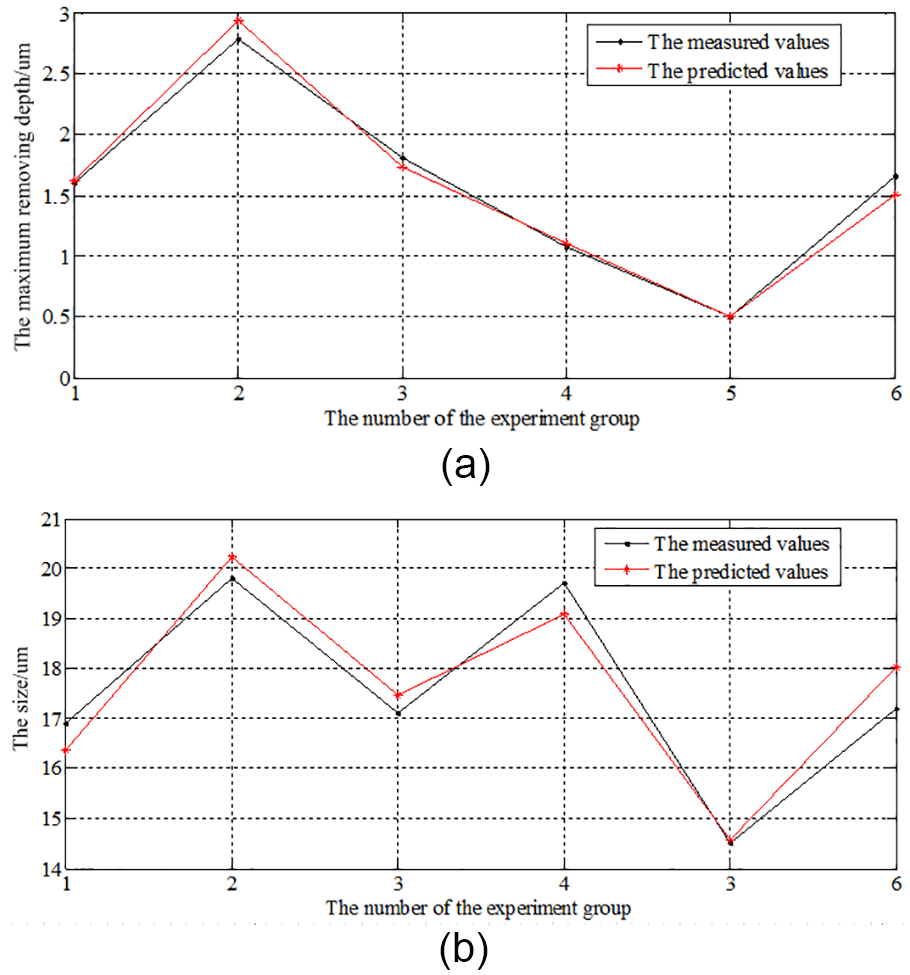
The compared results between the predicted and the measured values: (a) the predicted and the measured values of the maximum removing deep and (b) the predicted and the measured values of the size.
As can be observed from Figure 12, for the maximum removing depth, the maximum and minimum error of the predicted values were 0.1578 and −0.1496 µm respectively, and the average value of the absolute difference between the predicted values and the measured values was 0.0741 µm which was just 4.72% of the average value of the measured values; for the size, the maximum and minimum error of the predicted values were 0.8539 and −0.6102 µm, respectively, and the average value of the absolute difference between the predicted values and the measured values was 0.4727 µm which was just 2.70% of the average value of the measured values. The trend of the variation in the predicted values had high correlation with that of the measured values for both the maximum removing depth and the size. The above comparisons confirmed that the data fusion method can be effectively applied to online monitoring of optics bonnet polishing.
Discussion
The correcting algorithm of the data fusion method proposed in the study was simple; in other words, it was not the best choice from accuracy and intelligence opinion. However, the top-priority selection criteria of correcting algorithms in this study were real-time and engineering application. In these respects, this correcting algorithm was a good choice because it had small amount of calculation and could be easily realized for engineering. It needs much more work to develop a correcting algorithm which considers all the criteria besides these mentioned above.
On the other hand, reducing the measurement uncertainty was also important, although the error caused by measurement uncertainty could not be avoided completely. Several methods were adopted to improve the possibilities to reduce the measurement uncertainty in the study as follows: (1) good performance sensors had be chosen because sensors were the data sources and had significant influence on the accuracy, (2) the wireless transmission network used for the online monitoring system was established separately because the special network had better instability than that of the public network, and (3) many different kinds of rigorous tests in allusion to the software used for the online monitoring system had been performed, for example, known data were transmitted and stored by the software; after that, the results obtained by comparing the received data with the known data were used to evaluate the software. Besides these methods, there must be more and better methods that can reduce the measurement uncertainty, and they need more researches in the future work.
Conclusion
The online monitoring system was built to realize acquiring and coupling back key technological parameters and processing condition factors in real time according to the characteristics of the optics bonnet polishing process. A summary of the findings are given below:
A novel data fusion method which combined hardware synchronous signal and correcting algorithm based on the principle of linear extrapolation was proposed in allusion to data acquisition distortion. The simulation results showed that the error was significantly reduced by the method which had the small amount of calculation and was easily used for engineering.
The experiments for online monitoring of actual optics bonnet polishing were performed. The data were fused by the data fusion method. The fused results were used to predict the maximum removing depth and the size of the removing function with the online monitoring algorithm, and the average errors of the predicted values were just 4.72% and 2.70% of the measured values, respectively. This confirmed that the data fusion method can be effectively applied to online monitoring of optics bonnet polishing.
Footnotes
Declaration of conflicting interests
The author(s) declared no potential conflicts of interest with respect to the research, authorship, and/or publication of this article.
Funding
The author(s) disclosed receipt of the following financial support for the research, authorship, and/or publication of this article: This work was supported by the China Postdoctoral Science Foundation (No. 2016M591285 and 2015M570920) and Laboratory of precision manufacturing technology, CAEP (No. ZZ14006).