
Abstract
In this article, effect of cutting parameters, namely, cutting speed, feed rate and tool nose radius, on the tool life was examined experimentally. The experiments were performed on boring of AISI 316 steel with cemented carbide tool inserts. Design of experiments was prepared, and eight experiments were performed with two levels of the cutting parameters. The effects of cutting parameters were analyzed by evaluating the amplitude of workpiece vibration, surface roughness and volume of metal removed. The experimental data were taken for evaluation of tool life for a flank wear of 0.6 mm in all the eight trials. A laser Doppler vibrometer was used for online data acquisition of workpiece vibration, and a high-speed fast Fourier transform analyzer was used to process the acousto-optic emission signals for the workpiece vibration. Taguchi, analysis of variance and regression analysis methods were used to identify significant cutting parameters affecting the workpiece vibrations, surface roughness and volume of metal removed. All selected analysis methods used in this study predicted similar cutting parameter.
Keywords
Introduction
Stainless steels are widely used in commercial and industrial applications due to their excellent corrosive resistance. But it is difficult to machine them due to their hardening tendency in machining process. 1 Boring is defined as enlarging a hole size that has been already made by drilling or casting to the designed dimension. Therefore, control of dimensional tolerance and surface roughness is important. 2 The cutting parameters like feed rate, spindle speed, depth of cut, tool nose radius, nose angle and vibration data constitute input information for evaluation of tool life. 3 In metal cutting, vibration of tool and workpiece is the important limiting factors for metal removal rate and machining efficiency. In boring operations, the length of boring bar is kept long; therefore, it is subjected to vibrations and results in tool failure and poor surface finish and may also introduce chatter. 4 Length–diameter (L/D) ratio of boring bar is one of the important factors which causes tool vibration. Boring bars with a high L/D ratio tend to chatter. The vibrations also depend on boring bar fixation, machine tool condition and selection of cutting conditions. 5 Korkut and Kucuk 6 proved that the best L/D ratio was 3, which results in least vibration in boring process. Considering this, in this work, the L/D ratio was taken as 3 in order to minimize vibrations of tool and workpiece.
Tool failure can be identified by observing higher power consumption, poor surface finish, dimensional inaccuracy, appearance of a burnishing band on machined surface, tool vibrations, workpiece vibration and so on. Andren et al. 7 explained different deformation zones in the machining process such as primary, secondary and tertiary deformation zones. In the primary zone, the deformation results in considerable stress and strain rates. In the secondary and tertiary deformation zones, normal and shear traction loads are applied on the tool at workpiece–tool–chip interface due to friction and plastic deformation. The boring bar is the weakest link in the boring bar fixing or clamping system of the lathe turret. Due to the above loads applied on the tool, the boring bar will vibrate. The vibration of boring bar results in poor machining, surface finish and reduced tool life. Tamizharasan et al. 8 have used audible acoustic emission signal for online monitoring of tool wear. They recorded acoustic emission signals and corresponding flank wear for machining time of 300 s. Using design of experiments (DOEs) and simulated annealing algorithm for optimization of cutting parameters, they found correlation between acoustic signals and flank wear.
Vibration is defined as the repetitive motion of an object or objects relative to a stationary frame referred to as the equilibrium of the vibration. Inman 9 stated that vibrations exist everywhere and may have a great impact on the surrounding environment. One general phenomenon of vibration is the “self-oscillation” or resonance. A simplest vibrating system with a single-degree-of-freedom system is shown in Figure 1. Vibrations, which are present due to an impressed force on the system, are called as forced vibrations. Vibrations of air compressors, internal compression engines, machine tools and other machinery are examples for forced vibrations.
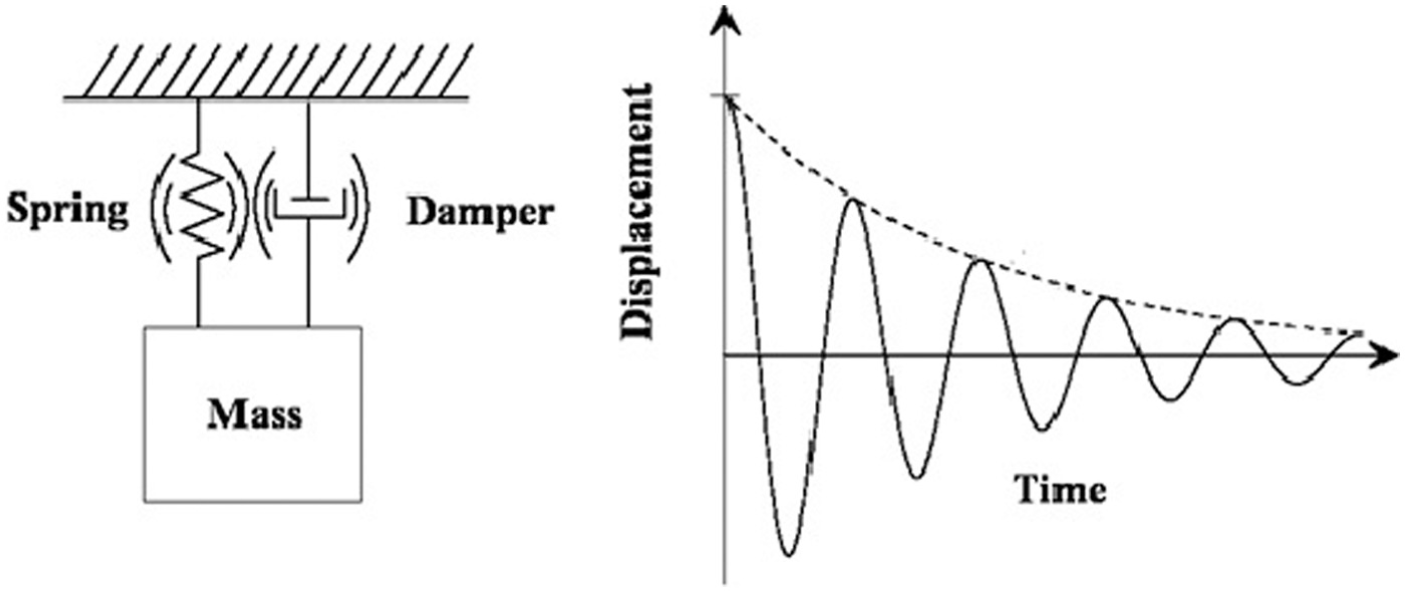
Single-degree-of-freedom system.
Vibration became a regular problem in machining processes like turning, boring, drilling and milling. Surface roughness, dimensional accuracy, tool life, production rate and productivity are influenced by the vibrations. A configuration of boring, using a long overhang boring bar, is shown in Figure 2. The workpiece is fixed in the headstock chuck, and the boring bar is fixed in the turret of computer numerical control (CNC) machine tool. In boring process, the workpiece is rotated, and the boring bar is moved against the rotating workpiece. Forces which are developed by metal deformation result in vibration of tool and workpiece. Vibrations may be measured in terms of displacement, velocity or acceleration.
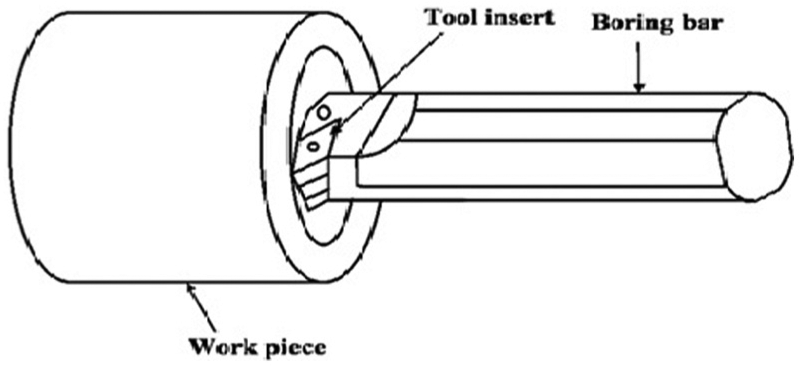
A configuration of internal turning.
In turning process, vibration of tool is denoted as self-excited chatter or tool vibration. Based on the driving force of the tool vibration, the tool vibrations are divided into regenerative chatter and nonregenerative chatter. The regenerative chatters occur due to undulation of the workpiece surface, produced during previous successive cuts. The nonregenerative chatters are induced due to eigenfrequencies of tool holder excitation, plastic deformation of workpiece vibration, friction at tool–chip interface, cutting forces and tool geometry.
Tobias 10 explained the two chatters such that the regenerative chatters occur due to undulation of the workpiece surface, produced during previous successive cuts. The nonregenerative chatters are induced due to eigenfrequencies of tool holder excitation, plastic deformation of workpiece vibration, friction at tool–chip interface, cutting forces and tool geometry. Hamdan and Bayoumi 11 studied the effects of tool rake and flank clearance angles on the stability of cutting tool. They carried out experimental and analytical investigation on the effect of tool angles. The two methods proved that the larger rake and clearance angles increase the stability of vibration.
A closed-loop feedback circuit is used in online vibration control system to measure the relative vibration between workpiece and cutting tool. 12 Xiao et al. 13 studied the effect of tool nose radius on chatter vibrations and surface roughness. They introduced vibration cutting method with large nose radius to reduce vibrations, surface roughness and improve tool strength. Laser Doppler vibrometers (LDVs) are being used to observe high-frequency vibrations during machining process. LDVs will observe the chatter behavior of the end-mill shank and the chatter vibrations at the high cutting speed. 14 A fast Fourier transform preprocessor is used for generating features from an online acousto-optic emission (AOE) signals to develop a database for appropriate decisions. The AOE signals can be transformed into time domain with different frequency zones by the fast Fourier transform. This AOE technique is being used in tool condition monitoring.15,16 Surface roughness and tool wear are strongly affected by the vibration amplitude and frequency. Improper tool geometry and the nose radius are more significant than depth of cut to cause vibration in metal cutting. 17
In this work, tool life was evaluated by analyzing machining characteristics like surface roughness, amplitude of workpiece vibration and volume of metal removed. So far, accelerometers are used to measure vibration tool while machining is in progress. But in this work, an attempt is made to measure vibration of rotating workpiece with LDV.
Methodology
In this work, Taguchi, analysis of variance (ANOVA) and regression analysis methods were used to analyze the experimental data to find out the effect and contribution of cutting parameters on machining characteristics (surface roughness, amplitude of workpiece vibration and volume of metal removal). Regression equations were arrived at trials to represent the relation between dependent and independent variables.
DOE and selection of cutting parameters
A specially designed orthogonal array of Taguchi was used to investigate the effects of the entire machining parameters through the small number of experiments, and it takes less time for the experimental investigations. Salgado et al. 18 studied the cutting parameters, feed rate, spindle speed, depth of cut, tool nose radius, nose angle and vibration data which are the input information for evaluation of tool life. Two levels of spindle speed, feed rate and nose radius were taken in their work to evaluate tool life. Çiçek et al. 19 have taken two levels of cutting parameters in their work to determine the optimal combinations of drilling parameters and to minimize machining costs and time in drilling of AISI 316 stainless steel.
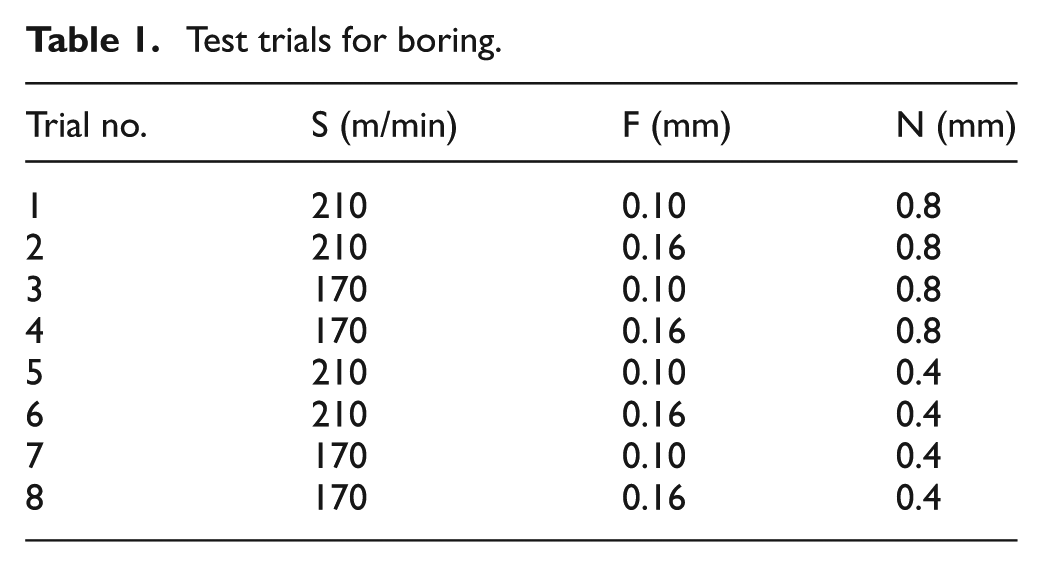
In this study, the cutting parameters, such as nose radius (N), rotational cutting speed (S) and feed rate (F), were selected as control factors with two levels. An appropriate orthogonal array was selected to determine the optimal cutting parameters and to analyze the effects of these parameters. The cutting parameters were assigned to each column, and eight combinations of parameters were derived as shown in Table 1.
Test trials for boring.
Signal-to-noise ratio characteristics
The Taguchi method uses signal-to-noise (S/N) ratio to measure the variations of experimental design. The word signal means the desirable value, and the word noise means the undesirable value. The formulae for S/N ratio are designed such that the experimentalist can always select the larger factor-level settings to optimize the quality characteristics of an experiment. Then, the selection of calculating the S/N ratio depends on the characteristics such as smaller-the-better, larger-the-better or normal-the-better. 20
S/N ratios for different categories are given as follows:
Normal is the best

Smaller is the best

Larger is the best
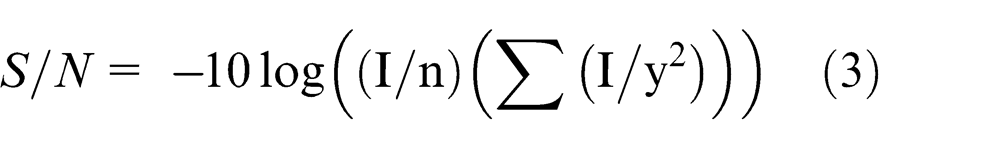
where
ANOVA
In this study, ANOVA was used to find out the effect of cutting speed, nose radius and feed rate on tool life by analyzing the surface roughness, amplitude of workpiece vibration and amount of metal removed until the tool failed. In the analysis, the percentage contribution of each cutting parameter was determined and was used to measure the corresponding effects on the metal cutting. The performed experimental plan was evaluated at 95% of confidence level.19–21
Regression analysis
Multiple regression analysis was also used to find out significant cutting parameter. An equation between dependent and independent variables was developed to predict the error. The coefficient of determination (R2) is calculated for the dependent variables based on which the decision could be taken to suggest the equation. Empirical models were developed for the prediction of surface roughness in turning. The model considers workpiece hardness, feed, cutting tool point angle, depth of cut, spindle speed and cutting time. 22
Tool life criteria
A sharp cutting tool is expected to give more cutting ability for long time with an effective and smooth manner. If it is not giving satisfactory work, then it can be said as tool failure. Gradual wear is one of the tool failure modes that occurs due to loss of mass or weight in metal cutting on face and flank of tool. The wear on the face and flank is called as crater wear and flank wear or wear land, respectively. According to International Standards Organization, 23 the maximum wear land width (VBmax) should be less than 0.6 mm. This criterion was adopted in this study.
Workpiece material and tool inserts
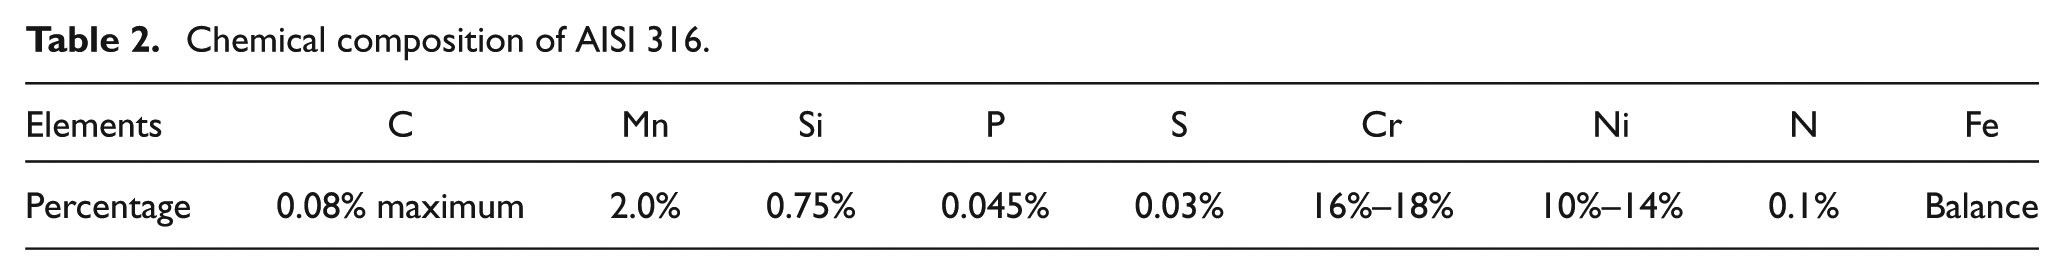
The chemical composition of AISI 316 stainless steel is shown in Table 2 with percentages of all elements. It has good corrosion resistance when exposed to corrosive atmosphere, and it is regarded as marine grade due to its corrosion resistance. The machinability of this steel is rated at 45% with respect to the AISI 1112. The workpieces used in the experiment are shown in Figure 3.
Chemical composition of AISI 316.
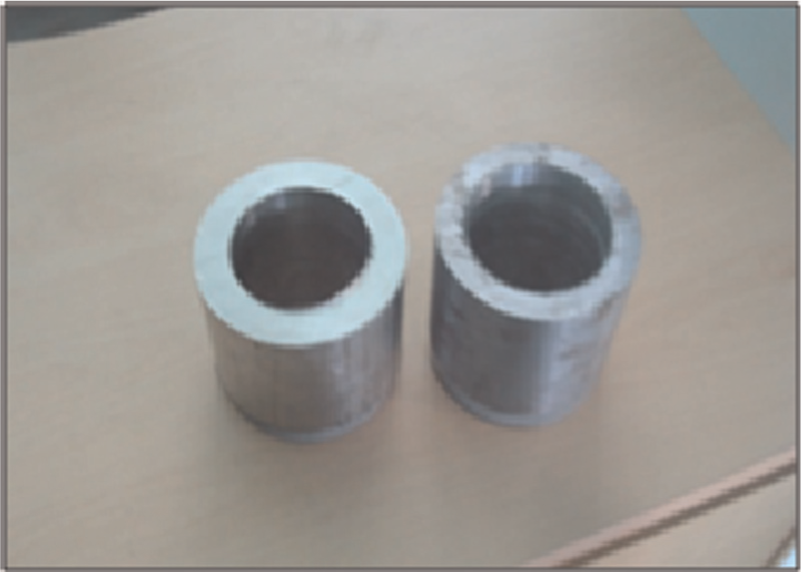
Workpieces.
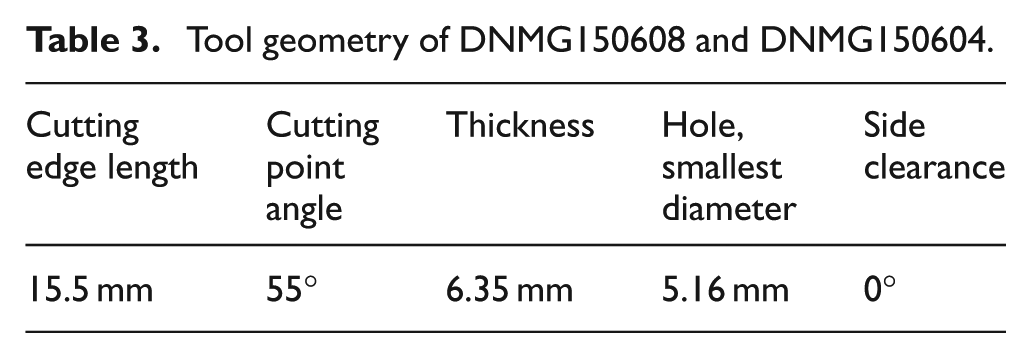
Physical vapor deposition (PVD)-coated tungsten carbide tool inserts were used in this experiment with two nose radii of 0.8 mm (DNMG150608) and 0.4 mm (DNMG150604). The insert geometry is shown in Table 3 and Figure 4.
Tool geometry of DNMG150608 and DNMG150604.
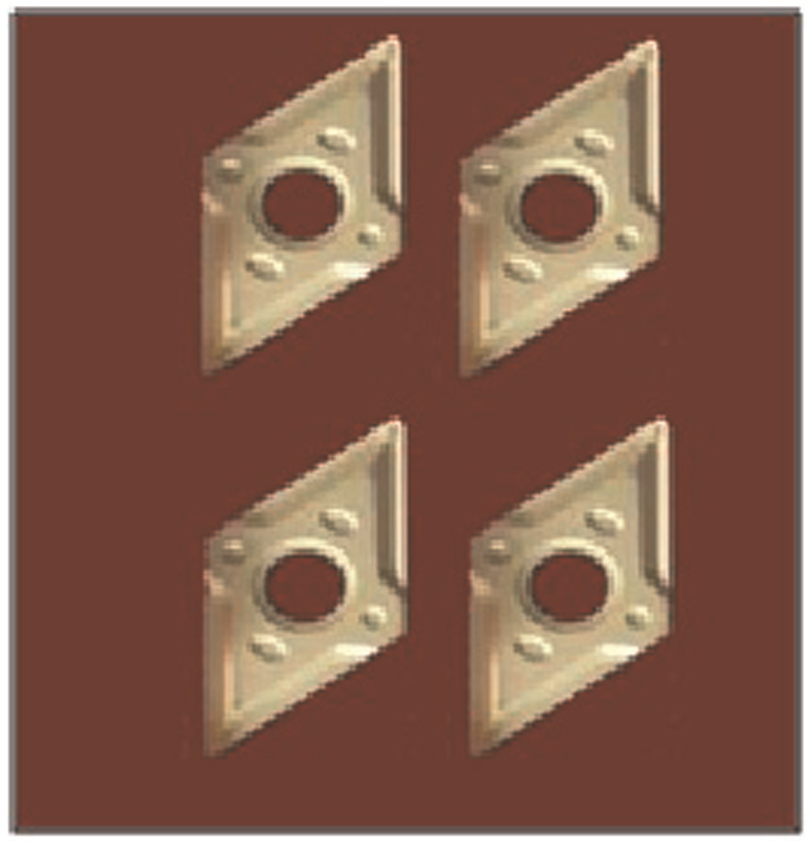
Tool inserts.
Experimental procedure
The experiment was conducted on CNC lathe DX200 model. The metal used in this experiment is AISI 316 with length of 90 mm, outer diameter of 100 mm and inner diameter of 56 mm.
The following sequential procedure was used to carry out the experiment under dry condition:
Each test was started with a fresh cutting edge with one test condition (trial), and machining is stopped at the end of each pass. After each pass, the depth of cut was increased by 0.2 mm (fixed depth of cut was given in each pass) until the tool failed.
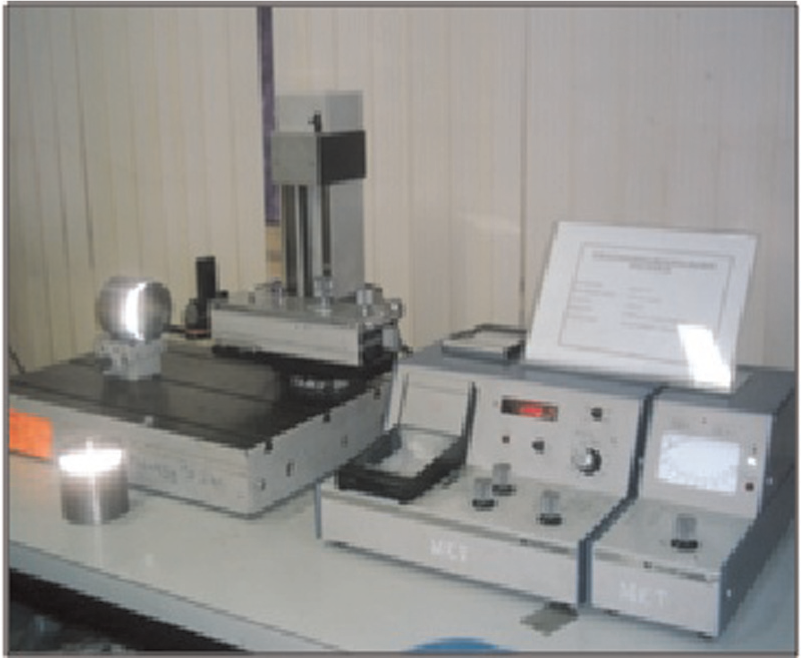
Vibration signals from the rotating workpiece were measured in the machining process using LDV. The setup of experiment is shown in Figure 5.
After each pass, the tool insert is removed, and flank wear is measured with machine vision system (Figure 6). Optical microscopes of crater and flank wear on the two tool inserts are shown in Figures 7 and 8, respectively.
After each pass, the workpiece was also removed, and its surface roughness is measured on Talysurf (Figure 9).
The steps 1–4 were to be continued until the tool failed. After this, two or three passes were performed on the workpiece to observe the behavior of tool wear.
In each trial, surface roughness, volume of metal removed, time and amplitude of workpiece vibrations are identified when the tool failed.
The workpiece was changed, and steps were repeated with a new trial.
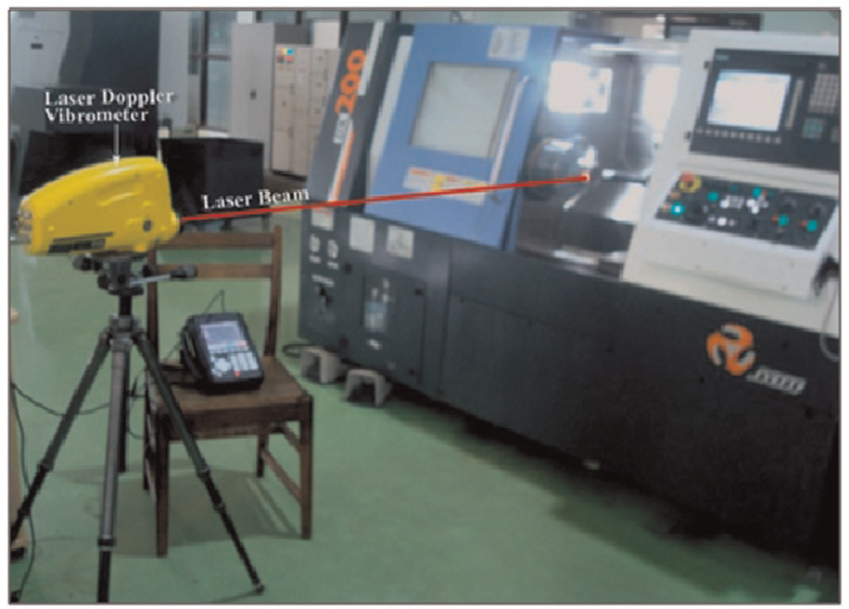
Experimental setup for boring.
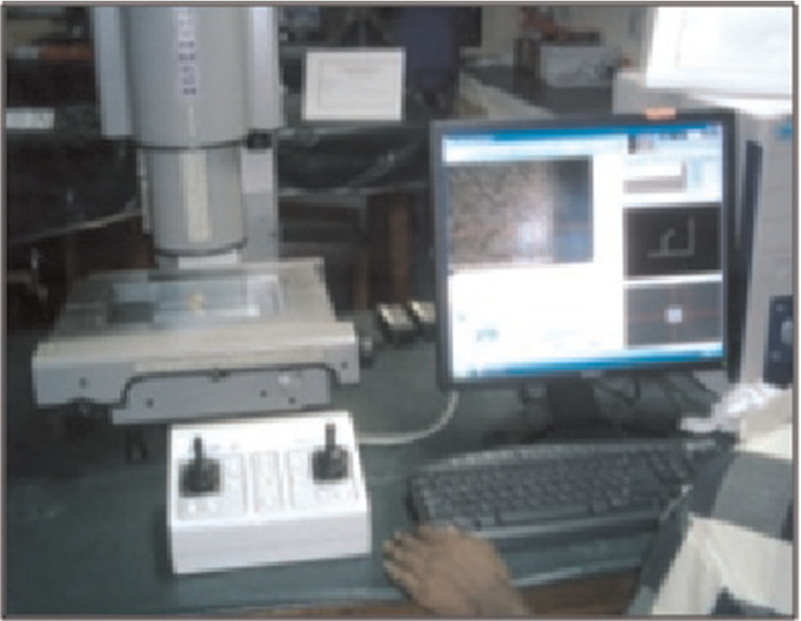
Machine vision system.
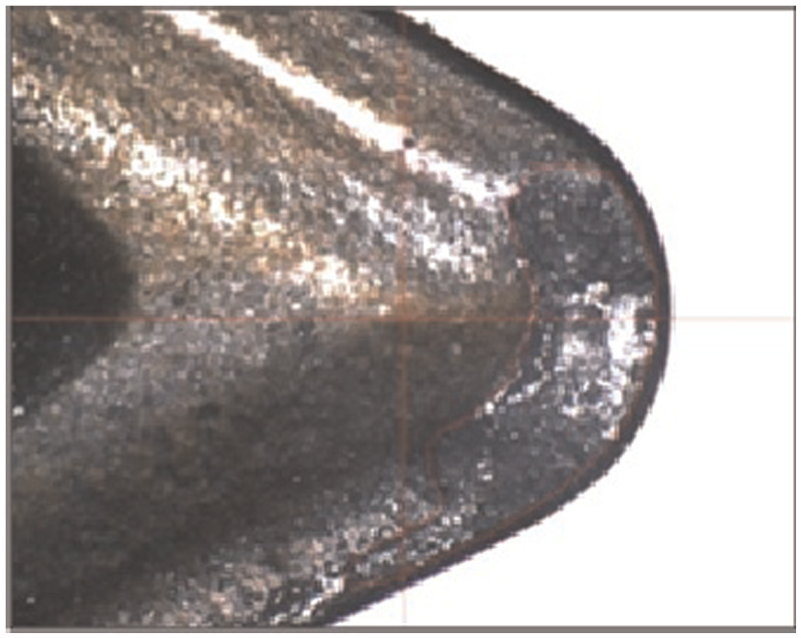
Crater wear.
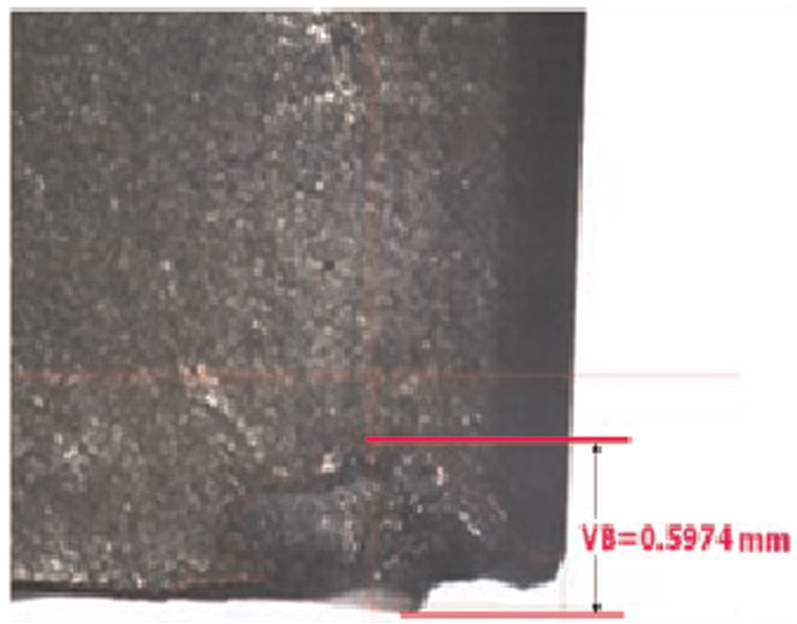
Flank wear.
Talysurf.
Results and discussion
In each trial, eight passes were conducted on workpiece with new tool insert. After each pass, surface roughness, flank wear and hardness were measured. Volume of metal removed was also noted and shown in Table 4.
Observations in trial 1.
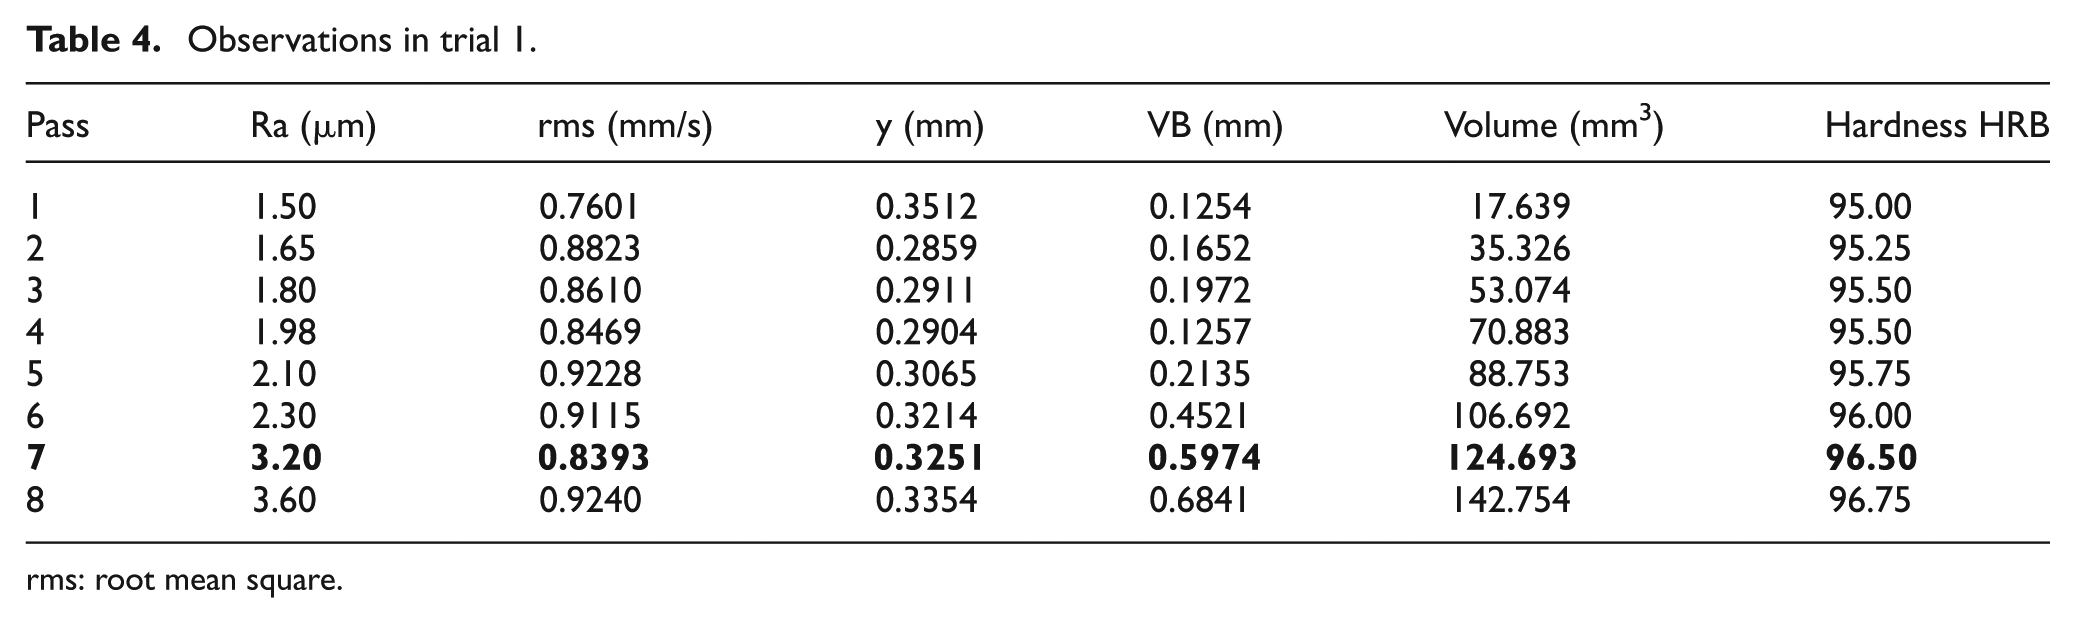
rms: root mean square.
Figures 10 and 11 represent spectrographs at the first pass and seventh pass (when tool failed) in both time and frequency domains. In trial 8, mechanical chipping occurred for 0.4-mm nose radius insert, and the corresponding time- and frequency-domain spectrographs are shown in Figure 12.
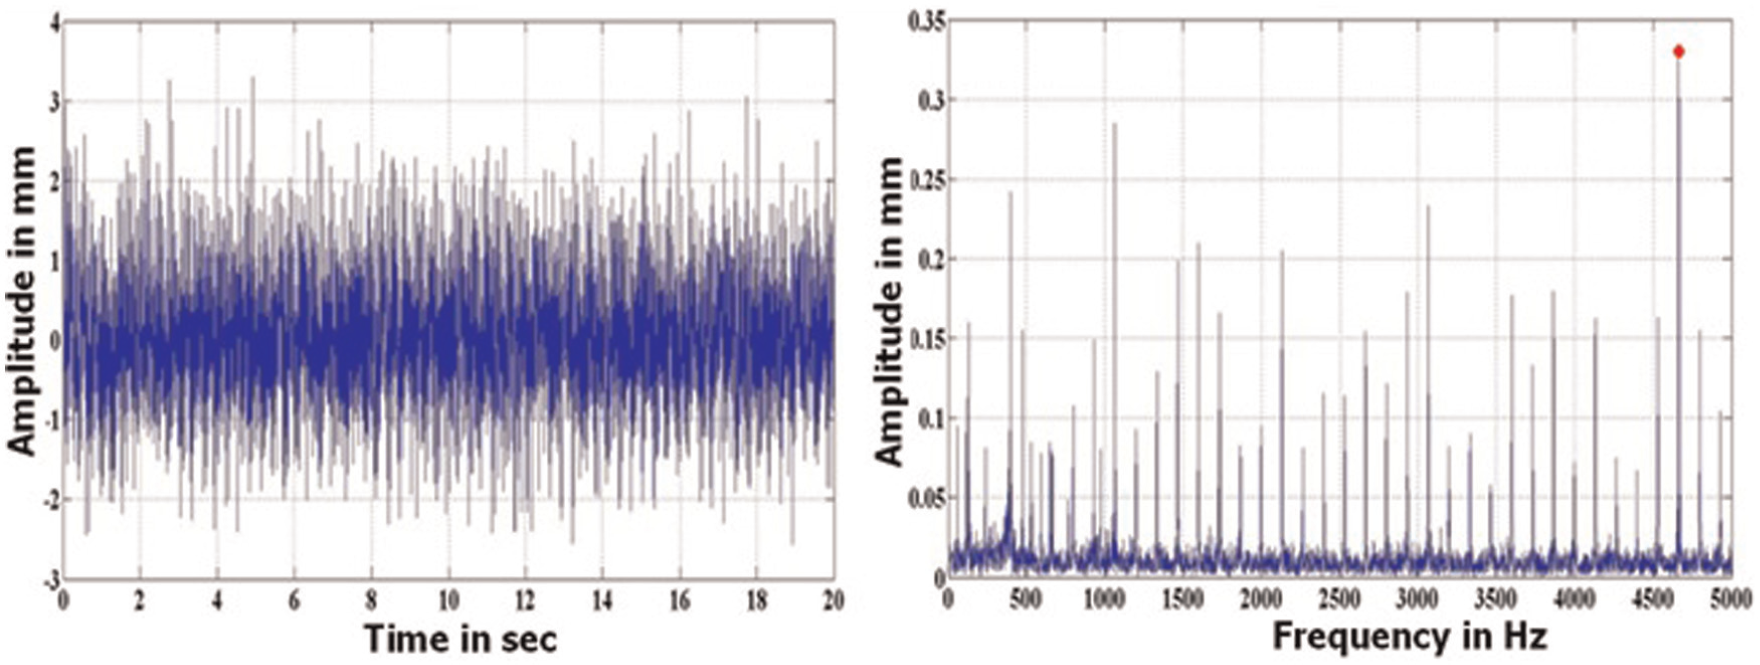
Time- and frequency-domain spectrographs in boring at the first pass.
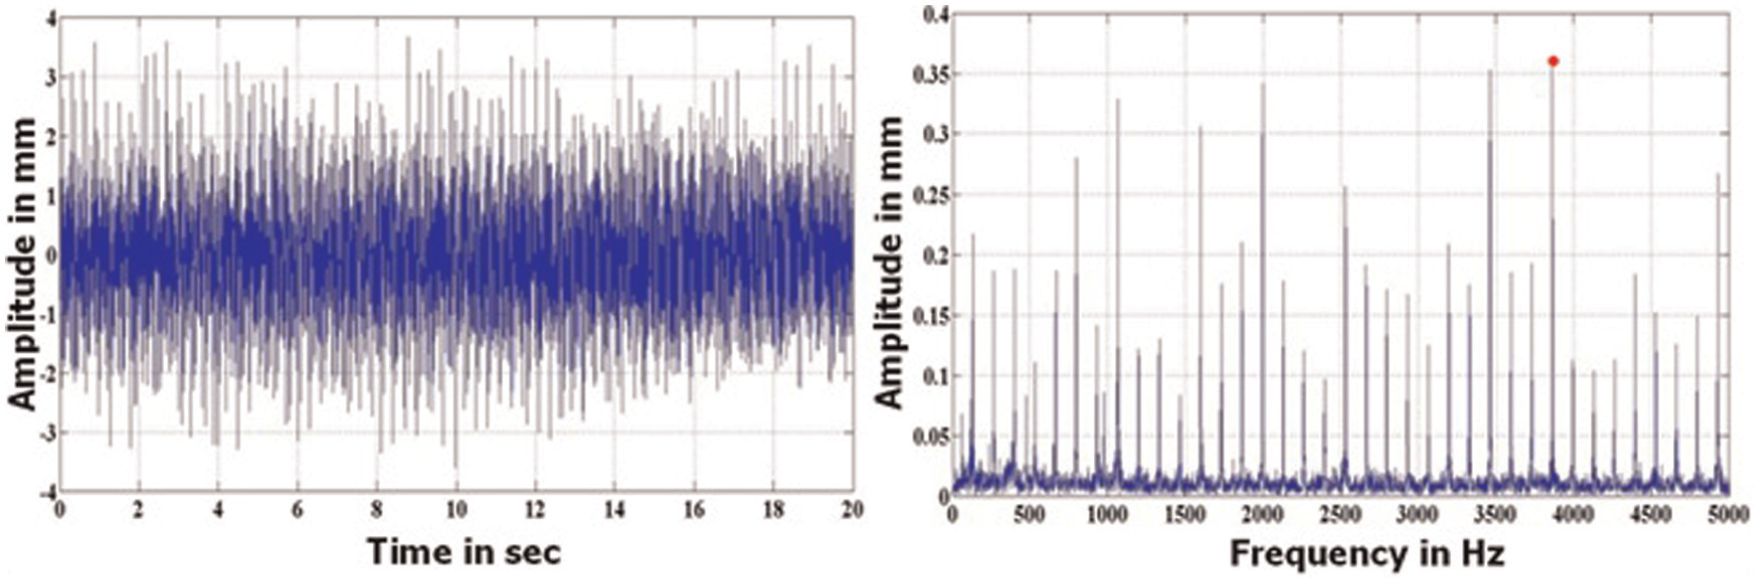
Time- and frequency-domain spectrographs in boring when the tool failed.
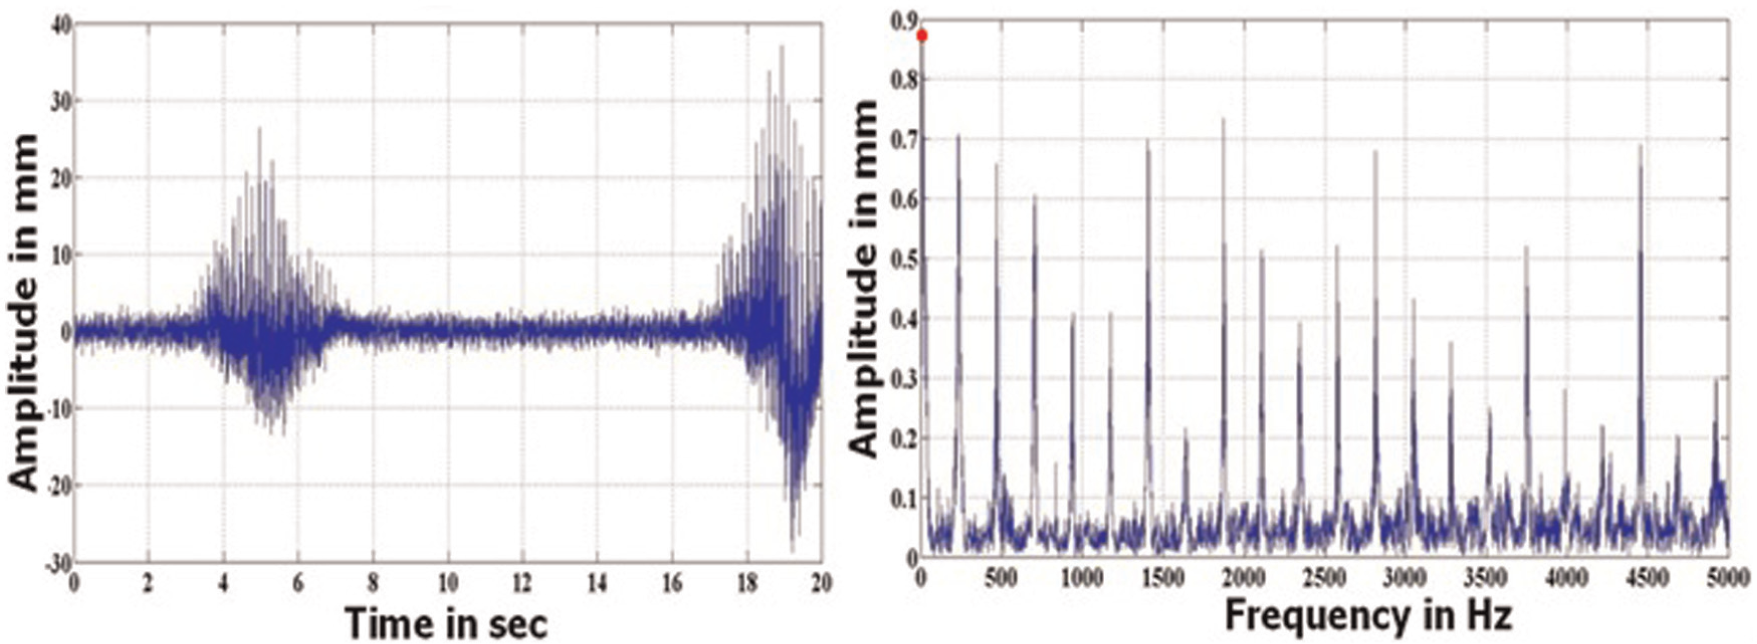
Time- and frequency-domain spectrographs when the tool failed due to mechanical chipping.
There was good correlation between amplitude of workpiece vibration (Y), surface roughness (Ra) and flank wear (VB) for all the trials. VB value of 0.6 mm is the criterion for tool failure. 23 In this study, the machining characteristics observed at the tool failure are represented in boldface in Table 4. Regression equations for surface roughness and amplitude of workpiece for all the trials are given in Table 5.
Regression equations for all trials.
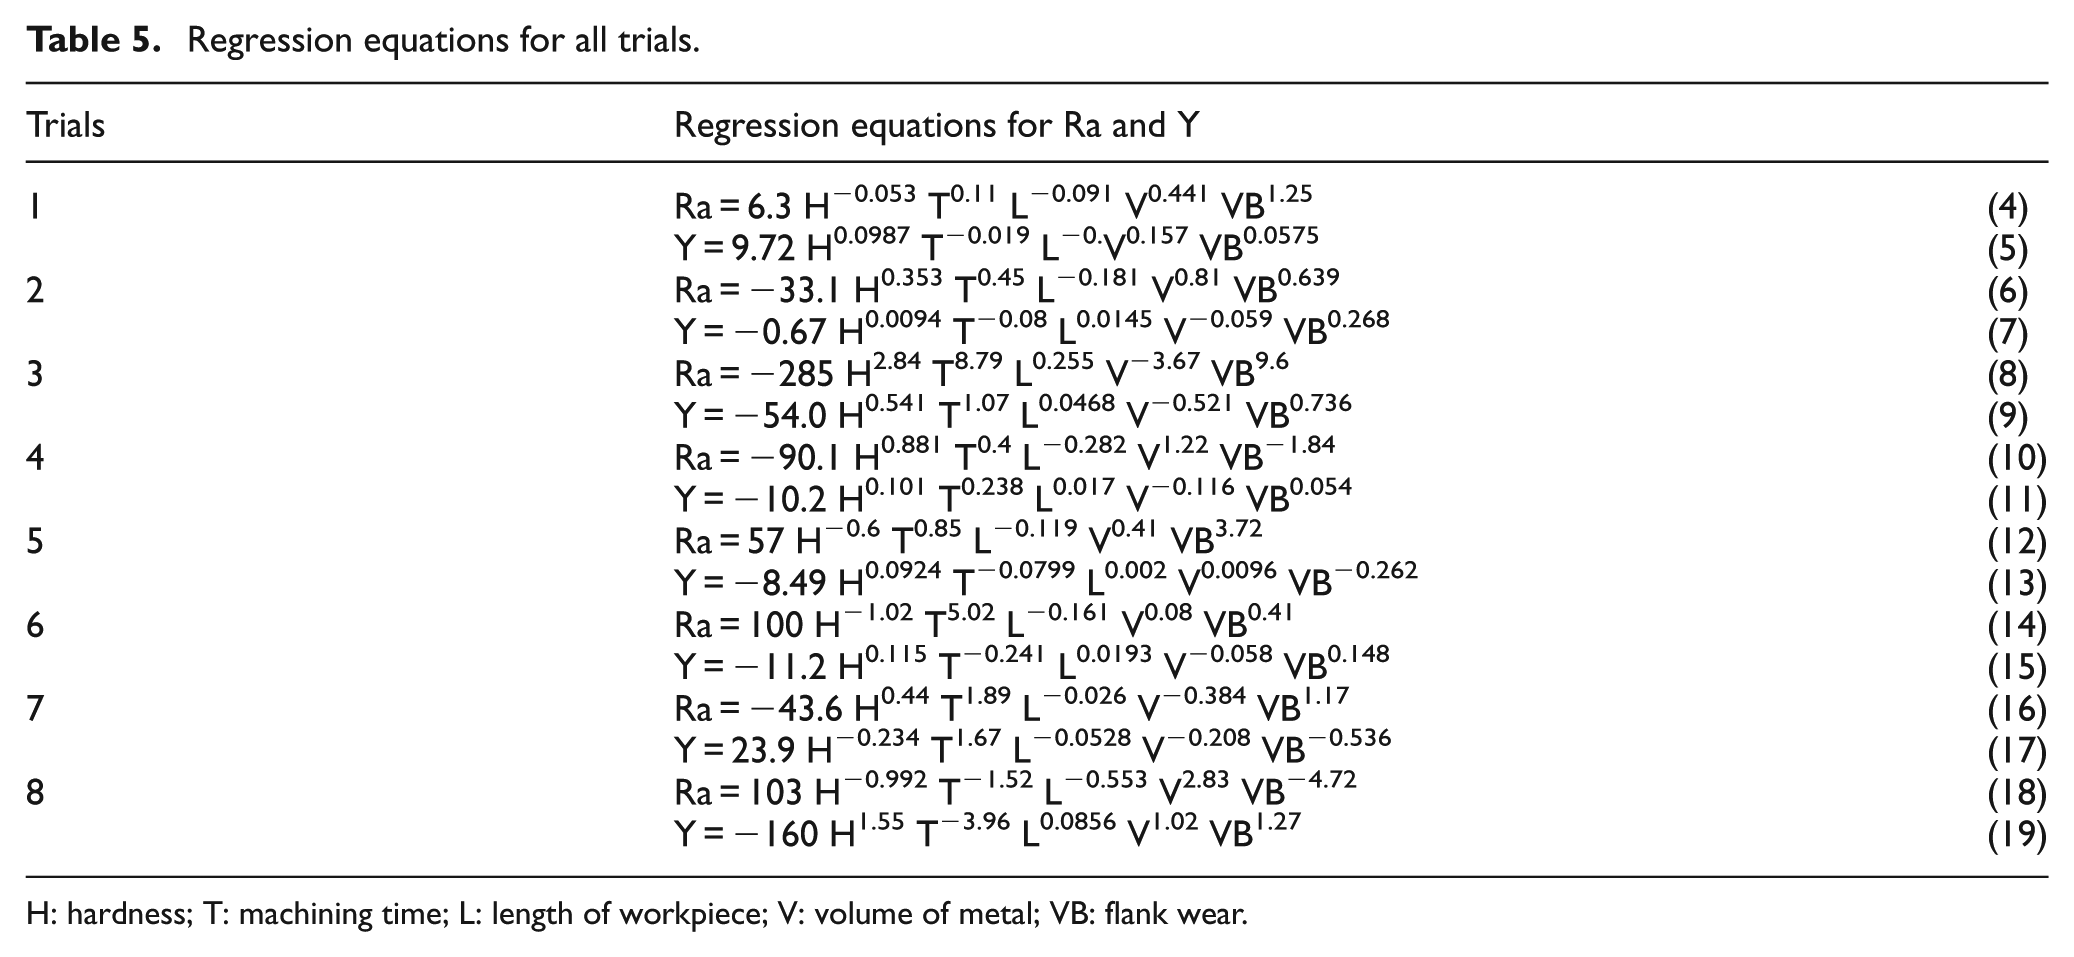
H: hardness; T: machining time; L: length of workpiece; V: volume of metal; VB: flank wear.
The variations of flank wear, surface roughness and amplitude of workpiece vibration for two different nose radii of cutting tools in all trials are shown in Figure 13. It is observed that the surface roughness and amplitude of wok piece vibration increase with the increase in flank wear as shown in Figure 14.
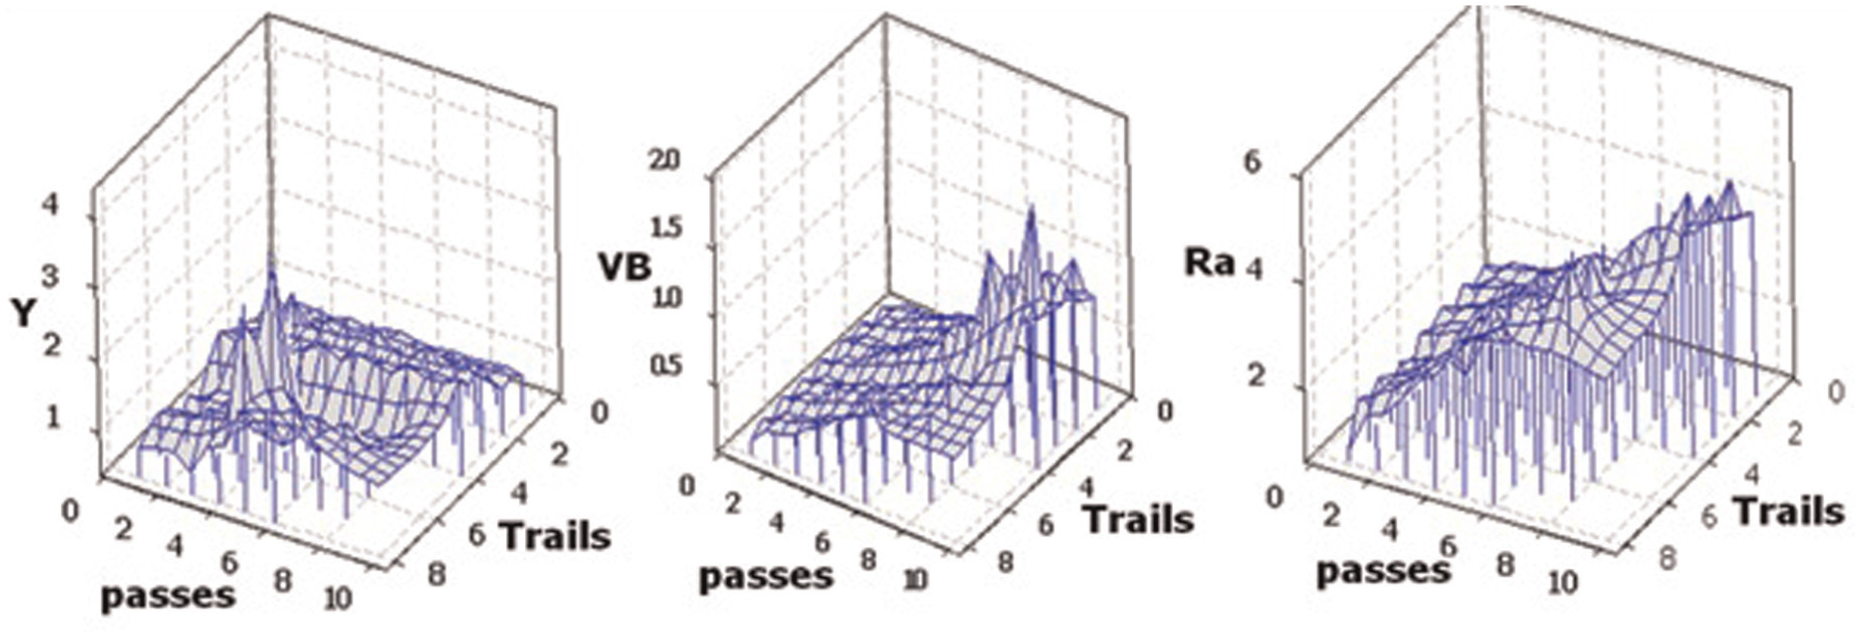
Flank wear, amplitude of vibration and surface roughness for eight trials.
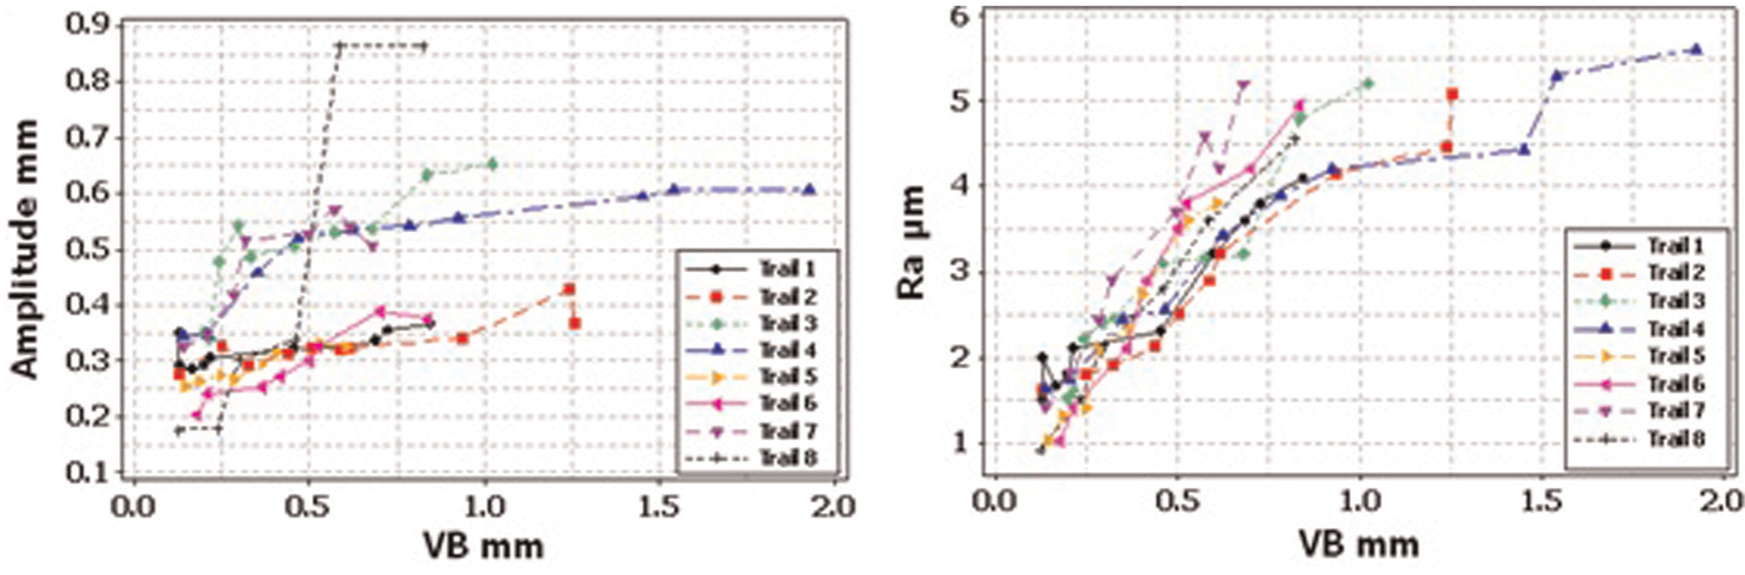
Correlation of surface roughness and amplitude of vibration with flank wear.
The machining characteristic values corresponding to the tool fail failure for all the eight trials are presented in Table 6 along with their calculated S/N ratios.
S/N ratios of experimental results for surface roughness, amplitude of vibration and metal removal rate.
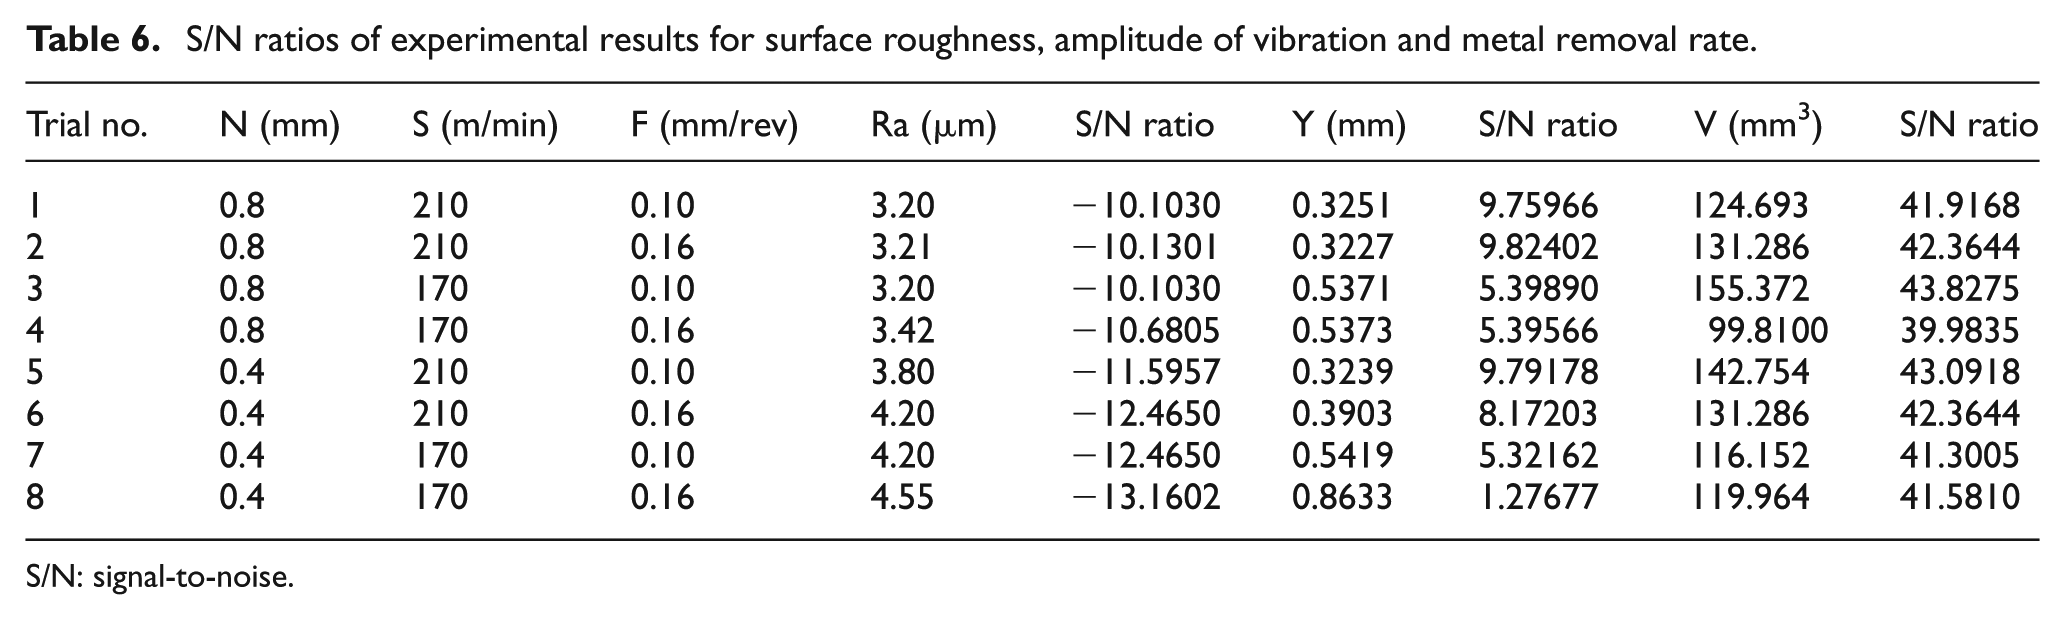
S/N: signal-to-noise.
Analysis of workpiece vibrations for tool life
In this section, tool life is evaluated by analyzing the amplitude of workpiece vibration with Taguchi and ANOVA methods.
Taguchi
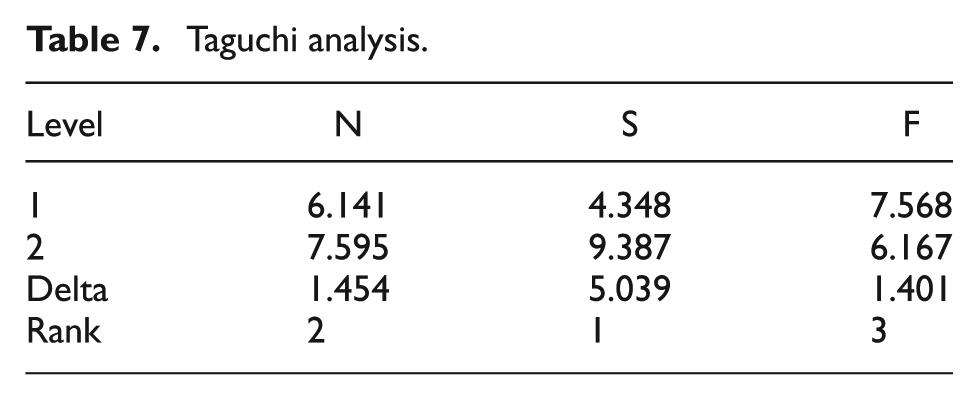
In this method, measured values of amplitude of workpiece vibration were taken in Table 6, and S/N ratio was measured with “smaller is better” characteristic for all the trials as shown in Table 6. According to Taguchi results, the cutting speed has more influence on the amplitude and is shown with first rank in Table 7. Abuthakeer et al. 24 also found the influence of cutting speed on the tool vibration in external turning process.
Taguchi analysis.
ANOVA
In the ANOVA, at a confidence level of 95%, the experimental results and the Taguchi S/N ratios were analyzed as shown in Table 8. ANOVA also determined the contribution of individual cutting parameters on the amplitude of workpiece vibration. Based on both ANOVA for experimental results (amplitude of workpiece vibration) as well as ANOVA for S/N ratio, the cutting speed is identified as significant parameter with the maximum contribution of 65.48% and 77.72%, respectively.
Analysis of variance.
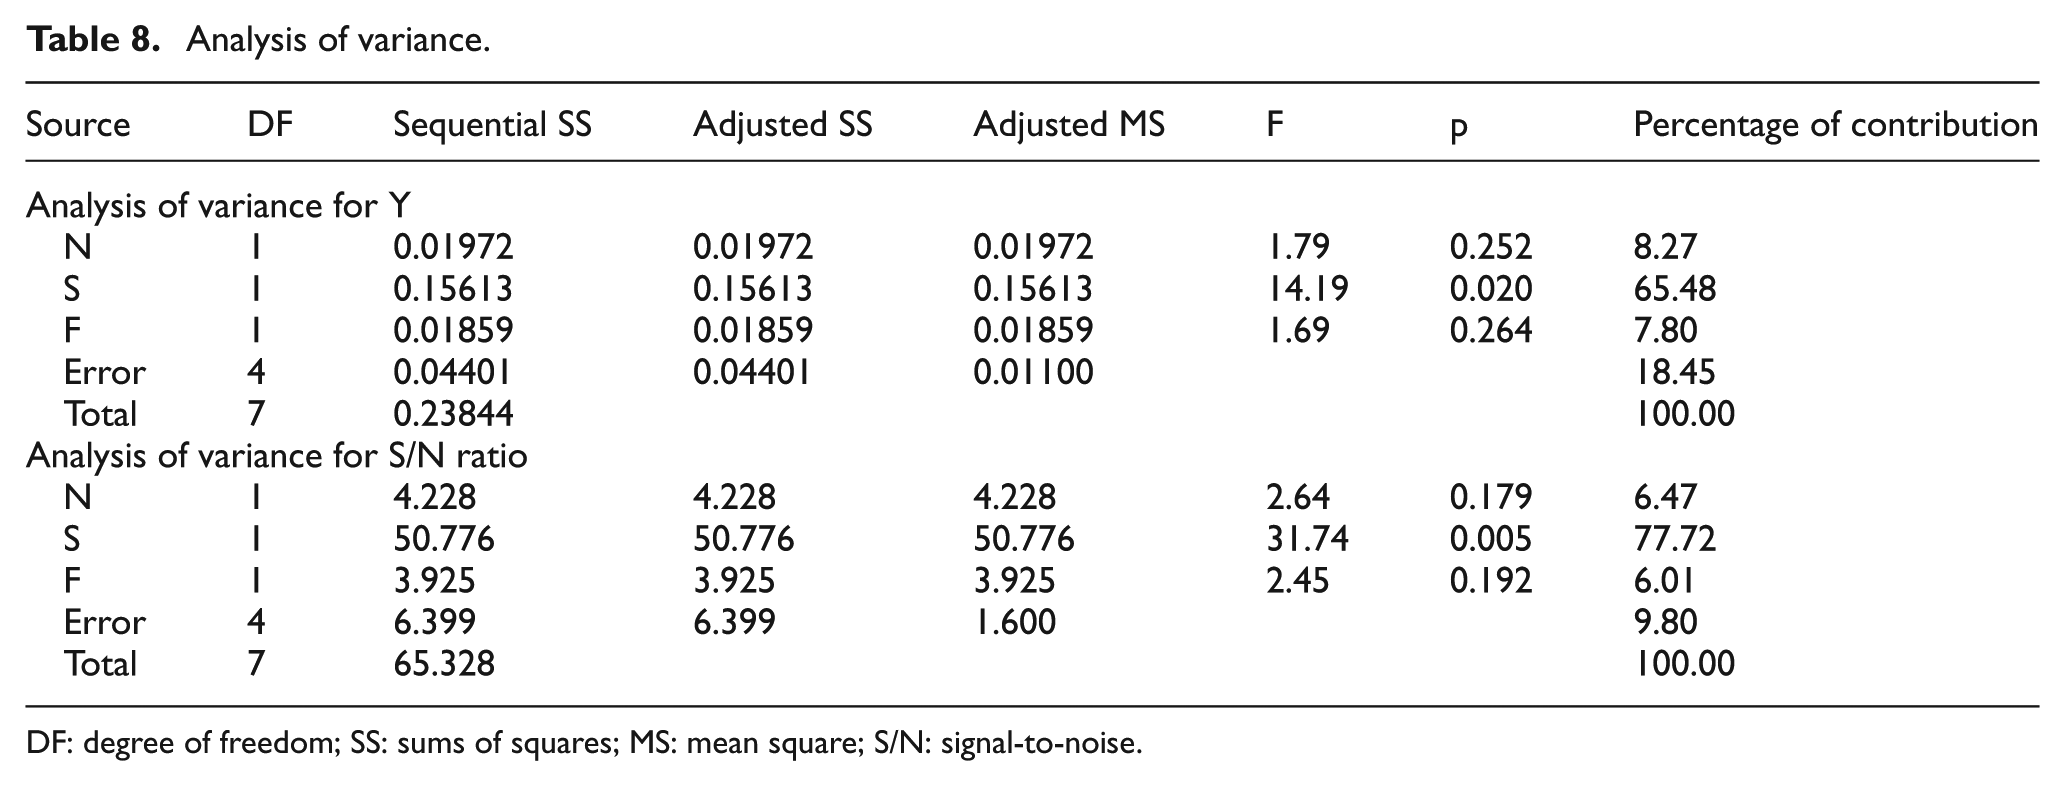
DF: degree of freedom; SS: sums of squares; MS: mean square; S/N: signal-to-noise.
According to Figure 15, to minimize the amplitude of vibration, the best combination of three cutting parameters of nose radius, cutting speed and feed rate is 0.8 mm, 210 m/min and 0.1 mm, respectively.
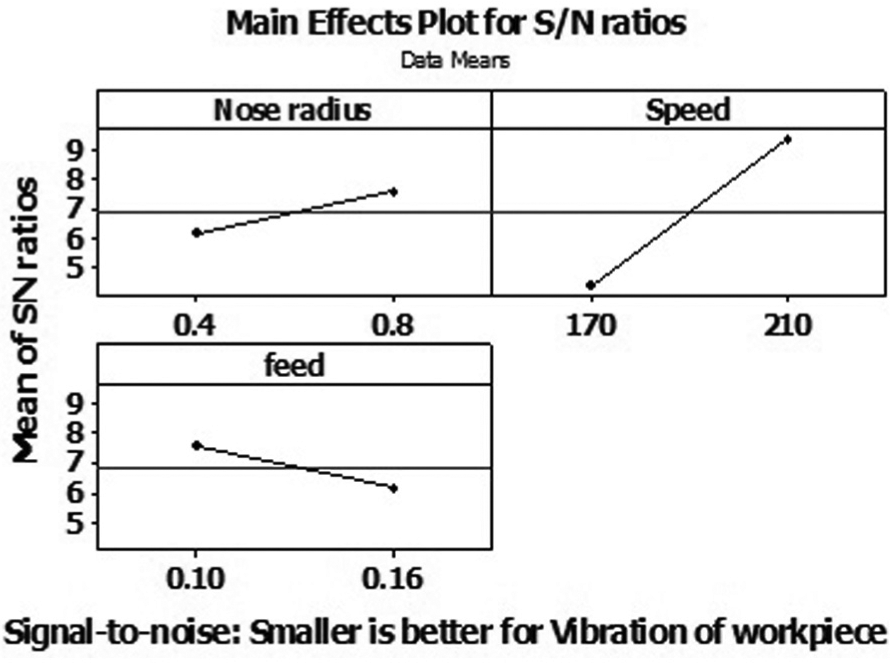
Main effects of plot for S/N ratios for vibration of workpiece.
Analysis of surface roughness for tool life
In this section, tool life is evaluated by analyzing the surface roughness with Taguchi and ANOVA methods.
Taguchi
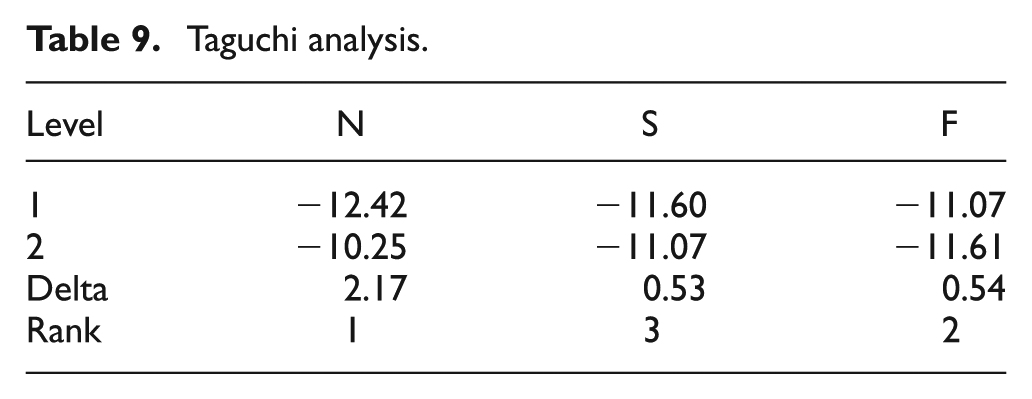
Measured values of roughness for all the trials were taken in Table 6, and S/N ratios were measured with “smaller is better” characteristic for all the trials. Taguchi results show that the nose radius has more influence on the surface roughness and is shown with first rank in Table 9.
Taguchi analysis.
ANOVA
In the ANOVA, at a confidence level of 95%, the experimental results and the Taguchi S/N ratios were analyzed as shown in Table 10. ANOVA also determined the contribution of individual cutting parameters on the surface roughness. According to the ANOVA for experimental results and ANOVA for S/N ratio, the nose radius is the significant parameter, and its contribution is 84.51% and 86.43%, respectively. Marimuthu and Chandrasekaran 1 and Muthukrishnan and Paulo Davim 25 also found that the feed has more influence on the surface roughness in external turning.
Analysis of variance.
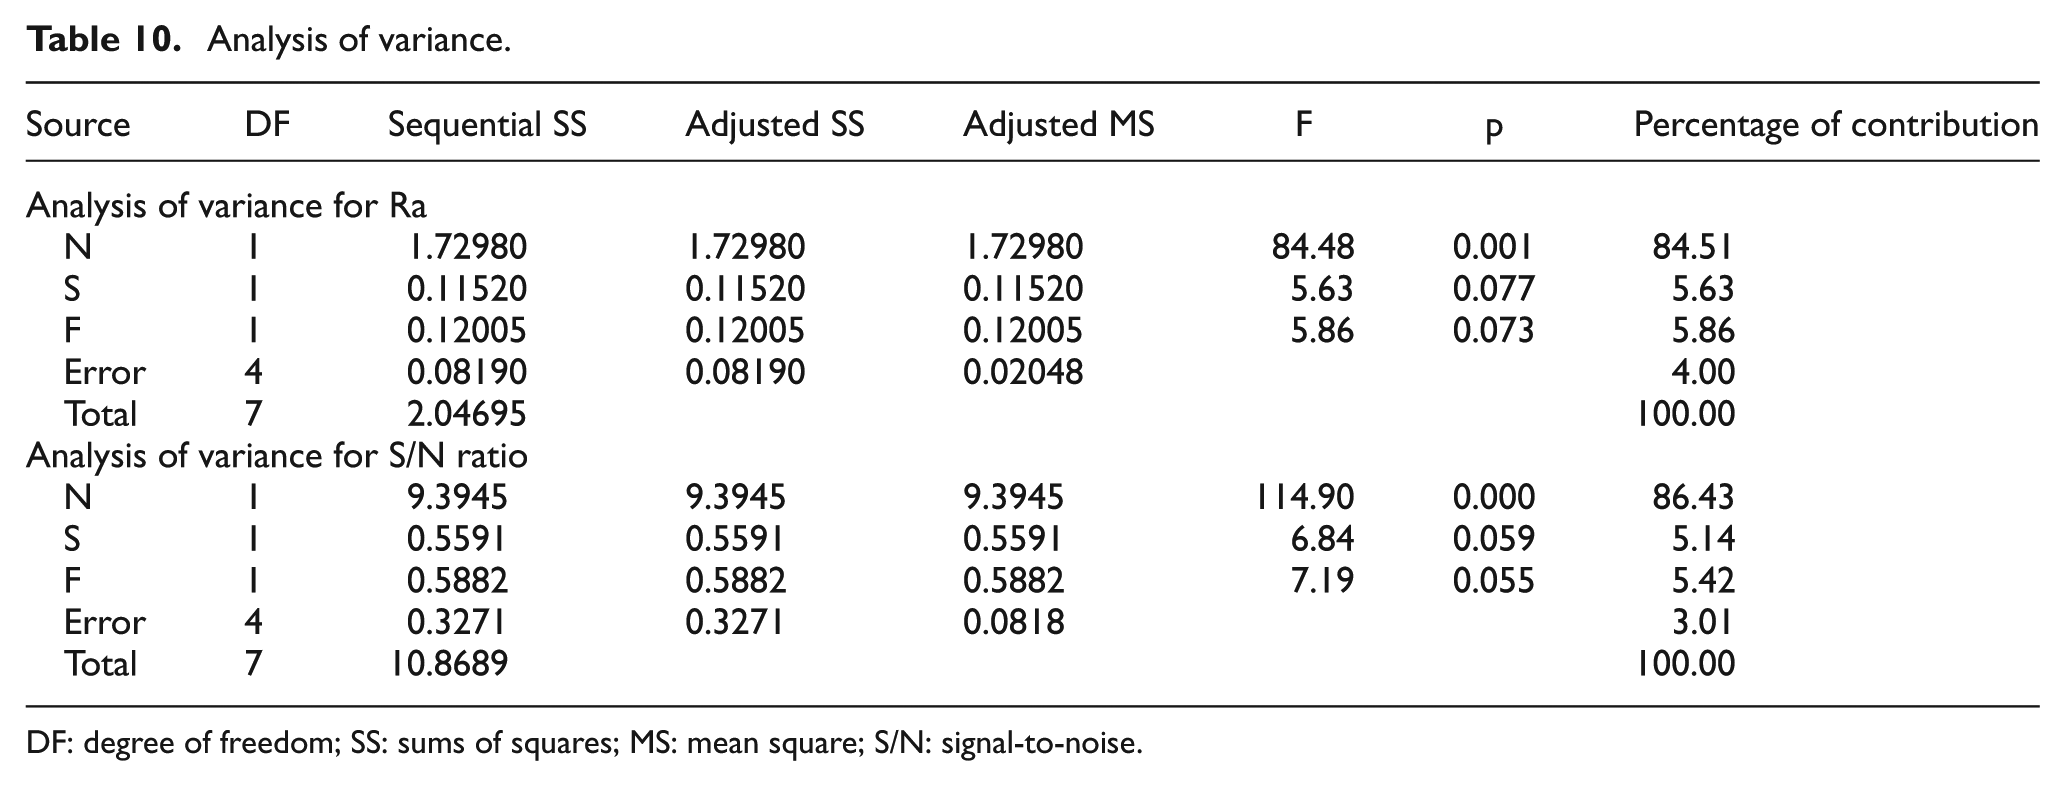
DF: degree of freedom; SS: sums of squares; MS: mean square; S/N: signal-to-noise.
According to Figure 16, to minimize the surface roughness, the best combination of three cutting parameters of nose radius, cutting speed and feed rate is 0.8 mm, 210 m/min and 0.1 mm, respectively
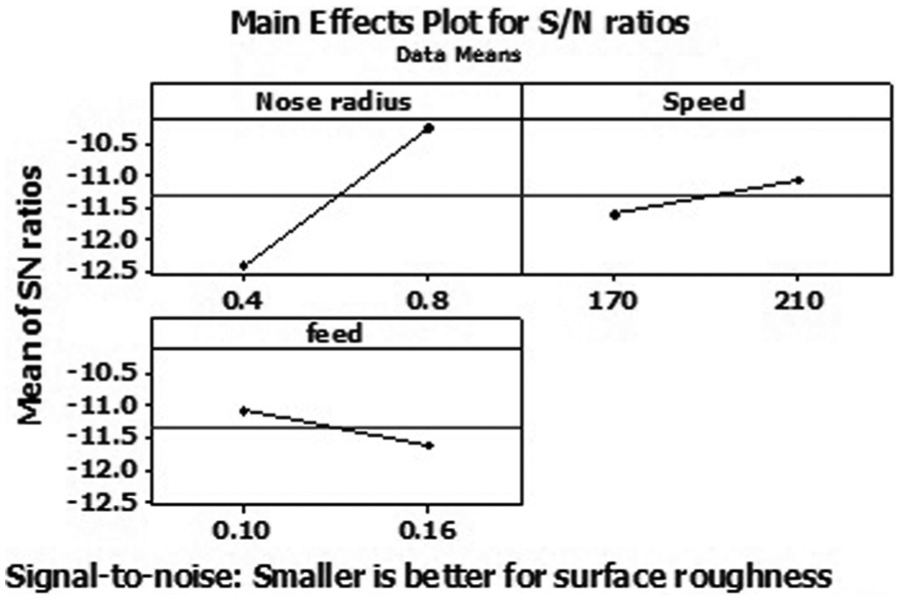
Main effects of plot for S/N ratios for surface roughness.
Analysis of volume of metal removal for tool life
Tool life can also be defined as volume of material removed between two successive sharpening of tools. 26 In this section, tool life is evaluated by analyzing the volume of metal removal with Taguchi and ANOVA methods. In past research, influence of metal removal rate on the tool life was studied. But in this work, effect of volume metal removed on the tool life was studied.
Taguchi
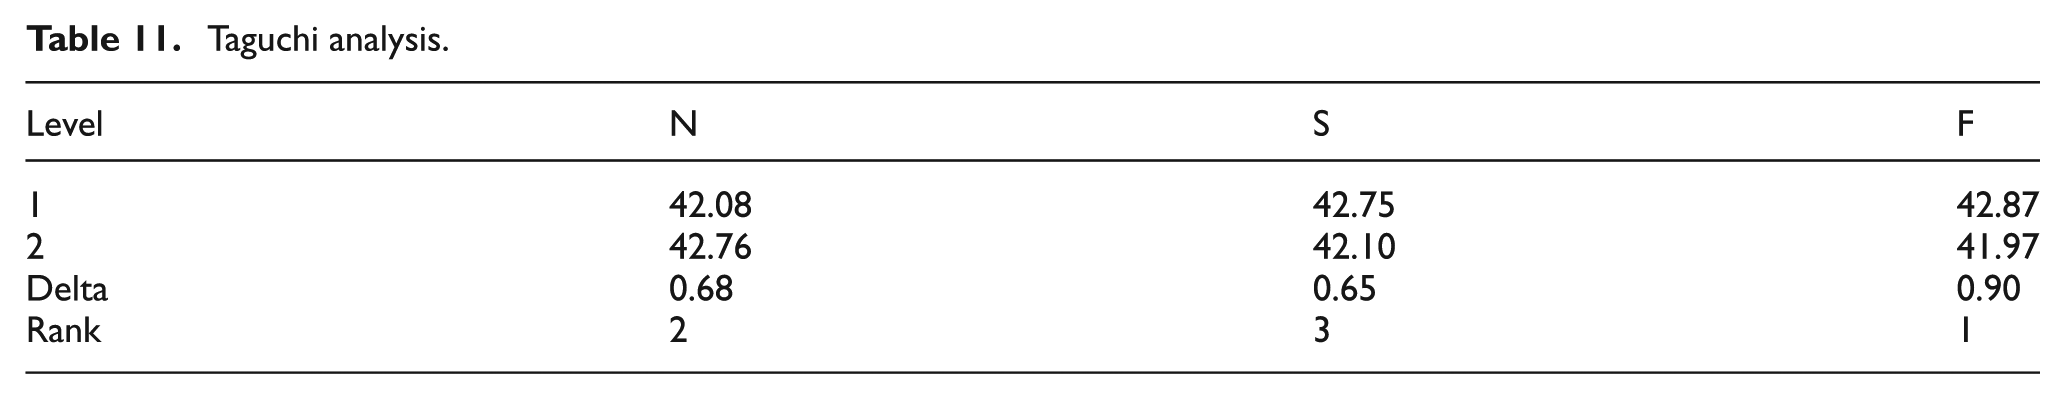
In this method, volume of metal removed until tool failed was taken and S/N ratio was measured with “larger is better” characteristic for all the trials. According to Taguchi results, the feed rate has more influence on the volume of metal removed and is shown with first rank in Table 11.
Taguchi analysis.
ANOVA
In the ANOVA, at a confidence level of 95%, the experimental results and the Taguchi S/N ratios were analyzed as shown in Table 12. ANOVA also determined the contribution of individual cutting parameters on the metal removal rate. According to the ANOVA for experimental results and ANOVA for S/N ratio, the feed rate shows more contribution of 30.07% and 30.97%, respectively. Interaction of the cutting parameters is shown in Table 13.
Analysis of variance.
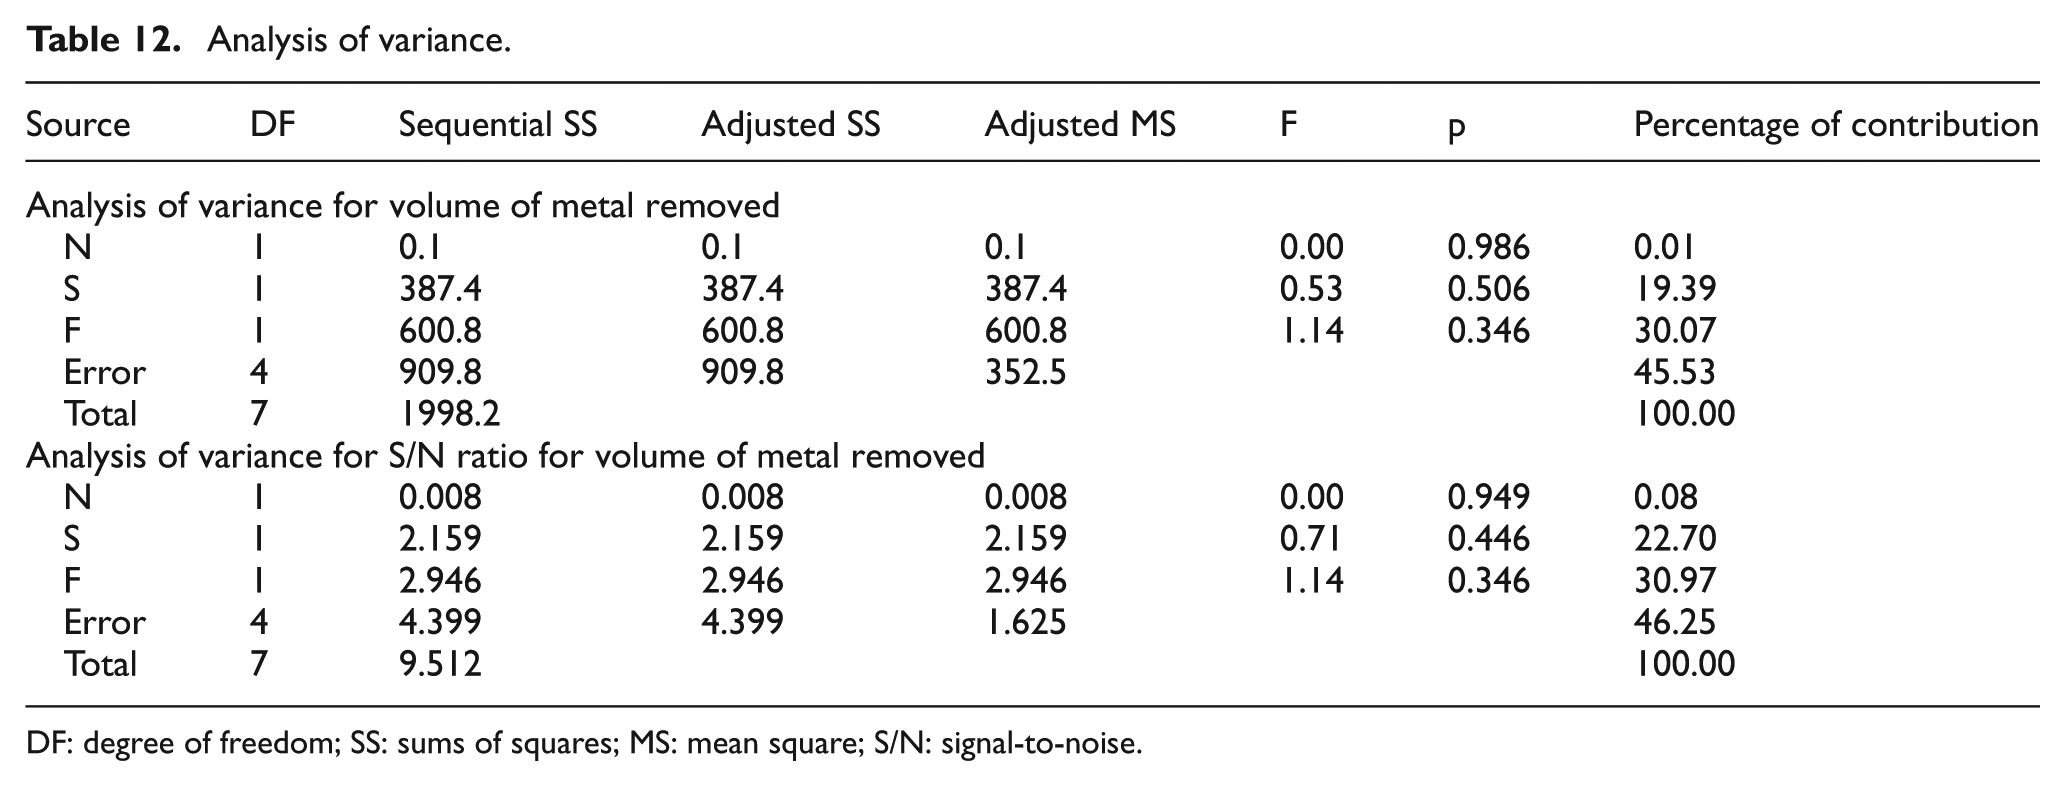
DF: degree of freedom; SS: sums of squares; MS: mean square; S/N: signal-to-noise.
Analysis of variance with interactions of cutting parameters.
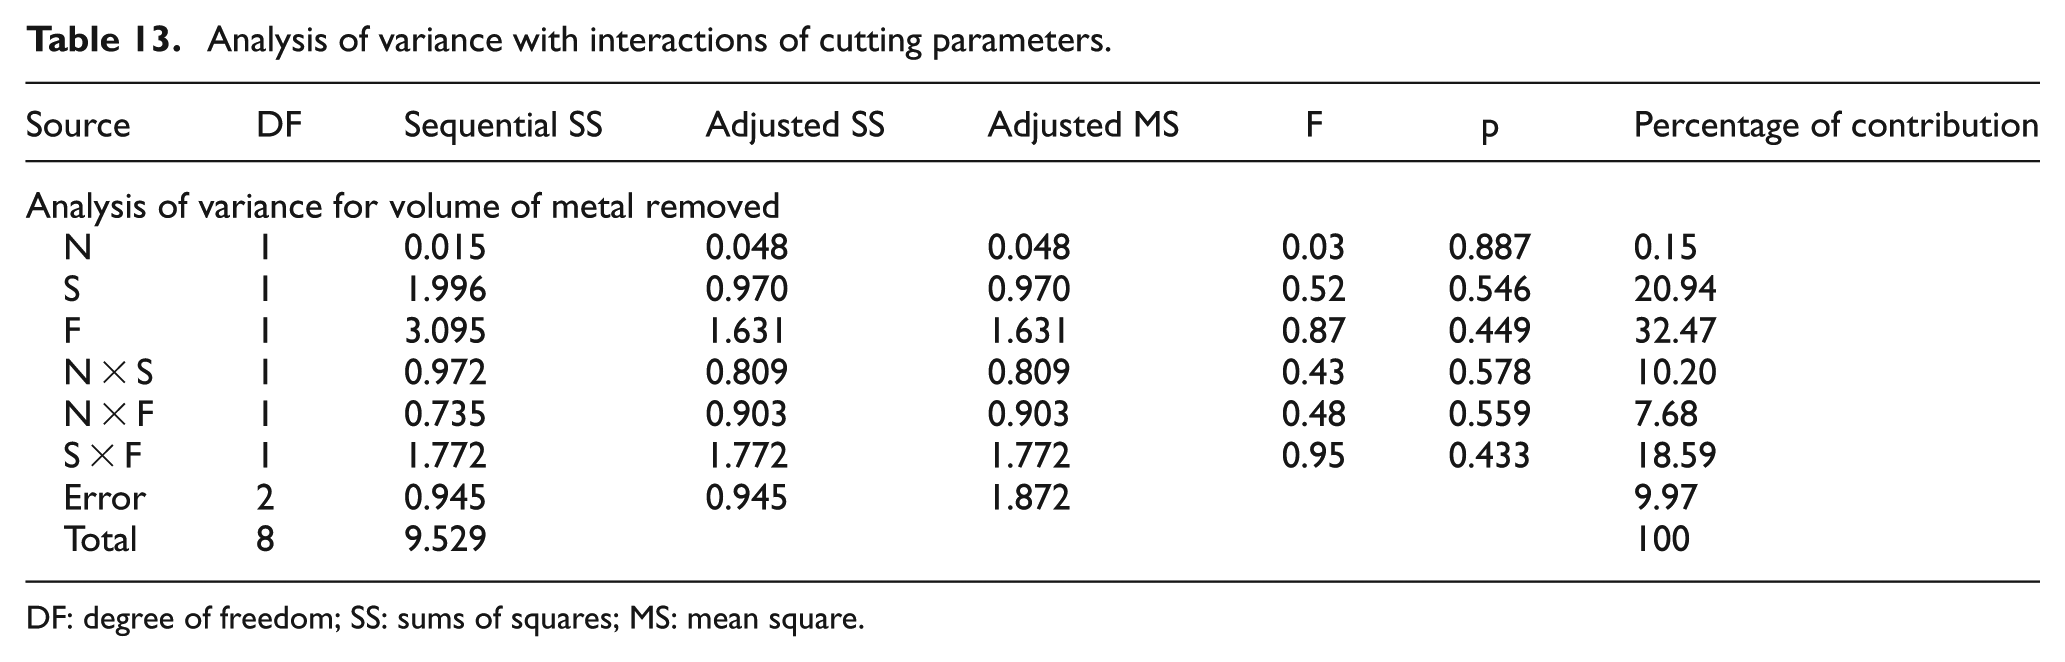
DF: degree of freedom; SS: sums of squares; MS: mean square.
According to Figure 17, to maximize the metal removal rate, the best combination of three cutting parameters of nose radius, cutting speed and feed rate is 0.4 mm, 210 m/min and 0.1 mm, respectively.
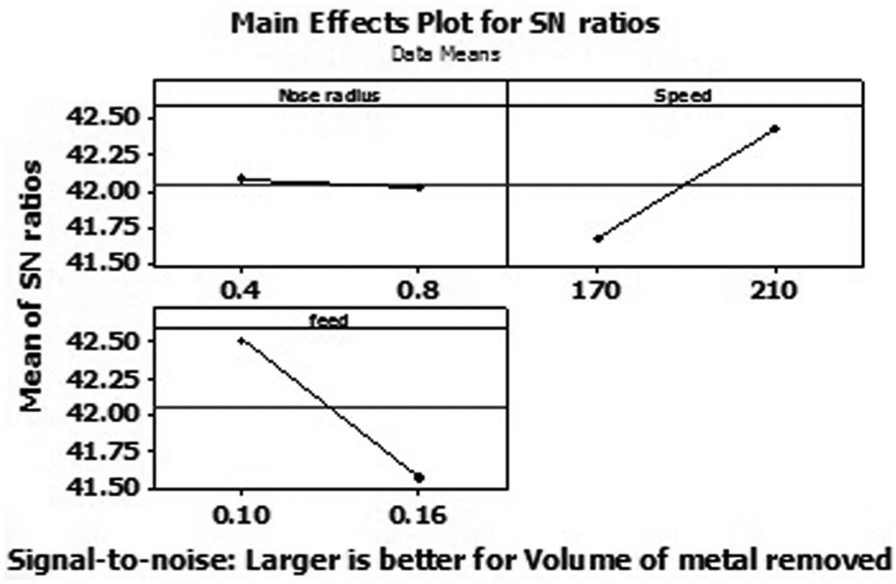
Main effects of plot for S/N ratios for volume of metal removed.
Regression analysis
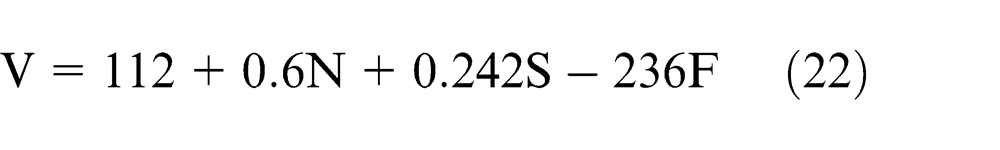
Multiple regression predictive equations were generated for workpiece vibration, surface roughness and volume of metal removed based on the control factor as
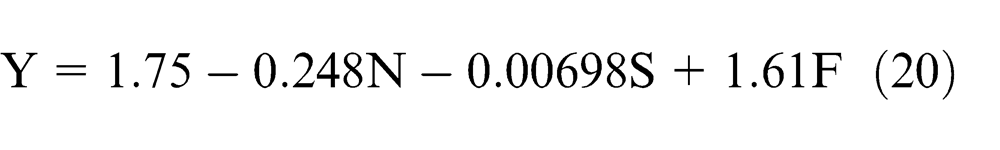
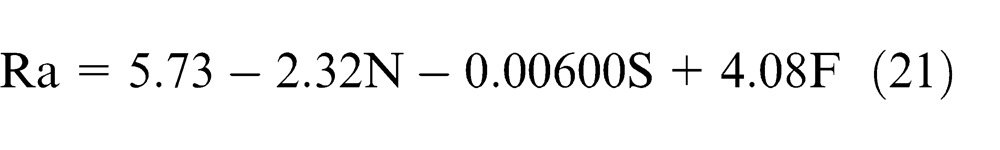
The regression analysis determined that the spindle cutting speed has more effect on the surface roughness (0.02 of p value), nose radius has more effect on the surface roughness (0.001 of p value) and feed rate has more effect on the surface roughness (0.346 of p value) at confidence level of 95%.
Conclusion
In this work, experiments were conducted on lathe using two cutting tool inserts with nose radii of 0.8 and 0.4 mm for boring of AISI 316 steel. According to selected orthogonal array, eight experiments (trials) were conducted with two levels of cutting parameters such as workpiece cutting speed, tool insert nose radius and feed rate. In each trial of experiment, a strong correlation among the dependent and independent variables was found. In this work, a noncontact monitoring system was used with LDV to observe vibration of workpiece during machining. Tool life was evaluated by analyzing surface roughness, amplitude of workpiece vibration and metal removal rate with the help of Taguchi, ANOVA and regression analysis. The following points can be concluded from this work:
Setup of LDV is simple, and it is easy to measure vibration of workpiece. So, this study could impart a better technique for vibration measurement in different materials from industry and academic perspectives.
Cutting speed is found as a significant parameter with contribution of 77.72% on the amplitude of vibration.
In the analysis of surface roughness, it was found that nose radius shows more contribution of 86.43%.
In the analysis of volume of metal removal, it was found that feed rate and cutting speed have significant contribution of 32.47% and 22.7%, respectively.
It was found that the workpiece cutting speed of 210 m/min and feed rate of 0.1 mm are optimum for good tool life.
Same cutting parameter was found as significant in all the three methods considered under study.
Footnotes
Declaration of conflicting interest
The authors declare that there is no conflict of interest.
Funding
This research received no specific grant from any funding agency in the public, commercial or not-for-profit sectors.