
Abstract
In modern manufacturing system, tool condition is one of the important factors which affects the machining under various cutting conditions, and the tool has to be replaced when it was worn out. The objective of this work is to estimate the effect of various input cutting parameters on tool life in boring of steel (AISI 1040) by finding the roughness on machined surface and amplitude of workpiece vibration. The input parameters used are cutting speed, feed rate and tool nose radius. According to design of experiments, 18 experiments were conducted on computer numerical control lathe by changing cutting parameters. Most of the researchers have used accelerometers to measure vibration of cutting tool in machining process. In this work, a new attempt was made with laser Doppler vibrometer for online data acquisition of workpiece vibration, and a high-speed fast Fourier transform analyzer was used to process the acousto-optic emission signals obtained from laser Doppler vibrometer. It was found that it is easy to measure vibration of workpiece in less time with laser Doppler vibrometer. The data were analyzed with Taguchi and analysis of variance for a significant parameter. Contribution of individual cutting parameters on surface roughness and amplitude of workpiece vibration is calculated with the analysis of variance.
Introduction
Tooling cost is the one of the important factors which affects the manufacturing cost, and it has to be reduced in order to reduce the manufacturing cost. Tool failure can be identified by observing higher power consumption, poor surface finish, dimensional inaccuracy, appearance of a burnishing band on machined surface, tool vibrations or workpiece vibration and so on. Moetakef-Imani and Yussefin 1 described that tooling cost can be reduced by choosing proper tool material, tool geometry, speed, feed, depth of cut, cutting fluids and coated cutting tool inserts. In boring of steels, vibration of tool and workpiece is the important limiting factor for good metal removal rate and machining efficiency. Sharma et al. 2 stated that highest importance is given to automation in manufacturing to reduce production cost. They made an experimental investigation on tool wear with the help of adaptive neuro fuzzy inference system. Acoustic emission, vibrations and cutting forces, along with time, have been used to formulate a model to predict tool wear. The model gave good agreement between actual and predicted values. Korkut and Kucuk 3 mentioned that the long boring bars are subjected to vibrations, and it results in tool failure and poor surface finish and may also introduce chatter, and they identified that best length-to-diameter (L/D) ratio for less vibration in boring process is 3. The L/D ratio in this study was taken as 3.
Many researchers proposed different models to predict surface quality in order to get good surface finish. Most of them concluded that it is important to select suitable cutting parameters for good surface quality. Abouelatta and Mádl 4 developed mathematical model using cutting parameters and machine tool vibrations to predict surface roughness. They used a fast Fourier transform (FFT) analyzer to measure tool vibrations. Chen and Chang 5 used cutting force and the vibration signal of a computer numerical control (CNC) turning machine for online tool wear monitoring. The cutting force and vibrations are taken as inputs to a fusion neural network to predict tool wear. They found that the input data are feasible for tool condition monitoring. Brezocnik et al. 6 used genetic programming to study the effects of spindle speed, feed rate, depth of cut and vibrations to predict surface roughness in end milling. They reported that feed rate and vibrations are significant factors that have an effect on surface roughness. Rizal et al. 7 reported that the tool wear affects product quality, and an accurate prediction of tool life improves good quality and product quality and reduces inspection cost.
According to Kuo, 8 the tool wear can be sensed by using two methods such as direct and indirect sensing methods. Most of the researchers used force, spindle motor torque, current or power, acoustic emission signals or a combination of these signals for tool condition monitoring. But they are suitable for machining in the roughing range. Wong et al. 9 used laser scatter pattern for tool condition monitoring in the roughing to near-finishing range. They obtained scatter pattern with low-power laser beam; it was captured with digital camera and analyzed with an image processing techniques.
Most of the researchers have used accelerometers to measure vibration of cutting tool in machining process. In recent applications, laser Doppler vibrometers (LDVs) are used as non-contact methods to measure vibration of cutting tool or workpiece accurately. The LDV is capable of giving reliable information of tool vibration. Yeh and Cummins 10 developed laser Doppler velocimetry as the process involves measuring the Doppler shift of the laser radiation that is scattered by the moving particles. After that, the technique was devolved as LDV. In conventional testing, accelerometers were used to measure vibrations of objects or to sense natural frequencies, damping and mode shapes of the structure under test. Sriram et al. 11 discussed use of LDVs in the field of lightweight structures. Frequency domain of LDV output signal is scanned to obtain deflection shape of the vibrating structure. In this work, a new attempt was made with LDV for online data acquisition of workpiece vibration, and a high-speed FFT analyzer was used to process the acousto-optic emission (AOE) signals obtained from LDV.
Vibrations occur due to relative motion between workpiece and cutting tool. Sevilla et al. 12 measured vibration of tool with accelerometer at different tool failure levels, spindle speeds, feed rates and workpiece mountings in milling. The vibration signals were processed with continuous wavelet transform methodology. They found that a damaged tool generates additional non-linear and transient frequencies at non-synchronous frequencies. This information was used for better tool condition monitoring. Rantatalo et al. 13 used the LDV to measure vibrations of rotating spindle or arbor in milling machine. Ngoi and Venkatakrishnan 14 presented a novel technique to measure vibration of objects with an acousto-optic modulator. The technique is an improved approach to measure vibrations of machine bed in the sub-nanometer range. Venkatarao et al. 15 and Prasad et al.16,17 used LDVs to monitor machined surface topography of the workpiece. They used LDV for online tool condition monitoring and vision-based system for surface textural analysis. They found high degree of correlation between the results of the AOE signal- and vision-based surface textural analyses.
Dimla and Lister 18 stated that the vibrations during the machining can be minimized or avoided by carefully controlling cutting parameters. Prasad et al. 16 used LDV to identify vibration of tool in milling process, and they used a FFT preprocessor for generating features from an online AOE signals to develop a database for appropriate decisions. The AOE signals can be transformed into time domain with different frequency zones by the FFT. This AOE technique is being used in tool condition monitoring. Surface roughness and tool wear are strongly affected by the vibration amplitude and frequency. In this study, LDV was used to measure amplitude of workpiece vibration, and a high-speed FFT analyzer was used to process the AOE for workpiece vibration.
Errors in machining, such as wrong selection of cutting parameters, will affect dimensional accuracy and surface quality. Chun and Ko 19 studied the effects of tool deflection of cutting tool, tool wear and depth of cut, and thermal effects and machine tool errors. They found that deflection of tool and depth of cut are significant parameters affecting the surface quality and dimensional accuracy. This work identifies significant cutting parameters causing high surface roughness and amplitude of workpiece vibration.
In machining operation, the quality of surface finish is an important requirement for many turned workpieces. Thus, the choice of optimized cutting parameters becomes very important to control the required surface quality. The variation in the hardness of material and case depth are the other parameters affecting surface finish and tool wear. According to Prasad et al., 16 the surface roughness parameters (Ra) and corresponding flank wear (VB) can be derived from experimental data by using the following relations
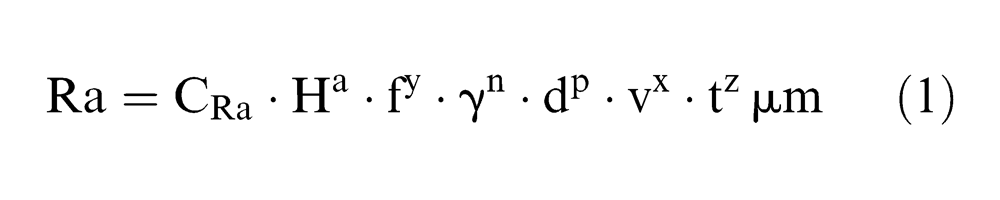
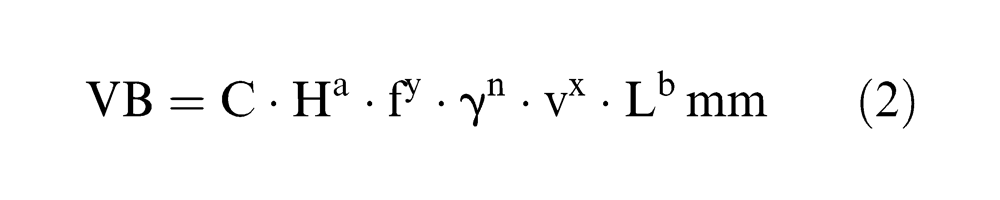
The face turning tests are continued till tool wear reaches the limiting criterion of flank wear of 0.3 mm. Where v is the cutting speed (m/min), t is the machining time (min), L is the length of the cut (mm) and n, x, y, a, b, p and z are exponents.
Methodology
Taguchi and analysis of variance (ANOVA) methods are used to analyze the experimental data to find out the effects and contribution of cutting parameters.
Taguchi
Lin et al. 20 used Taguchi methods in the unconventional machining process to find out significant factor. Nowadays, the Taguchi method is being widely used in all the applications, and it is a powerful tool to analyze the cutting parameters. A specially designed orthogonal array of Taguchi is used to investigate the effects of the entire machining parameters through the small number of experiments, and it takes less time for the experimental investigations.
Signal-to-noise ratio characteristics
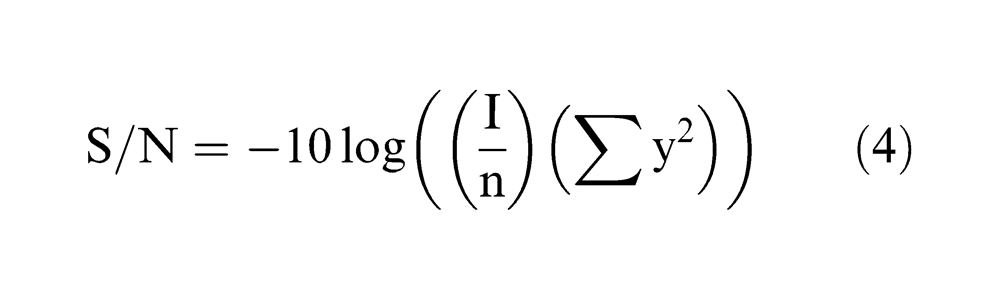
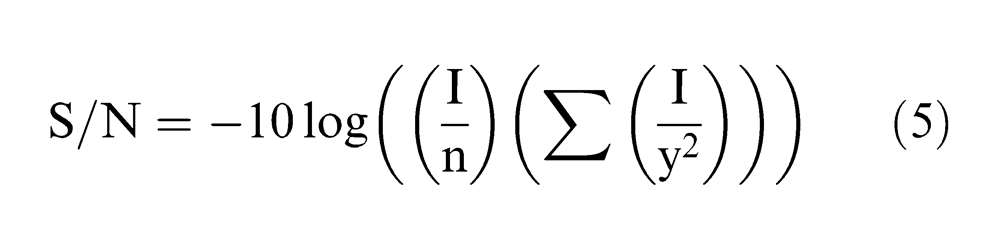
The Taguchi method uses signal-to-noise (S/N) ratio to measure the variations in the experimental design. The word signal indicates the desirable value and the word noise indicates the undesirable value. Sivasakthivel et al. 21 used Taguchi method–based gray relational analysis to optimize cutting parameters in order to reduce vibration amplitude in end-milling process. Yang and Tarng 22 used the Taguchi method for optimization of cutting parameters in turning. The formulae for S/N ratio are designed such that the experimentalist can always select the larger factor-level settings to optimize the quality characteristics of an experiment. Then, the selection of calculating the S/N ratio depends on the characteristics of smaller-the-best, larger-the-better or normal-the-better formulation chosen.
S/N ratios for different categories are given as follows:
Normal-the-best

Smaller-the-best
Larger-the-best
where
Selection of cutting parameters
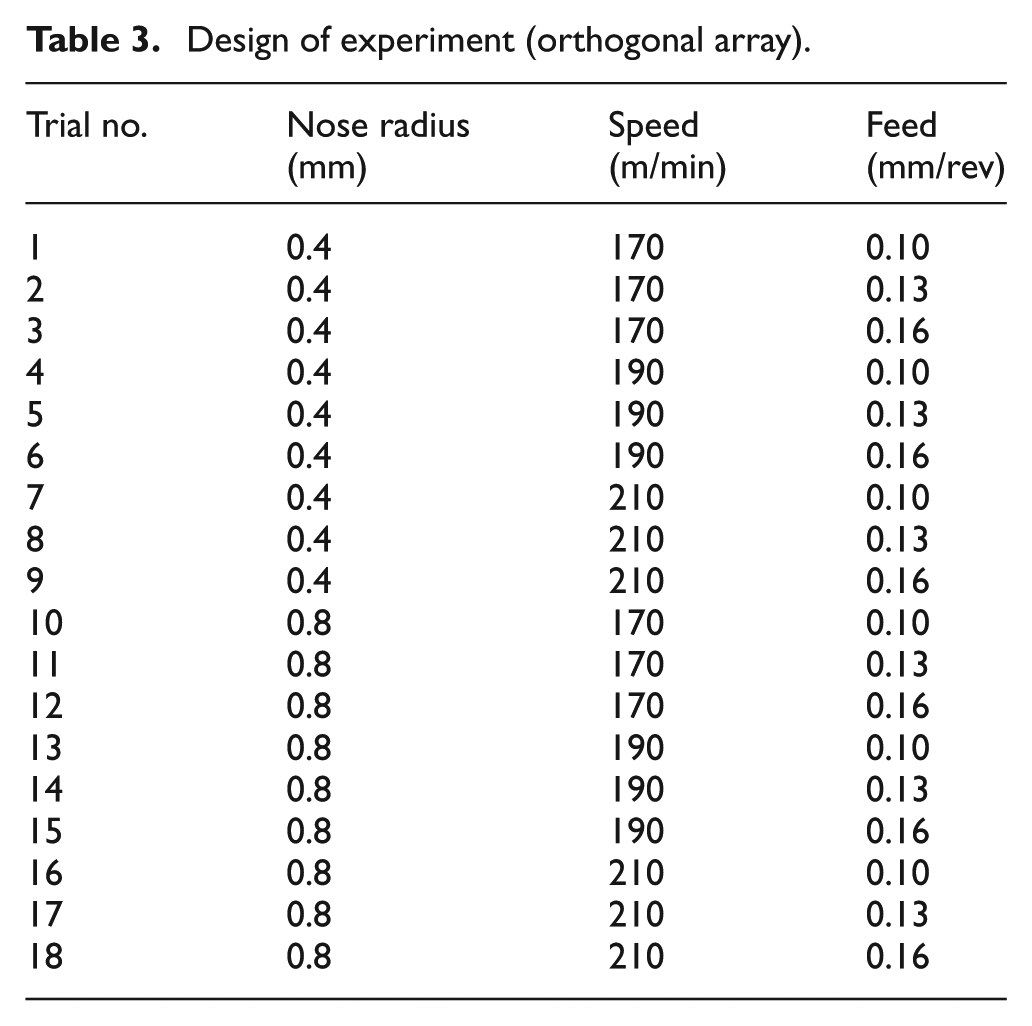
Nalbant et al. 23 also used Taguchi technique to find out the significant cutting parameter to minimize the surface roughness in turning of steels. In this work, the cutting parameters nose radius, rotational cutting speed and feed rate were selected as control factors with two levels of nose radius and three levels of cutting speed and feed rate. An appropriate orthogonal array of L18 was selected to determine the optimal cutting parameters and analyze the effects of these parameters. The cutting parameters were assigned to each column and 18 combinations of parameters were derived as shown in Table 3.
ANOVA
In this study, ANOVA was used to analyze the effects of cutting speed, nose radius and feed rate on tool life by analyzing the surface roughness and amplitude of workpiece vibration. The performed experimental plan was evaluated at a confidence level of 95%. Gopalsamy et al. 24 used this method along with Taguchi in optimization of cutting parameters in machining of hardened steel.
Tool life criteria
A sharp cutting tool is expected to give more cutting ability for long time in an effective and smooth manner. Two types of wears occur on cutting tools due to loss of material in metal cutting. Wear on the face and flank is called crater wear and flank wear, respectively. The flank wear is also called wear land, which affects the tool life and its cutting ability. According to International Organization for Standardization (ISO 3685:1993), tool life criteria are considered only with the leading edge groove. If the profile is uniform, the tool can be used unless the average value VB is greater than 0.3 mm. For uneven wear, the maximum wear land width (VBmax) should be less than 0.6 mm.
Workpiece material and tool inserts
Chemical composition of AISI 1040 steel is shown in Table 1; it has a higher (0.41%) carbon content for greater strength than the lower carbon alloys. It is hardened by heat treatment, quench and tempering to develop tensile strength. It can be used for manufacturing of crankshafts, couplings and cold headed parts. The machinability of this steel is rated at 65% with respect to the AISI 1112 alloy used as 100% machining rated steel. The workpieces used in the experiment are shown in Figure 1.
Chemical composition of AISI 1040.
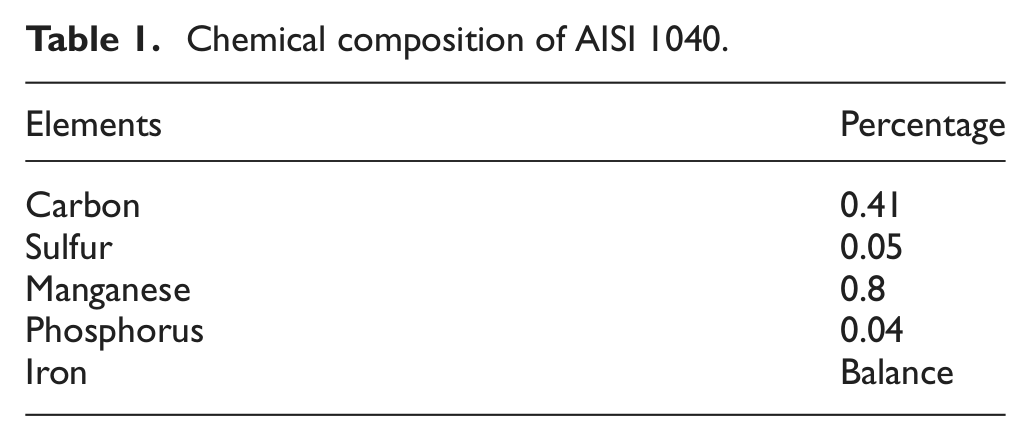
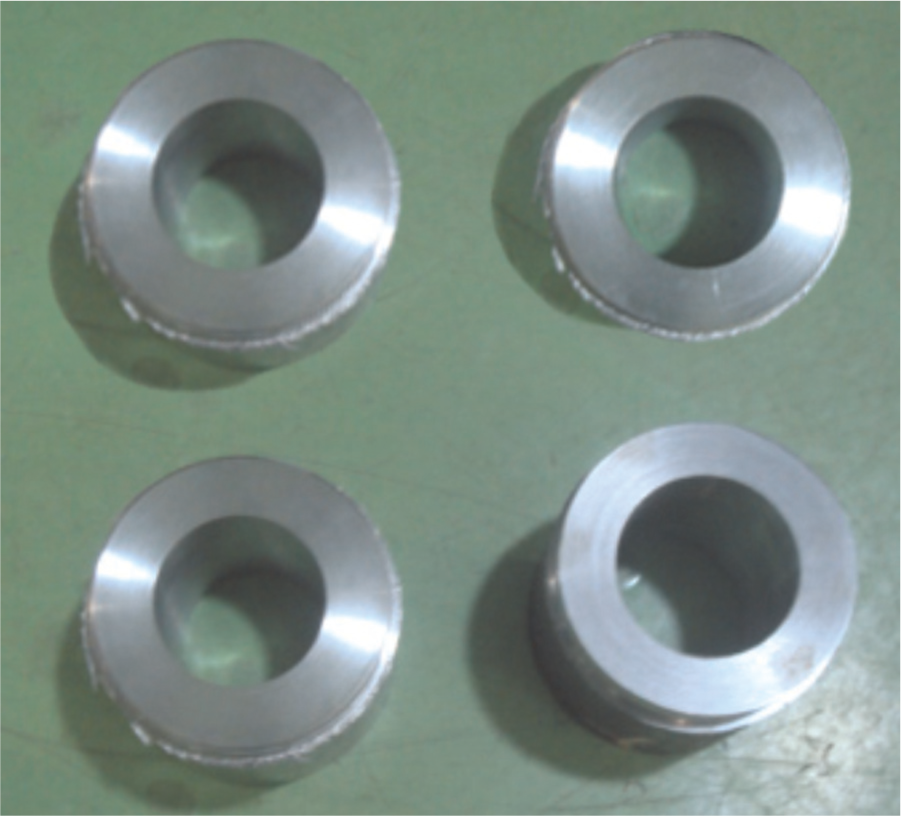
Workpieces.
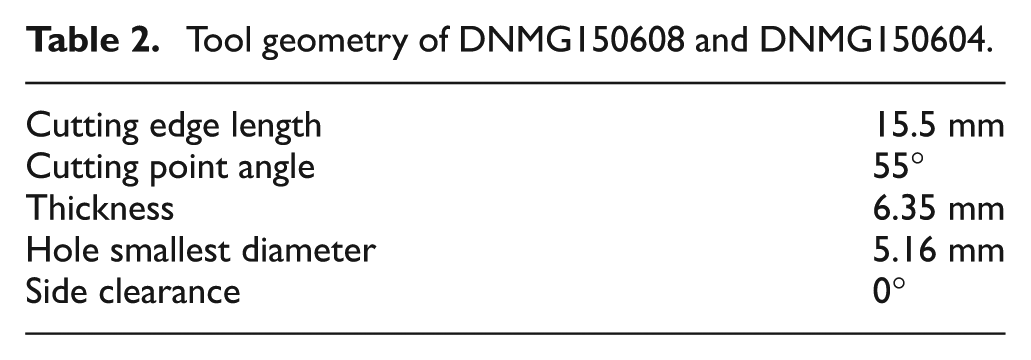
Physical vapor deposition (PVD) coated tungsten carbide tool inserts were used in this experiment with two nose radii of 0.8 mm (DNMG150608) and 0.4 mm (DNMG150604). The insert geometry is shown in Table 2 and Figure 2.
Tool geometry of DNMG150608 and DNMG150604.
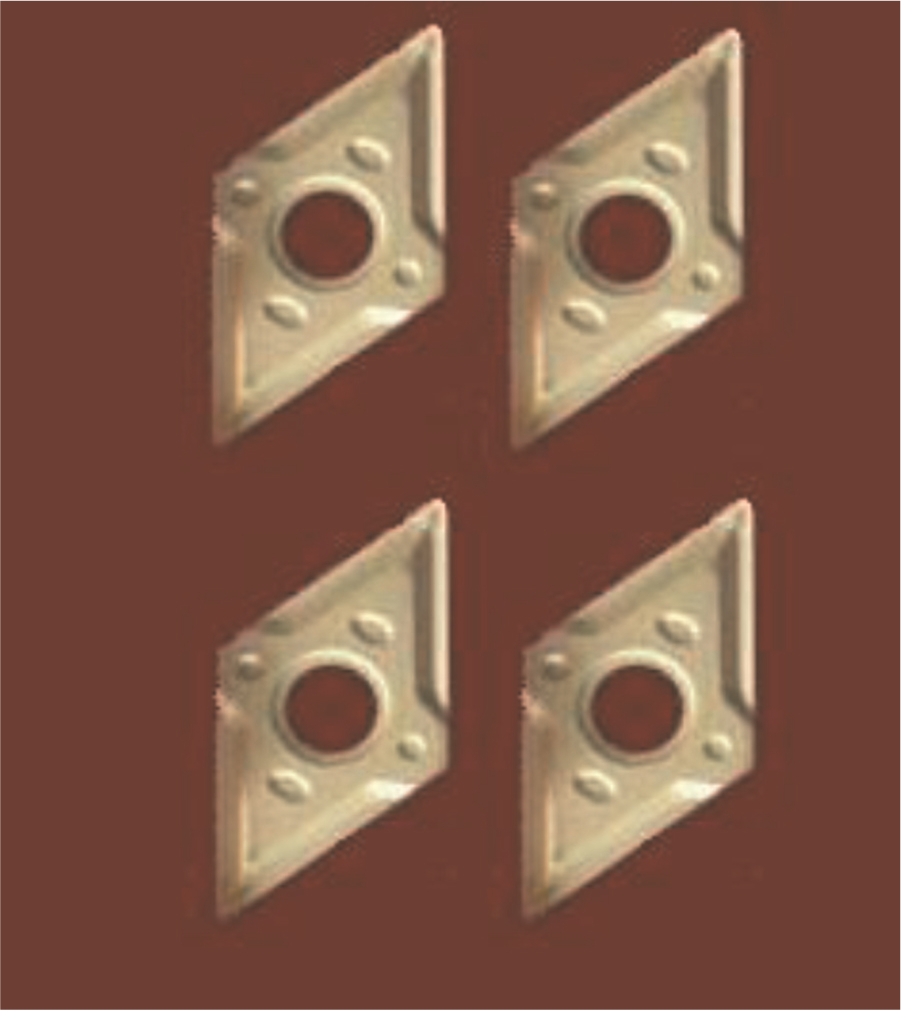
Tool inserts.
Experimental procedure
The experiment was conducted on CNC lathe DX200 model. The metal used in this experiment is AISI 1040 with length of 90 mm, outer diameter of 100 mm and inner diameter of 56 mm.
The following sequential procedure was used to carry out the experiment under dry condition.
Each test is started with a fresh cutting edge with one test condition (trial), and machining is stopped at the end of each pass. After each pass, the depth of cut is increased by 0.2 mm (fixed depth of cut was given in each pass) until the tool failed.
Vibration signals from the rotating workpiece are measured in the machining process using LDV, and the setup of the experiment is shown in Figure 3(a) and (b). Time and frequency domain spectrograph at the first pass is shown in Figure 4. The frequency domain spectrograph is obtained with FFT analyzer using MATLAB.
After each pass, the workpiece was removed and its surface roughness is measured on Talysurf (Figure 5).
In each trail, three passes are made. Surface roughness and amplitude of vibration are measured in each pass and are given in Table 4.
A new workpiece and new tool insert are loaded to the machine, and the above steps are followed with a new working condition (trial).
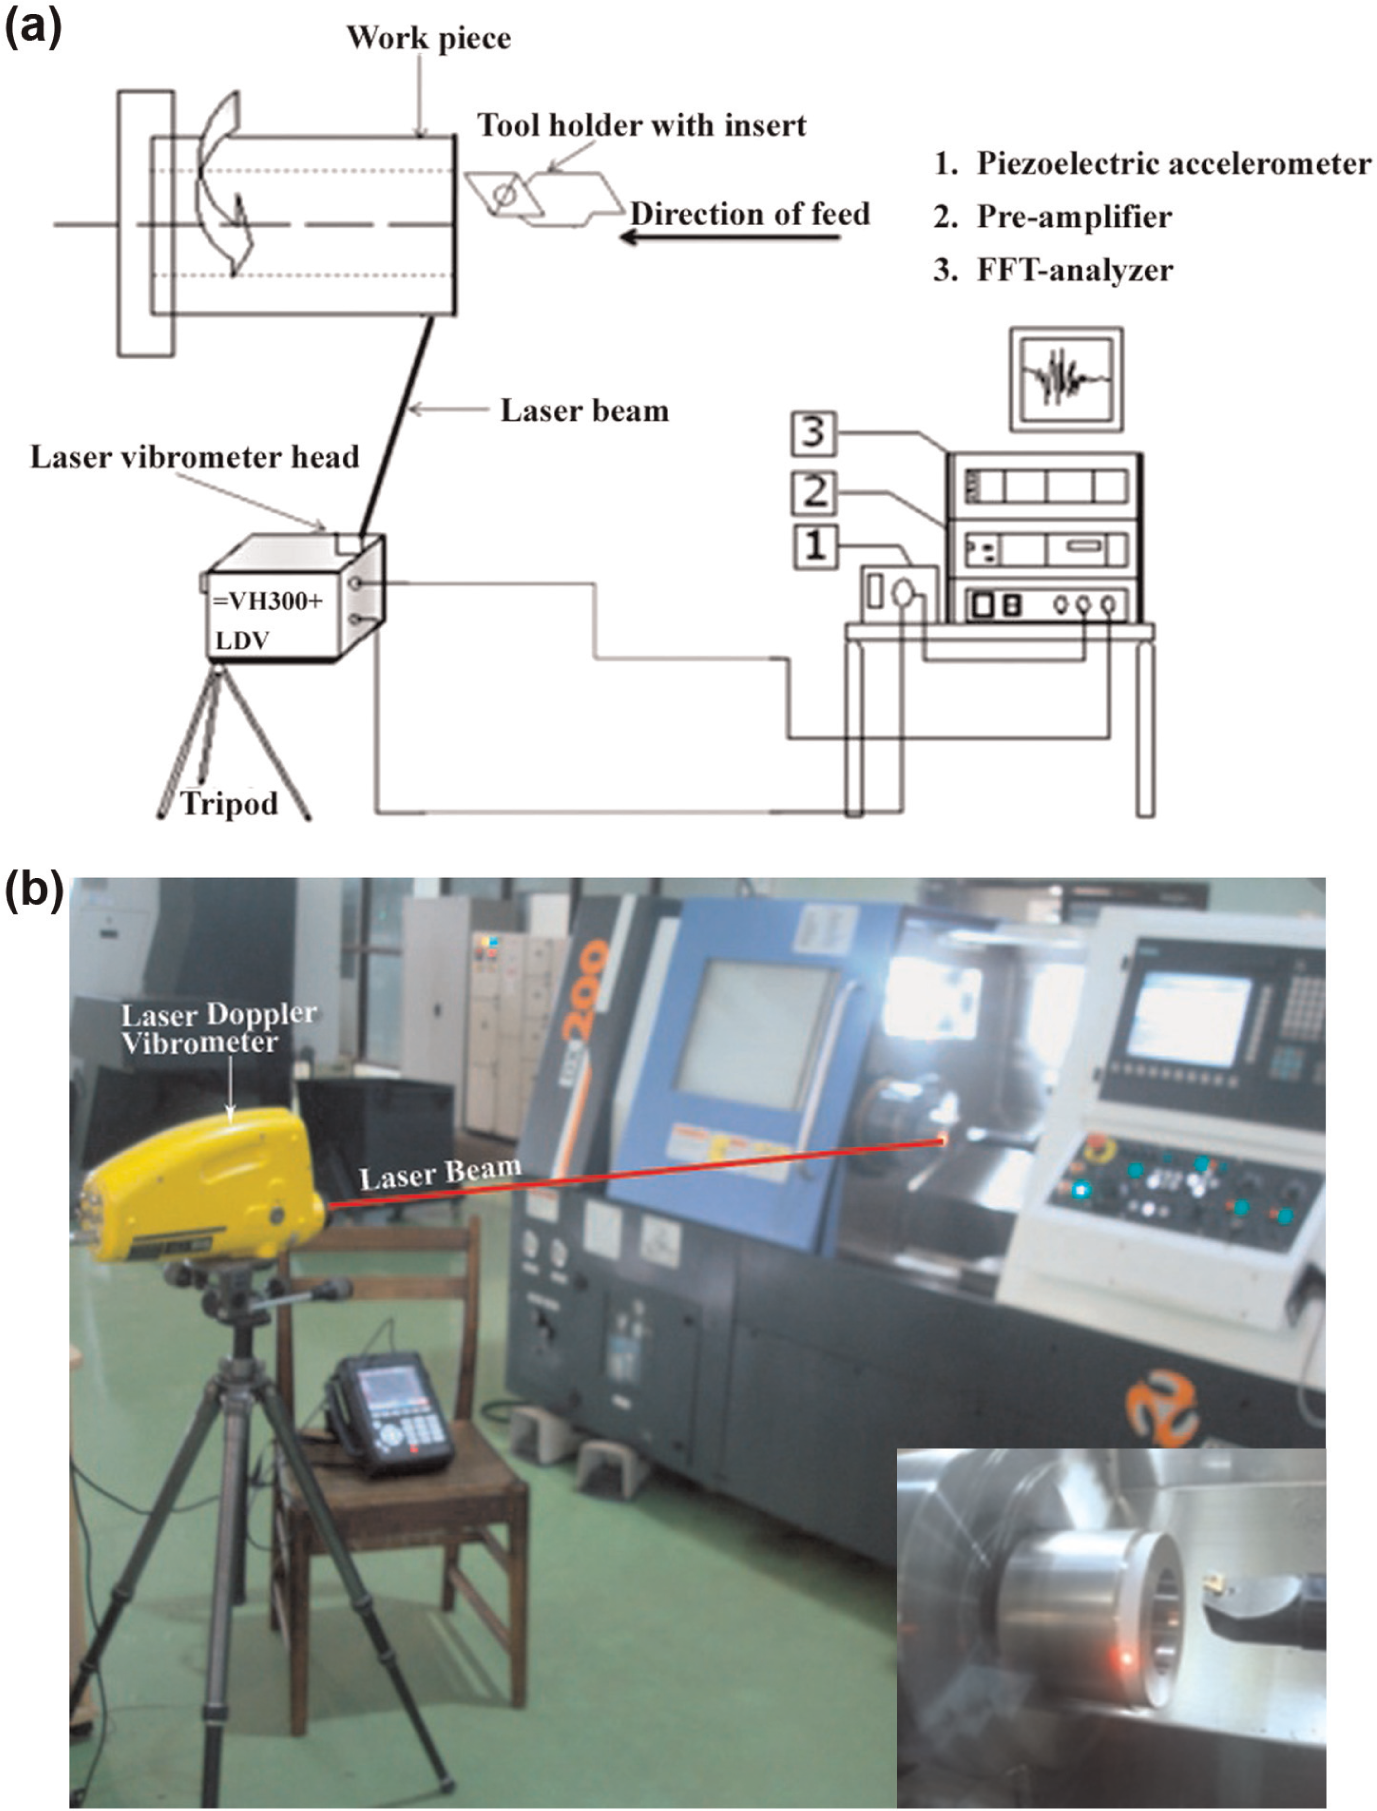
(a) Schematic diagram for setup and (b) experimental setup for boring.
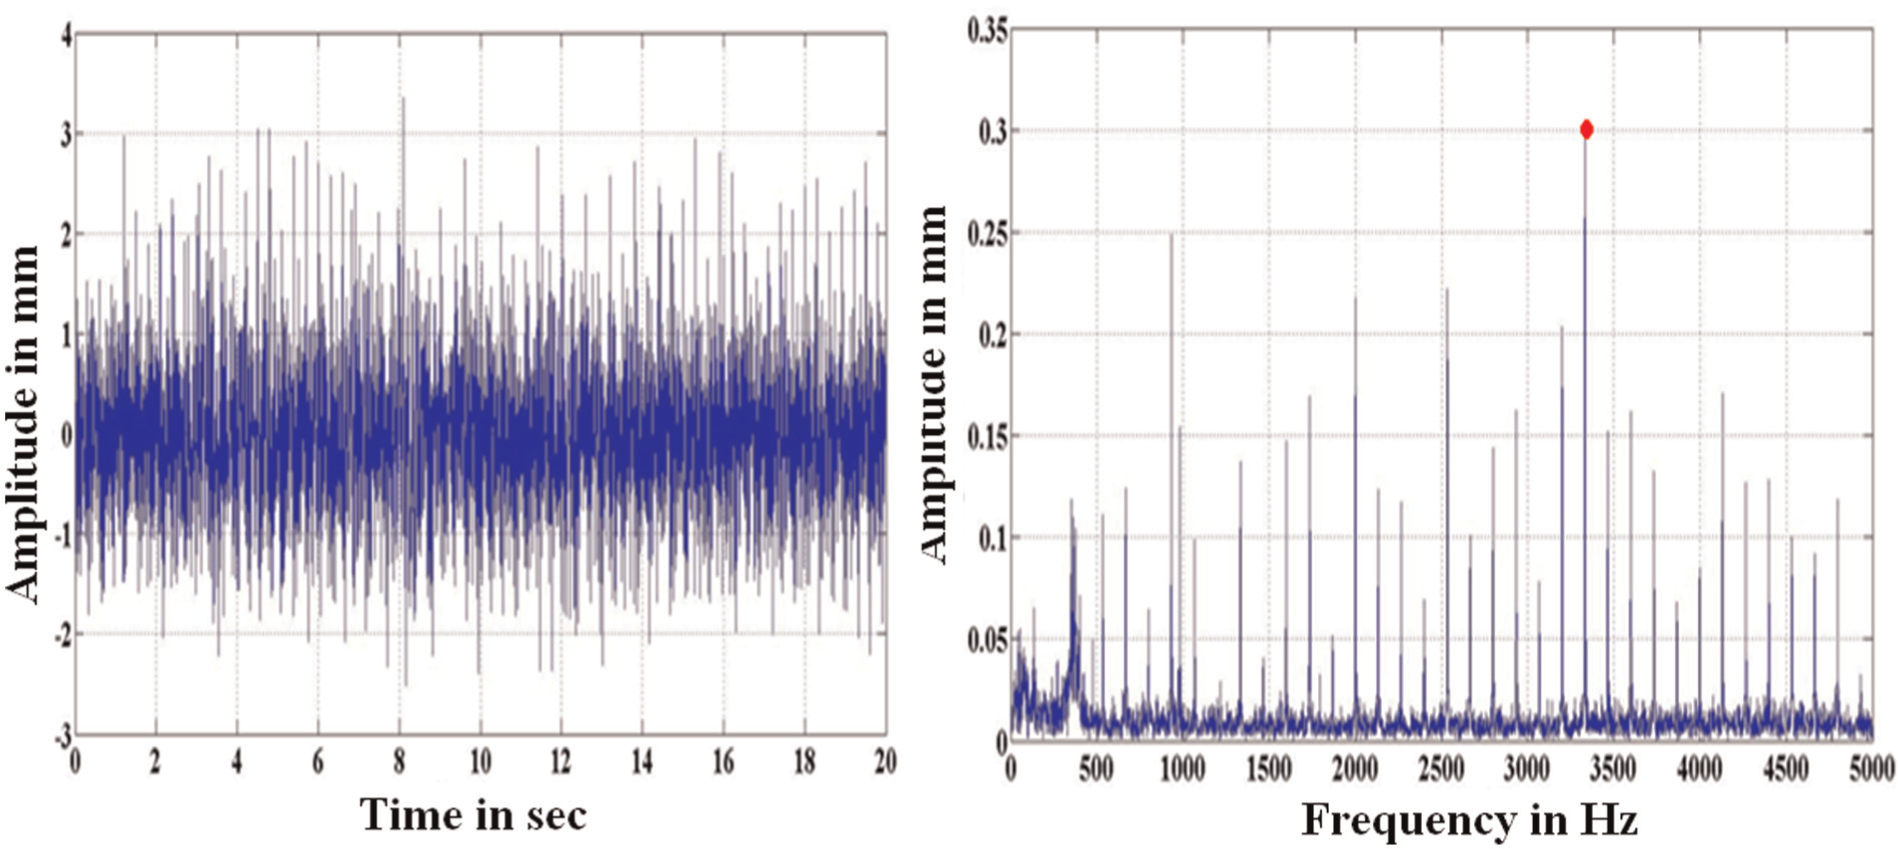
Time and frequency domain spectrograph in boring in the first pass.
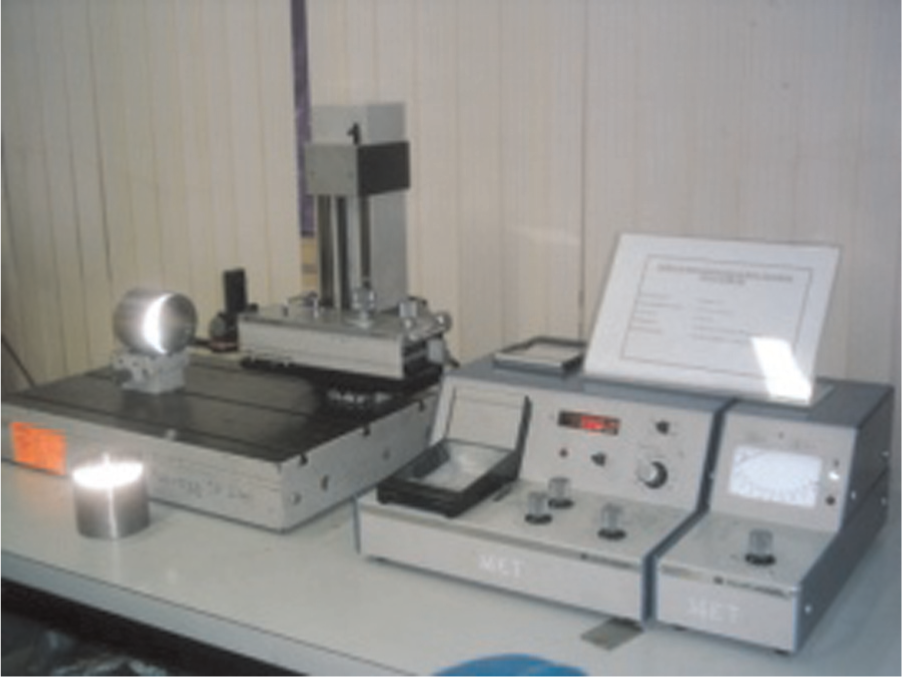
Talysurf.
The above procedure is followed for all the trials, and in each trial, the cutting parameters are changed as per design of experiments shown in Table 3.
Design of experiment (orthogonal array).
Results and discussion
The cutting parameters, nose radius with two levels, cutting speed and feed rate with three levels, were used in the experiment for a prepared design of experiment. The cutting parameters were assigned to each column and 18 combinations of parameters were given as shown in Table 3. S/N ratios were calculated with Taguchi method for surface roughness (Ra) and amplitude of workpiece vibration. The tool life is evaluated by analyzing the surface roughness and amplitude of workpiece vibration using Taguchi and ANOVA.
Analysis of surface roughness for tool life
Surface roughness on a machined component is the replica of tool life, and the surface roughness is one of the customer requirements. The surface roughness is influenced by different cutting parameters. In this study, effect of cutting speed, feed rate and nose radius on the surface roughness is studied. The surface roughness is analyzed with Taguchi S/N ratio and ANOVA.
Taguchi
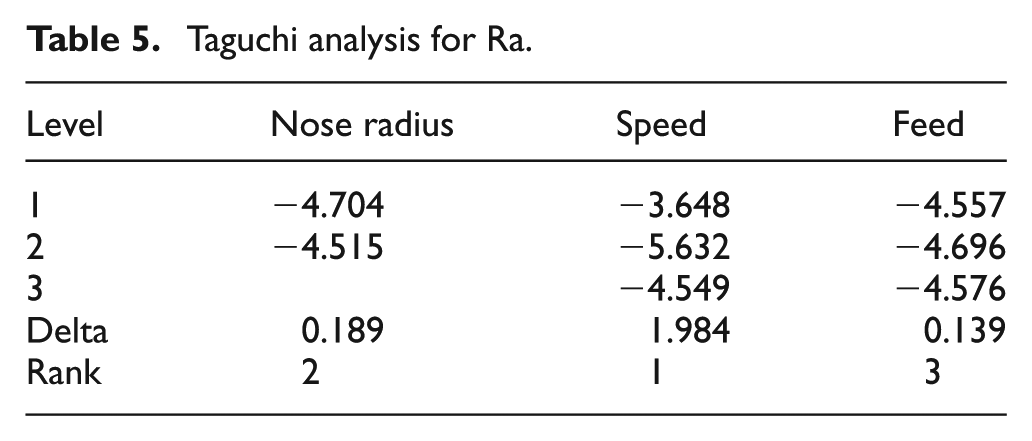
Measured values of roughness for all the trials are given in Table 4 and its mean value is calculated. S/N ratios are measured with “smaller-the-better” characteristic for all the trials. The Taguchi analyzed the data for a cutting parameter which has more effect on the roughness. Taguchi results show that the cutting speed has more influence on the surface roughness and shown with rank 1 in Table 5.
Experimental results and S/N ratio for surface roughness.
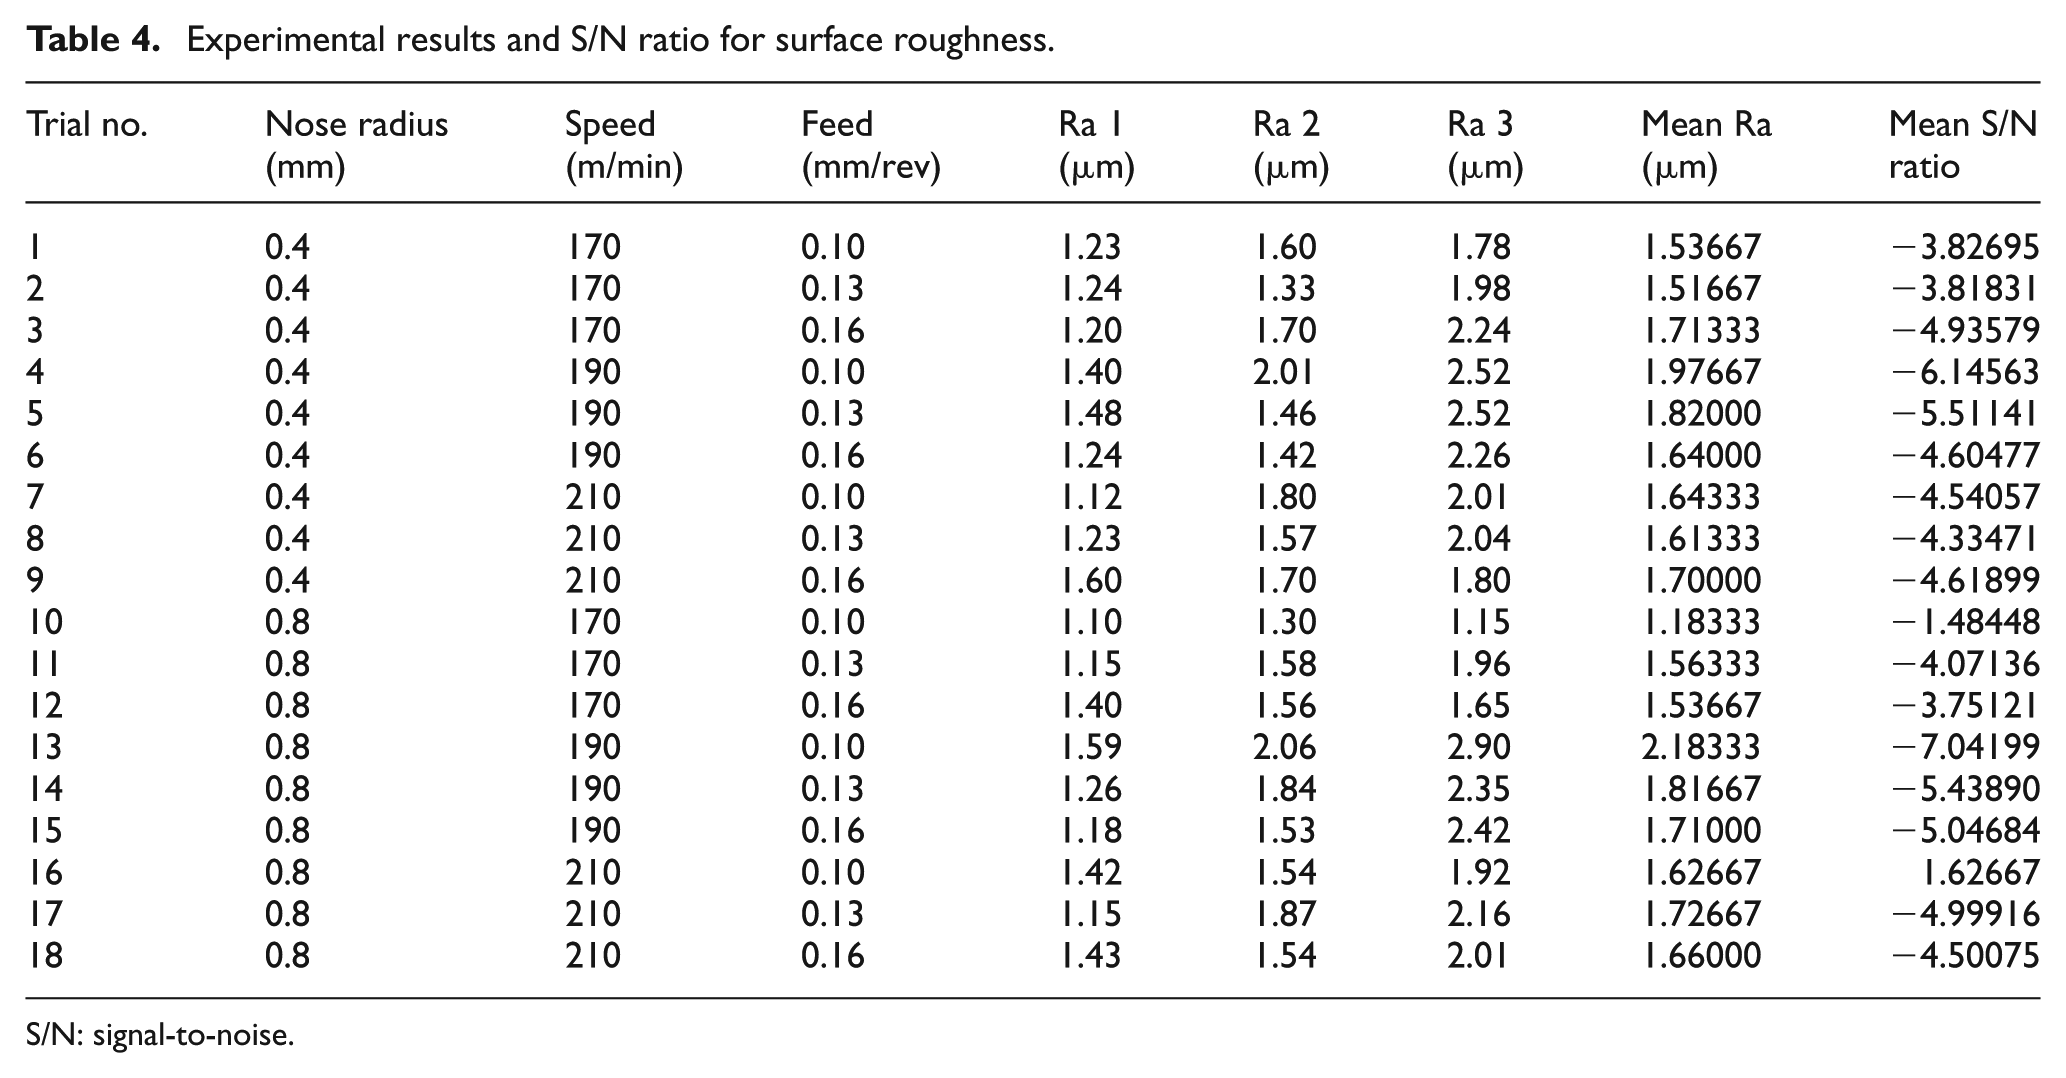
S/N: signal-to-noise.
Taguchi analysis for Ra.
ANOVA
In the ANOVA, at a confidence level of 95%, the experimental results and the Taguchi S/N ratios were evaluated as shown in Table 6. ANOVA also determined the contribution of individual cutting parameters on the surface roughness. The individual cutting parameters which have p value less than 0.05 are significant. According to the ANOVA for S/N ratio of surface roughness, the cutting speed is having p value of 0.10, and its contribution on the tool life or surface roughness is calculated as 57.2%.
Analysis of variance for S/N ratio of Ra.
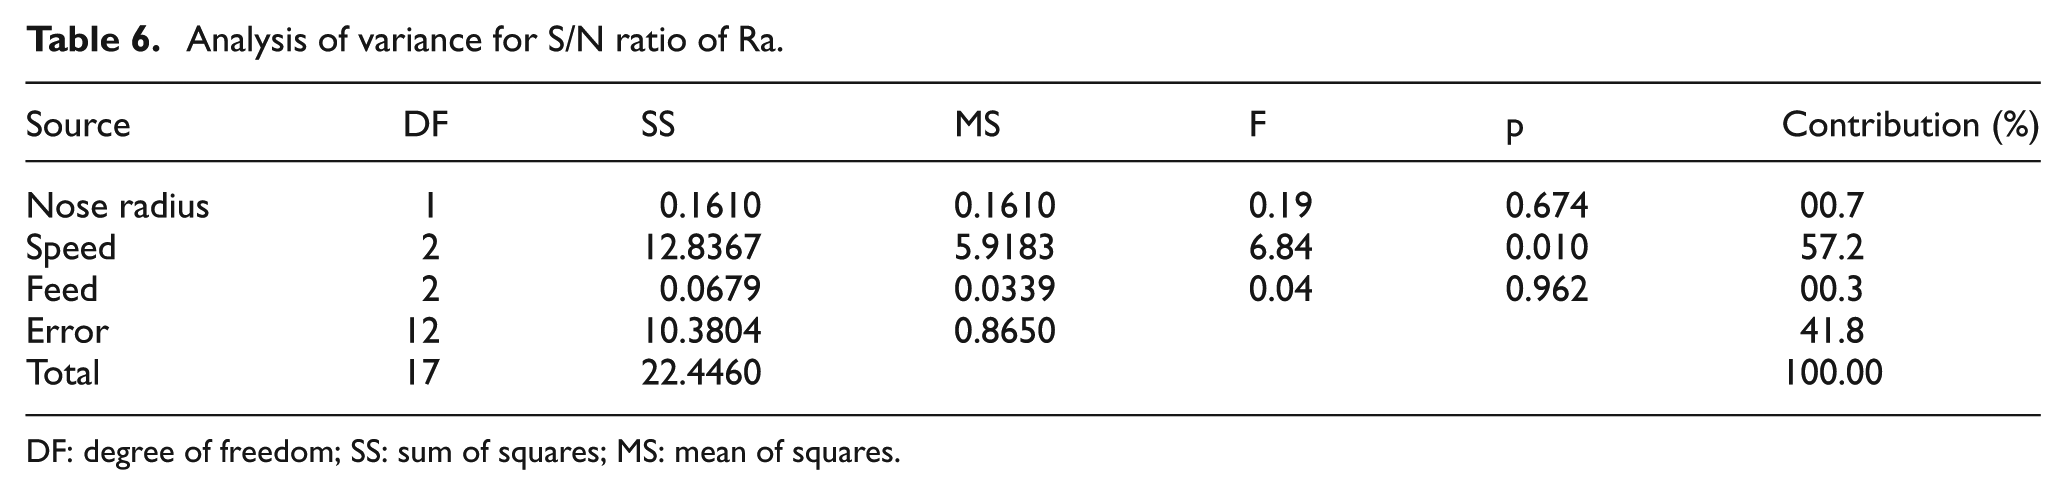
DF: degree of freedom; SS: sum of squares; MS: mean of squares.
The error in Table 6 was found as 41.8%. In fact, the error represents the interaction of cutting parameters on the surface roughness as shown in the Table 7. Interaction of cutting speed and feed is found as 22.60%.
Analysis of variance with interaction of cutting variables for S/N ratio of Ra.
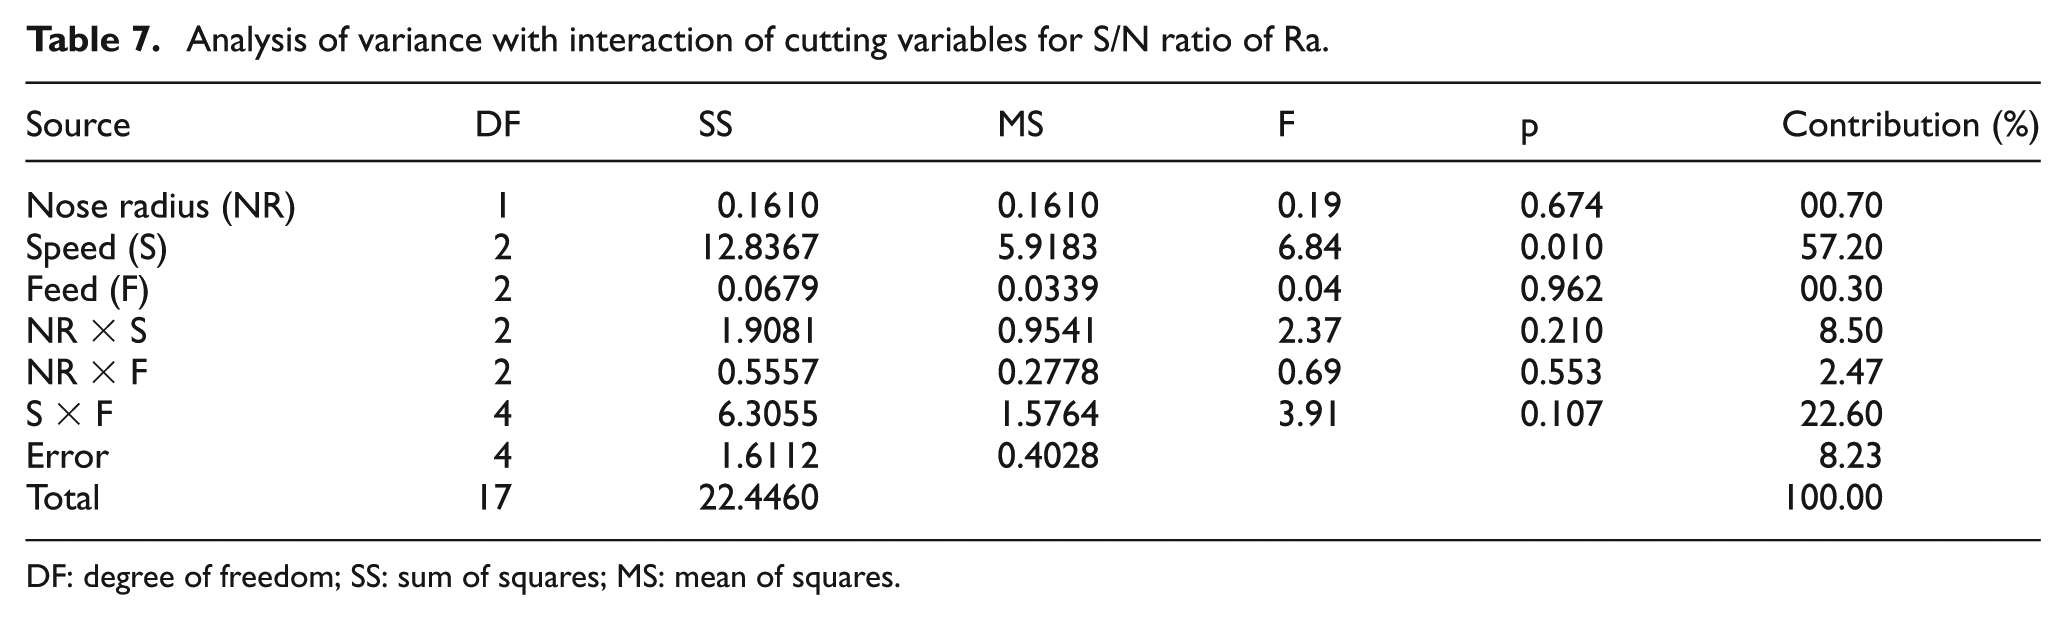
DF: degree of freedom; SS: sum of squares; MS: mean of squares.
Distribution of S/N ratios to the levels of cutting parameters is shown in Figure 6. From Figure 6, the optimum levels of cutting parameters are obtained as 0.8 mm of nose radius, 170 m/min of cutting speed and 0.10 mm/rev of feed rate.
Effect of cutting parameter levels on surface roughness.
Analysis of amplitude of workpiece vibration for tool life
In turning process, vibration of tool is denoted as self-excited chatter or tool vibration. Based on the driving force of the tool vibration, the tool vibrations are divided into regenerative chatter and non-regenerative chatter. In this work, an LDV was used to measure vibration of workpiece. A high-speed FFT analyzer was used to obtain amplitude of workpiece vibration from data measured with LDV. As shown in Figure 4, frequency domain is obtained with the help of FFT analyzer, and it gives the amplitude of workpiece vibration. Surface roughness and tool wear are strongly affected by the vibration amplitude and frequency. Improper tool geometry and the nose radius will produce more vibrations than the depth of cut.
Taguchi
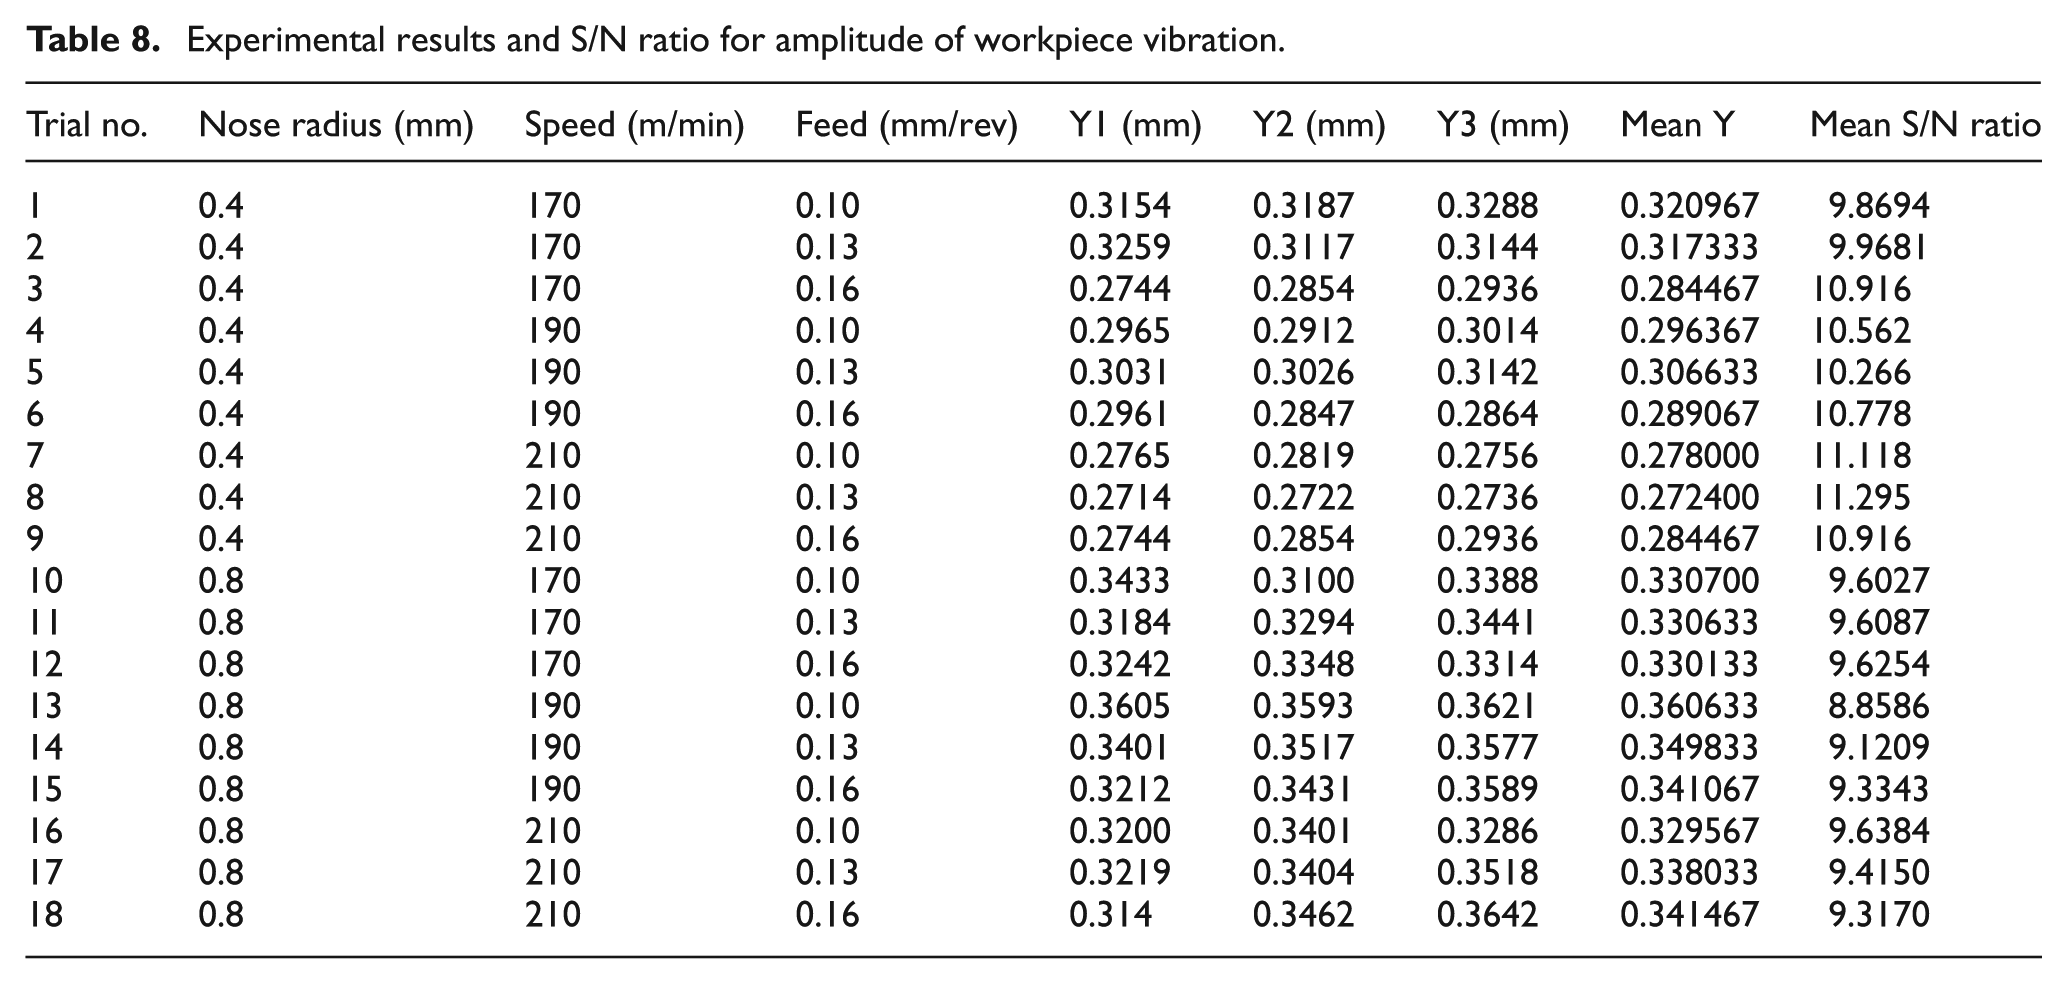
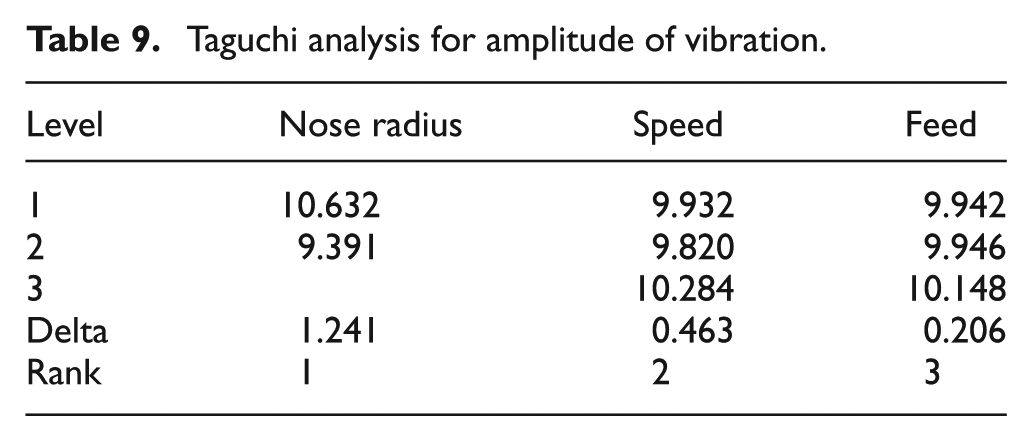
In this experiment, amplitude of workpiece vibration was measured with LDV. The amplitude values are given in Table 8, and the S/N ratio with “smaller-the-better” characteristic for all the trials was measured using Taguchi method. Taguchi results show that the nose radius has more influence on the tool life with rank 1 as shown in Table 9.
Experimental results and S/N ratio for amplitude of workpiece vibration.
Taguchi analysis for amplitude of vibration.
ANOVA
In the ANOVA, at a confidence level of 95%, the experimental results and the Taguchi S/N ratios were evaluated as shown in Table 10. ANOVA also determined the contribution of individual cutting parameters on vibration velocity. The individual cutting parameters which have p value less than 0.05 are significant. According to the ANOVA for S/N ratio of vibration amplitude, the nose radius is having a p value of 0.00, and its contribution on the tool life or workpiece vibration is calculated as 72.76%.
Analysis of variance for S/N ratio for amplitude of vibration.
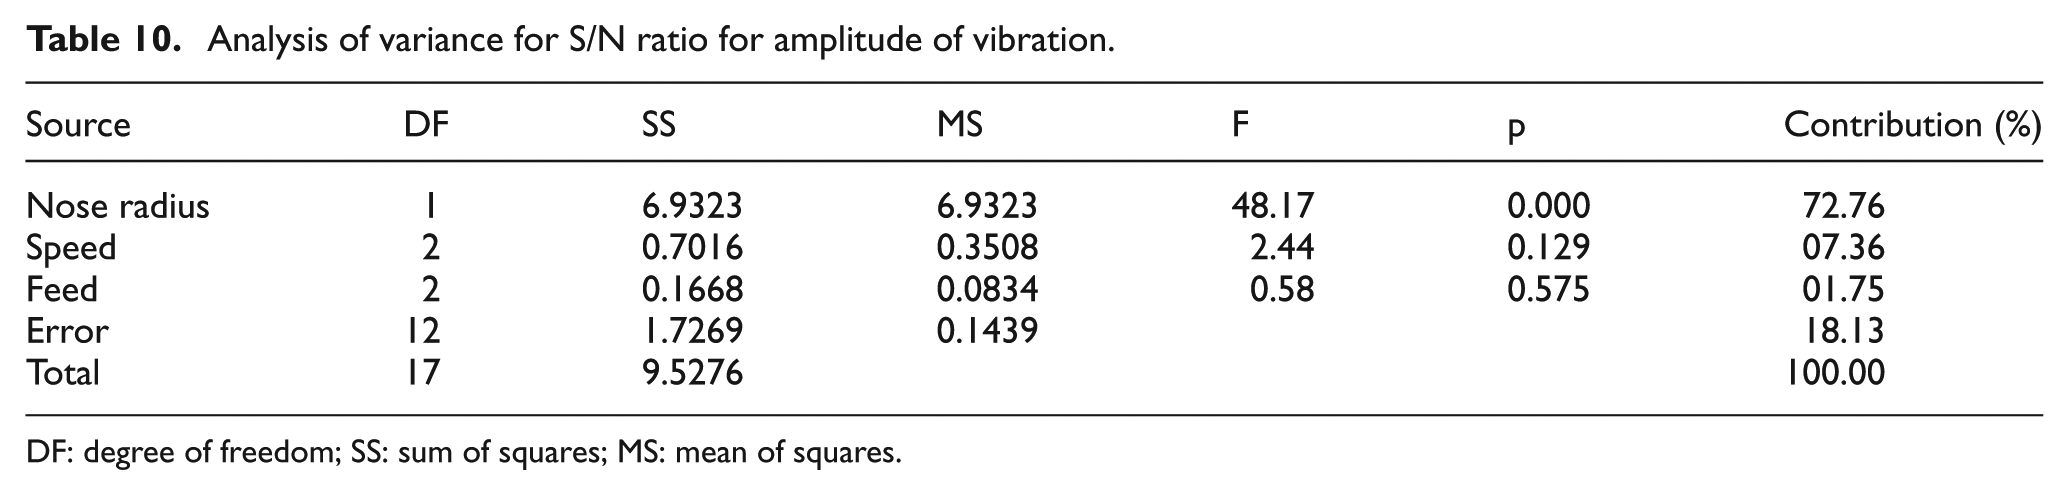
DF: degree of freedom; SS: sum of squares; MS: mean of squares.
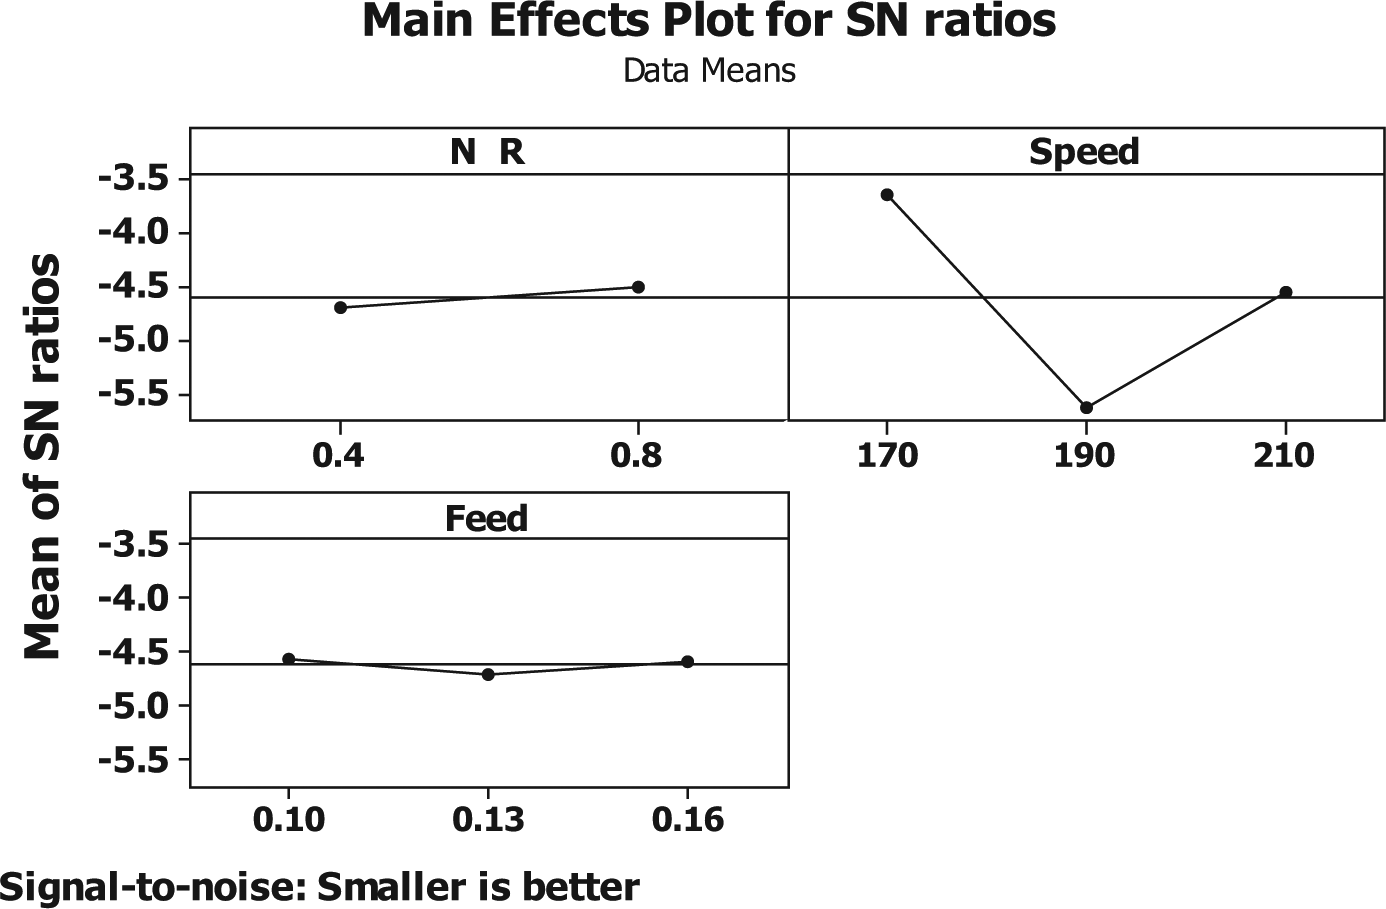
Distribution of S/N ratios to the levels of cutting parameters is shown in Figure 7. From Figure 7, the optimum levels of cutting parameters are obtained as 0.4 mm of nose radius, 210 m/min of cutting speed and 0.16 mm/rev of feed rate.
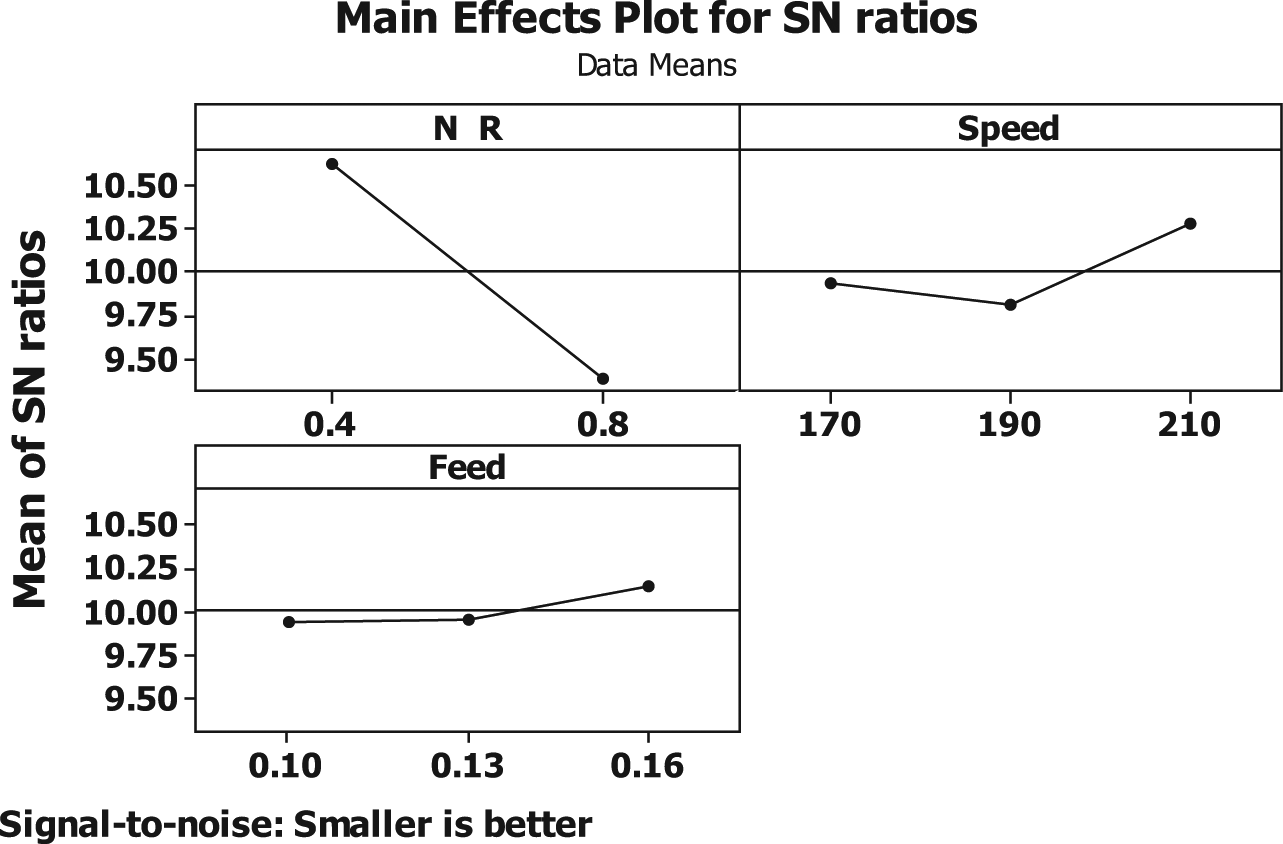
Effect of cutting parameter levels on workpiece vibration.
Conclusion
In this work, experiments were conducted on lathe using two cutting tool inserts with nose radii of 0.8 and 0.4 mm in boring of AISI 1040 steel. Tool life was evaluated by analyzing surface roughness and amplitude of workpiece vibration. The effect of cutting parameters such as cutting speed, tool insert nose radius and feed rate on the tool life was evaluated with the help of Taguchi and ANOVA methods. In total, 18 trials were conducted with a selected orthogonal array. In this work, a non-contact monitoring system was used with LDV to observe vibration of workpiece during machining. The following conclusions can be drawn from this study.
In the analysis of surface roughness, it was found that the cutting speed shows more contribution of 57.2%. It was also found that the interaction of cutting speed and feed has moderate effect of 22.60%.
In the analysis of amplitude of workpiece vibration, it was found that the nose radius shows more contribution of 72.76%.
In each trial of experiment, a strong correlation among the dependent and independent variables was found.
Use of LDV is simple and it takes less time to measure vibration of workpiece. Setup of LDV is simple when compared with setup of accelerometer. So, this study could impart a better technique for vibration measurement in different materials from industry perspective.
Footnotes
Declaration of conflicting interests
The authors declare that there is no conflict of interest.
Funding
This research received no specific grant from any funding agency in the public, commercial or not-for-profit sectors.